Article

High Levels of Genetic Variation in MHC-Linked Microsatellite Markers from Native Chicken Breeds

Division of Animal and Dairy Science, Chungnam National University, Daejeon 34134, Korea
*
Author to whom correspondence should be addressed.
Genes 2021, 12(2), 240; https://doi.org/10.3390/genes12020240
Submission received: 5 January 2021 / Revised: 1 February 2021 / Accepted: 4 February 2021 / Published: 8 February 2021
(This article belongs to the Special Issue Poultry Genetics, Breeding and Biotechnology)

Abstract

:
The major histocompatibility complex (MHC) is a highly polymorphic gene region that regulates cellular communication in all specific immune responses. In this study, we investigated 11 microsatellite (MS) markers in the MHC-B region of chicken populations from four countries: Sri Lanka, Bangladesh, South Korea, and Nigeria. The MS markers were divided into two sets. Set 1 included five novel MS markers, which we assessed using 192 samples from 21 populations. Set 2 included six previously reported markers, which we assessed using 881 samples from 29 populations. The Set 1 MS markers had lower polymorphism (polymorphic information content (PIC) < 0.5) than the Set 2 markers (PIC = 0.4–0.9). In all populations, the LEI0258 marker was the most polymorphic, with a total of 38 alleles (PIC = 0.912, expected heterozygosity (He) = 0.918). Local populations from Sri Lanka, Bangladesh, and Nigeria had higher allele diversity and more haplotypes for Set 2 MS markers than Korean and commercial populations. The Sri Lankan Karuwalagaswewa village population had the highest MHC diversity (mean allele number = 8.17, He = 0.657), whereas the white leghorn population had the lowest (mean allele number = 2.33, He = 0.342). A total of 409 haplotypes (89 shared and 320 unique), with a range of 4 (Rhode Island red) to 46 (Karuwalagaswewa village (TA)), were identified. Among the shared haplotypes, the B21-like haplotype was identified in 15 populations. The genetic relationship observed in a neighbour-joining tree based on the DA distance agreed with the breeding histories and geographic separations. The results indicated high MHC diversity in the local chicken populations. The difference in the allelic pattern among populations presumably reflects the effects of different genotypes, environments, geographic variation, and breeding policies in each country. The selection of MHC allele in domestic poultry can vary due to intensification of poultry production. Preserved MHC diversity in local chicken provides a great opportunity for future studies that address the relationships between MHC polymorphisms and differential immune responses.

1. Introduction

Characterising the non-neutral genomic region that is likely to be under natural selection can reflect evolutionarily relevant and adaptive processes within and between populations [1]. To date, many studies have managed to quantify adaptively important gene families. They have found that diversity is maintained by forces of natural selection, such as balancing selection or positive selection. The major histocompatibility complex (MHC) genes in vertebrates are among the gene families that play a critical role in host immunity [2,3,4,5,6,7,8].
In chicken, the MHC is located on the q-arm of micro-chromosome 16 (GGA16). Compared to the MHC of higher vertebrates, such as humans, swine, and mice, the chicken MHC gene arrangement is unique. Classic MHC genes are densely arranged in the MHC-B region, which is separated from the non-classic MHC-B-like region called the MHC-Y. The intergenic and intron regions of these genes are shorter than any other part of the genome; therefore, genes have a high linkage disequilibrium. Because of this specific gene arrangement, the chicken MHC is also known as a minimal essential region [2,3].
MHC-B molecules are associated with resistance or susceptibility to highly pathogenic viruses and bacterial diseases in chicken [9,10,11]. Identifying the MHC-B haplotypes and their diversity in different chicken breeds under different environmental conditions and production systems is useful for assessing the diversity of these breeds in relation to their immune responses to various diseases under natural and artificial influences.
Native chicken breeds in tropical countries have a strong capacity to survive under harsh environmental conditions and also have high resistance to disease [12,13]. In local production systems, village chickens are kept in challenging environments and are constantly exposed to numerous viruses, bacteria, and parasite-induced diseases. Because host genetic diversity plays an important role in buffering individuals or populations against pathogens and widespread epidemics, their genes confer resistance to a number of major poultry diseases, such as Marek’s disease, avian influenza, Rous sarcoma tumour virus, and fowl cholera. Unlike MHC-B genes, MHC-Y polymorphism that showed disease resistance is not well understood. Only a few disease trials have been conducted to see the response of MHC-Y polymorphisms on Marek’s disease and have reported varied results with no strong impacts but possible influences [11]. A recent study by Seroussi et al. [14] reported a crucial role of MHC genes in immunity, particularly the avian tumour-necrosis factor (TNF) gene mapped to the MHC-Y region in chicken. Selecting birds with genotypes that are functionally associated with sound immune responses has the potential to control the occurrence of disease in chicken production systems, thus improving correlated production traits [9,11,15].
Microsatellite (MS) markers that are closely linked to a gene under selection may be chosen through genetic hitchhiking. MHC-linked MS markers can provide simple and cost-effective genotyping for assessing MHC diversity and identifying haplotypes. Many MS markers have been identified in the human leukocyte antigen (HLA) and swine leukocyte antigen (SLA) complexes, with extensive diversity in the classic class I, II, and III regions [16,17,18,19]. However, to date, only six MS markers have been reported in the chicken MHC-B region. Among those markers, the variable number tandem repeat marker LEI0258 has been reported in many MHC diversity studies [19,20,21,22,23,24].
There have been few studies of the other MS markers in the chicken MHC region. Among the reported markers, variations in MHC-T, MCW0312, MHC-D, MCW0371, and MCW0370 [19,20,21,22,23] have been reported in very few chicken populations. The LEI0258 marker is consistently more polymorphic and therefore is more frequently used in diversity analyses and marker–trait association studies. It has been suggested that LEI0258 is an important genetic marker that can be used to predict diversity at MHC loci [22,24,25,26,27,28]. The availability of updated MHC-B sequence information has facilitated the identification of other novel MS markers in the MHC-B class I and II regions. Further studies of their polymorphism in a wide range of breeds would be useful.
The main objective of this study was to develop an MS marker panel by combining previously reported markers and new MS markers in the MHC-B region (the 148.5 kb region of MHC-B that encloses the BG8 to C4 genes) to investigate MHC diversity in 29 different native chicken breeds/ecotypes from four countries (Sri Lanka, Bangladesh, Korea, and Nigeria) that manage chickens under different production systems and breeding practices. Furthermore, identification of MHC haplotypes (low resolution) and their distribution in global chicken populations will be required for planned disease association studies in native chicken breeds.

2. Materials and Methods

2.1. Samples and DNA Extraction

A total of 29 populations, including samples from Sri Lanka, Bangladesh, Nigeria, and South Korea and commercial layer and broiler populations, were used in the study. The breeds/ecotypes had varied histories of origin, breeding strategies, and selection criteria and had been raised under different management systems. We categorised them into three main management systems (extensive/semi-intensive, intensive system for native chicken, and intensive system for commercial chicken) based on the prevailing production systems of the four countries (Supplementary Table S1).
Details of the populations and samples are provided in Supplementary Table S2. Briefly, blood samples from Sri Lankan indigenous chickens were collected from three geographically distinct sites: University of Peradeniya farm, Udaperadeniya, Kandy (KA; Central Province, Sri Lanka); Udapussellawa village (NU; Central Province, Sri Lanka); and Karuwalagaswewa village (TA; Northwestern Province, Sri Lanka). For Bangladeshi chicken, we used the same sample set as used by Rashid et al. [29], which included five different breeds: Aseel chicken (AS), hilly chicken (HI), non-descript common deshi (ND), naked neck (NN), and wild red jungle fowl (JF). Nigerian local chicken samples (NIG) used in this study were collected from Umuobasi village (Osisioma Ngwa area, Abia State, Nigeria). We used 12 South Korean native chicken breeds: the six native lines used by Manjula et al. [30], a Korean native black chicken population called “Ogye” sampled from Yeonsan Ogye Jisan farm in Nonsan city (YOG), four Korean native commercial hybrid lines from the Hanhyup private breeding company (CC1, CC2, CC3, and CC4), and a hybrid population from the National Institute of Animal Science (NIAS; YCC). Two imported and adapted standard breeds, Rhode Island rock (RIR) and white leghorn (WL), were sampled at NIAS. Two commercial layer lines and four commercial broiler lines were collected from commercial private farms in Korea. All Korean native chicken populations were maintained under an intensive production system, except for the YOG population, which is usually maintained under a semi-intensive production system, with natural mating and artificial incubations.
The DNA of seven MHC-B standard samples (B2, B5, B12, B13, B15, B19, and B21) of the Avian Disease and Oncology Laboratory (ADOL) chicken line were received from HY-Line International (West Des Moines, IA, USA) and were used as controls for the study. The genomic DNA of Sri Lankan and Bangladeshi chicken samples was extracted from Flinders Technology Associates cards following the standard procedure. For Nigerian chicken, a rapid and accurate protocol was used to isolate the genomic DNA from the fresh feathers kept for 5 days at room temperature using a Prime prep-genomic DNA extraction kit for tissue (GeNet Bio, Daejeon, Korea). The genomic DNA of Korean chickens was obtained from whole blood samples using a Prime prep-genomic DNA extraction kit for whole blood (GeNet Bio, Daejeon, Korea).

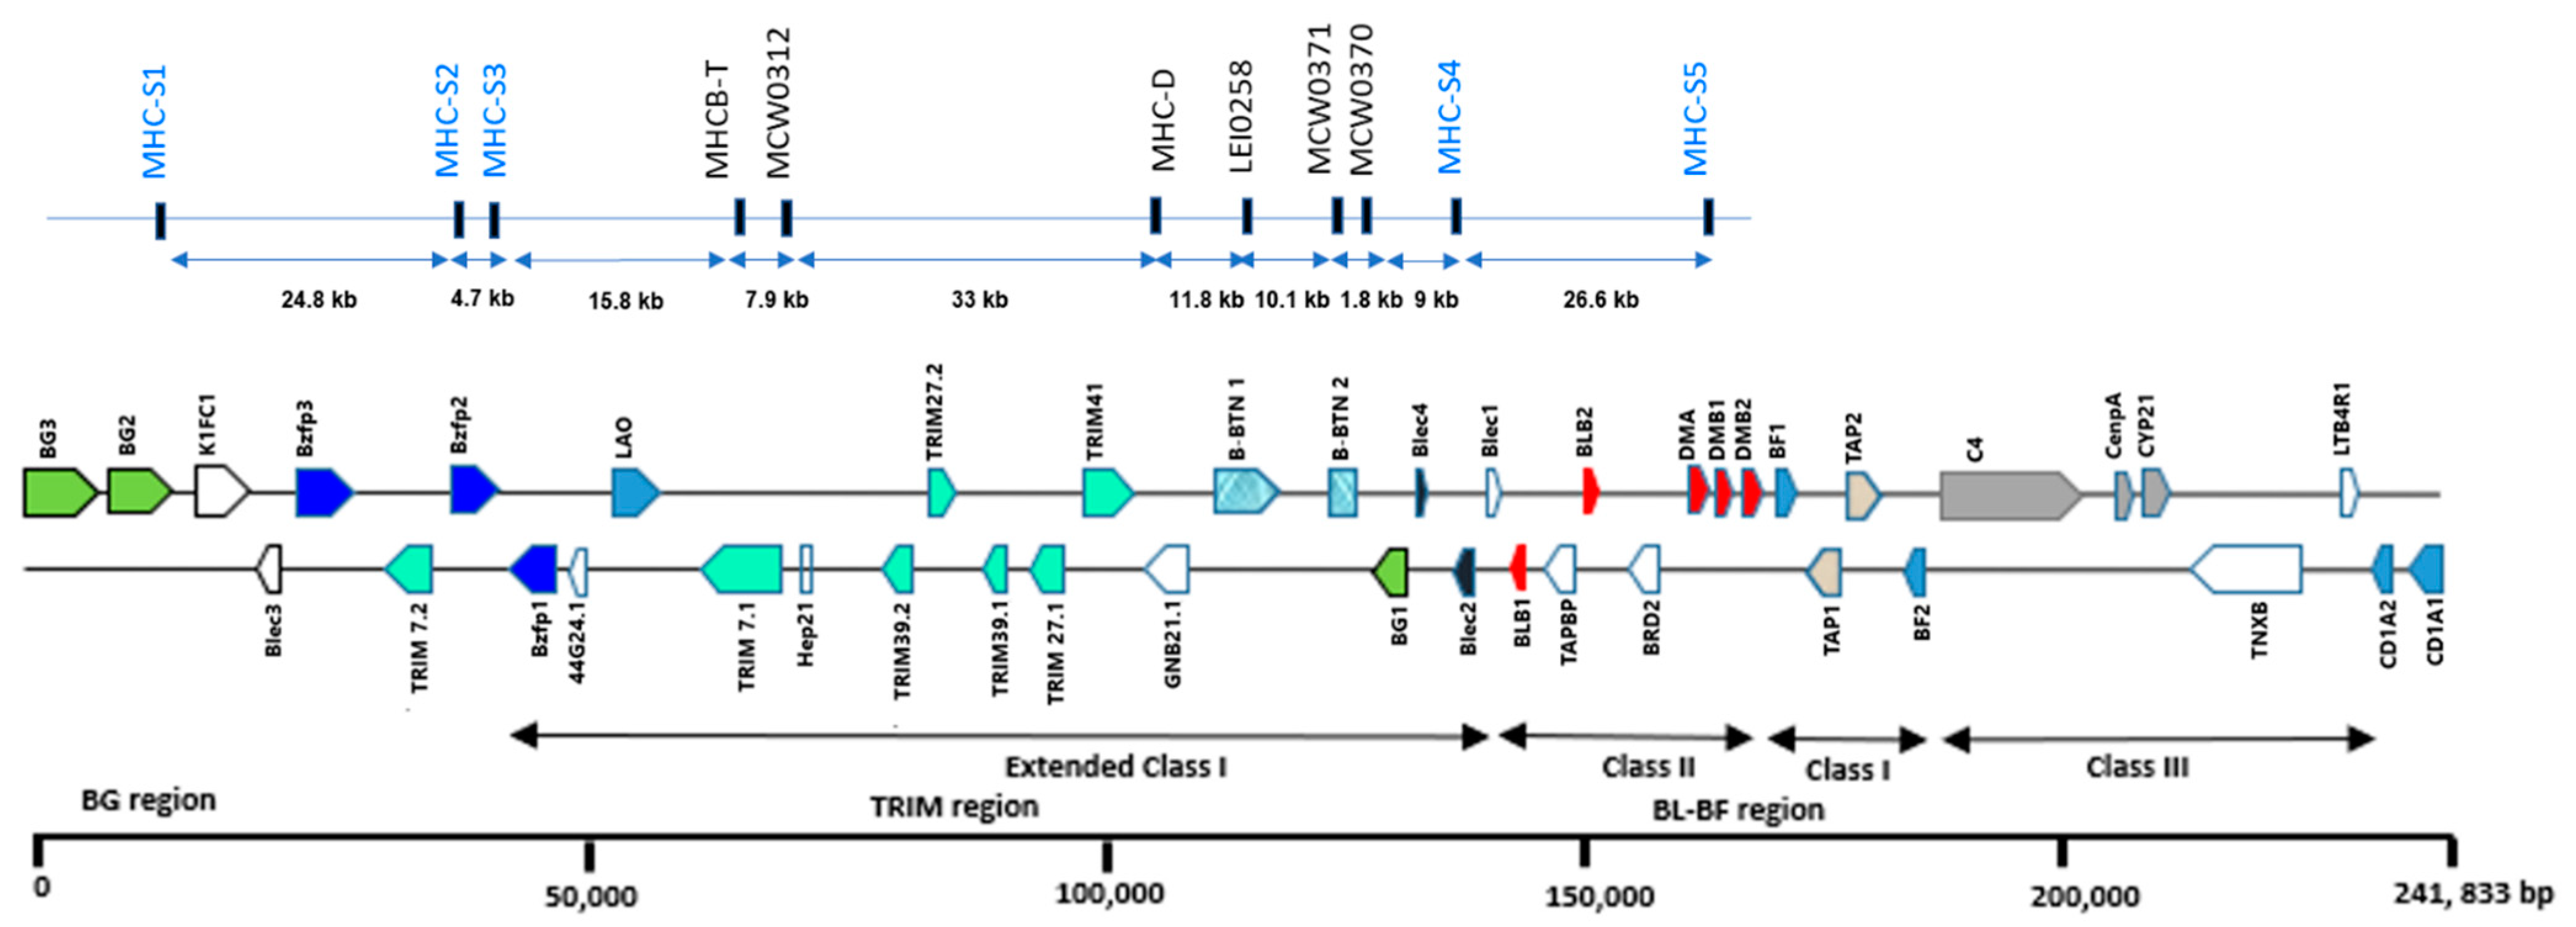
2.2. Ms Marker Identification and Primer Design

To obtain new MS markers and confirm the previously reported MSs, we analysed the ~240 kb region of MHC-B using three reference genomic sequences (Gene ID: NT_455973.1, AL023516.3, and AB268588.1) and the chromosome 16 (GGA16) sequence information for the Gallus gallus 6.0 assembly available in the National Center for Biotechnology Information (NCBI) database. We used a version of the MS tandem repeat finder available in the tandem repeats database (Tandem.bu.edu/cgi-bin/trdb/trdb.exe) [31] to identify all MSs in the MHC-B region, which enclosed the gene region from BG to CD1. The results were filtered to obtain the repeat motifs less than 20 bp in size (mono-, di-, tri-, tetra-, penta-, etc.). Among the MS markers, loci with perfect and imperfect repeat patterns reported within the intron region of MHC-B genes were selected. Five new MS markers (Set 1: MHC-S1, MHC-S2, MHC-S3, MHC-S4, and MHC-S5) and six previously reported MS markers (Set 2: MHC-T, MCW0312, MHC-D, MCW0371, MCW370, and LEI0258) were used (Figure 1). All Set 2 markers and four new loci belonged to the extended MHC class I (TRIM/Blec gene region). Only one new locus (MHC-S5) belonged to the MHC class II (in the DMB1 gene; Figure 1). The minimum gap between two markers was 1.8 kb (between MCW0370 and MCW0371), whereas the maximum gap was 148.5 kb (between MHC-S1 and MHC-S5).
Polymerase chain reaction (PCR) primers for new MS loci were designed with the Primer3 program and validated by BLAST against the chicken genome and MHC-B sequence (AB268588) available in the NCBI database to ensure high specificity to the target sequence. First, we verified the utility of the normal oligo primers for the 11 MS markers using the MHC-B standard (MHC homozygous) samples and selected chicken samples from six breeds. Then, we performed fluorescence-based allele identification, with the 5′ end of each forward primer labelled with standard fluorescence colours (FAM, VIC, HEX, and NED; Supplementary Table S3).

2.3. PCR Amplification and Genotyping

The PCR procedure and primers for the Set 2 markers were consistent with the previously performed procedure, with a few modifications [19,22,23]. These six markers were genotyped using 881 samples from 29 populations.
We genotyped the five new loci identified in this study using a set of 192 samples from 21 populations. Initially, we performed a single PCR reaction for each marker and then a multiplex PCR reaction based on its fragment sizes and fluorescence colours. The following optimised PCR procedure was used for all loci. The PCR master mixture consisted of 1 µL of 50 ng/µL genomic DNA; 10 µL HS prime Taq premix (2×; GeNet Bio); 0.5 µL 5 pmol of each forward and reverse primer; and triple distilled water, which was used to adjust the volume to 20 µL. The PCR thermocycler setup included an initial denaturation for 3 min at 94 °C, followed by 34 cycles of denaturation at 94 °C for 0.45 s, annealing at 60–62 °C for 45 s, at 72 °C for 45 s, and a final extension at 72 °C for 60 min. The PCR products for each sample were verified with 3% agarose gel containing ethidium bromide (Supplementary Figure S1). Based on the electrophoresis results, 1 µL PCR product was diluted (1:100, 1:50) with triple distilled water to reduce the pull-up during capillary electrophoresis. A mixture of 1 µL of each diluted PCR product was mixed with 0.1 µL Gene-Scan LIZ 500 size standards and 9.9 µL Hi-Di formamide solution and analysed by capillary electrophoresis with an ABI-3730 DNA sequencer (Applied Biosystems, Foster City, CA, USA) at the Neogene laboratory (Korea).
Raw data were analysed with Genemapper 3.4 (Applied Biosystems), and allele binning was conducted with the power function of Tandem [32]. As a control, we used the allele sizes of seven MHC-B standards from the ADOL line [22], and the sequence information of B standard haplotypes from Hosomichi et al. [33] and Shiina et al. [34] was used to validate and adjust the binning size. The LEI0258 alleles were further sequenced to confirm their actual fragment sizes and adjust the allele sizes in the binning process. A total of 21 fragment sizes were selected for PCR amplification and sequencing using a new primer pair as described previously [22,26].

2.4. Population Genetics Statistics

Raw data were initially checked for possible errors in allele sizes with an MS tool kit program. A test for deviation from the Hardy–Weinberg equilibrium (HWE) for all loci was conducted with Genepop [35] and GenAlEx [36]. We calculated the following population genetics statistics for the 11 markers for each population using the GenAlEx program in Excel: allele frequency, number of alleles (Na), effective allele size (Ne), private allele size (Npa), observed (Ho) and expected heterozygosity (He), and heterozygosity excess (fixation index = 1 − [Ho/He]). We calculated the polymorphic information content (PIC), Ho, and the null allele frequency of each marker using Cervus [37]. We calculated allele richness (AR) using the hierarchical rarefaction method (with a minimum number of animals, n = 32) available in HP-RARE software for rarefaction of private alleles and hierarchical sampling designs [38].

MS Marker Diversity within and between Populations

We analysed differences in allele frequency distribution within and among populations under two scenarios using analysis of molecular variance (AMOVA), using an exact test implemented in Arlequin [39]. Populations were grouped based on their country of origin, and F statistics were used to estimate the proportion of genetic variation within populations (FST), variation among populations within groups (FSC), and variation among groups (FCT). The significance of these F statistic analogues was evaluated with 1000 random permutations. Allele number, AR, and heterozygosity difference among the groups, which were separated based on their origin and production systems, were compared with independent t tests.
To perform genetic clustering of the individuals based on the MHC-linked MS markers, we calculated the Nei unbiased genetic distance (Nei D) and genetic identity value (Nei I) using GenAlEx.
We created a neighbour-joining (NJ) tree based on the Nei’s DA distance [40] using the POPTREEW Web interface (accessed at http://www.med.kagawau.ac.jp/~genomelb/takezaki/poptreew/index.html (accessed on 15 November 2020)) [41].

2.5. Haplotype Construction

The MHC-B regions of MS-based haplotypes were typed with the Set 2 markers located in the extended class I. First, the haplotypes of seven standard MHC-B samples were constructed manually. Haplotypes were then constructed in each population using homozygous individuals. If an individual’s genotypes were not described by any of the homozygous haplotypes, all possible haplotype pairs for ambiguous data (gametic phase unknown) were identified with the expected maximum likelihood algorithm and Bayesian algorithm methods in Arlequin [39].

3. Results

3.1. MHC-B MS Marker Polymorphisms

The amplified MHC-linked markers represented two classic classes of chicken MHC-B: extended class I and class II (Figure 1). The overall polymorphic characteristics of the 11 MS markers, Set 1 (MHC-S1 to MHC-S5) and Set 2 (MHC-T to MCW0370), are summarised in Table 1. We analysed the polymorphism of new loci using a set of 192 samples from 21 populations. Overall, all new markers (extended class I and class II) were less polymorphic, as indicated by their low mean PIC values (0.032–0.368) and mean Ho values (0.000–0.276). For Set 1, the MHC-S5 marker had the highest allele number, whereas the MHC-S2 marker had the lowest allele number. All alleles observed for MHC-S2 were homozygous in all populations, and therefore zero heterozygosity is reported.
A different Na, ranging from 4 to 38, was reported for each marker in Set 2 (Table 1). The marker LEI0258 was the most polymorphic in all populations (38 different alleles, Ho = 0.782, PIC = 0.912), whereas the marker MCW0312 was the least polymorphic (four alleles, Ho = 0.379, PIC = 0.406).
The allele frequency distribution for Set 2 markers varied by population. The 234- and 238-bp alleles of MHC-T; 214- and 218-bp alleles of MCW312; 307-, 310-, 313-, and 316-bp alleles of MHC-D; 193-, 249-, and 309-bp alleles of LEI0258; 202-, 205-, and 206-bp alleles of MCW0371; and 174-, 177-, 178-, and 179-bp alleles of MCW0370 had a high allele frequency above 10%. The MCW0371 and MCW0370 markers had higher allele numbers in all populations. However, MHC-T, MCW0371, and MCW0370 tended to have a null allele frequency, and there were low PIC values for MHC-T in many populations. A significant deviation from HWE was observed for these three markers in all populations except RIR. The FIS values for each locus ranged from −0.197 (MHC-S4) to 1.00 (MHC-S2), which indicates excessive heterozygosity. Eight out of the 11 loci showed a significant departure from HWE, whereas only two loci could not be estimated because of zero or low Ho. Eight private alleles (three in Korean chicken, two in Sri Lankan chicken, and one each in broiler and WL and HI) were observed for LEI0258, whereas no private alleles were reported for the other loci.

3.2. MHC Diversity within and between Populations

The allele distribution and the respective allele diversity statistics for both marker sets in each population according to origin are summarised in Table 2 and Table 3 and Supplementary Table S4. All populations had a similar level of diversity for Set 1 markers; however, there were differences in allele fixation by population.
For Set 2 markers, each population had a clear difference in MHC diversity. The mean Na, mean Ne, mean AR, and mean Ho of populations over six MS markers ranged from 2.33 (RIR, WL) to 8.17 (TA), 1.68 (WL) to 5.10 (KA), 2.30 (RIR) to 5.43 (KA), and 0.299 (JF) to 0.689 (CC1).
The Sri Lankan TA population was the most diverse, with a total of 49 alleles (mean allele number = 8.17), AR = 5.06, Ho = 0.495, and He = 0.657; the standard WL population was the least diverse, with a total of 14 alleles (mean allele number = 2.33), AR = 2.31, Ho = 0.265, and He = 0.342 (Table 4 and Supplementary Table S4). The Nigerian local population had similar MHC diversity to that of the Sri Lankan chicken. All Bangladeshi indigenous populations had higher diversity for all Set 2 markers except for two (MHC-T and MCW0370). The HI population had a high Na, AR, and Ho; the JF population was an exception, with low diversity compared to the other Bangladeshi populations. All Korean populations had similar MHC diversity, but the hybrid YCC population was more diverse than the other hybrid populations.
The distribution of allele frequencies in Set 2 markers varied by population. The MCW0312 locus in RIR and WL and MCW0370 locus in WL had zero heterozygosity. The number of different alleles with a frequency less than 5% (rare alleles) was high in the indigenous populations from Sri Lanka, Bangladesh, and Nigeria compared to the commercial populations and Korean conserved populations. In the TA population, 50% of all alleles had a frequency of less than 5%, whereas all alleles identified in RIR, WL, and CC3 had >5% frequency.

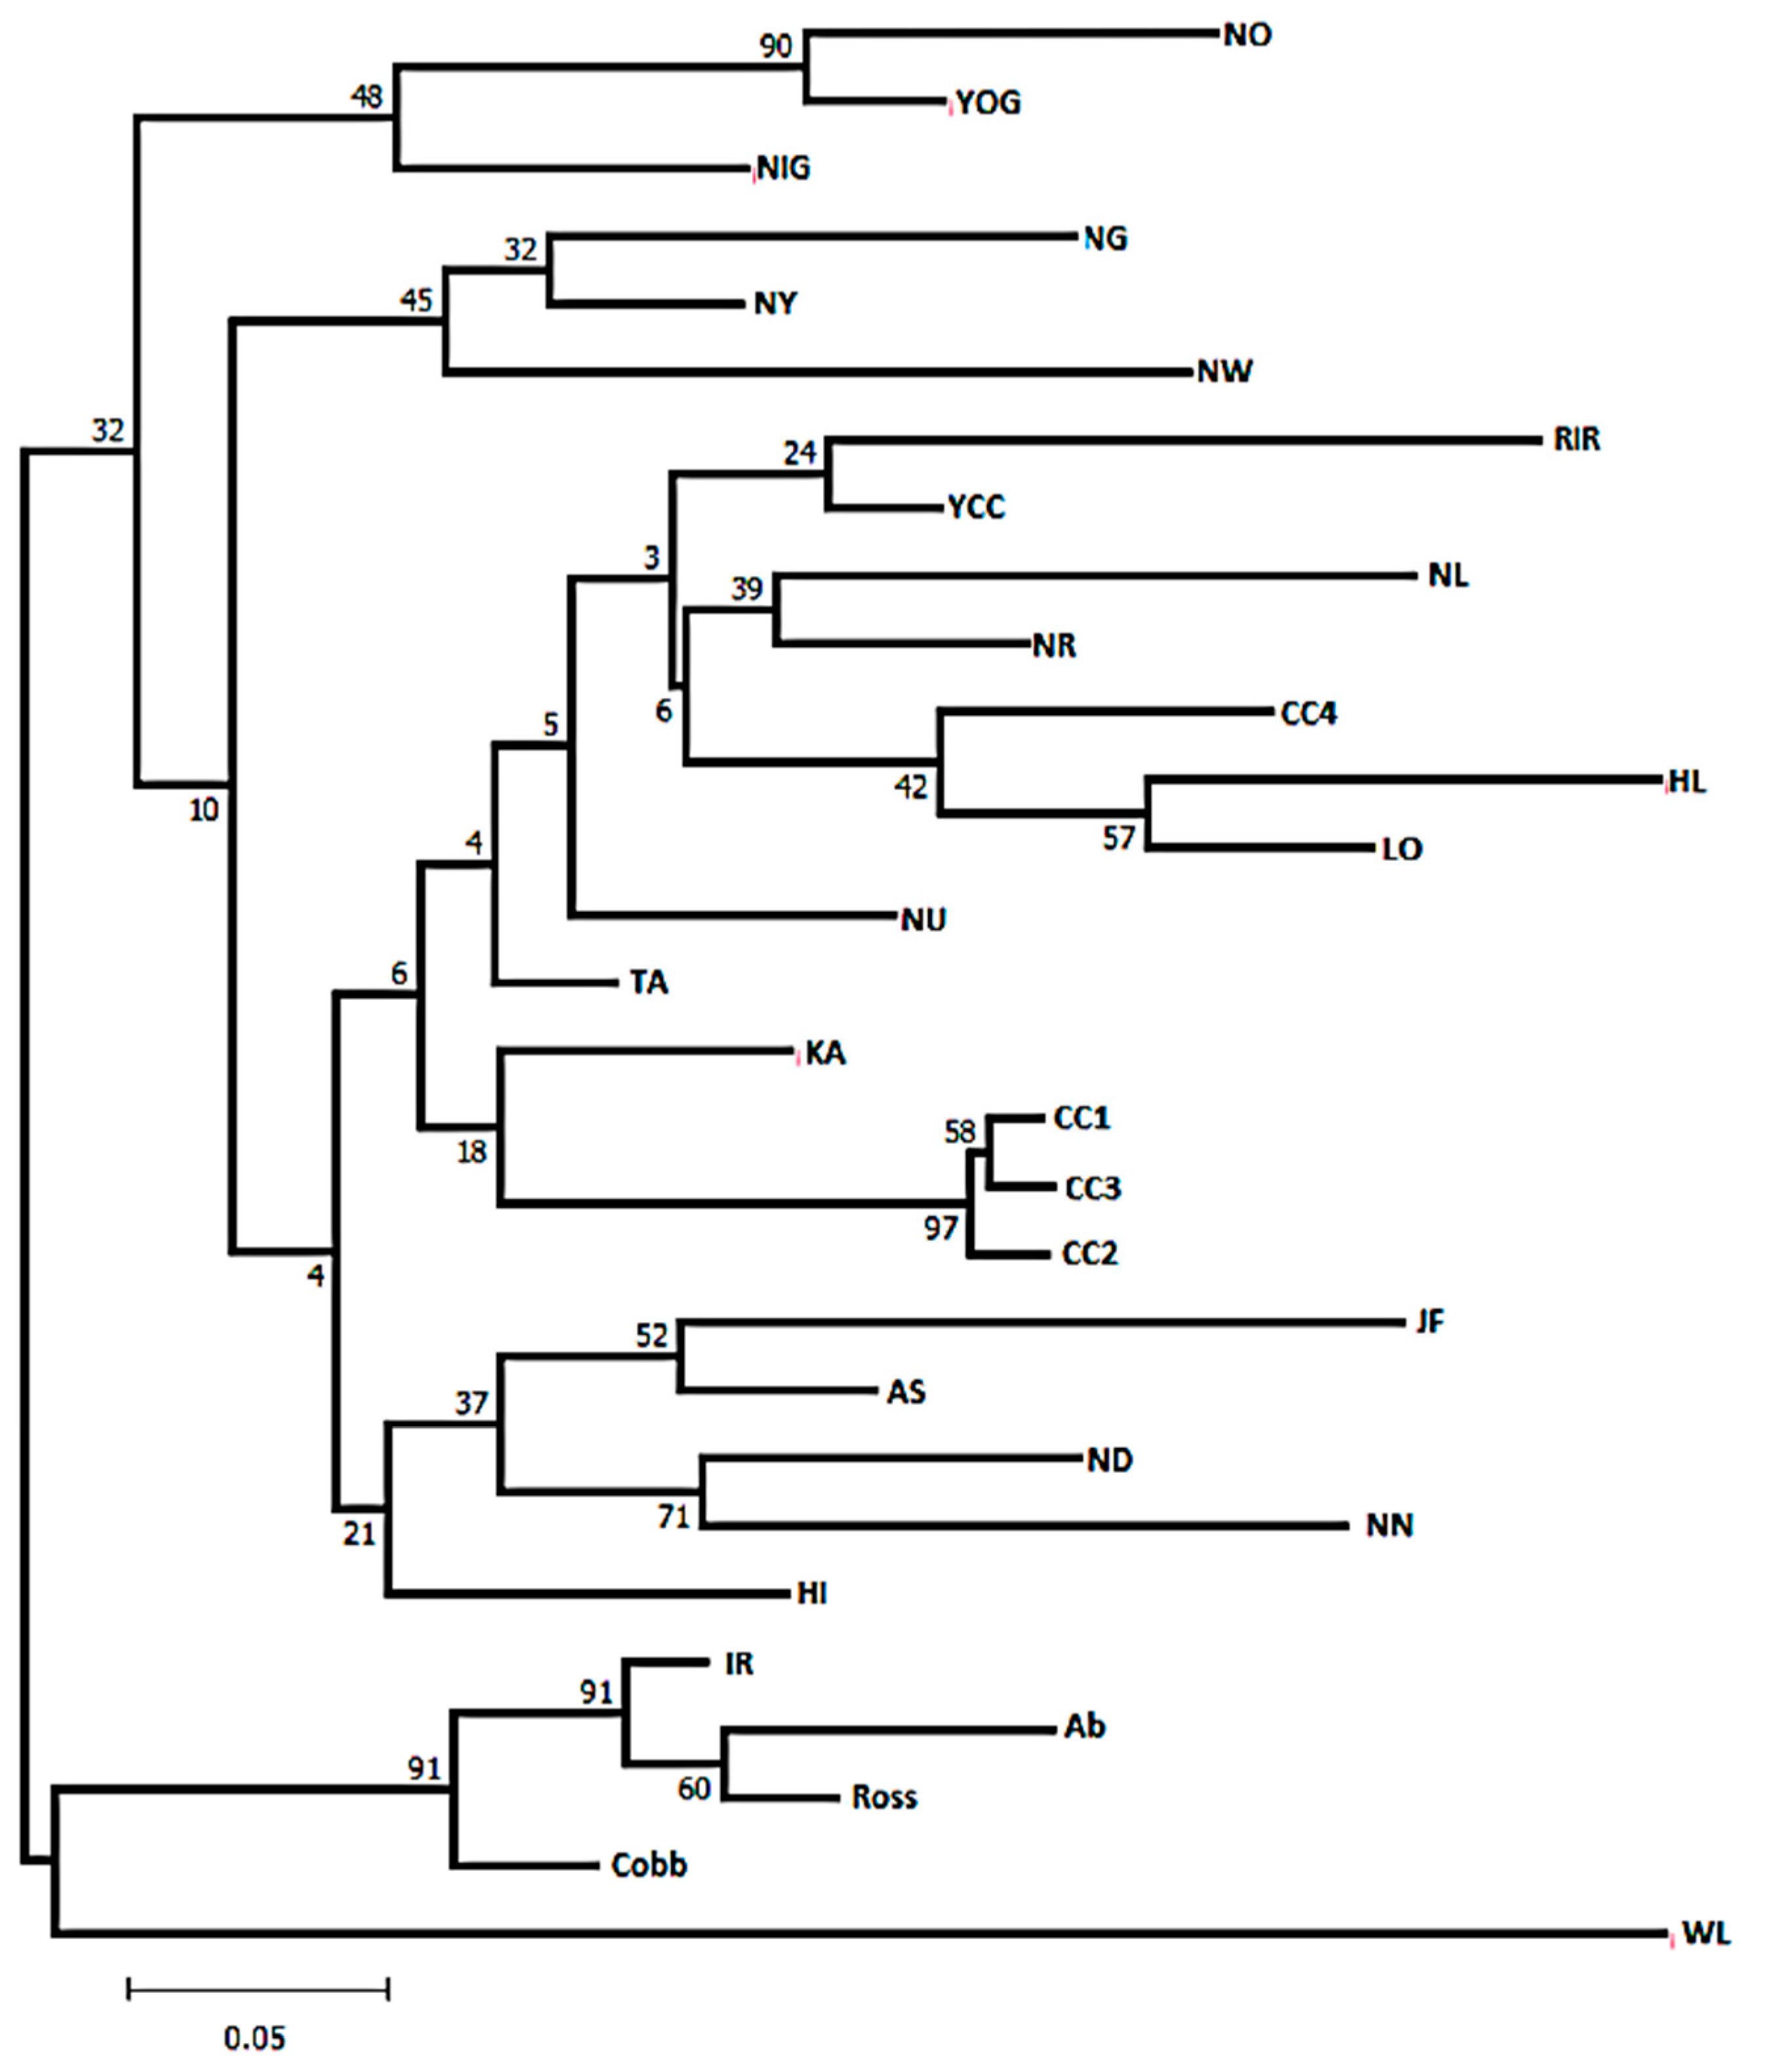
Population Structure and Genetic Distances

The AMOVA results for the different population groups by country of origin (seven groups) demonstrated that most of the MHC molecular variation was distributed within populations (88.47%) rather than among populations (8.28%; p < 0.001; Table 4). This suggests that there was some genetic structure within the groups. We estimated the genetic distance and population differentiation at the MHC using five polymorphic loci with low null allele frequencies and high PIC values (PIC > 0.5) to avoid overestimating the population differentiation coefficient. The fixation index among groups was significant (FCT = 0.033, p = 0.08), whereas, among populations, the within-group FSC was 0.086 (p = 0.000), which indicates that populations were structured within at least one group.
The most closely related populations based on FST were Ross and Indian River and CC2 and CC3 (FST = 0.013, 0.011), whereas the WL and NW populations were the most unrelated (FST = 0.335). The Nei unbiased genetic distance (Nei D) and genetic identity value (Nei I) were consistent with the FST values: WL and NW had the lowest genetic identity and the highest genetic distance (uNei D = 1.321, Nei I = 0.267). The WL population had relatively large genetic distance (Nei D, 0.426–1.321) and FST values (0.215–0.385) compared to the other populations.
The NJ trees obtained using the DA distance revealed two main clusters, in which all broiler and WL populations were separated from all other populations (Figure 2). An imported and adapted RIR population sampled at the NIAS was grouped with the Korean conserved populations, in particular with YCC. Three Korean commercial hybrid populations (CC1, CC2, and CC3) always shared one separate cluster. Similarly, all commercial layer groups formed a separate cluster with the Korean CC4 population. No separate cluster for Sri Lankan chickens was noted, but these chickens did lie in between Korean and Bangladeshi chickens, with low bootstrap support. It is interesting that all Bangladeshi chickens had one separate cluster, in which JF had a close relationship with AS, whereas the ND and NN populations were grouped in a subclade of the main cluster.

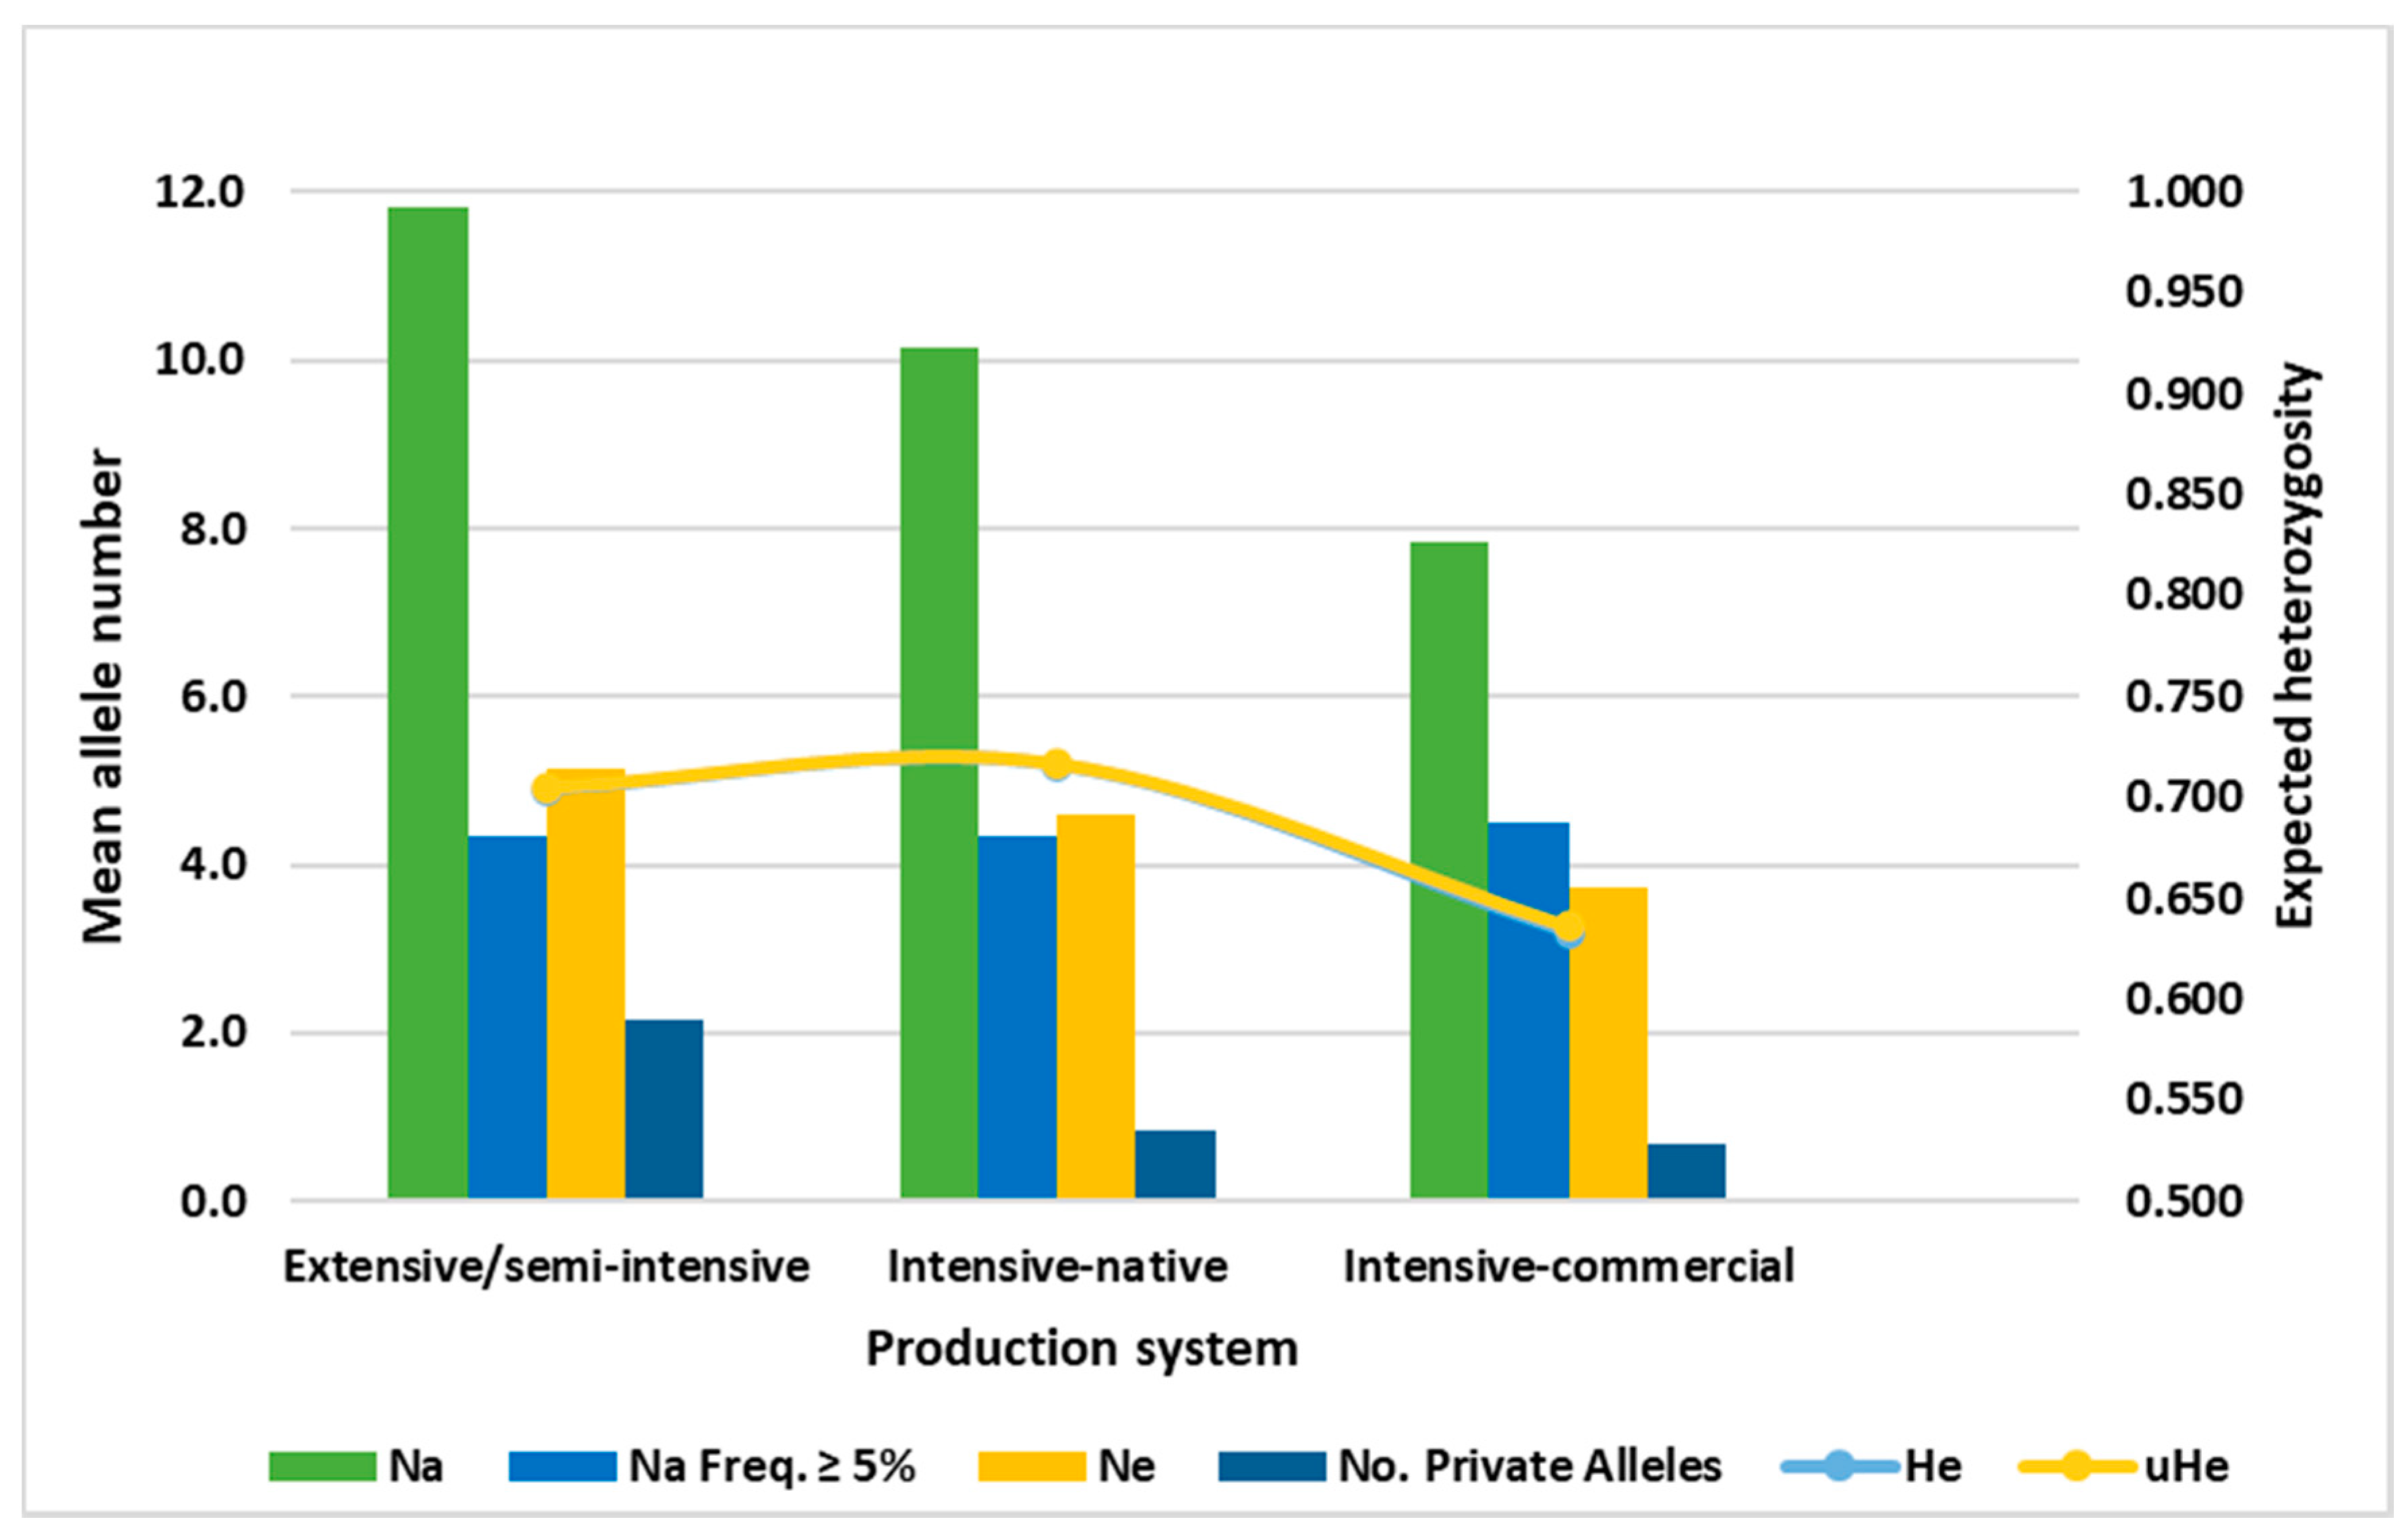
3.3. Allele Distribution by Production Systems

Clear differences in the mean allele number and AR were observed between populations under different farming systems (Table 5, Figure 3). The backyard or semi-intensive production groups had a higher mean allele number (11.17) and AR (4.46) than the intensive groups. However, independent t-tests of the mean differences in allele number and AR averaged over six loci showed no significant differences between the two production systems and the commercial group (p > 0.05; Table 5).

3.4. Haplotype Diversity

We constructed the MHC extended class I haplotypes using the Set 2 markers. The number of non-zero haplotypes constructed with the maximum likelihood method ranged from 4 (RIR) to 46 (TA; Table 6). The local populations of Sri Lankan and Bangladeshi chickens had a high number of unique haplotypes with a low haplotype frequency (<5%). A total of 89 haplotypes were shared. Commercial broiler and layer populations and Korean commercial hybrid populations had a higher number of shared haplotypes (Supplementary Table S5). Several haplotypes (22) were shared only among the Korean chickens. The four haplotypes identified in RIR were shared with other populations. The MHC-B_MS7 (similar to B21), and MHC-B_MS10 haplotypes had >5% frequency in the shared populations, except in a few populations, in which they had a low frequency of <5% (Supplementary Table S5). Thirteen haplotypes were identified in the WL population, but only two of them were shared. A comparison of all haplotypes identified for seven B standards (B2, B5, B12, B13, B15, B19, and B21) showed that the MHC-B_MS1(B2), MHC-B_MS2 (B15), MHC-B_MS4 (B13), and MHC-B_MS5 (B19) haplotypes in two populations, MHC-B_MS3 (B5) haplotype in three populations, and B21-like haplotype, MHC-B_MS7, was present in all 15 populations.

4. Discussion

Breeds from different environments, from different production systems, and most importantly with different breeding histories can have different genetic diversity [42]. These differences can be assessed with neutral and non-neutral genetic markers [43]. The MS markers in the MHC region provide a very useful and easy method for studying the genetic diversity of diverse populations.

4.1. Polymorphism of MHC-B Microsatellite Loci

A high number of polymorphic MS markers have been reported in the MHC class I, II, and III genes of humans, swine, and mice, whereas only six MS markers have been reported in the chicken MHC-B region. The minimal essential gene region of the chicken MHC is less complex, and some of the genes in the HLA and SLA regions are not reported in chicken, which might account for the low number of polymorphic MS markers in chicken. However, the available full sequence information for GGA16 is still inadequate for investigating probable MS markers. Among the reported markers, only the most polymorphic locus, LEI0258, has been used extensively in MHC studies of chicken breeds [22,25,44]. Other MS markers have not been used to investigate MHC diversity in many chicken breeds.
In this study, we evaluated two sets of MS markers. The polymorphism of new markers in Set 1 was assessed with 192 samples of 21 unrelated populations, and all loci had low PIC values (PIC < 0.5) and heterozygosity. Two markers, identified in the Blec2 and DMB1 genes, respectively, had little allele variation and low Ho. This might be a consequence of the low variation in the Blec2 and DMB1 genes, as reported by Hosomichi et al. [33]. Five of the seven B standards used in this study had sizes of 220 and 261 bp, whereas the remaining two had 220 and 270 bp alleles for MHC-S4 and MHC-S5, respectively. The 14 sequences available from Hosomichi et al. [33] for other B standard haplotypes agreed with the current results in terms of allele sizes. However, we could not provide any evidence of variation for the first three markers (MHC-S1 to MHC-S3) in the aforementioned MHC-B haplotypes because of incomplete sequence information. We hypothesise that the intron and intergenic regions, where these three markers have been identified, may be less diverse.
According to the available 245 kb of complete MHC-B sequence information (GenBank accession no. AB2268588), the MHC0371 and MHC0370 loci contained mononucleotide repeats ([A]n) motifs and were located in the intron region of the B-BTN2 and BG1 genes. The MHC-T and MCW0312 markers contained (GG)n and (CA)n repeats, respectively, and were 7.9 kb apart from each other and approximately 50 kb upstream of the LEI0258 locus. The MHC-D marker was a tri-repeat motif of (TAA)n that was mapped in between LEI0258 and MCW0312 (11.8 kb from the MCW0312 marker). Because these six MS markers were located in the extended class I region, close to the class II region, there was a high linkage disequilibrium among them. The Set 2 markers had a high mean PIC and Ho compared to the novel loci. The high allele variation and PIC for LEI0258 concurs with the results of previous studies. The mean PIC values of these six loci (0.4–0.92) are comparable to those of the 68 markers in humans (0.6–0.7) and the 40 markers in the entire porcine SLA region (0.71–0.68) [16,17,18].
A high number of polymorphic markers in the extended class I region is considered likely because this region contains highly polymorphic genes, such as the tripartite 7 motif (TRIM genes), zinc finger protein gene, HEP21, guanine nucleotide-binding, and BG genes. The B-TN1 and B-TN2 genes, in which the LEI0258 and MCW0371 markers were identified, belong to the butyrophilin-like (BTN) gene cluster. The TRIM-B30.2-like domain likely helps regulate innate and adaptive immunity in higher vertebrates [11]. Duplication and shuffling events between BG-like and B32.2-like genes might be responsible for the formation of BTN genes in chicken. Therefore, we should expect substantial variation in the MS markers found in this gene region.
The occurrence of null alleles is more common in MSs because of mutations in the primer binding region or PCR amplification bias [45]. According to Gray [46], MS mutations are mainly due to DNA slippage during replication, whereas for a variable number tandem repeat marker the predominant mutation mechanism appears to be gene conversion and unequal crossing over. Therefore, we speculate that a high null allele frequency was reported for three loci—MHC-T, MCW0370, and MCW0371—in almost all populations for one of these reasons.
From the results of previous studies and sequences obtained in this study, it is very clear that insertion–deletion, single nucleotide polymorphism (SNP), and recombination are responsible for the evolution of different fragment sizes of LEI0258 loci. In line with Fulton et al. [22], we observed no PCR amplification for the MCW0370 locus for B5 and B15 standard samples, and as a result we reported a null allele for this locus. The assessment of two sequences of this B haplotype (AB426142 and AB426149) showed the absence of a primer binding region and repeat motifs of this marker in the B5 and 15 haplotypes. A similar problem of no PCR amplification or the presence of a null allele was detected in several individuals among the local chickens, and it is likely that these animals might have had mutations at these loci.

4.2. Difference in MHC Diversity and Frequency among Populations

Sri Lankan chickens had the highest MHC diversity among the South Asian breeds. However, the diversity was lower than that reported in several previous studies of African and Iranian local chickens compared using only the LEI0258 loci [27,44]. This higher diversity in Sri Lankan chickens is obvious, with each subpopulation composed of highly crossbred, mixed genotypes and with an absence of population structure as described in Silva et al. [47]. The lack of tightly controlled breeding practices under the backyard/semi-intensive production system allows interbreeding among different ecotypes and possible gene flow through the sharing of animals between households. This can result in a higher number of heterozygous animals and high within-population variation. A similar high MHC diversity in the same populations was observed using 90 SNPs in the MHC-B regions (unpublished data [48]).
The same population of Bangladeshi chickens was previously studied using 15 neutral markers [28] and low MHC diversity was reported, which suggests a balancing selection of MHC in these populations. This might reflect in part the influence of selection and breeding programs implemented in the recent past. However, the low MHC diversity in JF is probably associated with genetic drift and a small, fragmented population size.
Korean populations had consistent allele diversity, which is in agreement with our previous studies and explained the MHC diversity in Korean chicken breeds using the MHC-B SNP panel [30,49]. Compared to the YOG populations and Korean commercial hybrid populations, the six conserved populations had low diversity. These differences in attributes may have to do with selection and within line-breeding strategies implemented during their development [50]. As expected, three of the Korean commercial hybrids (CC1, CC2, and CC3) were diverse and shared a similar allele distribution because they shared the same parental lines, whereas CC4 was a semi-broiler chicken developed by crossing the parental lines of a layer and broiler. Despite having many shared alleles with the layers and broilers, the CC4 population was genetically closer to the HL population.
Allele richness is more sensitive than heterozygosity to founder events followed by population expansions [51]. The loss of alleles during founder events reduces the AR but not heterozygosity. This founder effect was obvious in the Korean Ogye population. A NIAS conserved population (NO) that had been separated from its original population (YOG) more than 20 years ago lost some of its alleles. For example, the 217-, 245-, 283-, 307-, and 465-bp alleles of LEI0258 that were observed in the original YOG population were not found in the NO population.
We noticed a high number of least frequent alleles in each population, except for the RIR, WL, and LO breeds. Alleles that occur with a frequency of <5% are considered rare and require much attention, as they can easily be wiped out from a population that has a low effective population size due to simple genetic drift. Most of the alleles were shared among the populations, which indicates that these alleles were dispersed into a wide range of native chicken breeds with various frequencies. The presence of many alleles and their frequencies is also of significance in response to selection [52,53]. Because MHC diversity is maintained by the host–pathogen interaction, the presence of many alleles can be helpful for counteracting the effects of mutations that occur in pathogen antigens invading host immunity [54]. The presence of rare alleles (low frequency) might be helpful for inducing an immune response against new pathogens when common alleles become the target of pathogen adaptation and are no longer resistant to these new pathogens [54,55].

4.3. Differences in MHC Diversity among Production Systems

Bettridge et al. [12] explained the role of local adaptation in the production of local village chickens. Regional variation in trait preferences and parasite burdens is associated with distinct chicken gene pools and almost certainly occurs in response to interactions between natural and human-driven selection pressures (e.g., consumer demand and breeding for improved traits). In this study, MHC diversity decreased with intensification (backyard extensive/semi-intensive > intensive > commercial). This might be a direct consequence of the selection of animals for genetic improvement (reduced effective population size). However, unlike commercial chickens that are reared by intensive farming, the exposure of local chickens to dynamic environmental variation and pathogens during their lifetime determines the survival of MHC alleles in these populations. Therefore, these observed differences might be associated with system adaptation, agro-ecology, parasite populations, and bird genotypes.

4.4. Haplotype Diversity

MS markers allow an evaluation of diversity not only at a single locus but also among haplotypes (i.e., unique combinations of alleles at each locus), which makes these assessments more comprehensive and reliable. The number of polymorphic MS markers in chicken is still limited compared to the number in humans, swine, and other livestock species [16,17,18,56]. There is large variation in the number of haplotypes identified in 29 populations. One possible reason for this difference might be that the different alleles of each marker are fixed differently in each population. If a population consists of a diverse range of individuals, it tends to have many haplotypes, as we noticed in the Sri Lankan, Bangladeshi, and Nigerian chickens. Local crossbred and commercial hybrid populations also had more total haplotypes and shared many of them with their related parental populations (Supplementary Table S5), which indicates that a possible population admixture occurred during their development. RIR chickens are standard brown egg layers reared in many countries. Their contribution to MHC diversity in other local indigenous populations or crossbreds was very high, which agrees with our previous studies and Fulton et al. [49,57]. The WL population is usually maintained for white egg production and less common in crossbreeding programs. Therefore, we would expect a smaller number of shared haplotypes between WL and other chicken breeds. The RIR and WL populations used in this study had low diversity mainly because of their small population size and closed breeding practices implemented at the NIAS.
The observed allele combinations of seven MHC-B standard haplotypes of the ADOL line were consistent with their original sizes reported by Fulton et al. [21] and the six homozygous MHC-B haplotypes described by Gao et al. [58]. The haplotype MHC-B_MS7, which corresponds to the B21 standard haplotype, was observed in 15 populations. The B21 haplotype, which is highly resistant to Marek’s disease, had a high allele frequency in the RIR, Cobb, IR, and NN populations and all Korean commercial hybrids but a low frequency in the AS, KA, TA, Ross, and Ab populations. Despite the differences in frequency, the segregation of this haplotype in wider populations is a sign of resistance to Marek’s disease in these populations.
The populations with a close genetic relationship shared many haplotypes. As revealed by the NJ trees, populations had a close genetic relationship when they shared either parental lines or past introgression events. However, some of the shared haplotypes were observed in genetically distant populations, which indicates that they may be equally important for resistance to disease in chickens.

5. Conclusions

Eleven MS markers, six previously developed markers, four new markers in the TRIM/Blec gene region, and one new marker in the class II region, displayed different polymorphism. Set 2 markers, in particular LEI0258, MCW0370, and MCW0371, had high allele diversity and high MHC haplotype diversity that varied across countries and production systems. These results indicate that each population has unique MHC diversity. The use of highly polymorphic markers would be very useful for reliable studies of MHC diversity and inference of disease resistance in chickens.

Supplementary Materials

The following are available online at https://www.mdpi.com/2073-4425/12/2/240/s1, Table S1: Characteristics of the farming systems described in the present study populations, Table S2: Characteristics of populations used in this study, Table S3: Microsatellite markers identified in MHC-B regions, allele size, and PCR primer information, Table S4: Summary of genetic diversity of MHC-B microsatellite markers (Set 2) in 29 populations, Table S5: Haplotypes using 6 microsatellite markers for 29 populations (Haplotype frequency >5%); Figure S1. Agarose gel results for the allele size distribution of Set 1 markers (MHC-S1~ S5) and Set 2 (MHC-T, MHC-D, MCW0312, MCW0370, MCW0371, LEI0258) markers in 7 control samples of known MHC-B haplotypes (from ADOL line) and negative samples (NC).

Author Contributions

Conceptualisation, J.H.L. and P.M.; methodology, P.M. and M.K.; software, P.M. and M.K.; data curation, P.M.; M.K.; validation, P.M.; M.K. and S.C.; formal analysis, P.M.; under guidance of J.H.L. and D.S.; resources, J.H.L.; D.S.; writing—original draft preparation, P.M.; writing—review and editing, P.M.; D.S.; J.H.L.; supervision, J.H.L.; project administration, J.H.L.; funding acquisition, J.H.L. All authors have read and agreed to the published version of the manuscript.

Funding

This study was supported by a grant from the National Research Foundation, Republic of Korea (grant number MHC-2019R1F1A1061670).

Institutional Review Board Statement

All samples were obtained in accordance with the guidelines of the Institutional Animal Care and Use Committee of the National Institute of Animal Science (NIAS; 2012-C-037), and the guidelines of the Guide for the Care and Use of Laboratory Animals.

Informed Consent Statement

Not applicable.

Data Availability Statement

The data presented in this study are available on request from corresponding author.

Acknowledgments

The authors greatly appreciate Pradeepa de Silva, University of Peradeniya, and Dinesh D. Jayasena, Uva Wellassa University for providing access to collect the Sri Lankan chicken samples, and M. S. A. Bhuiyan, Bangladesh Agriculture University, for granting permission to use Bangladeshi chicken samples, and Chiemela Peter for providing the Nigerian local chicken Samples. Finally, J. E. Fulton, Hy-Line International Molecular Genetics laboratory, Dallas Center, IA, USA for providing the DNA samples of MHC-B standard used this study.

Conflicts of Interest

The authors declare no conflict of interest.

References

  1. Sommer, S. The importance of immune gene variability MHC in evolutionary ecology and conservation. Front. Zool. 2005, 2, 1–18. [Google Scholar] [CrossRef] [Green Version]
  2. Kaufman, J.; Jacob, J.; Shaw, J.; Walker, B.; Milne, S.; Beck, S.; Salomonsen, J. Gene organization determines evolution of function in the chicken MHC. Immunol. Rev. 1999, 167, 101–117. [Google Scholar] [CrossRef]
  3. Kaufman, J. The Avian MHC. In Avian Immunology, 2nd ed.; Schat, K.A., Kaspers, B., Kaiser, P., Eds.; Academic Press: Cambridge, MA, USA, 2014; pp. 149–167. [Google Scholar] [CrossRef]
  4. Piertney, S.B.; Oliver, M.K. The evolutionary ecology of the major histocompatibility complex. Heredity 2006, 96, 7–21. [Google Scholar] [CrossRef] [Green Version]
  5. Minias, P.; Pikus, E.; Whittingham, L.A.; Dunn, P.O. A global analysis of selection at the avian MHC. Evolution 2018, 72, 1278–1293. [Google Scholar] [CrossRef]
  6. Schwensow, N.; Fietz, J.; Dausmann, K.H.; Sommer, S. Neutral versus adaptive genetic variation in parasite resistance: Importance of major histocompatibility complex supertypes in a free-ranging primate. Heredity 2007, 99, 265–277. [Google Scholar] [CrossRef] [PubMed] [Green Version]
  7. Collin, H.; Burri, R.; Comtesse, F.; Fumagalli, L. Combining molecular evolution and environmental genomics to unravel adaptive processes of MHC class IIB diversity in european minnows phoxinus phoxinus. Ecol. Evol. 2013, 3, 2568–2585. [Google Scholar] [CrossRef] [PubMed]
  8. Sun, Y.; Liu, Z.; Ren, L.; Wei, Z.; Wang, P.; Li, N.; Zhao, Y. Immunoglobulin genes and diversity: What we have learned from domestic animals. J. Anim. Sci. Biotechnol. 2012, 3, 1–5. [Google Scholar] [CrossRef] [Green Version]
  9. Hedrick, P.W. Pathogen resistance and genetic variation at MHC loci. Evolution 2002, 56, 1902–1908. [Google Scholar] [CrossRef] [PubMed]
  10. Banat, G.R.; Tkalcigrc, S.; Dzielawa, J.A.; Jackwood, M.W.; Saggese, M.D.; Yates, L.; Kopulos, R.; Briles, W.E.; Collisson, E.W. Association of the chicken MHC B haplotypes with resistance to avian coronavirus. Dev. Comp. Immunol. 2013, 39, 430–437. [Google Scholar] [CrossRef]
  11. Miller, M.M.; Taylor, R.L., Jr. Brief review of the chicken Major Histocompatibility Complex: The genes, their distribution on chromosome 16, and their contributions to disease resistance distribution on chromosome 16, and their contributions to disease resistance. Poult. Sci. 2016, 95, 375–392. [Google Scholar] [CrossRef] [PubMed]
  12. Bettridge, J.M.; Psifidi, A.; Terfa, Z.G.; Desta, T.T.; Lozano-Jaramillo, M.; Dessie, T.; Kaiser, P.; Wigley, P.; Hanotte, O.; Christley, R.M. The role of local adaptation in sustainable production of village chickens. Nat. Sustain. 2018, 1, 574–582. [Google Scholar] [CrossRef] [PubMed]
  13. Walugembe, M.; Bertolini, F.; Dematawewa, C.M.B.; Reis, M.P.; Elbeltagy, A.R.; Schmidt, C.J.; Lamont, S.J.; Rothschild, M.F. Detection of selection signatures among Brazilian, Sri Lankan, and Egyptian chicken populations under different environmental conditions. Front. Genet. 2019, 9, 737. [Google Scholar] [CrossRef] [PubMed] [Green Version]
  14. Seroussi, E.; Knytl, M.; Pitel, F.; Elleder, D.; Krylov, V.; Leroux, S.; Morisson, M.; Yosefi, S.; Miyara, S.; Ganesan, S.; et al. Avian Expression Patterns and Genomic Mapping Implicate Leptin in Digestion and TNF in Immunity, Suggesting That Their Interacting Adipokine Role Has Been Acquired Only in Mammals. Int. J. Mol. Sci. 2019, 20, 4489. [Google Scholar] [CrossRef] [Green Version]
  15. Lwelamira, J.; Kifaro, G.C.; Gwakisa, P.S.; Msoffe, P.L.M. Association of LEI0258 microsatellite alleles with antibody response against newcastle disease virus vaccine and body weight in two Tanzania chicken ecotypes. Afr. J. Biotechnol. 2008, 7, 714–720. [Google Scholar]
  16. Matsuzaka, Y.; Makino, S.; Nakajima, K.; Tomizawa, M.; Oka, A.; Bahram, S.; Kulski, J.K.; Tamiya, G.; Inoko, H. New polymorphic microsatellite markers in the human MHC class III region. Tissue Antigens 2001, 57, 397–404. [Google Scholar] [CrossRef] [PubMed]
  17. Gourraud, P.A.; Mano, S.; Barnetche, T.; Carrington, M.; Inoko, H.; Cambon-Thomsen, A. Integration of microsatellite characteristics in the MHC region: A literature and sequence based analysis. Tissue Antigens 2004, 64, 543–555. [Google Scholar] [CrossRef]
  18. Tanaka, M.; Ando, A.; Renard, C.; Chardon, P.; Domuki, M.; Okumura, N.; Awata, T.; Uenishi, H. Development of dense microsatellite markers in the entire SLA region and evalustion of their polymorphism in pocine breeds. Immunogenetics 2005, 57, 690–696. [Google Scholar] [CrossRef]
  19. Crooijmans, R.P.M.A.; Dijkhof, R.J.M.; van der Poel, J.J.; Groenen, M.A.M. New microsatellite markers in chicken optimised for automated fluorescent genotyping. Anim. Genet. 1997, 28, 427–437. [Google Scholar] [CrossRef]
  20. McConnell, S.K.J.; Dawson, D.A.; Wardle, A.; Burke, T. The isolation and mapping of 19 tetranucleotide microsatellite markers in the chicken. Anim. Genet. 1999, 30, 183–189. [Google Scholar] [CrossRef]
  21. Buitenhuis, A.J.; Rodenburg, T.B.; Van Hierden, Y.M.; Siwek, M.; Cornelissen, S.J.B.; Nieuwland, M.G.B.; Crooijmans, R.P.M.A.; Groenen, M.A.M.; Koene, P.; Korte, S.M.; et al. Mapping quantitative trait loci affecting feather pecking behavior and stress response in laying hens. Poult. Sci. 2003, 82, 1215–1222. [Google Scholar] [CrossRef] [PubMed]
  22. Fulton, J.E.; Juul-Madsen, H.R.; Ashwell, C.M.; McCarron, A.M.; Arthur, J.A.; O’Sullivan, N.P.; Taylor, R.L. Molecular genotype identification of the Gallus gallus major histocompatibility complex. Immunogenetics 2006, 58, 407–421. [Google Scholar] [CrossRef]
  23. Sironi, L.; Williams, J.L.; Stella, A.; Minozzi, G.; Moreno, A.; Ramelli, P.; Han, J.; Weigend, S.; Wan, J.; Lombardi, G.; et al. Genomic study of the response of chicken to highly pathogenic avian influenza virus. BMC Proc. 2011, 5, S25. [Google Scholar] [CrossRef] [Green Version]
  24. Chazara, O.; Juul-Madsen, H.; Chang, C.S.; Tixier-Boichard, M.; Bed’hom, B. Correlation in chicken between the marker LEI0258 alleles and Major Histocompatibility Complex sequences. BMC Proc. 2011, 4, S29. [Google Scholar] [CrossRef] [Green Version]
  25. Chazara, O.; Chang, C.S.; Bruneau, N.; Benabdeljelil, K.; Fotsa, J.C.; Kayang, B.B.; Loukou, N.E.; Osei-Amponsah, R.; Yapi-Gnaore, V.; Youssao, I.A.K.; et al. Diversity and evolution of the highly polymorphic tandem repeat LEI0258 in the chicken MHC-B region. Immunogenetics 2013, 65, 447–459. [Google Scholar] [CrossRef] [PubMed]
  26. Han, B.; Lian, L.; Qu, L.; Zheng, J.; Yang, N. Abundant polymorphisms at the microsatellite locus LEI0258 in indigenous chickens. Poult. Sci. 2013, 92, 3113–3119. [Google Scholar] [CrossRef]
  27. Nikbakht, G.; Esmailnejad, A. Chicken major histocompatibility complex polymorphism and its association with production traits. Immunogenetics 2015, 67, 247–252. [Google Scholar] [CrossRef] [PubMed]
  28. Zhang, L.; Li, P.; Liu, R.; Zheng, M.; Sun, Y.; Wu, D.; Hu, Y.; Wen, J.; Zhao, G. The identification of loci for immune traits in chickens using a genome-wide association study. PLoS ONE 2015, 30, e0117269. [Google Scholar] [CrossRef]
  29. Rashid, M.A.; Manjula, P.; Farque, S.; Bhuiyan, A.K.F.H.; Seo, D.; Alam, J.; Lee, J.H.; Bhuiyan, M.S.A. Genetic diversity and population structure of indigenous chicken of Bangladesh using microsatellite markers. Asian Autralas J. Anim. Sci. 2020, 11, 1732–1742. [Google Scholar] [CrossRef] [PubMed]
  30. Manjula, P.; Fulton, J.E.; Seo, D.; Lee, J.H. Major histocompatibility complex B (MHC-B) variability in Korean native chicken. Poult. Sci. 2020, 99, 4704–4713. [Google Scholar] [CrossRef] [PubMed]
  31. Benson, G. Tandem Repeats Database. 2016. Available online: Tandem.bu.edu/cgi-bin/trdb/trdb.exe (accessed on 14 May 2019).
  32. Matschiner, M.; Salzburger, W. TANDEM: Integrating automated allele binning into genetics and genomics workflows. Bioinformatics 2009, 25, 1982–1983. [Google Scholar] [CrossRef] [Green Version]
  33. Hosomichi, K.; Miller, M.M.; Goto, R.M.; Wang, Y.; Suzuki, S.; Kulski, J.K.; Nishibori, M.; Inoko, H.; Hanzawa, K.; Shiina, T. Contribution of mutation, recombination, and gene conversion to chicken MHC-B haplotype diversity. J. Immunol. 2008, 181, 3393–3399. [Google Scholar] [CrossRef] [PubMed] [Green Version]
  34. Shiina, T.; Briles, W.E.; Goto, R.M.; Hosomichi, K.; Yanagiya, K.; Shimizu, S.; Inoko, H.; Miller, M.M. Extended gene map reveals Tripartite Motif, C-Type Lectin, and Ig superfamily type genes within a subregion of the chicken MHC-B affecting infectious disease. J. Immunol. 2007, 178, 7162–7172. [Google Scholar] [CrossRef] [Green Version]
  35. Raymond, M.J.J.H. GENEPOP (version 1.2): Population genetics software for exact tests and ecumenicism. J. Hered. 1995, 86, 248–249. [Google Scholar] [CrossRef]
  36. Peakall, R.; Smouse, P.E. GenAlEx 6.5: Genetic analysis in Excel. Population genetic software for teaching and research-an update. Bioinformatics 2012, 28, 2537–2539. [Google Scholar] [CrossRef] [PubMed] [Green Version]
  37. Kalinowski, S.T.; Taper, M.L.; Marshall, T.C. Revising how the computer program CERVUS accommodates genotyping error increases success in paternity assignment. Mol. Ecol. 2007, 19, 1512. [Google Scholar] [CrossRef]
  38. Kalinowsky, S.T. Counting alleles with rarefaction: Private alleles and hierarchical sampling designs. Conserv. Gen. 2004, 5, 539–543. [Google Scholar] [CrossRef]
  39. Excoffier, L.; Lischer, H.E.L. Arlequin suite ver 3.5: A new series of programs to perform population genetics analyses under Linux and Windows. Mol. Ecol. Resour. 2010, 10, 564–567. [Google Scholar] [CrossRef]
  40. Nei, M.; Tajima, F.; Tateno, Y. Accuracy of estimated phylogenetic tree from molecular data. J. Mol. Evol. 1983, 19, 153–170. [Google Scholar] [CrossRef] [PubMed]
  41. Takezaki, N.; Nei, M.; Tamura, K. POPTREEW: Web Version of POPTREE for Constructing Population Trees from Allele Frequency Data and Computing Other Population Statistics. 2014. Available online: http://www.med.kagawau.ac.jp/~genomelb/takezaki/poptreew/index.html (accessed on 15 November 2020).
  42. Molamane, D.K.; Simianer, H.; Weigend, A.; Reimer, C.; Schmitt, A.O.; Weigend, S. The SYNBREED chicken diversity panel: A global resource to assess chicken diversity at high genomic resolution. BMC Genom. 2019, 20, 345. [Google Scholar] [CrossRef] [Green Version]
  43. Kirk, H.; Freeland, J.R. Applications and implications of neutral versus non-neutral markers in molecular ecology. Int. J. Mol. Sci. 2011, 12, 3966–3988. [Google Scholar] [CrossRef] [Green Version]
  44. Mwambene, P.L.; Kyallo, M.; Machuka, E.; Githae, D.; Pelle, R. Genetic diversity of 10 indigenous chicken ecotypes from Southern Highlands of Tanzania based on Major Histocompatibility Complex-linked microsatellite LEI0258 marker typing. Poult. Sci. 2019, 98, 2734–2746. [Google Scholar] [CrossRef]
  45. Chapuis, M.; Estoup, A. Microsatellite Null Alleles and Estimation of Population Differentiation. Mol. Bio. Evol. 2007, 24, 621–631. [Google Scholar] [CrossRef] [PubMed] [Green Version]
  46. Gray, I.C. From linkage peak to curlprit gene: Following up linkage analysis of complex phenotypes with population based association studies. In Bioinformatics for Geneticists; Barnes, M.C., Gray, I.C., Eds.; John Wiley & Sons: West Sussex, UK, 2003; Volume 8, pp. 166–178. [Google Scholar]
  47. Silva, P.; Liyanage, R.P.; Senadheera, R.; Dematawewa, C.M.B. Monograph on Indigenous Chicken in Sri Lanka; UNEP-GEF-ILRI FAnGR Asia Project; University of Peradeniya: Kandi, Sri Lanka, 2016; pp. 1–74. [Google Scholar]
  48. Manjula, P.; Fulton, J.E.; Seo, D.; Lee, J.H. Comparison of Major histocompatibility complex B variability in Sri Lankan indigenous chickens with five global chicken populations using MHC-B SNP panel. Anim. Gent. 2021; under review. [Google Scholar]
  49. Manjula, P.; Bed’Hom, B.; Hoque, M.R.; Cho, S.; Seo, D.; Chazara, O.; Lee, S.H.; Lee, J.H. Genetic diversity of MHC-B in 12 chicken populations in Korea revealed by single nucleotide polymorphisms. Immunogenetics 2020, 72, 367–379. [Google Scholar] [CrossRef] [PubMed]
  50. Jin, S.; Jayasena, D.D.; Jo, C.; Lee, J.H. The breeding history and commercial development of the Korean native chicken. World’s Poult. Sci. J. 2017, 73, 163–174. [Google Scholar] [CrossRef]
  51. Greenbaum, G.; Templeton, A.R.; Zarmi, Y.; Bar-David, S. Allelic Richness following Population Founding Events—A Stochastic Modeling Framework Incorporating Gene Flow and Genetic Drift. PLoS ONE 2014, 9, e115203. [Google Scholar] [CrossRef] [PubMed] [Green Version]
  52. Petit, R.J.; El Mousadik, A.; Pons, O. Identifying populations for conservation on the basis of genetic markers. Conserv. Biol. 1998, 12, 844–855. [Google Scholar] [CrossRef]
  53. Caballero, A.; Garcia-Dorado, A. Allelic diversity and its implications for the rate of adaptation. Genetics 2013, 11, 158410. [Google Scholar] [CrossRef] [PubMed] [Green Version]
  54. Radwan, J.; Babik, W.; Kaufman, J.; Lenz, T.L.; Winternitz, J. Advances in the Evolutionary understanding of MHC polymorphism. Trends Genet. 2020, 36, 298–311. [Google Scholar] [CrossRef] [Green Version]
  55. Bodmer, W.F. Evolutionary significance of the HL-A system. Nature 1972, 237, 139–145. [Google Scholar] [CrossRef]
  56. Jaworska, J.; Molik, K.R.; Potocka, I.W.; Siemieniuch, M. Inter- and intrabreed diversity of the major histocompatibility complex MHC in primitive and draft horse breeds. PLoS ONE 2020, 15, e0228658. [Google Scholar] [CrossRef] [Green Version]
  57. Fulton, J.E.; Lund, A.R.; Mccarron, A.M.; Pinegar, K.N.; Korver, D.R.; Classen, H.L.; Aggrey, S.; Utterbach, C.; Anthony, N.B.; Berres, M.E. MHC variability in heritage breeds of chickens. Poult. Sci. 2016, 95, 393–399. [Google Scholar] [CrossRef] [PubMed]
  58. Gao, C.; Han, L.; Han, J.; Liu, J.; Jiang, Q.; Guo, D.; Qu, L. Establishment of six homozygous MHC-B haplotype populations associated with susceptibility to Marek’s disease in Chinese specific pathogen-free BWEL chickens. Infect. Genet. Evol. 2014, 29, 15–25. [Google Scholar] [CrossRef] [PubMed]
Figure 1. A graphical representation of microsatellite markers identified in chicken major histocompatibility complex (MHC)-B region. The loci in blue colour letters are novel microsatellite (MS) markers identified in this study (Set 1) whereas the markers in black colour letters are reported in the literature (Set 2). Physical positions and distance between the markers (not in the exact scale) are based on the sequence of GenBank accession number: NC_006103.5.
Genes 12 00240 g001
Figure 2. The Neighbour-joining tree of 29 populations constructed based on DA distance using Set 2 MHC-B microsatellite markers. The population abbreviations are defined in Supplementary Table S2.
Genes 12 00240 g002
Figure 3. Mean allelic patterns of Set 2 microsatellite markers across the populations grouped based on their production systems. Na: number of different alleles; Ne: mean number of effective alleles; Na. Freq. ≥ 5%: number of alleles with more than 5% allele frequency; He: expected heterozygosity and uHe: unbiased expected heterozygosity.
Genes 12 00240 g003
Table 1. Summary of 11 microsatellite markers used in this study.
MarkerRangeNNaHoHePICFISF (null)HWE
MHC-S1 a231–26316640.2050.4020.3680.3800.313***
MHC-S2 a227–23318130.0000.0330.0321.0000.443nd
MHC-S3 a205–20817620.2160.3260.2720.0430.202***
MHC-S4 a214–22318640.0810.0940.092−0.1970.093nd
MHC-S5 a255–27018550.2760.3150.277−0.0270.064ns
MHC-T b232–24076850.3620.5170.4510.0870.160***
MCW0312 b210–21886740.3790.4940.406−0.0550.134***
MHC-D b307–31987050.6320.7420.694−0.0460.079***
LEI0258 b193–539879380.7820.9180.912−0.0340.080***
MCW0371 b200–210877100.4290.8080.7840.3710.313***
MCW0370 b168–182816120.3080.8370.8180.5250.465***
a Novel microsatellite markers identified in this study (Set 1); b microsatellite markers found in the literature (Set 2); N: number of samples; Na: number of identified alleles; Ho: observed heterozygosity; He: expected heterozygosity; PIC: polymorphic information content; FIS: MHC-linked microsatellite locus inbreeding coefficient; F (null): null allele frequency; HWE: a departure from the Hardy–Weinberg equilibrium (significance with Bonferroni correction; *** p < 0.0001; nd: not detected; ns: not significant).
Table 2. Mean allele number, allele richness, observed and expected heterozygosity values for Set 1 microsatellite markers in 21 populations.
Pop Code 1NaNeARHoHeF
KNC1.81.231.320.1040.1650.316
YO1.81.391.720.2460.207−0.175
YCC1.81.161.560.1070.1150.036
CC11.61.221.490.1250.1420.077
CC21.41.241.390.1000.1500.166
CC31.81.451.670.1710.2040.220
CC41.41.341.380.0750.1270.135
KA1.81.341.660.1750.2110.123
TA2.01.471.820.1590.2380.284
ND2.01.631.830.3000.305−0.006
NN1.41.291.390.1040.1660.407
AS2.01.561.910.4250.345−0.103
HI2.01.431.760.2320.2400.009
JF1.81.271.800.1820.191−0.011
ADOL1.41.071.760.0620.057−0.084
RIR1.61.361.590.2330.225−0.037
WL1.41.371.400.2190.192−0.133
HY1.61.191.760.1230.1320.373
IR1.81.521.530.0000.2781.000
Ross1.21.091.180.0250.0610.590
Ab1.41.161.360.0860.1160.364
Mean1.671.34 0.1540.1840.147
1 Population abbreviations are defined in Supplementary Table S2; Na = mean number of different alleles; Ne = mean number of effective alleles (Ne: 1/(1 − He); AR: mean allele richness per population estimated based on the minimum number of sample size; according to Kalinowsky [38]; Ho: observed heterozygosity; He: expected heterozygosity; F: fixation index (1 − (Ho/He)).
Table 3. Mean allele number, allele richness, observed and expected heterozygosity values for Set 2 microsatellite markers in 29 populations.
Pop Code 1NNaNeARHoHeFFIS
NG49.673.672.302.980.3900.4850.2040.0585
NL49.673.672.382.870.5230.5460.020−0.0390
NR43.174.503.103.750.5080.5870.1620.0307
NW47.175.002.563.730.4630.5600.1460.1348
NY50.004.333.313.820.5740.6390.0540.1193
NO45.003.832.052.940.3380.4680.3780.0682
YO59.335.172.813.790.4090.5820.2930.1242
YCC47.835.833.104.000.5530.6120.0810.0114
CC119.833.832.793.420.6890.615−0.114−0.1023
CC220.004.332.763.630.4750.5960.1900.1849
CC319.004.003.173.710.5690.6440.1020.0415
CC420.004.332.993.860.5250.5610.018−0.0689
KA18.836.505.105.430.6520.7350.0670.0992
NU17.836.334.045.020.4470.6500.3060.1983
TA34.178.174.194.960.4950.6570.2590.1559
ND36.005.503.224.050.4690.6500.2640.1396
NN45.175.172.263.290.3640.5310.3090.2137
AS16.835.833.794.900.5110.7040.2770.1979
HI38.176.333.994.860.5940.6790.1480.0866
JF18.333.672.563.320.2990.5300.4080.3778
NIG18.506.003.734.770.5070.6450.2060.0145
RIR14.002.331.862.300.4520.412−0.109−0.1513
WL15.502.331.682.310.2650.3420.3450.1266
HY18.673.502.022.910.3390.4210.0810.0623
LO19.173.002.312.800.4290.4950.060−0.0913
IR15.674.503.123.970.6310.614−0.056−0.0126
Ross15.674.832.573.740.5510.533−0.024−0.0334
Ab16.674.002.253.270.4680.5310.1010.12057
Cobb16.334.503.143.920.5810.6200.0210.11709
1 Populations abbreviations are defined in Supplementary Table S2; N: mean number of samples; Na: mean number of different alleles; Ne: mean number of effective alleles (Ne: 1/(1 − He); AR: mean allele richness per population estimated based on the minimum number of sample size according to Kalinowsky [38]; Ho: observed heterozygosity; He: expected heterozygosity; F: fixation index (heterozygosity deficient (1 − (Ho/He)); FIS: populations specific FIS (1023 permutations).
Table 4. Analysis of molecular variance (AMOVA) by locus, groups based on the country of origin using Set 2 microsatellite markers.
Source of Variation 1d.f.Variance
Component
% VarianceFixation
Index
Significance (p-Value)
Among groups6219.223.26FST = 0.1150.000
Among populations within groups22557.338.28FSC = 0.0860.000
Within populations14735955.9588.47FCT = 0.0330.081
1 Variance components were calculated using only five polymorphic loci in the Set 2 microsatellite markers; d.f.: degree of freedom; FST: proportion of genetic variation within populations, FSC: variation among populations within groups, FCT: variation among groups (seven groups were set based on their origin).
Table 5. Allele number and allele richness and unbiased expected heterozygosity difference for Set 2 MS markers in chicken populations grouped by their production systems.
Genetic Diversity
Production System 1MarkerN 2Number of AllelesAllele Richness 3uHe
Backyard/Semi-intensive systemMHC-T29142.790.521
MHC031231442.680.459
LEI0258316337.880.926
MHC-D31553.710.741
MCW0371315105.050.766
MCW0370308114.620.817
4 Mean (SE) 309.8311.17 (4.54)4.46 (0.79)0.705
MarkerNNumber of allelesAllele richnessuHe
Intensive system
for native chicken
MHC-T37652.050.512
MHC031245342.040.527
LEI0258459264.940.884
MHC-D45453.410.736
MCW0371458103.760.814
MCW0370412113.790.828
4 Mean (SE) 435.310.17 (3.38)3.33 (0.46)0.717
MarkerNNumber of allelesAllele richnessuHe
Intensive system for commercial chickenMHC-T10131.900.468
MHC031210021.970.249
LEI0258104185.460.861
MHC-D10143.240.674
MCW037110483.830.774
MCW037096104.230.790
4 Mean (SE) 101.007.5 (2.45)3.44(0.56)0.636
1 Production systems are as defined in Supplementary Table S1; 2 number of samples; 3 allele richness per population estimated based on the minimum number of sample size; 4 mean value with standard deviation in brackets; uHe: unbiased Expected Heterozygosity = (2N / (2N − 1)) × He.
Table 6. Number of MHC-B haplotypes identified using Set 2 microsatellite markers.
Pop Code 1Total N. ha 2N ha 3 (F > 5%)Unique Haplotypes 4
RIR440
WL13911
NG40429
NL22413
NR1795
NW1757
NY2274
NO1354
YOG34520
HI32321
ND36324
NN18411
AS26322
JF14713
KA31419
NU24819
TA46130
NIG20714
YCC2757
CC11463
CC21575
CC31683
CC41987
IN1464
Ab1384
Cobb1567
Ross1946
HL1366
LO1261
1 Populations abbreviations are defined in Supplementary Table S2; 2 total number of haplotypes identified; 3 number of different haplotypes in each population with >5% haplotype frequencies; 4 haplotypes that observed only in one population.
Publisher’s Note: MDPI stays neutral with regard to jurisdictional claims in published maps and institutional affiliations.

