
Phenotypic Response to Light Versus Shade Associated with DNA Methylation Changes in Snapdragon Plants (Antirrhinum majus)


 and
and 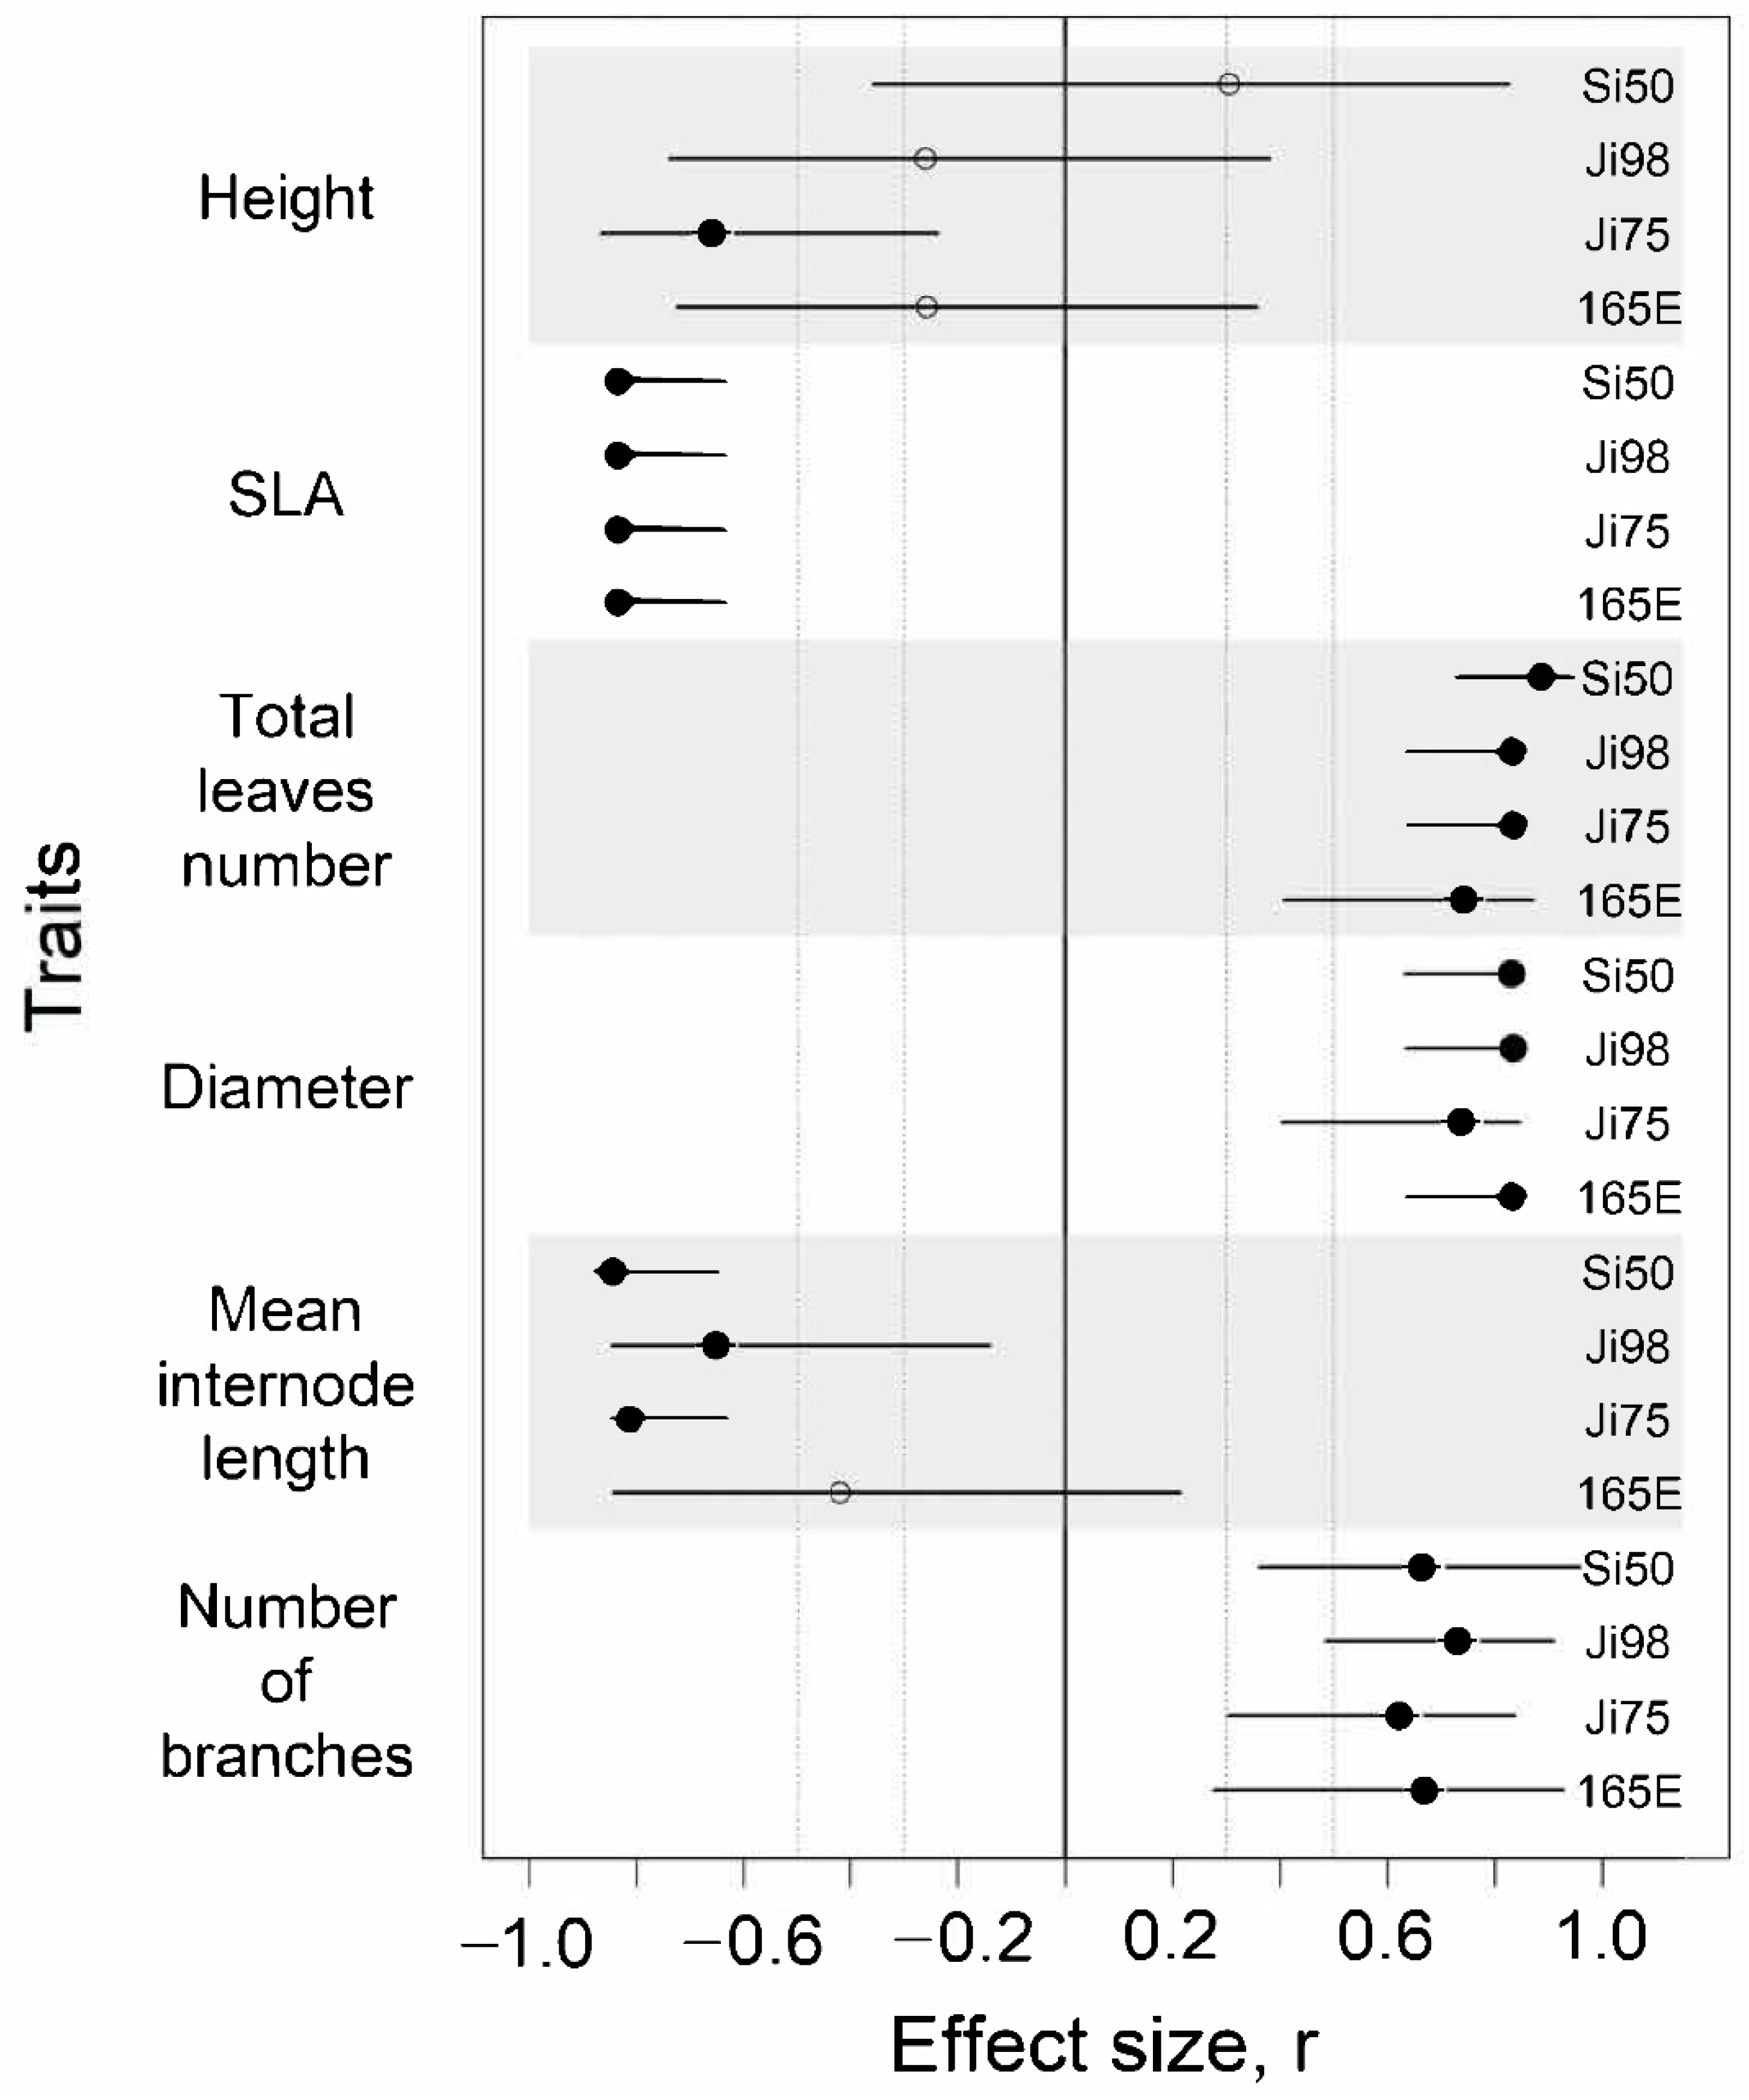
Abstract
1. Introduction
1.1. Calling for Ecologically Relevant Tests of the Epigenetic Basis of Phenotypic Plasticity
1.2. Separating Genetic and Epigenetic Effects
1.3. Snapdragon Plants: The Road So Far
2. Materials and Methods
2.1. Study System
2.2. Experiment
2.3. Adult Plant Phenotypic Measurements
2.4. Second Round of Stem Growth for Plants Sampled for Tissue
2.5. Epigenetic Analysis
2.6. Bioinformatics
2.7. Statistical Analysis
3. Results
3.1. Phenotypic Response to Light Versus Shade Treatment
3.2. PCA Summary of DNA Methylation Data
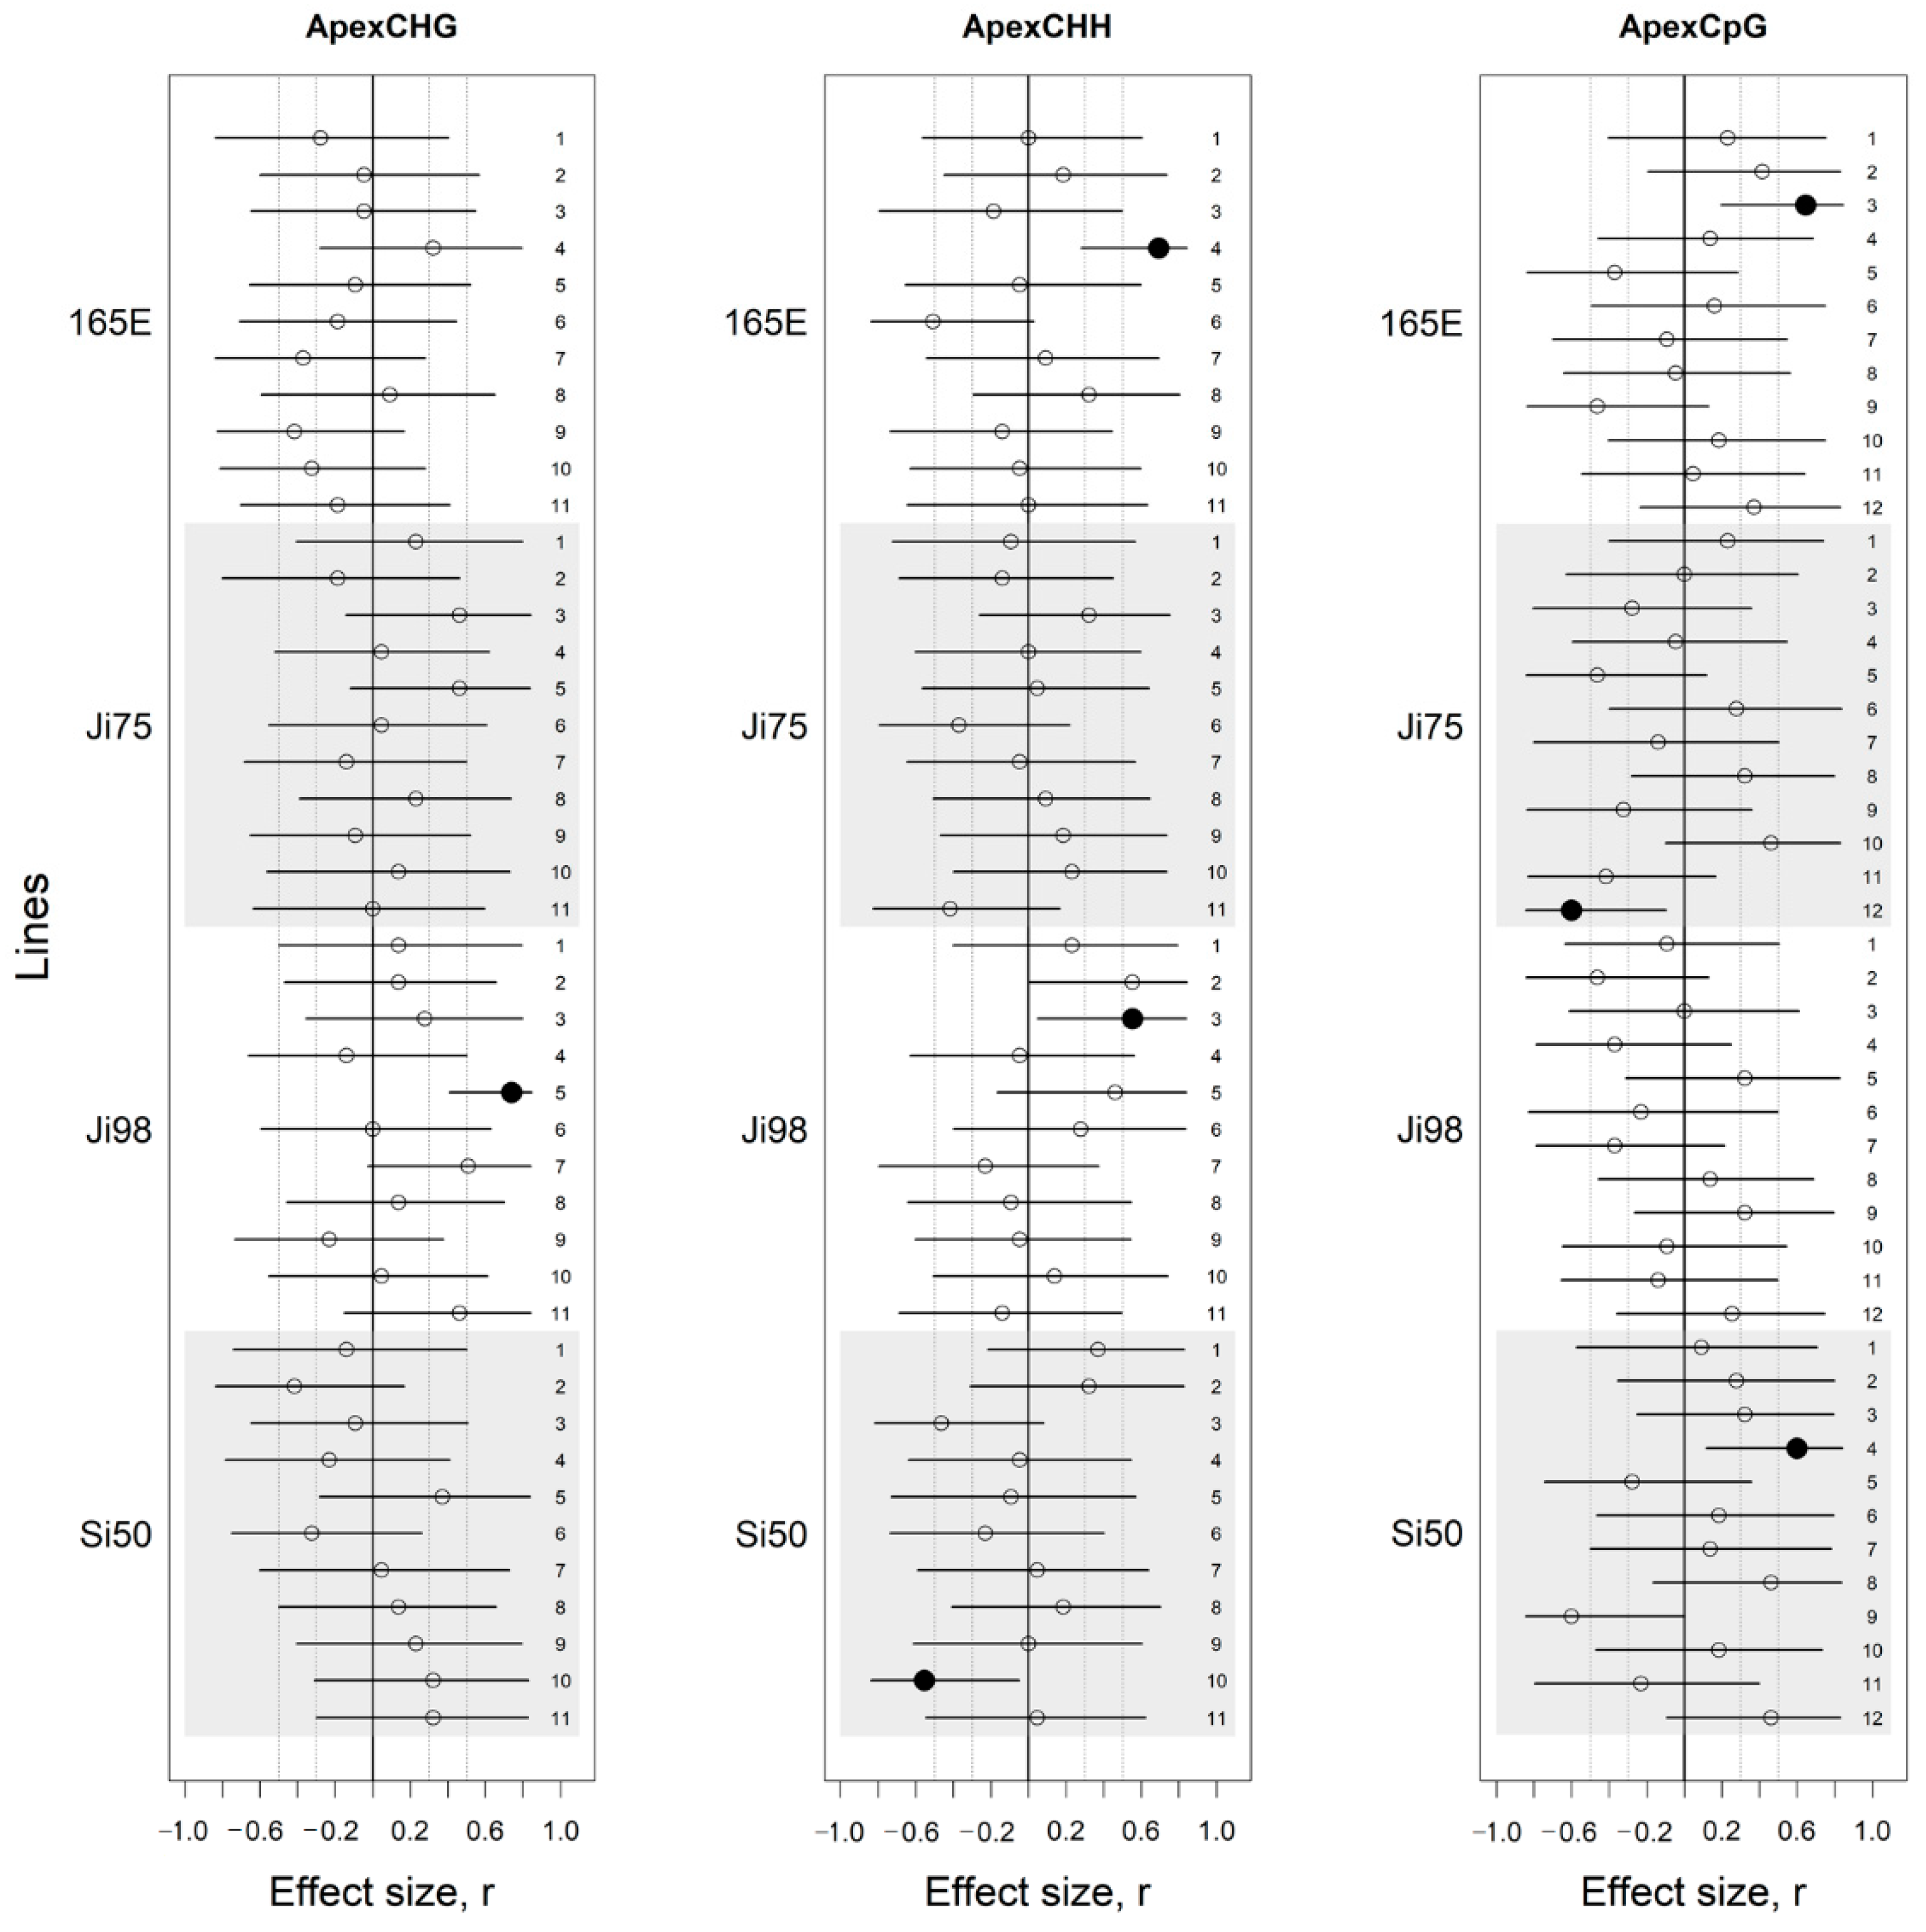
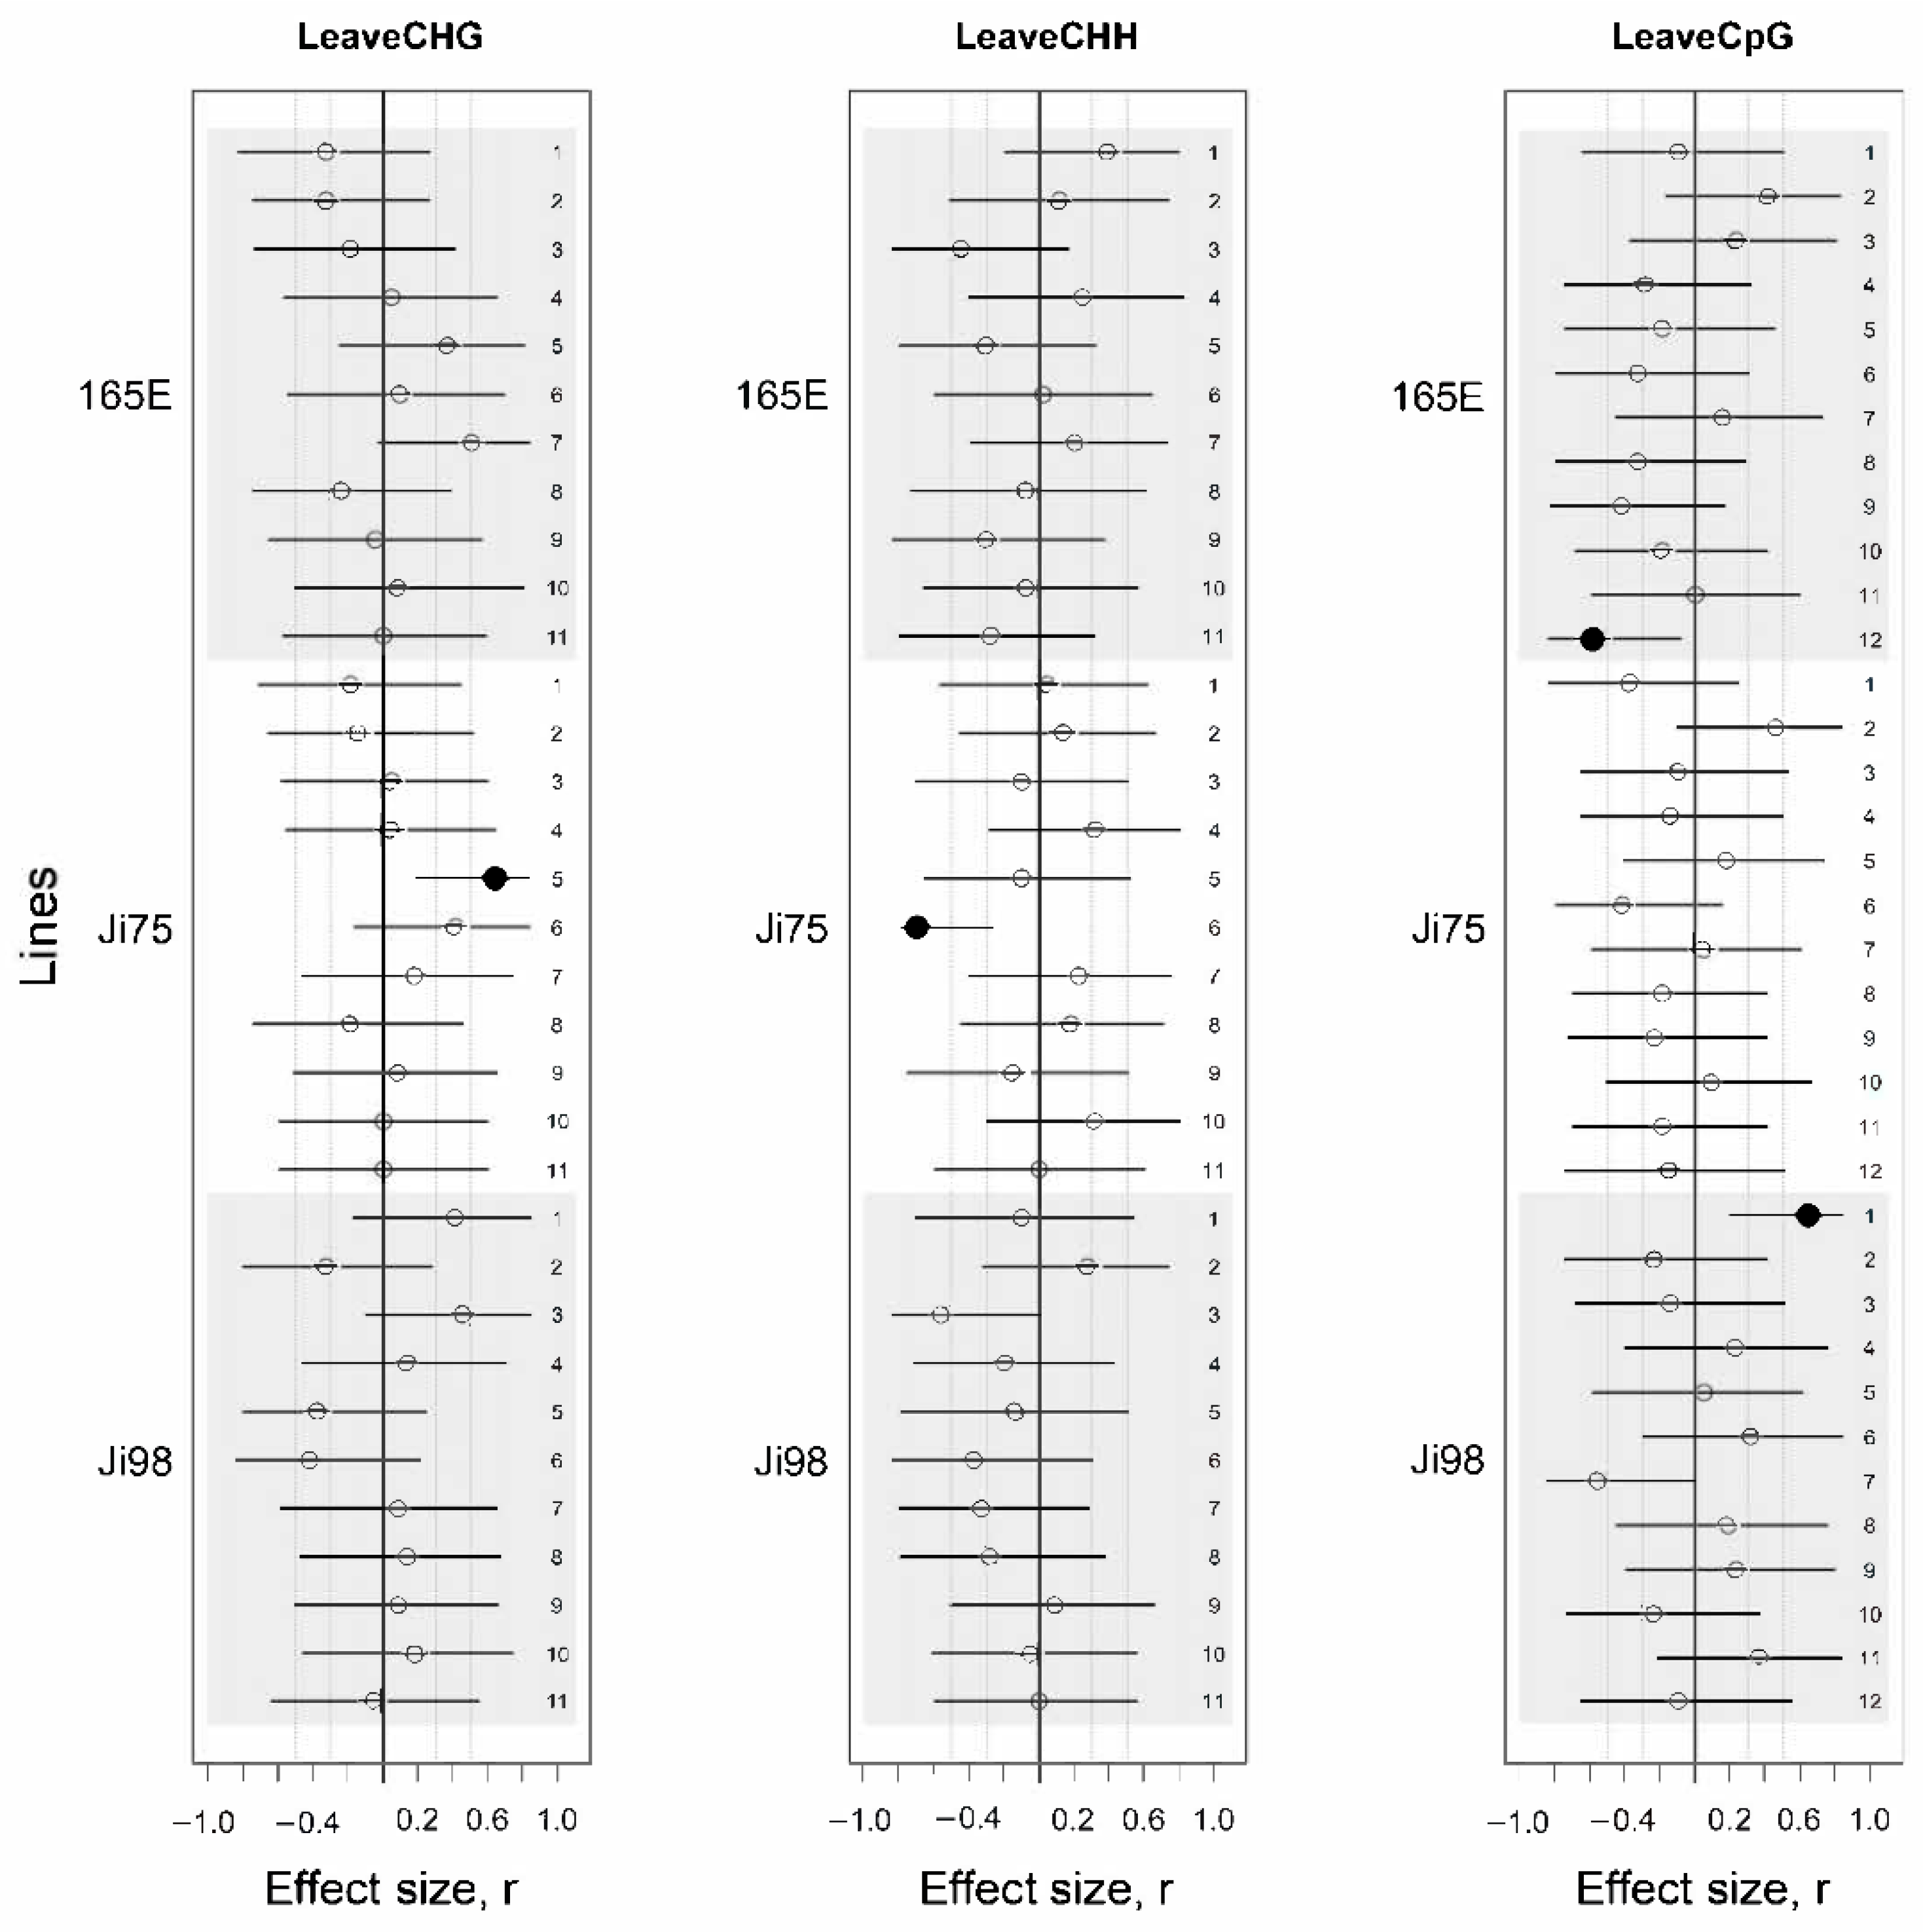
3.3. DNA Methylation Association with Light Versus Shade Treatment and Phenotypic Variation
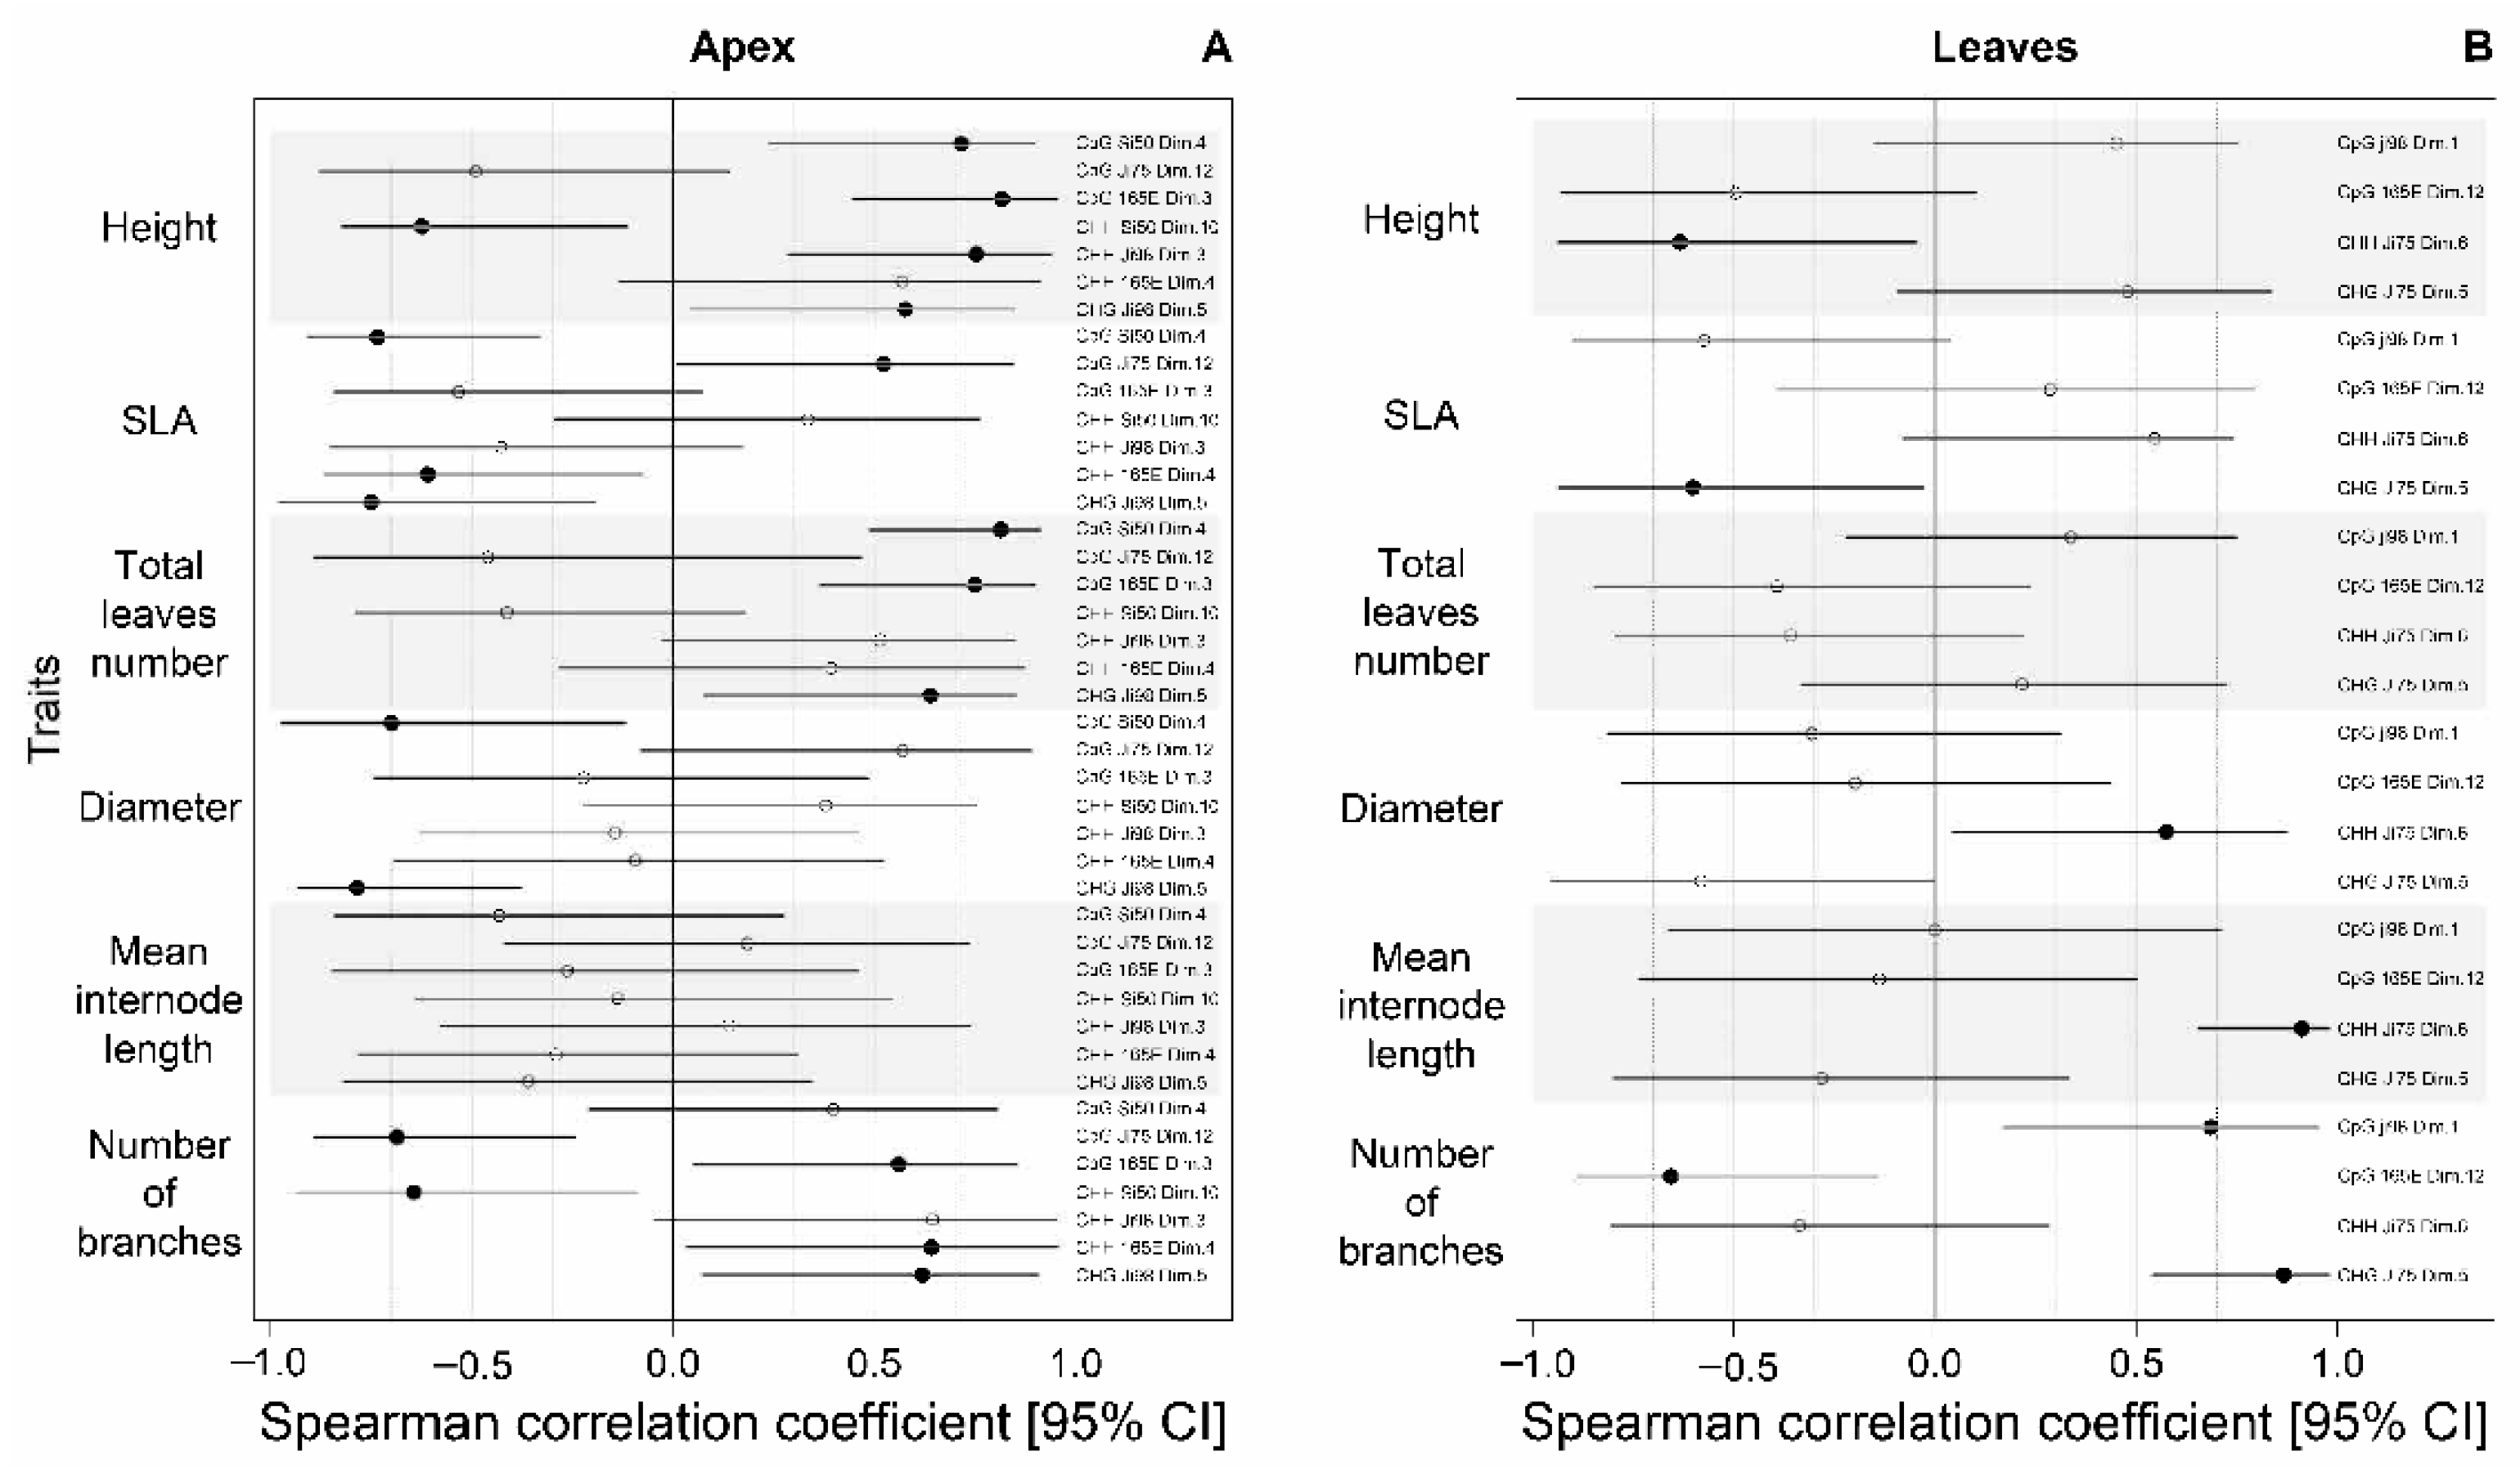
3.4. Association between Phenotypic Differences and DNA Methylation Changes
4. Discussion
4.1. Phenotypic Plasticity
4.2. Epigenetic Response to Light Versus Shade
4.3. The Epigenetic Basis of Phenotypic Variation or Lack Thereof
5. Conclusions
Supplementary Materials
Author Contributions
Funding
Data Availability Statement
Acknowledgments
Conflicts of Interest
References
- Mousset, M.; Marin, S.; Archambeau, J.; Blot, C.; Bonhomme, V.; Garaud, L.; Pujol, B. Genetic variation underlies the plastic response to shade of snapdragon plants (Antirrhinum majus L.). Bot. Lett. 2020. [Google Scholar] [CrossRef]
- Ballare, C.L.; Pierik, R. The shade-avoidance syndrome: Multiple signals and ecological consequences. Plant Cell Environ. 2017, 40, 2530–2543. [Google Scholar] [CrossRef] [PubMed]
- Pierik, R.; Testerink, C. The art of being flexible: How to escape from shade, salt, and drought. Plant Physiol. 2014, 166, 5–22. [Google Scholar] [CrossRef] [PubMed]
- Schmitt, J.; Stinchcombe, J.R.; Heschel, M.S.; Huber, H. The adaptive evolution of plasticity: Phytochrome-mediated shade avoidance responses. Integr. Comp. Biol. 2003, 43, 459–469. [Google Scholar] [CrossRef] [PubMed]
- Bell, D.L.; Galloway, L.F. Plasticity to neighbour shade: Fitness consequences and allometry. Funct. Ecol. 2007, 21, 1146–1153. [Google Scholar] [CrossRef]
- Sessa, G.; Carabelli, M.; Possenti, M.; Morelli, G.; Ruberti, I. Multiple pathways in the control of the shade avoidance response. Plants Basel Switz. 2018, 7, 102. [Google Scholar] [CrossRef] [PubMed]
- Donohue, K.; Schmitt, J. The genetic architecture of plasticity to density in Impatiens capensis. Evolution 1999, 53, 1377–1386. [Google Scholar] [CrossRef]
- Gourcilleau, D.; Mousset, M.; Latutrie, M.; Marin, S.; Delaunay, A.; Maury, S.; Pujol, B. Assessing Global DNA Methylation Changes Associated with Plasticity in Seven Highly Inbred Lines of Snapdragon Plants (Antirrhinum majus). Genes 2019, 10, 256. [Google Scholar] [CrossRef]
- Tatra, G.S.; Miranda, J.; Chinnappa, C.C.; Reid, D.M. Effect of light quality and 5-azacytidine on genomic methylation and stem elongation in two ecotypes of Stellaria longipes. Physiol. Plant. 2000, 109, 313–321. [Google Scholar] [CrossRef]
- Peng, M.; Li, Z.; Zhou, N.; Ma, M.; Jiang, Y.; Dong, A.; Shen, W.-H.; Li, L. Linking PHYTOCHROME-INTERACTING FACTOR to histone modification in plant shade avoidance. Plant Physiol. 2018, 176, 1341–1351. [Google Scholar] [CrossRef]
- Baulcombe, D.C.; Dean, C. Epigenetic regulation in plant responses to the environment. Cold Spring Harb. Perspect. Biol. 2014, 6, a019471. [Google Scholar] [CrossRef]
- Nicotra, A.B.; Atkin, O.K.; Bonser, S.P.; Davidson, A.M.; Finnegan, E.J.; Mathesius, U.; Poot, P.; Purugganan, M.D.; Richards, C.L.; Valladares, F.; et al. Plant phenotypic plasticity in a changing climate. Trends Plant Sci. 2010, 15, 684–692. [Google Scholar] [CrossRef]
- Mirouze, M.; Paszkowski, J. Epigenetic contribution to stress adaptation in plants. Curr. Opin. Plant Biol. 2011, 14, 267–274. [Google Scholar] [CrossRef]
- Richards, C.L.; Alonso, C.; Becker, C.; Bossdorf, O.; Bucher, E.; Colomé-Tatché, M.; Durka, W.; Engelhardt, J.; Gaspar, B.; Gogol-Döring, A.; et al. Ecological plant epigenetics: Evidence from model and non-model species, and the way forward. Ecol. Lett. 2017, 20, 1576–1590. [Google Scholar] [CrossRef]
- Liu, J.; Feng, L.; Li, J.; He, Z. Genetic and epigenetic control of plant heat responses. Front. Plant Sci. 2015, 6, 267. [Google Scholar] [CrossRef] [PubMed]
- Banerjee, A.; Wani, S.H.; Roychoudhury, A. Epigenetic control of plant cold responses. Front. Plant Sci. 2017, 8, 1643. [Google Scholar] [CrossRef] [PubMed]
- Danchin, E.; Pocheville, A.; Rey, O.; Pujol, B.; Blanchet, S. Epigenetically facilitated mutational assimilation: Epigenetics as a hub within the inclusive evolutionary synthesis. Biol. Rev. 2019, 94, 259–282. [Google Scholar] [CrossRef]
- Danchin, E.; Pujol, B.; Wagner, R.H. The double pedigree: A method for studying culturally and genetically inherited behavior in tandem. PLoS ONE 2013, 8, e61254. [Google Scholar] [CrossRef] [PubMed]
- Thomson, C.E.; Winney, I.S.; Salles, O.C.; Pujol, B. A guide to using a multiple-matrix animal model to disentangle genetic and nongenetic causes of phenotypic variance. PLoS ONE 2018, 13, e0197720. [Google Scholar] [CrossRef]
- van Gurp, T.P.; Wagemaker, N.C.A.M.; Wouters, B.; Vergeer, P.; Ouborg, J.N.J.; Verhoeven, K.J.F. epiGBS: Reference-free reduced representation bisulfite sequencing. Nat. Methods 2016, 13, 322–324. [Google Scholar] [CrossRef]
- Andalo, C.; Cruzan, M.B.; Cazettes, C.; Pujol, B.; Burrus, M.; Thébaud, C. Post-pollination barriers do not explain the persistence of two distinct Antirrhinum subspecies with parapatric distribution. Plant Syst. Evol. 2010, 286, 223–234. [Google Scholar] [CrossRef]
- Tavares, H.; Whibley, A.; Field, D.L.; Bradley, D.; Couchman, M.; Copsey, L.; Elleouet, J.; Burrus, M.; Andalo, C.; Li, M.; et al. Selection and gene flow shape genomic islands that control floral guides. Proc. Natl. Acad. Sci. USA 2018, 115, 11006–11011. [Google Scholar] [CrossRef]
- Khimoun, A.; Burrus, M.; Andalo, C.; Liu, Z.-L.; Vicédo-Cazettes, C.; Thébaud, C.; Pujol, B. Locally asymmetric introgressions between subspecies suggest circular range expansion at the Antirrhinum majus global scale. J. Evol. Biol. 2011, 24, 1433–1441. [Google Scholar] [CrossRef]
- Pujol, B.; Archambeau, J.; Bontemps, A.; Lascoste, M.; Marin, S.; Meunier, A. Mountain landscape connectivity and subspecies appurtenance shape genetic differentiation in natural plant populations of the snapdragon (Antirrhinum majus L.). Bot. Lett. 2017, 164, 111–119. [Google Scholar] [CrossRef]
- Khimoun, A.; Cornuault, J.; Burrus, M.; Pujol, B.; Thebaud, C.; Andalo, C. Ecology predicts parapatric distributions in two closely related Antirrhinum majus subspecies. Evolut. Ecol. 2013, 27, 51–64. [Google Scholar] [CrossRef]
- Marin, S.; Gibert, A.; Archambeau, J.; Bonhomme, V.; Lascoste, M.; Pujol, B. Potential adaptive divergence between subspecies and populations of snapdragon plants inferred from QST–FST comparisons. Mol Ecol. 2020, 29, 3010–3021. [Google Scholar] [CrossRef] [PubMed]
- Khattak, A.M.; Pearson, S. Light quality and temperature effects on Antirrhinum growth and development. J. Zhejiang Univ. Sci. B 2005, 6, 119–124. [Google Scholar] [CrossRef]
- Munir, M.; Jamil, M.; Baloch, J.; Khattak, K.R. Impact of light intensity on flowering time and plant quality of Antirrhinum majus L. cultivar Chimes White. J. Zhejiang Univ. Sci. A 2004, 5, 400–405. [Google Scholar] [CrossRef] [PubMed]
- Schneider, C.A.; Rasband, W.S.; Eliceiri, K.W. NIH Image to ImageJ: 25 years of image analysis. Nat. Methods 2012, 9, 671. [Google Scholar] [CrossRef] [PubMed]
- Kumar, S.; Beena, A.S.; Awana, M.; Singh, A. Salt-induced tissue-specific Cytosine methylation downregulates expression of HKT genes in contrasting wheat (Triticum aestivum L.) genotypes. DNA Cell Biol. 2017, 36, 283–294. [Google Scholar] [CrossRef]
- Zhang, M.; Xu, C.; von Wettstein, D.; Liu, B. Tissue-specific differences in Cytosine methylation and their association with differential gene expression in Sorghum. Plant Physiol. 2011, 156, 1955–1966. [Google Scholar] [CrossRef] [PubMed]
- Gawehns, F.; Postuma, M.; van Gurp, T.P.; Wagemaker, N.C.; Fatma, S.; Van Antro, M.; Mateman, C.; Milanovic-Ivanovic, S.; van Oers, K.; Vergeer, P.; et al. epiGBS2: An improved protocol and automated snakemake workflow for highly multiplexed reduced representation bisulfite sequencing. bioRxiv 2020. [Google Scholar] [CrossRef]
- Meröndun, J.; Murray, D.L.; Shafer, A.B.A. Genome-scale sampling suggests cryptic epigenetic structuring and insular divergence in Canada lynx. Mol. Ecol. 2019, 28, 3186–3196. [Google Scholar] [CrossRef] [PubMed]
- Luviano, N.; Lopez, M.; Gawehns, F.; Chaparro, C.; Arimondo, P.; Ivanovic, S.; David, P.; Verhoeven, K.; Cosseau, V.; Grunau, C. The methylome of Biomphalaria glabrata and other mollusks: Enduring modification of epigenetic landscape and phenotypic traits by a new DNA methylation inhibitor. Authorea Prepr. 2020. [Google Scholar] [CrossRef]
- Rueger, F. Trim Galore: A Wrapper Tool around Cutadapt and FastQC to Consistently Apply Quality and Adapter Trimming to FastQ Files, with Some Extra Functionality for MspI-Digested RRBS-Type (Reduced Representation Bisufite-Seq) Libraries. 2012. Available online: http://www.bioinformatics.babraham.ac.uk/projects/trim_galore/ (accessed on 30 December 2020).
- Li, M.; Zhang, D.; Gao, Q.; Luo, Y.; Zhang, H.; Ma, B.; Chen, C.; Whibley, A.; Zhang, Y.; Cao, Y.; et al. Genome structure and evolution of Antirrhinum majus L. Nat. Plants 2019, 5, 174. [Google Scholar] [CrossRef]
- Xi, Y.; Li, W. BSMAP: Whole genome bisulfite sequence MAPping program. BMC Bioinformatics 2009, 10, 232. [Google Scholar] [CrossRef]
- Akalin, A.; Kormaksson, M.; Li, S.; Garrett-Bakelman, F.E.; Figueroa, M.E.; Melnick, A.; Mason, C.E. methylKit: A comprehensive R package for the analysis of genome-wide DNA methylation profiles. Genome Biol. 2012, 13, R87. [Google Scholar] [CrossRef]
- Mangiafico, S. rcompanion: Functions to Support Extension Education Program Evaluation. Version 2.3. 21. 2020. Available online: https://CRAN.R-project.org/package=rcompanion (accessed on 30 December 2020).
- Hothorn, T.; Hornik, K.; van de Wiel, M.A.; Zeileis, A. Implementing a class of permutation tests: The coin package. J. Stat. Soft. 2008, 28, 1–23. [Google Scholar] [CrossRef]
- R Core Team. R: A Language and Environment for Statistical Computing. R Foundation for Statistical Computing. 2020. Available online: https://www.R-project.org/ (accessed on 30 December 2020).
- Ada, N.-L.; Farkash, L.; Hamburger, D.; Ovadia, R.; Forrer, I.; Kagan, S.; Michal, O.-S. Light-scattering shade net increases branching and flowering in ornamental pot plants. J. Hortic. Sci. Biotechnol. 2008, 83, 9–14. [Google Scholar] [CrossRef]
- Alonso, C.; Perez, R.; Bazaga, P.; Herrera, C.M. Global DNA cytosine methylation as an evolving trait: Phylogenetic signal and correlated evolution with genome size in angiosperms. Front. Genet. 2015, 6, 4. [Google Scholar] [CrossRef]
- Trap-Gentil, M.-V.; Hébrard, C.; Lafon-Placette, C.; Delaunay, A.; Hagège, D.; Joseph, C.; Brignolas, F.; Lefebvre, M.; Barnes, S.; Maury, S. Time course and amplitude of DNA methylation in the shoot apical meristem are critical points for bolting induction in sugar beet and bolting tolerance between genotypes. J. Exp. Bot. 2011, 62, 2585–2597. [Google Scholar] [CrossRef] [PubMed]
- Gourcilleau, D.; Bogeat-Triboulot, M.-B.; Le Thiec, D.; Lafon-Placette, C.; Delaunay, A.; El-Soud, W.A.; Brignolas, F.; Maury, S. DNA methylation and histone acetylation: Genotypic variations in hybrid poplars, impact of water deficit and relationships with productivity. Ann. For. Sci. 2010, 67, 208. [Google Scholar] [CrossRef]
- Richards, E.J. Population epigenetics. Curr. Opin. Genet. Dev. 2008, 18, 221–226. [Google Scholar] [CrossRef]
- Greally, J.M. Population epigenetics. Curr. Opin. Syst. Biol. 2017, 1, 84–89. [Google Scholar] [CrossRef]
- Lanciano, S.; Mirouze, M. Transposable elements: All mobile, all different, some stress responsive, some adaptive? Curr. Opin. Genet. Dev. 2018, 49, 106–114. [Google Scholar] [CrossRef]
- Haddad, N.M.; Brudvig, L.A.; Clobert, J.; Davies, K.F.; Gonzalez, A.; Holt, R.D.; Lovejoy, T.E.; Sexton, J.O.; Austin, M.P.; Collins, C.D.; et al. Habitat fragmentation and its lasting impact on Earth’s ecosystems. Sci. Adv. 2015, 1, e1500052. [Google Scholar] [CrossRef] [PubMed]
- Poyatos, R.; Latron, J.; Llorens, P. Land use and land cover change after agricultural abandonment. Mt. Res. Dev. 2003, 23, 362–368. [Google Scholar] [CrossRef]
- Pujol, B.; Salager, J.-L.; Beltran, M.; Bousquet, S.; McKey, D. Photosynthesis and leaf structure in domesticated cassava (Euphorbiaceae) and a close wild relative: Have leaf photosynthetic parameters evolved under domestication? Biotropica 2008, 40, 305–312. [Google Scholar] [CrossRef]
- Pujol, B.; Mühlen, G.; Garwood, N.; Horoszowski, Y.; Douzery, E.J.P.; McKey, D. Evolution under domestication: Contrasting functional morphology of seedlings in domesticated cassava and its closest wild relatives. New Phytol. 2005, 166, 305–318. [Google Scholar] [CrossRef] [PubMed]
- Richards, R.A. Selectable traits to increase crop photosynthesis and yield of grain crops. J. Exp. Bot. 2000, 51, 447–458. [Google Scholar] [CrossRef]
- Hlaváčová, M.; Klem, K.; Rapantová, B.; Novotná, K.; Urban, O.; Hlavinka, P.; Smutná, P.; Horáková, V.; Škarpa, P.; Pohanková, E.; et al. Interactive effects of high temperature and drought stress during stem elongation, anthesis and early grain filling on the yield formation and photosynthesis of winter wheat. Field Crops Res. 2018, 221, 182–195. [Google Scholar]


Publisher’s Note: MDPI stays neutral with regard to jurisdictional claims in published maps and institutional affiliations. |
© 2021 by the authors. Licensee MDPI, Basel, Switzerland. This article is an open access article distributed under the terms and conditions of the Creative Commons Attribution (CC BY) license (http://creativecommons.org/licenses/by/4.0/).
Share and Cite
Mouginot, P.; Luviano Aparicio, N.; Gourcilleau, D.; Latutrie, M.; Marin, S.; Hemptinne, J.-L.; Grunau, C.; Pujol, B. Phenotypic Response to Light Versus Shade Associated with DNA Methylation Changes in Snapdragon Plants (Antirrhinum majus). Genes 2021, 12, 227. https://doi.org/10.3390/genes12020227
Mouginot P, Luviano Aparicio N, Gourcilleau D, Latutrie M, Marin S, Hemptinne J-L, Grunau C, Pujol B. Phenotypic Response to Light Versus Shade Associated with DNA Methylation Changes in Snapdragon Plants (Antirrhinum majus). Genes. 2021; 12(2):227. https://doi.org/10.3390/genes12020227
Chicago/Turabian StyleMouginot, Pierick, Nelia Luviano Aparicio, Delphine Gourcilleau, Mathieu Latutrie, Sara Marin, Jean-Louis Hemptinne, Christoph Grunau, and Benoit Pujol. 2021. "Phenotypic Response to Light Versus Shade Associated with DNA Methylation Changes in Snapdragon Plants (Antirrhinum majus)" Genes 12, no. 2: 227. https://doi.org/10.3390/genes12020227
APA StyleMouginot, P., Luviano Aparicio, N., Gourcilleau, D., Latutrie, M., Marin, S., Hemptinne, J.-L., Grunau, C., & Pujol, B. (2021). Phenotypic Response to Light Versus Shade Associated with DNA Methylation Changes in Snapdragon Plants (Antirrhinum majus). Genes, 12(2), 227. https://doi.org/10.3390/genes12020227