Article

Long Noncoding RNA HOXA11-AS and Transcription Factor HOXB13 Modulate the Expression of Bone Metastasis-Related Genes in Prostate Cancer

1
Department of Molecular Medicine and Anatomy, Nippon Medical School, 1-1-5 Sendagi, Tokyo 113-8602, Japan
2
Department of Urology, Nippon Medical School, 1-1-5 Sendagi, Tokyo 113-8602, Japan
3
Department of Breast Surgical Oncology, Nippon Medical School, 1-1-5 Sendagi, Tokyo 113-8602, Japan
*
Author to whom correspondence should be addressed.
Genes 2021, 12(2), 182; https://doi.org/10.3390/genes12020182
Submission received: 1 December 2020 / Revised: 17 January 2021 / Accepted: 21 January 2021 / Published: 27 January 2021
(This article belongs to the Special Issue Non-coding RNAs: Variety of Roles and Applications in Human Diseases)

Abstract

:
Long noncoding RNAs (lncRNAs) are emerging as critical regulators of gene expression, which play fundamental roles in cancer development. In this study, we found that homeobox A11 antisense RNA (HOXA11-AS), a highly expressed lncRNA in cell lines derived from prostate cancer bone metastases, promoted the cell invasion and proliferation of PC3 prostate cancer cells. Transcription factor homeobox B13 (HOXB13) was identified as an upstream regulator of HOXA11-AS. HOXA11-AS regulated bone metastasis-associated C-C motif chemokine ligand 2 (CCL2)/C-C chemokine receptor type 2 (CCR2) signaling in both PC3 prostate cancer cells and SaOS2 osteoblastic cells. The HOXB13/HOXA11-AS axis also regulated integrin subunits (ITGAV and ITGB1) specific to prostate cancer bone metastasis. HOXB13, in combination with HOXA11-AS, directly regulated the integrin-binding sialoprotein (IBSP) promoter. Furthermore, conditioned medium containing HOXA11-AS secreted from PC3 cells could induce the expression of CCL2 and IBSP in SaOS2 osteoblastic cells. These results suggest that prostate cancer HOXA11-AS and HOXB13 promote metastasis by regulation of CCL2/CCR2 cytokine and integrin signaling in autocrine and paracrine manners.

1. Introduction

The metastatic spread of tumor cells to vital organs is the primary cause of mortality in patients with cancer. Bone marrow is a common destination for many malignant cancers, including prostate cancer, breast cancer, thyroid cancer, lung cancer, bladder cancer, renal cell carcinoma, neuroblastoma, and melanoma [1]. Mammary malignant cells and osteoblasts can induce hydroxyapatite crystal (mineralized calcium phosphate) deposition within primary tumors, which suggests that they can generate a microenvironment that favors the crystallization of calcium and phosphate ions into bone-specific hydroxyapatite.
Homeobox (HOX) gene clusters constitute some of the most ancient and highly conserved multigene loci among eukaryotes [2]. HOX genes encode homeoproteins that are key components of master regulatory pathways and have been studied in detail over the past decade for their roles in the mechanisms underlying both organogenesis and oncogenesis [3,4]. Studies of HOX genes have primarily focused on protein-coding regions, but recent advances in genomics have revealed a variety of sense and antisense noncoding transcripts embedded within the HOX clusters and their flanking regions [5]. Long noncoding RNAs (lncRNAs) are transcripts longer than 200 nucleotides that demonstrate no protein-coding capacity [6]. They contribute to epigenetic activation and repression by opening large chromatin domains, maintaining the chromatin state, or modulating RNA interference-mediated silencing processes (e.g., by acting as molecular sponges through both cis and trans mechanisms) [7]. Homeobox A11 antisense RNA (HOXA11-AS) is a highly conserved lncRNA located in the HOXA gene cluster on chromosome 7p15.2, at the opposite strand of the protein-coding gene, HOXA11. HOXA11-AS initiates tumor formation and metastasis [8]; it functions as an oncogene in many types of cancers by regulating polycomb repressive complex 2 (PRC2) [9] and acting as a sponge for microRNAs [10,11].
In this work, we found that lncRNA HOXA11-AS was highly expressed in cell lines derived from prostate cancer bone metastases, where it promoted cell invasion and proliferation. Furthermore, we identified a homeobox B13 (HOXB13) transcription factor as an upstream regulator of HOXA11-AS. In cooperation with HOXB13, HOXA11-AS regulated the expression of chemokines, integrins, and related genes (e.g., integrin-binding sialoprotein (IBSP)) to promote the bone-specific metastasis of prostate cancer. We propose that prostate cancer cell-derived HOXA11-AS acts in a paracrine manner to modulate cytokine signaling in osteoblastic cells within the bone marrow milieu.

2. Materials and Methods

2.1. Cell Lines and Reagents

Cells were obtained from American Type Culture Collection (Manassas, VA, USA). PC3 and LNCaP cells were grown in RPMI medium. VCaP and DU145 cells were grown in Dulbecco’s Modified Eagle’s Medium with 4.5 g/L d-glucose. SaOS2 cells were grown in Dulbecco’s Modified Eagle’s Medium with 1.0 g/L d-glucose. All culture media were supplemented with 10% fetal bovine serum, and all cells were maintained at 37 °C in 10% O2 and 5% CO2.
To generate PC3 cells overexpressing HOXA11-AS (A11AS-PC3 cells), HOXA11-AS-204 (ENST00000522674.1) cDNA was synthesized using RNA purified from PC3 cells. cDNA was used as a template to amplify the HOXA11-AS sequence with primers listed in Table S1 The amplified sequence was cut with HindIII and KpnI restriction enzymes and inserted into the pcDNA3.1 vector (Thermo Fisher Scientific, Waltham, MA, USA). Then, PC3 cells were seeded into 6-well plates, transfected with HOXA11-AS vector or negative control pcDNA3.1 empty vector with Lipofectamine 3000 (Thermo Fisher Scientific), and treated with 500 mg/mL G418 (Sigma-Aldrich, St. Louis, MO, USA). Surviving cells were grown in G418-containing medium as stably transfected cells.

2.2. RNA Interference

siRNAs were designed using siDirect version 2.0 (http://sidirect2.rnai.jp) and purchased from Sigma Genosys (Sigma-Aldrich). Mission siRNA Universal Negative Control #1 was used as negative control siRNA (Sigma-Aldrich). Cells were transfected with siRNAs using Lipofectamine RNAiMax transfection reagent (Thermo Fisher Scientific) at a final concentration of 20 nM, in accordance with the manufacturer’s protocol. The siRNA sequences are listed in Table S2.

2.3. Invasion and Proliferation Assays

For invasion assays, cells were seeded in CIM-Plates (Agilent Technologies, Santa Clara, CA USA) at a concentration of 4 × 10⁴ cells/well. For proliferation assays, cells were seeded in E-Plates (Agilent Technologies) at a concentration of 6 × 10³ cells/well. siRNA transfection was performed in 6-well plates, 24 h before seeding. Cell growth was monitored for 72 h using the xCELLigence Real Time Cell Analysis System (Agilent Technologies). Cell invasion assays were carried out in triplicate.

2.4. Microarray Analysis

Microarray analysis was performed using human Clariom D Assays (Thermo Fisher Scientific). For data analysis, GO term and pathway analysis were performed using the Microarray Analysis Tool (Thermo Fisher Scientific). These data are available in the Gene Expression Omnibus database (GEO Accession No. GSE147710; https://www.ncbi.nlm.nih.gov/geo).

2.5. Plasmid Construction

Inserts for HOXA11-AS and IBSP luciferase vectors were amplified with the PC3 genome as template, using the primers listed in Table S1. The insert of HOXA11-AS luciferase vector containing the promoter region ranged from −1468 to +383. The insert of HOXA11-AS luciferase vector without the promoter region ranged from −367 to +383. Both inserts were cloned into pGL3-Basic luciferase vector (Promega, Madison, WI, USA) using KpnI and HindIII restriction enzyme sites. The promoter region of the IBSP luciferase vector ranged from −344 to +90. An insert of 269 bp within this region was cloned into the pGL3-Basic luciferase vector (Promega) with KpnI and SacI restriction enzyme sites, using primers listed in Table S1.

2.6. qPCR Analysis

The NucleoSpin RNA Plus Kit (Macherey-Nagel, Düren, Germany) was used for total RNA isolation. RNA concentration was measured with a NanoDrop Spectrophotometer (Thermo Fisher Scientific) or Quantus Fluorometer (Promega). First-strand cDNA was generated using the PrimeScript RT reagent kit III (Takara Bio, Shiga, Japan). Expression levels were quantified by qPCR using the KAPA SYBR FAST ABI Prism 2 × qPCR Master Mix (Applied Biosystems, Foster City, CA, USA) and 7300 and 7900 Real-Time PCR systems (Applied Biosystems). Relative mRNA levels were determined by normalization to GAPDH mRNA levels. Primers are listed in Table S3.

2.7. Luciferase Assays

Plasmids containing HOXA11-AS or IBSP promoters were constructed by inserting respective promoter regions into the pGL3-Basic luciferase vector (Promega), as mentioned above. Cells were seeded in 24-well plates at a density of 1 × 10⁵ cells/well. The following day, cells were co-transfected with 20 pmol siRNA and 300 ng luciferase reporter plasmid using Xfect microRNA Transfection Reagent (Takara Bio), in accordance with the manufacturer’s instructions. As a transfection efficiency control, pRL-Tk Renilla luciferase reporter plasmid (Promega) was co-transfected at 10 ng/plate. For luciferase assays, a Dual-Luciferase Reporter Assay System (Promega) was used in accordance with the manufacturer’s instructions. Luciferase activity was measured using GloMax luminometer (Promega) and normalized to the levels of Renilla luciferase activity.

2.8. ChIP Assay

ChIP assays were performed using the Simple ChIP Enzymatic Chromatin IP Kit (Agarose Beads), in accordance with the manufacturer’s protocol (Cell Signaling Technology, Danvers, MA, USA). PC3 cells seeded in 10 cm dishes were transfected with siRNA for 24 h. Cells were cross-linked with 1% formaldehyde for 10 min at room temperature and stopped by addition of 0.2 M glycine. Chromatin was digested with micrococcal nuclease to an average size of 150 bp; the reaction was stopped by addition of 0.5 M EDTA. Nuclear membranes were lysed by sonication with 8 sets of 10 s pulses, using a Diagenode Bioruptor (Diagenode SPA, Región de Valparaiso, Chile). After centrifugation had been performed, anti-HOXB13 (Cat# PA5-78327; Thermo Fisher Scientific), or Normal Rabbit IgG (Cat# 2729; Cell Signaling Technology) antibodies were added to lysates; the mixtures were rotated at 4 °C overnight. Protein beads were then added, and the lysates were rotated for 2 h. Beads were then washed, and DNA was eluted and treated with proteinase K (Cell Signaling Technology). DNA was purified with spin columns and used as template for qPCR. Fold enrichment relative to input levels was quantified by qPCR using the SYBR Green PCR master mix and 7300 Real-Time PCR system. The RPL30 locus was used as the positive control. Primer sequences for ChIP qPCR are listed in Table S3.

2.9. Western Blotting

Whole-cell lysates were prepared using NP-40 lysis buffer. Protein concentrations were determined using the Bradford Assay (Thermo Fisher Scientific). Twenty milligrams of each protein lysate were loaded onto 4–20% precast polyacrylamide gels (Bio-Rad, Hercules, CA, USA), separated by electrophoresis, and electrotransferred to Sequi-Blot PVDF Membranes (Bio-Rad). Primary antibodies for Western blotting were anti-HOXB13 (Cat# PA5-78327; Thermo Fisher Scientific), anti-ITGAV (Cat# PA5-86575; Thermo Fisher Scientific), anti-ITGB5 (Cat# PA5-17260; Thermo Fisher Scientific), anti-ITGB1 (Cat# ab179471; Abcam, Cambridge, MA, USA) anti-ITGB3 (Cat# ab179473; Abcam), anti-ACTB (Cat# A5316; Sigma-Aldrich), anti-CCL2, clone 2D8 (Cat# MABN712; Merck Millipore, Burlington, MA, USA), and anti-IBSP (Cat# 5468; Cell Signaling Technology). Primary antibodies were detected by using appropriate horseradish peroxidase-conjugated secondary antibodies. Signals were then detected with an Enhanced Chemiluminescence System (GE Healthcare, Piscataway, NJ, USA) and blots were scanned using the Image Reader LAS-4000 (Fuji Film, Tokyo, Japan). Signal intensity was quantified using ImageJ software (RRID: SCR_003070; National Institutes of Health, Bethesda, MD, USA).

2.10. Gene Expression Omnibus Dataset Analysis

RNA sequencing data from VCaP and LNCaP cells lines, which were derived from prostate cancer bone and lymph node metastases, respectively (GEO Accession No. GSE82225), were analyzed to investigate lncRNA upregulation in prostate cancer bone metastasis. Gene expression was determined as the number of reads per kilobase of exon model per million mapped reads. Ingenuity Pathway Analysis (IPA) software was used for this investigation (QIAGEN Bioinformatics).
A clinical sample dataset was downloaded from the NCBI Gene Expression Omnibus database (GEO Accession No. GSE74685). Custom Agilent 44K whole human genome expression oligonucleotide microarrays were used. The set included 149 castration-resistant prostate cancer tumors from 63 patients. Samples analyzed were bone (n = 20), lymph node (n = 69), lung (n = 22), liver (n = 21), and others (n = 17). Data were analyzed using the interactive web tool (GEO2R) and Excel software (Microsoft, Redmond, WA, USA).
The expression of cancer metastasis-associated lncRNAs (MALAT-1, NEAT-1, HOTAIR, and HOXA11-AS) in four prostate cancer cell lines (VCaP, PC3, LNCaP, and DU145) and a normal prostate epithelial cell line PNT2 was analyzed by comparison of exosomal RNA versus total RNA. A lncRNA array dataset from NCBI Gene Expression Omnibus (GSE81034) was used. Arraystar Human LncRNA Array v2.0 was scanned with Agilent DNA Microarray Scanner. Values represent raw signal intensities normalized in quantile method by GeneSpring GX v11.5.1 and adjusted by Combat program to remove batch effects.

2.11. Isolation of Extracellular Vesicles (EVs)

To assess whether HOXA11-AS was present in EVs, EVs were isolated from the cell culture supernatant of PC3 cells in accordance with the differential ultracentrifugation approach described by Thery et al. [12]. Briefly, PC3 cells (7 × 10⁶ cells) were cultured in exosome-free RPMI medium. After 48 h, cell culture supernatant (150 mL) was collected. Following the first 100,000 × g centrifugation, supernatant (i.e., “EV-subtracted supernatant”) was collected. After the second 100,000× g centrifugation, the resulting pellet was filtered through a 0.22 μm filter and then washed by resuspension in phosphate-buffered saline. EVs were subsequently purified by centrifugation at 100,000× g using a 30% sucrose cushion. The concentration and size distribution of the isolated EVs were analyzed using the NanoSight particle tracking system (LM10; NanoSight, Amesbury, Wiltshire, UK) [13]. qPCR was performed as described above.

2.12. Statistical Analysis

Statistical differences (p values) among groups were obtained using two-sided unpaired t-tests. All experiments were performed at least two or three times. p < 0.05 was considered statistically significant. Statistical analyses were performed using Excel (Microsoft).

3. Results

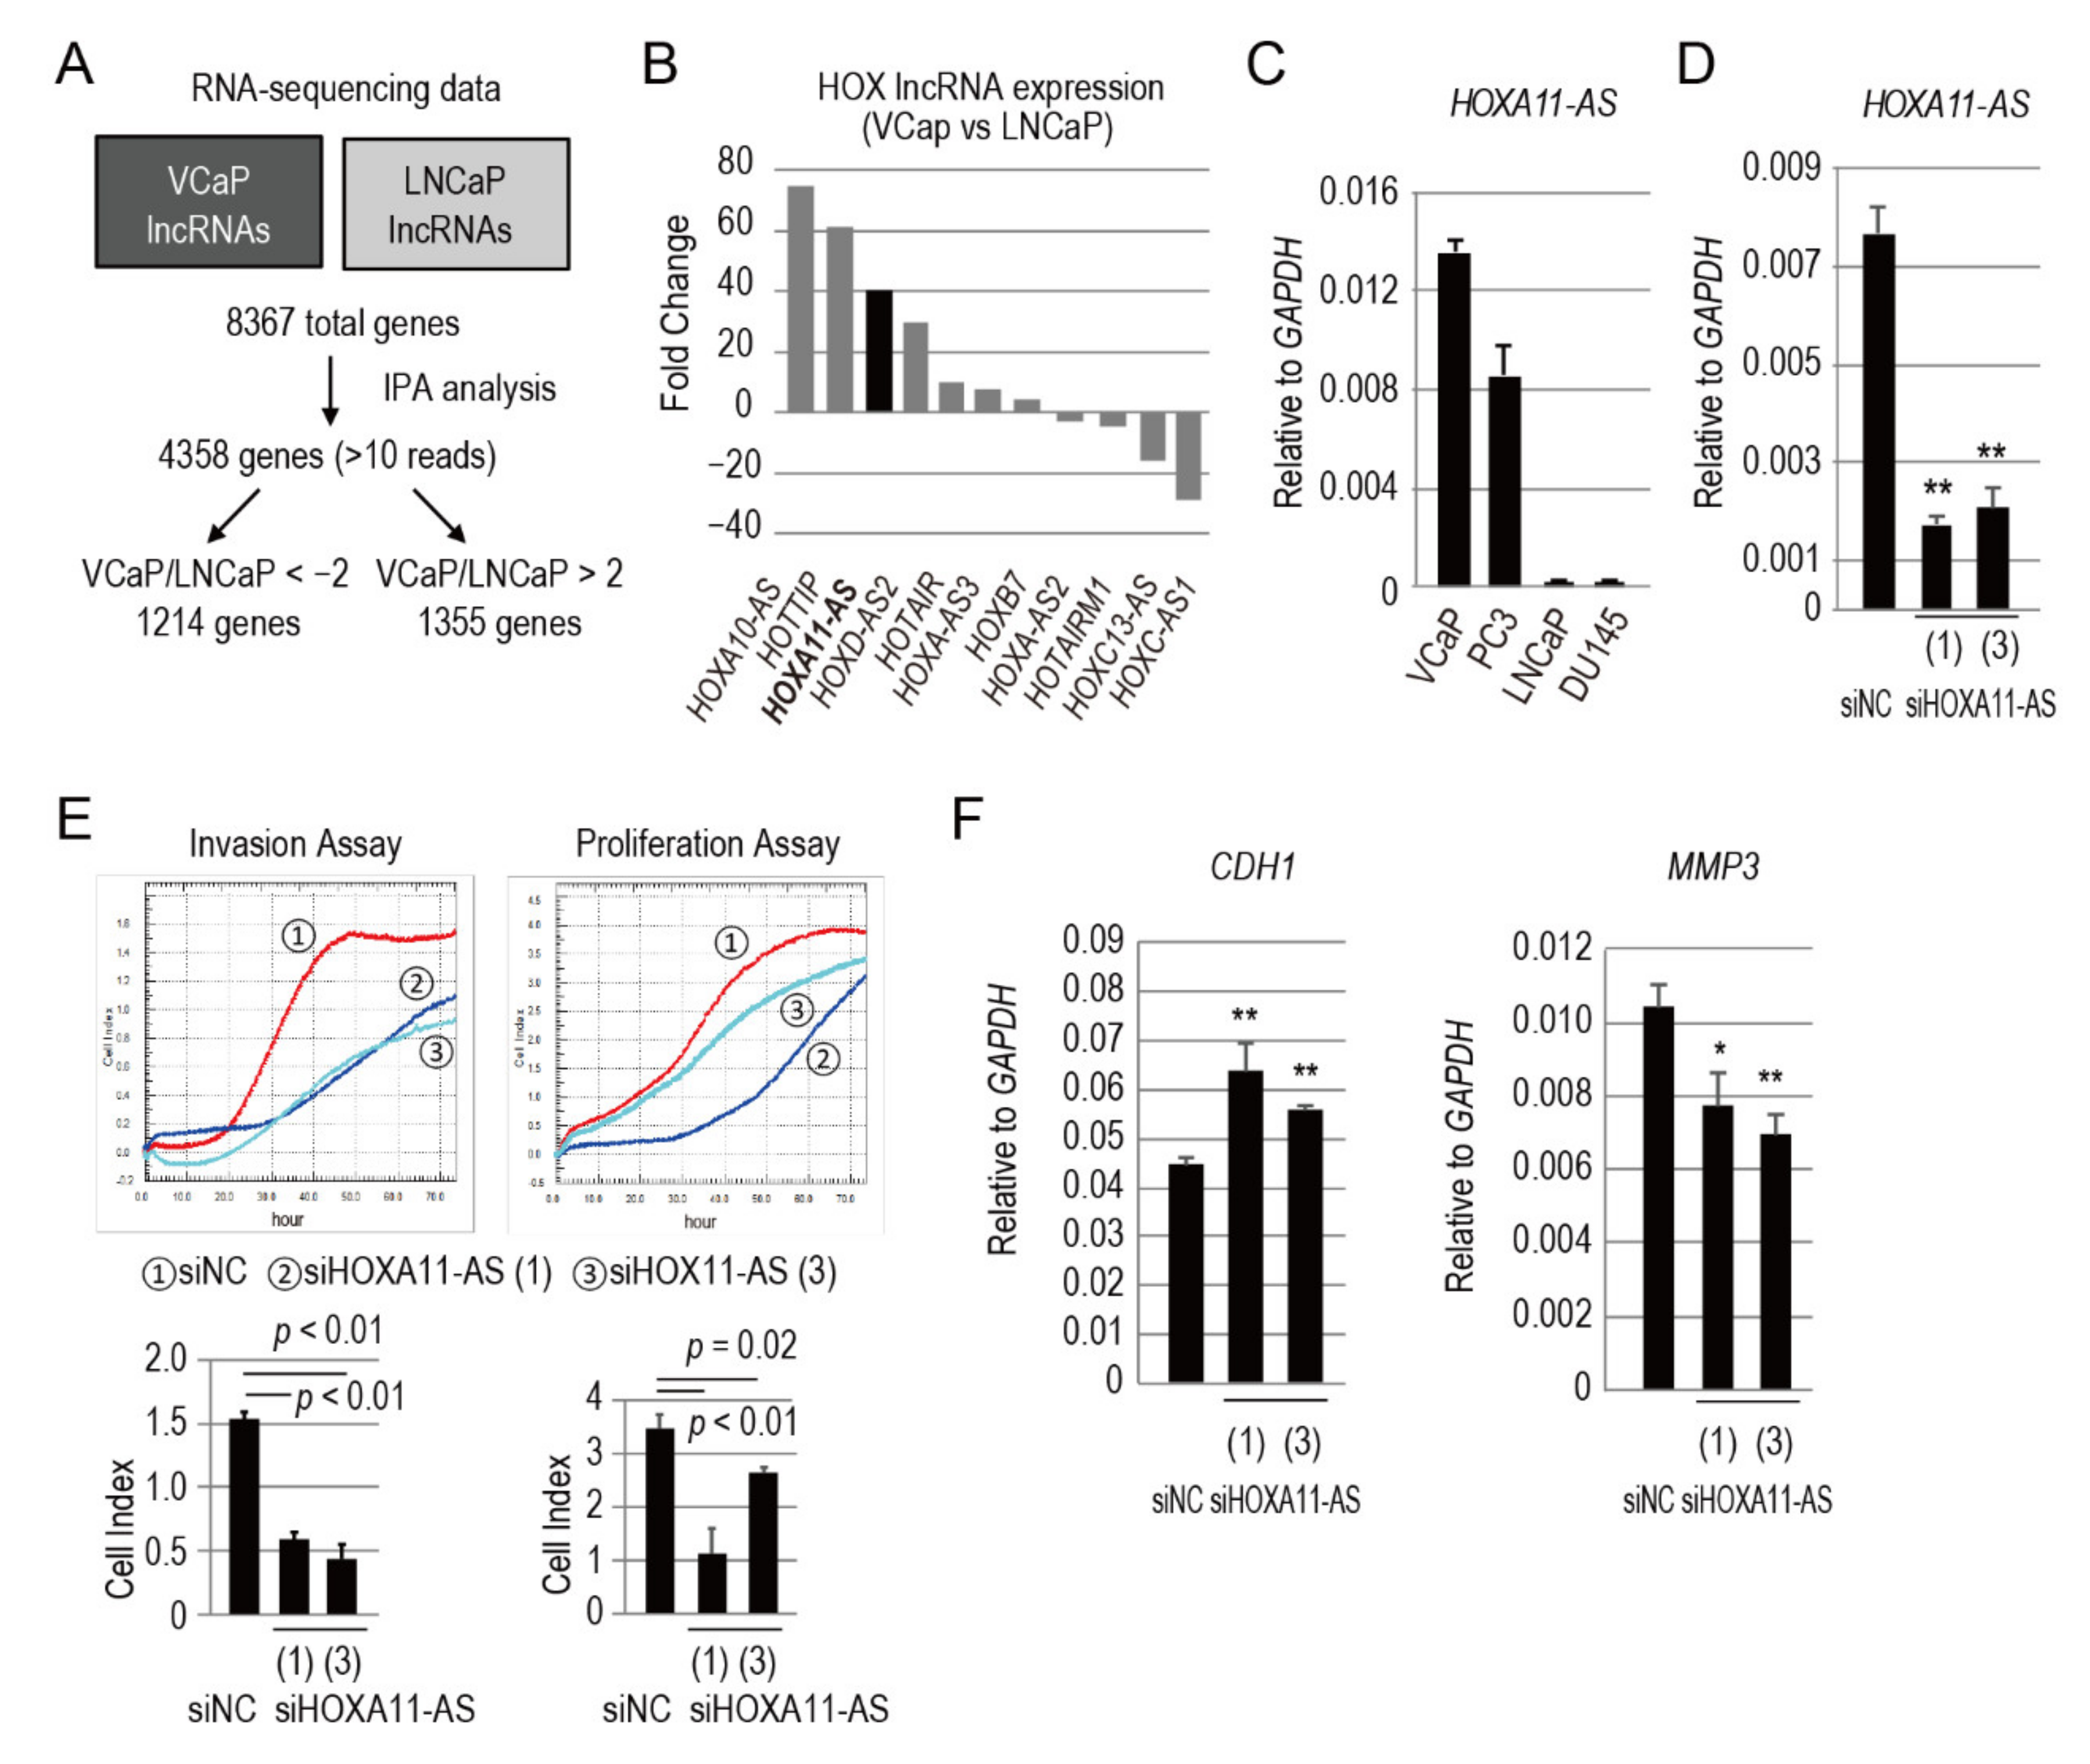
3.1. HOXA11-AS Is Highly Expressed in Cell Lines Derived from Bone Metastases

To investigate lncRNA upregulation in prostate cancer bone metastasis, we first analyzed existing RNA sequencing data from VCaP and LNCaP cells lines, which were derived from prostate cancer bone and lymph node metastases, respectively (GEO Accession No. GSE82225). Among the 8367 total genes, 4358 with more than 10 reads were selected from either VCaP or LNCaP cells by Ingenuity Pathway Analysis (IPA). The expression levels of these genes in both cell lines were compared; 1214 genes were expressed more than 2-fold and 1355 genes were expressed less than 2-fold in VCaP cells, compared with LNCaP cells (Figure 1A). Among the genes differentially expressed more than 2-fold in VCaP cells compared to LNCaP cells, we found out many lncRNAs derived from HOX clusters. We plotted these HOX cluster-derived lncRNAs in Figure 1B, where the X-axis shows the name of the lncRNA and the Y-axis shows the fold change of the number of reads per kilobase of exon model per million mapped reads (RPKM) in VCaP cells with respect to the RPKM in LNCaP cells, calculated as the ratio between RPKM (VCaP)/RPKM (LNCaP) (Figure 1B). HOXA11-AS, the 50th highly expressed gene among all lncRNAs identified in VCaP cells, was upregulated 40-fold, compared with LNCaP cells (Figure 1B). Expression of HOXA11-AS was verified in four prostate cancer cell lines (i.e., VCaP, PC3, LNCaP, and DU145) by quantitative polymerase chain reaction (qPCR) analysis (Figure 1C). The two cell lines derived from bone metastases, VCaP and PC3, showed substantially higher expression levels of HOXA11-AS compared with LNCaP and DU145, which are derived from lymph node and brain metastases, respectively. HOXA11-AS promotes cancer progression and metastasis in many types of cancers by the interaction with PRC2 or acting as a sponge for miRNAs [8,9,10,11]. Recently, another group already showed the function of HOXA11-AS in prostate cancer [14], but the underlying role of HOXA11-AS in prostate cancer metastasis still remains poorly understood. Therefore, we focused on this lncRNA by analyzing its upstream and downstream genes to determine genes involved in prostate cancer bone metastasis. We first tried to elucidate the relation between AR and HOXA11-AS using AR-positive VCaP cell line and found that AR knockdown by small interfering RNAs (siRNAs) did not show changes in HOXA11-AS expression (Figure S1). These data suggest that HOXA11-AS is not regulated by AR and lead us to proceed with AR-negative PC3 cell line for further experiments.

3.2. HOXA11-AS Promotes the Invasion and Proliferation of Prostate Cancer Cells

In most cancers, HOXA11-AS functions as an oncogene by promoting proliferation, migration, invasion, and metastasis. Therefore, in our first experiment, we compared invasive behaviors of human bone metastatic prostate PC3 cells between those transfected with HOXA11-AS specific siRNAs and those transfected with control siRNA, using the xCELLigence real-time analyzer system. Silencing efficiency was evaluated by qPCR analysis (Figure 1D). Under these experimental conditions, HOXA11-AS silencing led to a significant reduction in the invasive abilities of PC3 cells, compared with control cells (Figure 1E). Silencing of HOXA11-AS also led to a reduction in cell proliferation (Figure 1E). These findings suggest that HOXA11-AS promotes cell invasion and proliferation in prostate cancer cells. Furthermore, we analyzed the expression levels of metastasis-associated genes, such as Cadherin-1 (CDH1, also known as E-cadherin) and matrix metalloproteinase 3 (MMP3), in HOXA11-AS-repressed PC3 cells. CDH1 expression increased, while MMP3 expression decreased, in PC3 cells transfected with siHOXA11-AS for 48 h (Figure 1F). These data suggest that HOXA11-AS may regulate prostate cancer invasion through the modulation of metastasis-associated CDH1 and MMP3.

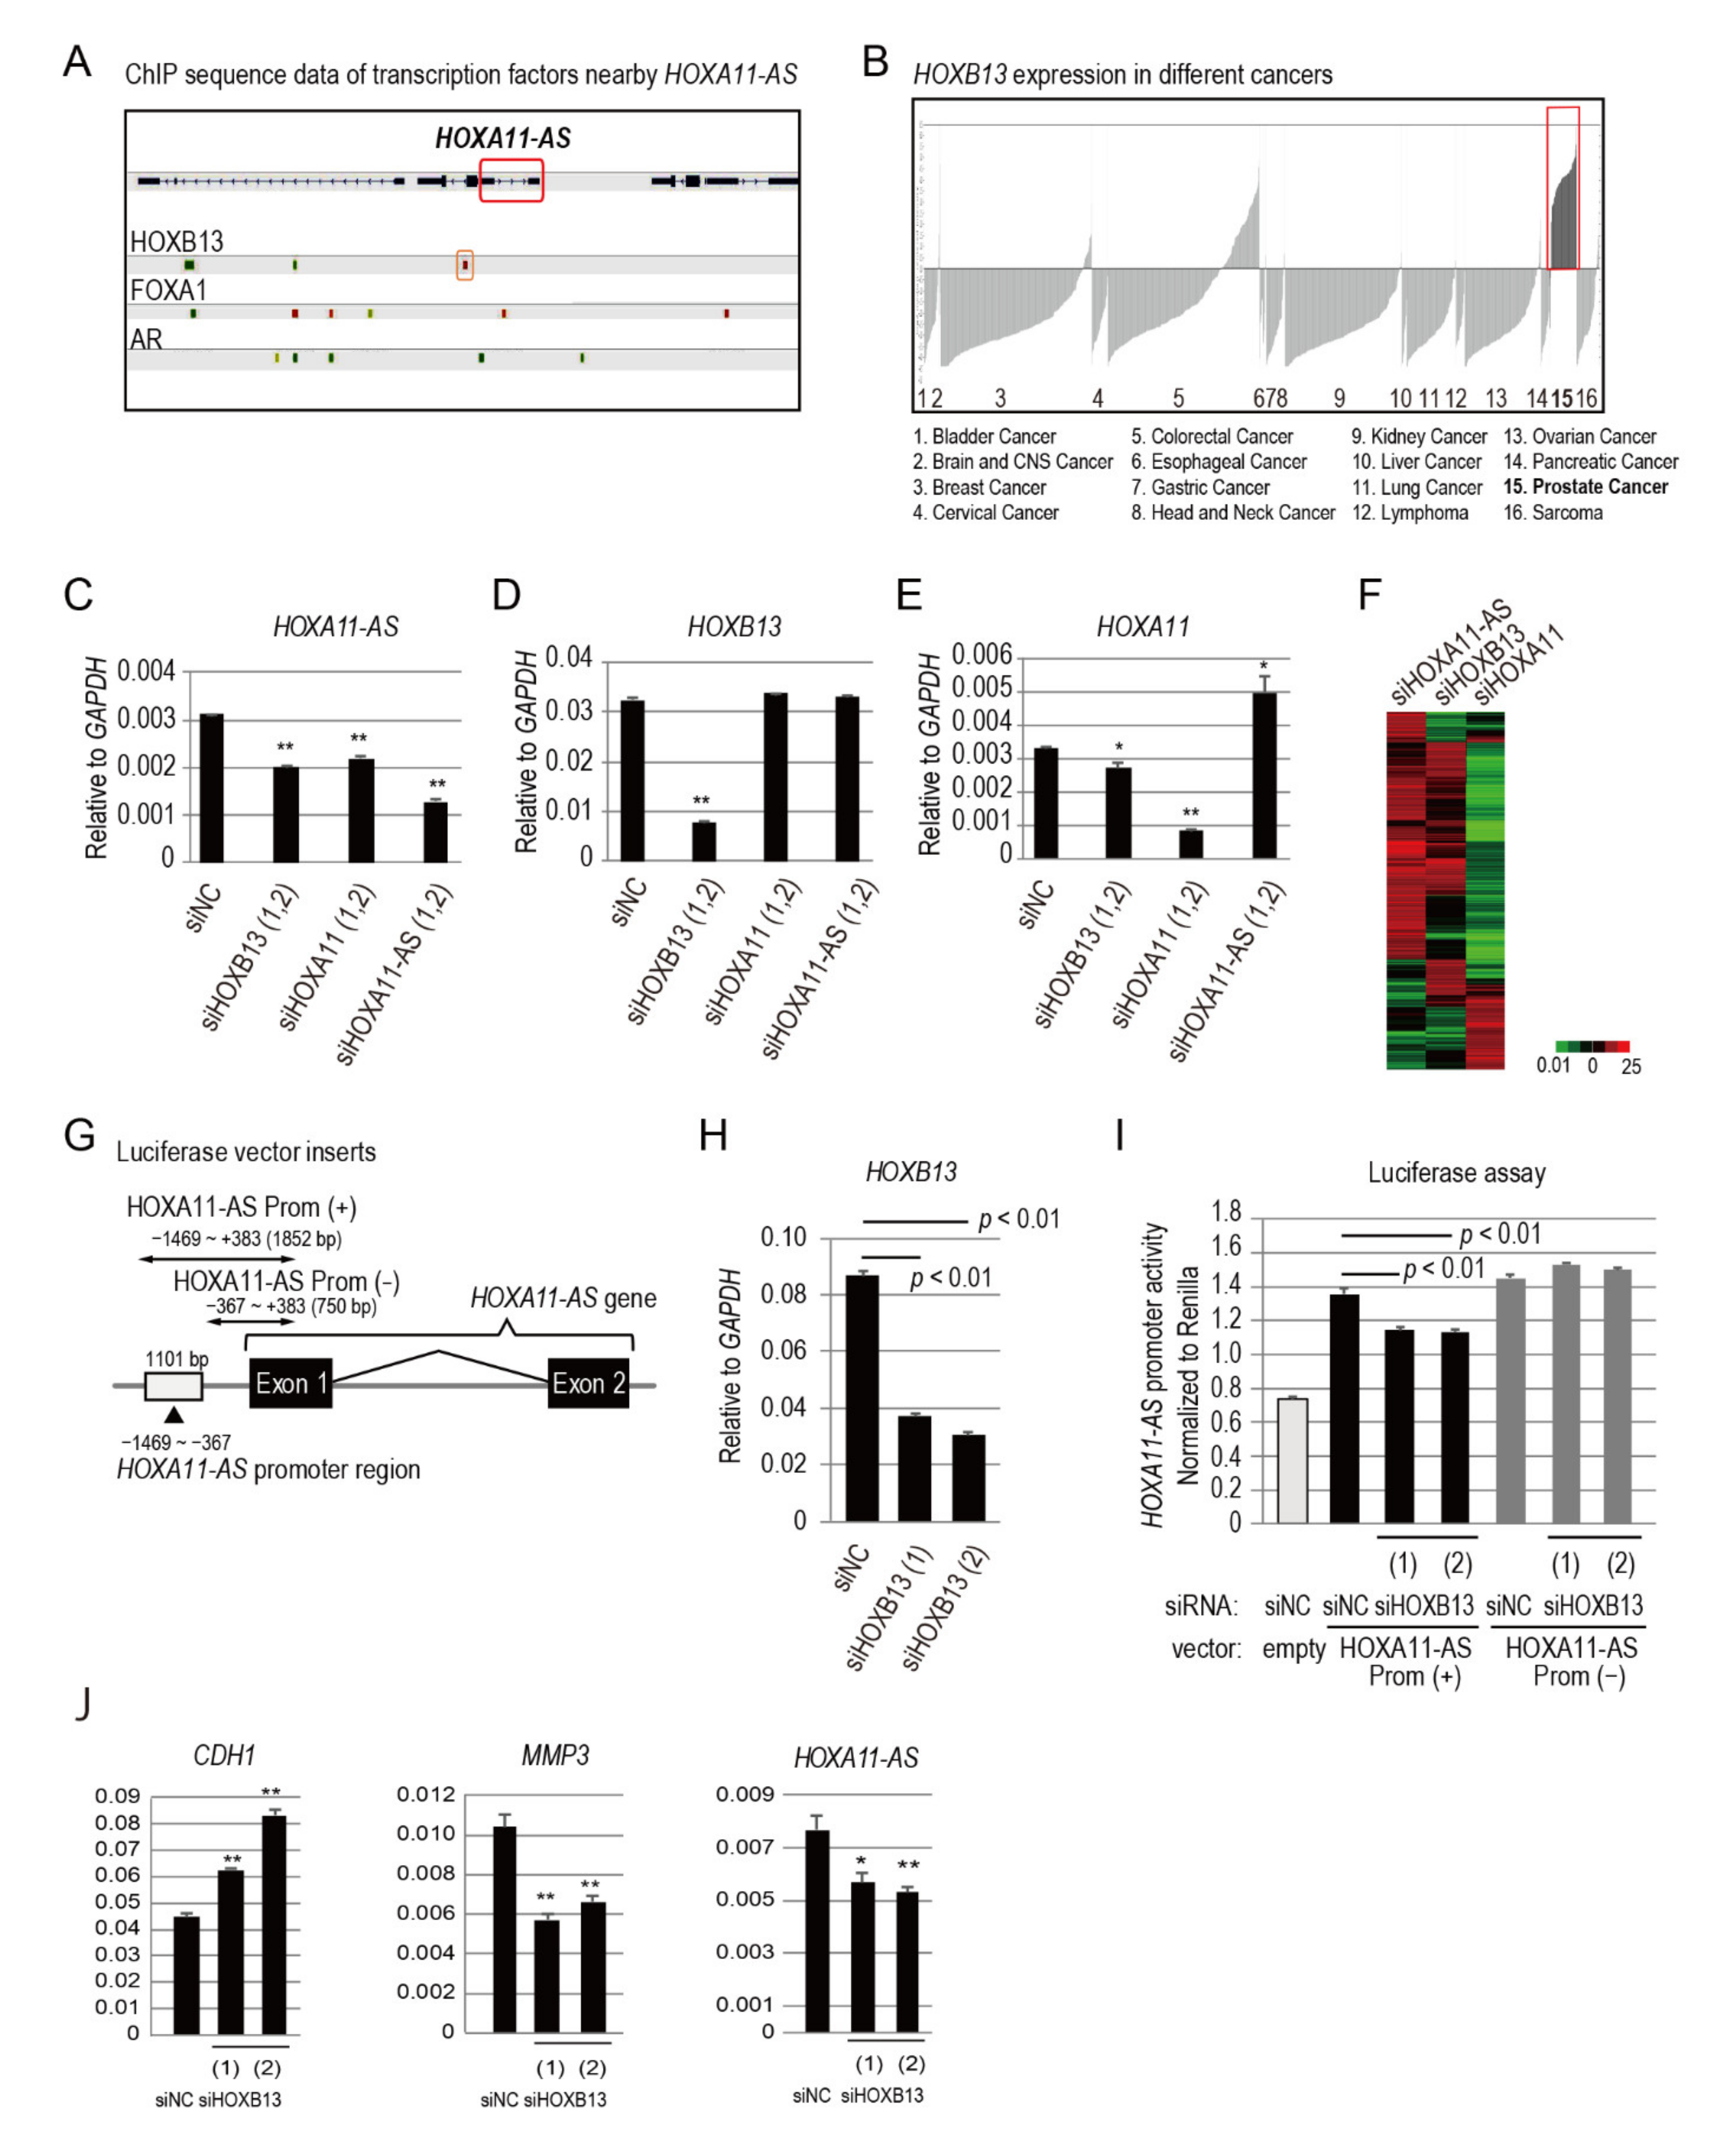
3.3. HOXB13 Is an Upstream Regulator of HOXA11-AS

Next, we explored the upstream factors of HOXA11-AS in prostate cancer cells using the chromatin immunoprecipitation assay (ChIP)-Atlas database (https://chip-atlas.org/; accessed on 20 March 2019). In the genomic locus of HOXA11-AS, we found androgen receptor (AR)- and forkhead box A1 (FOXA1)-binding sites, which are key components in prostate cancer development and progression [15]. As mentioned above, we showed that AR knockdown did not affect the expression of HOXA11-AS expression in VCaP cells (Figure S1). We also examined whether FOXA1 may regulate HOXA11-AS by siFOXA1, but FOXA1 knockdown did not show changes in HOXA11-AS expression in VCaP cells (Figure S2). Near the HOXA11-AS gene locus, we also found a strong HOXB13-binding site; this homeoprotein is another important transcription factor and coregulator of AR [16] (Figure 2A). Furthermore, we analyzed HOXB13 expression levels in different cancers using the Oncomine database (https://www.oncomine.org/resource/login.html; accessed on 28 February 2020). Among 16 different types of cancer, HOXB13 was highly expressed in prostate cancer, suggesting its importance in prostate cancer progression (Figure 2B). Thus, we explored the relationship between HOXB13 and HOXA11-AS.
First, we transfected PC3 cells with different siRNAs for 48 h and analyzed the expression levels of HOXB13, HOXA11-AS, and HOXA11 by qPCR (Figure 2C,E,H). siRNAs targeting two different sequences were combined for more efficient gene silencing and downstream effects. HOXA11-AS was repressed by siHOXB13 transfection (Figure 2C). HOXA11-AS repression by siHOXB13 was also observed in VCaP cells (Figure S3). Transfection of siHOXB13 also reduced HOXA11 expression (Figure 2E), suggesting that HOXB13 positively regulates both HOXA11-AS and HOXA11 through a bidirectional promoter. Notably, siHOXA11-AS transfection enhanced HOXA11 expression (Figure 2E). HOXA11 has been identified as a novel tumor suppressor in renal cell carcinoma, which inhibits cell proliferation, migration, and invasion, while inducing apoptosis [17]. These results suggest that HOXA11-AS, as an oncogene, represses the opposite-strand tumor suppressor gene HOXA11. Unexpectedly, siHOXA11 transfection repressed HOXA11-AS expression, which suggests that HOXA11 enhances HOXA11-AS (Figure 2C). A complex regulatory circuit among HOXA11-AS, HOXA11, and HOXB13 may exist, and more experiments are needed in order to elucidate the exact mechanism of action among these genes. Neither siHOXA11 nor siHOXA11-AS transfection affected HOXB13 expression (Figure 2D). Next, we performed microarray analysis of these siRNA-transfected PC3 cells using the Microarray Data Analysis Tool (version 3.2; Filgen, Aichi, Japan). Genes with expression levels that increased or decreased more than 2-fold, compared with their levels in negative control siRNA-transfected cells, were clustered and plotted (Figure 2F). As the heatmap shows, HOXA11-AS and HOXB13 knockdown modulated similar genes, while HOXA11 showed opposite results (Figure 2F). Common genes upregulated more that 2-fold in siHOXA11-AS and siHOXB13 samples compared to siNC were analyzed, identifying genes associated with cell membrane (Table S4). This suggests that HOXB13 and HOXA11-AS share similar downstream signals related to cell membrane and cell to cell interaction.
To examine whether HOXB13 is involved in HOXA11-AS regulation, we constructed a luciferase reporter vector containing the HOXA11-AS promoter, which includes a HOXB13-binding sequence; a vector excluding the promoter region was used as a control (Figure 2G). PC3 cells were co-transfected with siRNAs targeting HOXB13 or negative control siRNA, as well as luciferase vectors with or without the HOXA11-AS promoter. HOXB13 knockdown efficiency by siRNAs is shown in Figure 2H. siHOXB13 repressed HOXA11-AS promoter activity when transfected with the vector containing the HOXB13-binding region, while no change was observed upon transfection with the control luciferase vector lacking the HOXA11-AS promoter (Figure 2I). CDH1 expression increased and MMP3 expression decreased in PC3 cells transfected with siHOXB13, reinforcing HOXB13/HOXA11-AS axis (Figure 2J). Taken together, these results support the notion that HOXB13 is an upstream regulator of HOXA11-AS.

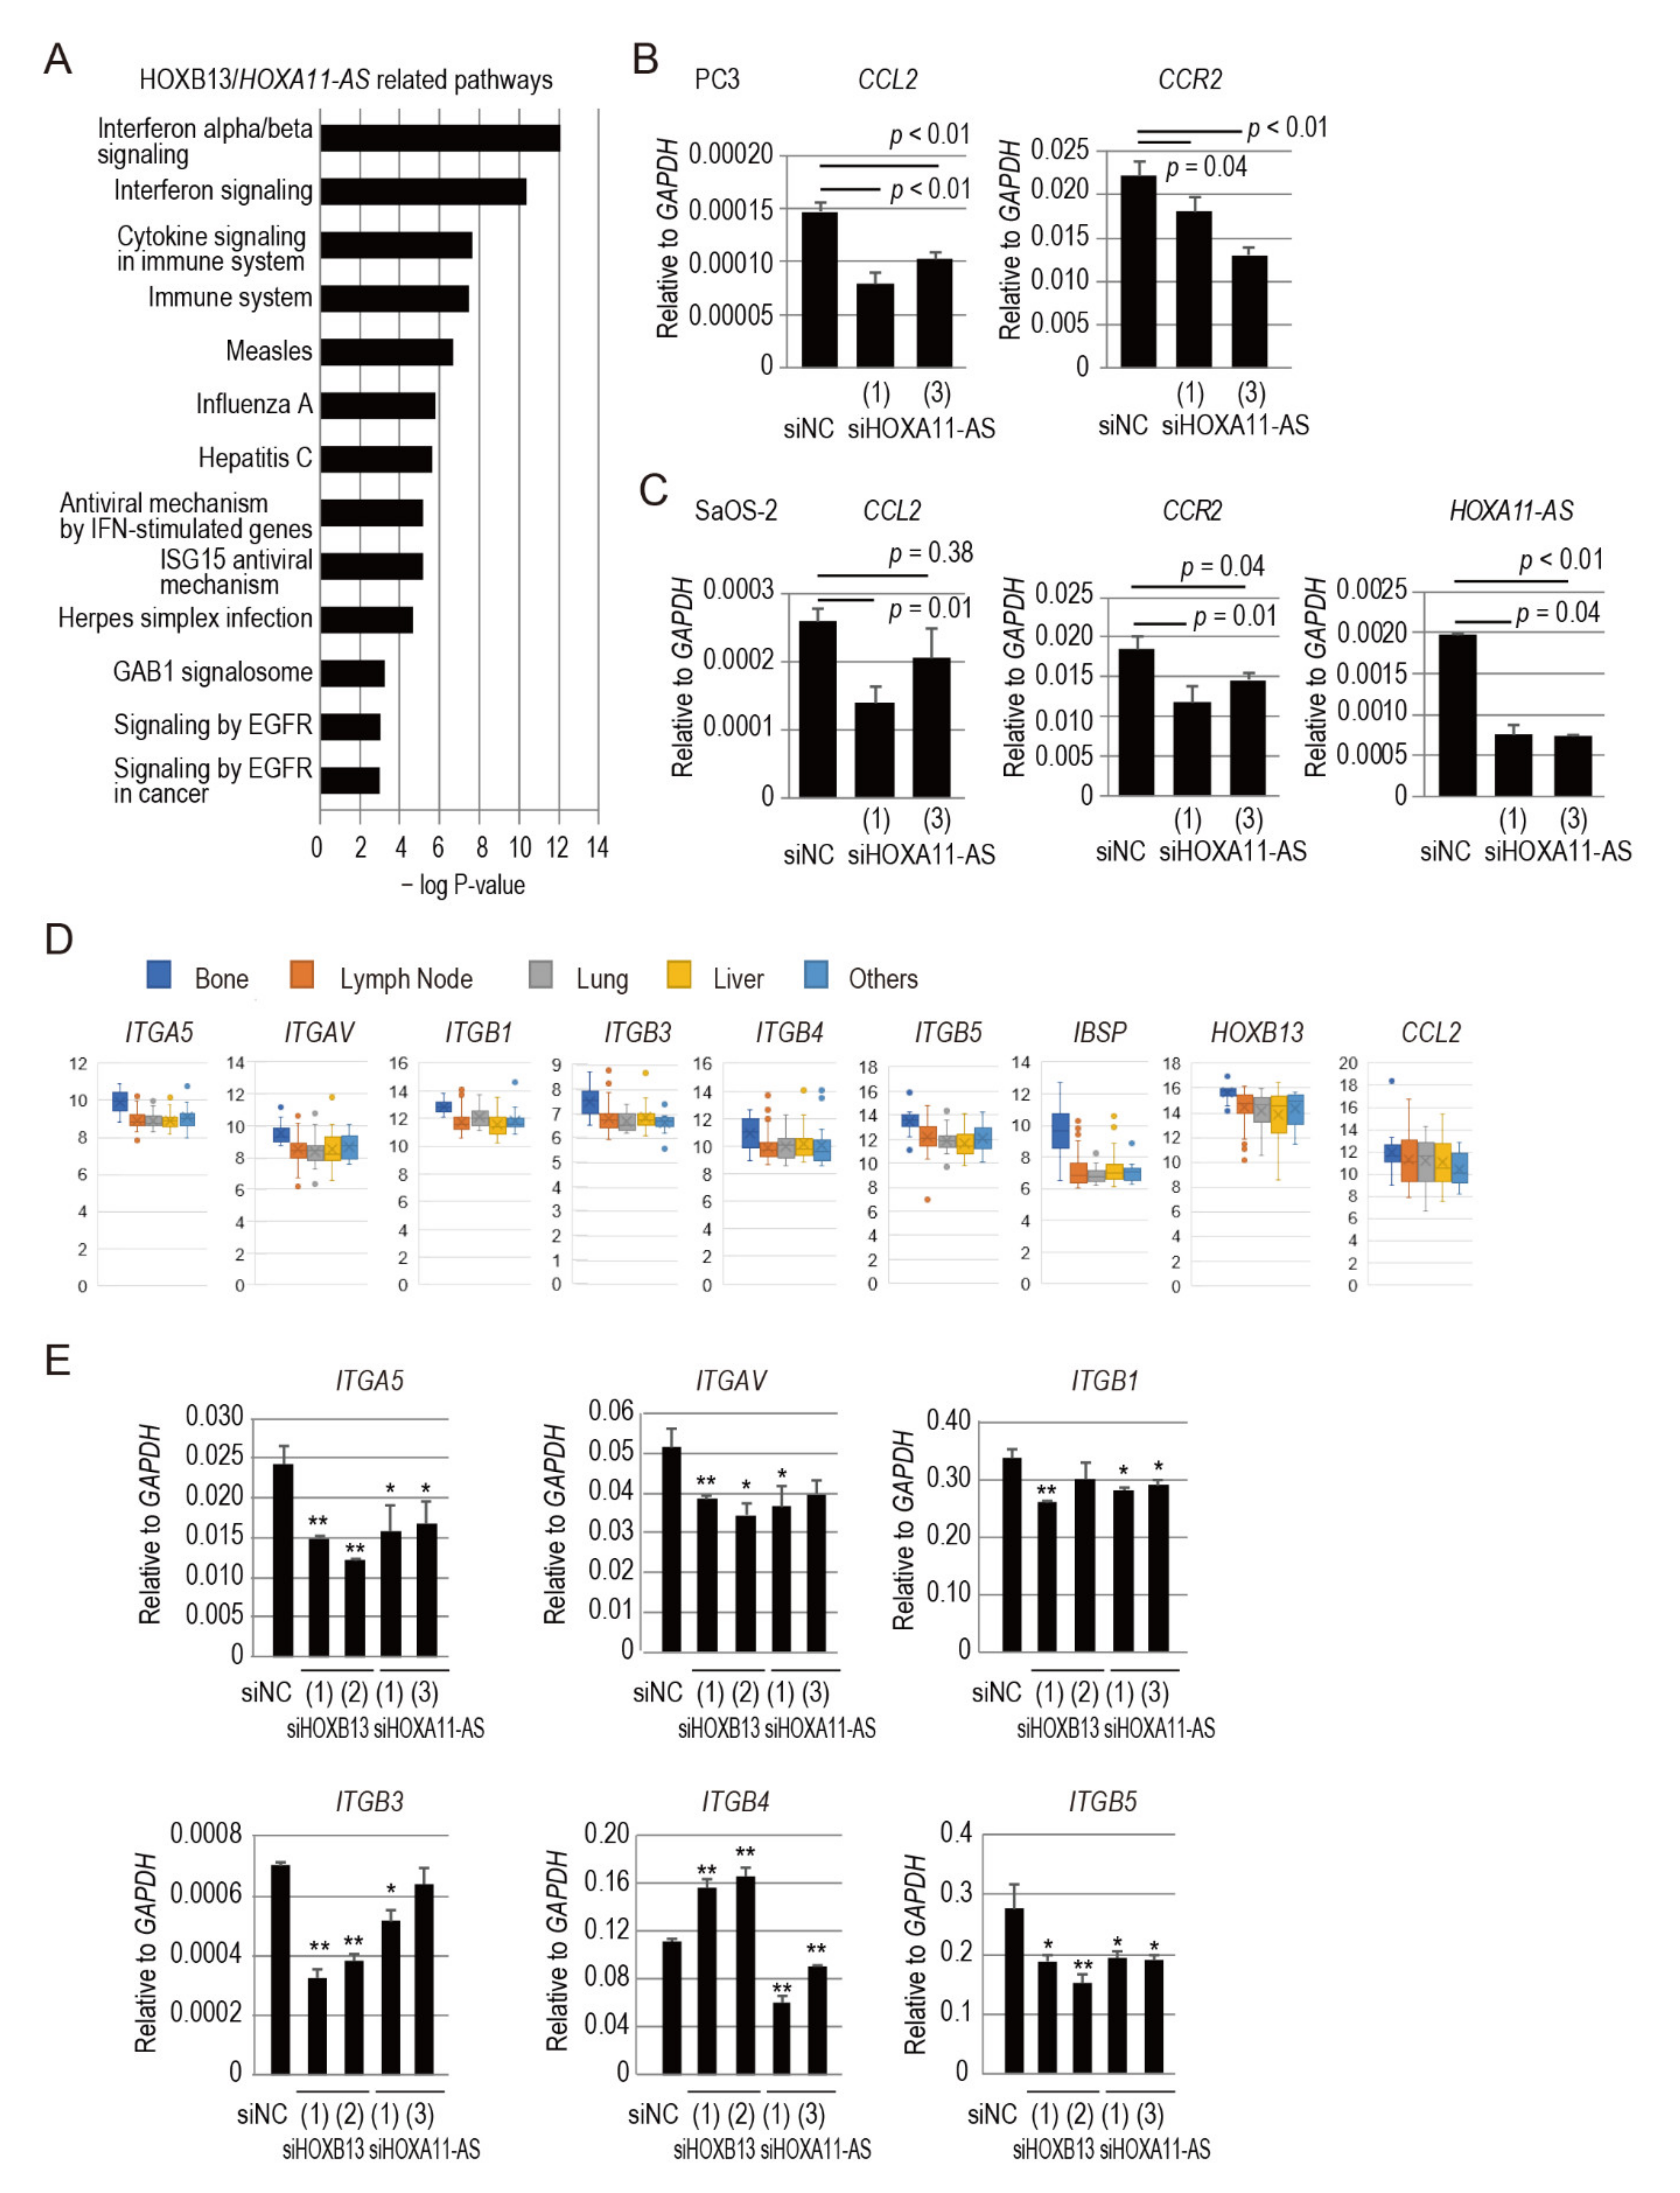
3.4. HOXA11-AS Regulates C-C Motif Chemokine Ligand 2/C-C Chemokine Receptor Type 2 Signaling Associated with Prostate Cancer Bone Metastasis

We also performed Gene Ontology analysis of microarray data collected from PC3 cells transfected with siRNA targeting HOXB13, HOXA11-AS, or HOXA11 using the Microarray Data Analysis Tool. The graph in Figure 3A shows the most relevant pathways, arranged according to their p-values; cytokine signaling and immune system pathways were the most affected pathways in HOXB13 and HOXA11-AS knockdown prostate cancer PC3 cells. Previous studies have demonstrated the importance of different cytokines and their respective receptors in the progression of prostate cancer and bone metastasis (Table S5). In the bone marrow milieu, C-C motif chemokine ligand 2 (CCL2; also known as monocyte chemoattractant protein 1), the primary ligand for C-C motif chemokine receptor 2 (CCR2) [18], is produced in bone marrow osteoblasts, endothelial cells, stromal cells, and prostate cancer cells [19]. CCL2 is a prominent modulator of bone metastatic growth of prostate cancer [19], it promotes cell proliferation, invasion, and migration by binding to CCR2 in both autocrine and paracrine manners. Because the interaction between cancer cells and the host microenvironment is a vital component of tumorigenesis, the results of our microarray data analysis led us to focus on CCL2/CCR2 for examination of its relationship with HOXA11-AS in both prostate cancer cells and osteoblasts.
To investigate whether HOXA11-AS regulates CCL2 and CCR2, we transfected siHOXA11-AS into PC3 cells and the human osteoblastic osteosarcoma cell line SaOS2. qPCR analysis showed that both genes were downregulated in PC3 and SaOS2 cells by HOXA11-AS knockdown (Figure 3B,C). We also analyzed changes of CCL2 and CCR2 expression after siHOXB13 silencing in PC3 and SaOS2 cells. HOXB13 knockdown repressed CCR2 in both cell lines, while CCL2 was unchanged in these conditions, suggesting that HOXB13 enhances at least CCR2 expression (Figure S4). CCL2 expression may depend not only on HOXB13, and further analysis are needed to elucidate what other factors may be involved in the regulation of this gene. Taken together, these data suggest that HOXA11-AS is an upstream regulator of CCL2/CCR2 signaling in both prostate cancer cells and osteoblastic cells.

3.5. HOXB13/HOXA11-AS Axis Regulates Integrin Subunits Specific to Prostate Cancer Bone Metastasis

Chemokines activate integrins by rapidly triggering inside-out signaling that regulates the binding of intracellular effector proteins to integrin cytoplasmic domains [20]. First, we analyzed a set of clinical samples from the NCBI Gene Expression Omnibus database (GEO Accession No. GSE74685), which includes 149 castration-resistant prostate cancer tumors from 63 patients. We compared the expression levels of eight integrin subunits (ITGA2, ITGA5, ITGAV, ITGB1, ITGB3, ITGB4, ITGB5, and ITGB6), HOXB13, HOXA11-AS, CCL2, CXCL12, and IBSP in prostate cancer tissues that had metastasized to bone, lymph nodes, lungs, liver, and other organs. Among the eight integrin subunits analyzed, ITGA5, ITGAV, ITGB1, ITGB3, ITGB4, and ITGB5 were upregulated in the bone compared with the other organs, suggesting that some integrins may confer osteotropic properties on metastatic prostate cancer (Figure 3D).
To verify whether HOXB13 and HOXA11-AS regulate integrin expression in prostate cancer, the expression levels of the six integrin subunits were analyzed in PC3 cells transfected with siRNA targeting HOXB13 or HOXA11-AS by qPCR analysis. siHOXB13 transfection significantly downregulated most of the integrin subunits analyzed, with the exclusion of integrin ITGB4, which was significantly increased upon HOXB13 knockdown (Figure 3E). siHOXA11-AS transfection also significantly downregulated these integrin subunits (Figure 3E). Next, the protein expression levels of the six integrin subunits were analyzed by Western blotting analysis. HOXB13 silencing repressed ITGAV and ITGB1, whereas it induced ITGB4 protein expression (Figure S5). These results were substantially correlated with the findings in the PCR experiments (Figure 3E). Repression and partial repression of ITGAV and ITGB1 proteins, respectively, were also observed with siHOXA11-AS transfection (Figure S5). Furthermore, ITGB5 induction by siHOXA11-AS was observed. These results suggest that the HOXB13/HOXA11-AS axis modulates the expression of specific integrin subunits (i.e., ITGAV and ITGB1) in prostate cancer PC3 cells.

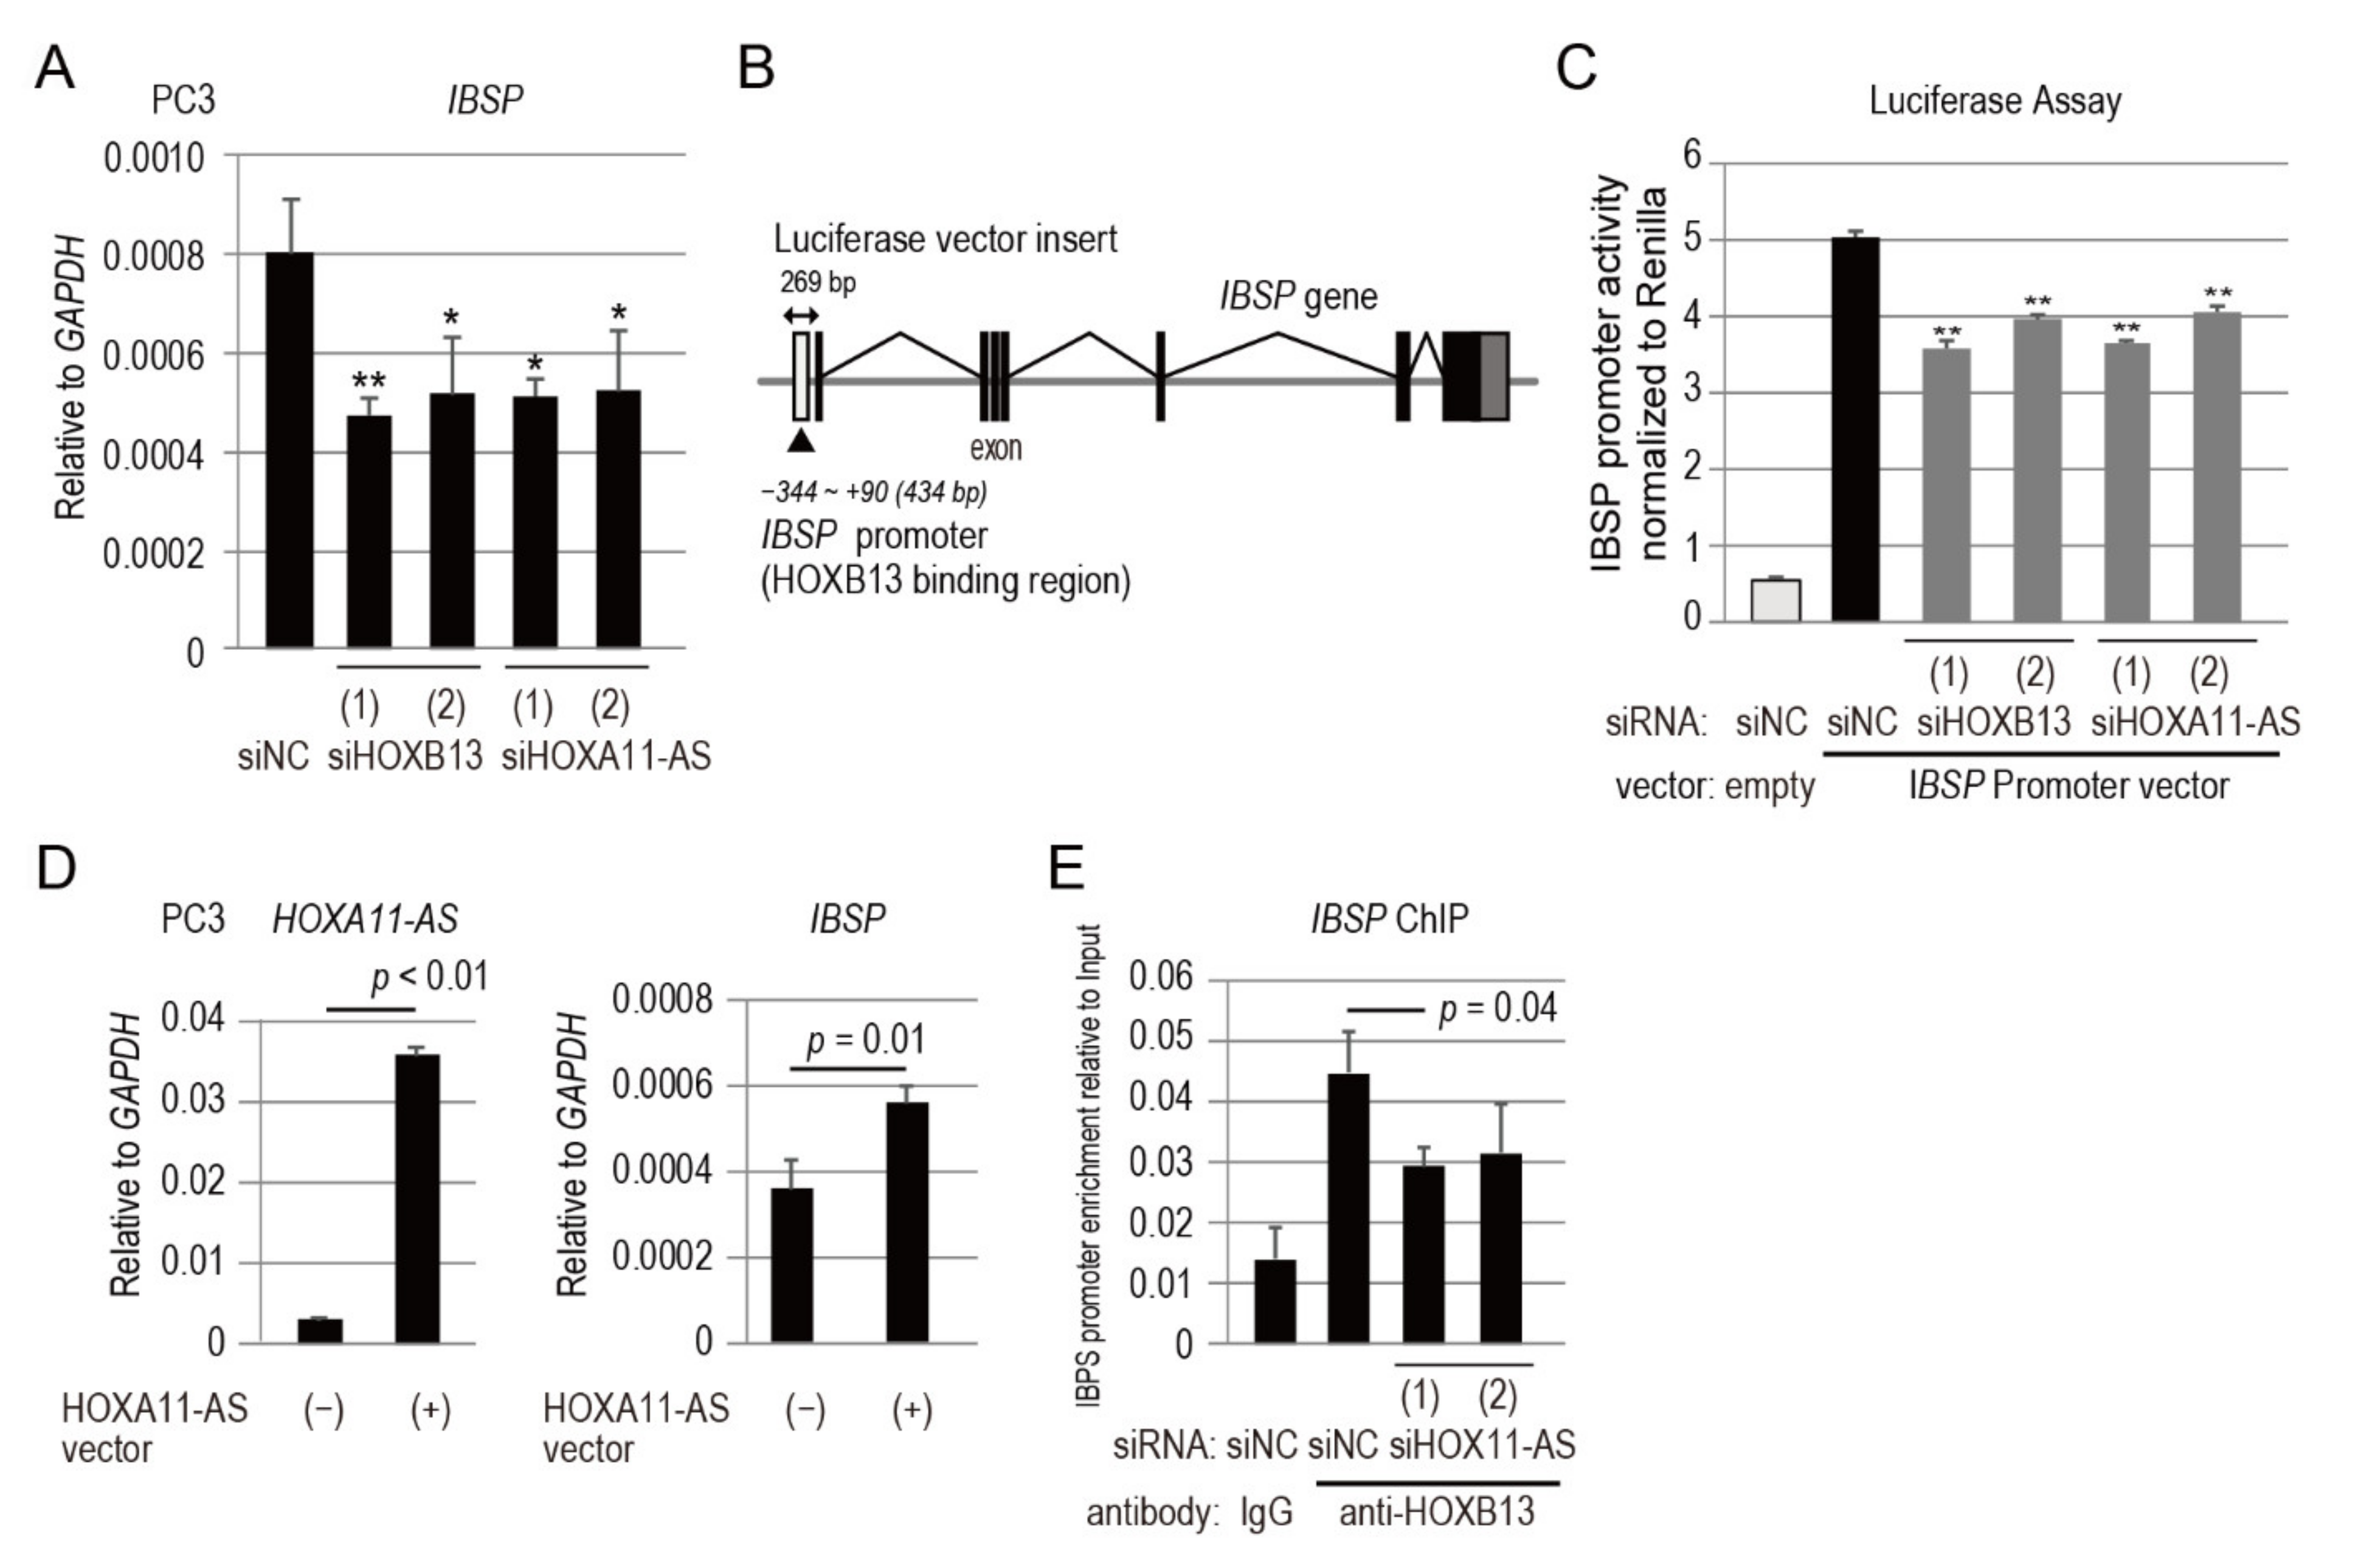
3.6. IBSP Promoter Is Directly Regulated by HOXB13 in Combination with HOXA11-AS

Notably, IBSP was significantly highly expressed in bone metastases, compared with metastases to other organs, in the dataset of clinical samples (Figure 3D). IBSP is a highly sulfated, phosphorylated, and glycosylated protein that constitutes a major component of the mineralized bone matrix [21]. Bone-derived IBSP plays important roles in breast cancer metastasis through induction of tumor cell seeding into the bone [22]. However, the mechanism by which IBSP is regulated in prostate cancer cells has not yet been elucidated. Thus, we performed qPCR analysis of IBSP expression in PC3 cells transfected with siRNA targeting HOXB13 or HOXA11-AS to investigate whether HOXB13 and HOXA11-AS regulate IBSP expression in prostate cancer. Both siRNAs significantly downregulated IBSP expression in PC3 cells (Figure 4A).
The Ensembl database showed that the IBSP promoter harbors a HOXB13-binding site in its regulatory region (Figure 4B). To verify that HOXB13 directly regulates IBSP through its promoter, we constructed a luciferase vector containing the putative HOXB13-binding site (Figure 4B). A luciferase vector containing the IBSP promoter and siRNAs targeting HOXB13 or HOXA11-AS were co-transfected into PC3 cells. As shown in Figure 4C, siHOXB13 knockdown significantly repressed IBSP promoter activity. These results demonstrated that HOXB13 directly regulated IBSP expression through its promoter. Furthermore, siHOXA11-AS knockdown also significantly repressed IBSP promoter activity (Figure 4C). HOXA11-AS overexpression enhanced IBSP expression in PC3 cells (Figure 4D). To determine whether HOXA11-AS was involved in regulation of the IBSP promoter by HOXB13, a ChIP assay using an anti-HOXB13 antibody was performed with PC3 cells transfected with siHOXA11-AS. HOXB13 binding to the IBSP promoter was markedly reduced in HOXA11-AS repressed cells (Figure 4E). Taken together with the findings that siHOXA11-AS knockdown did not affect the expression of HOXB13 in PC3 cells (Figure 2D), these results suggest that HOXA11-AS upregulates IBSP expression through its promoter as a HOXB13-associated lncRNA.

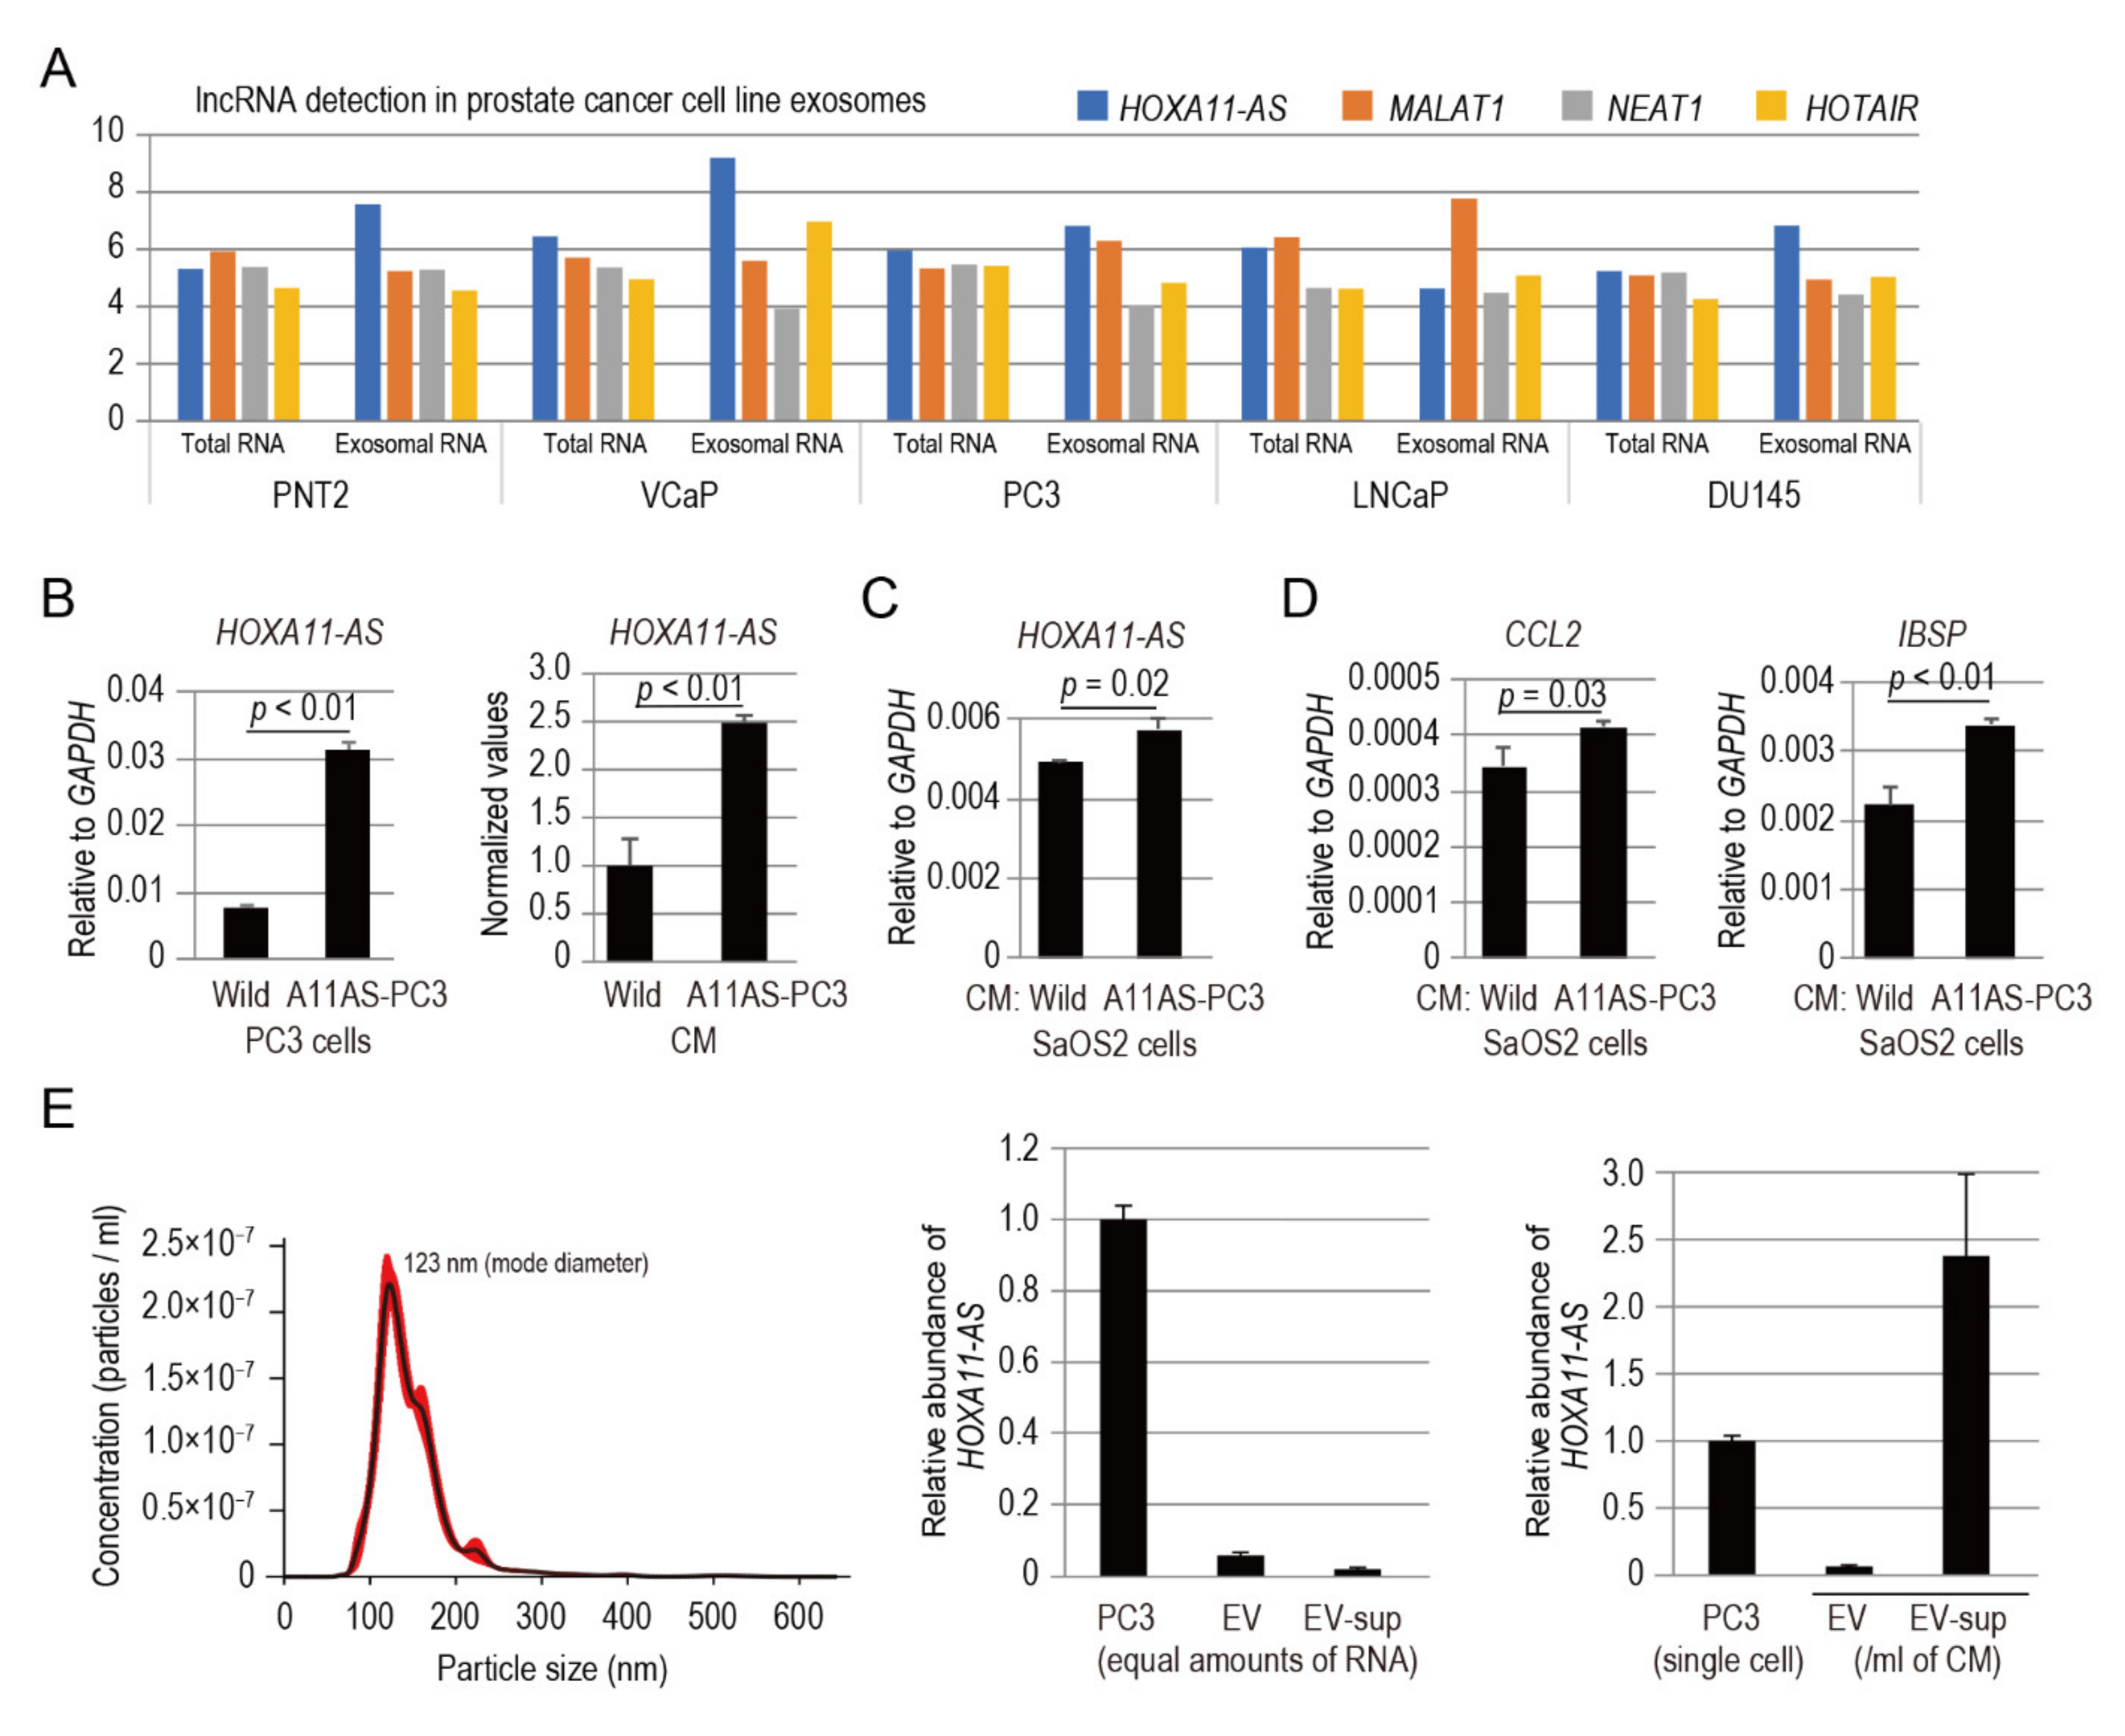
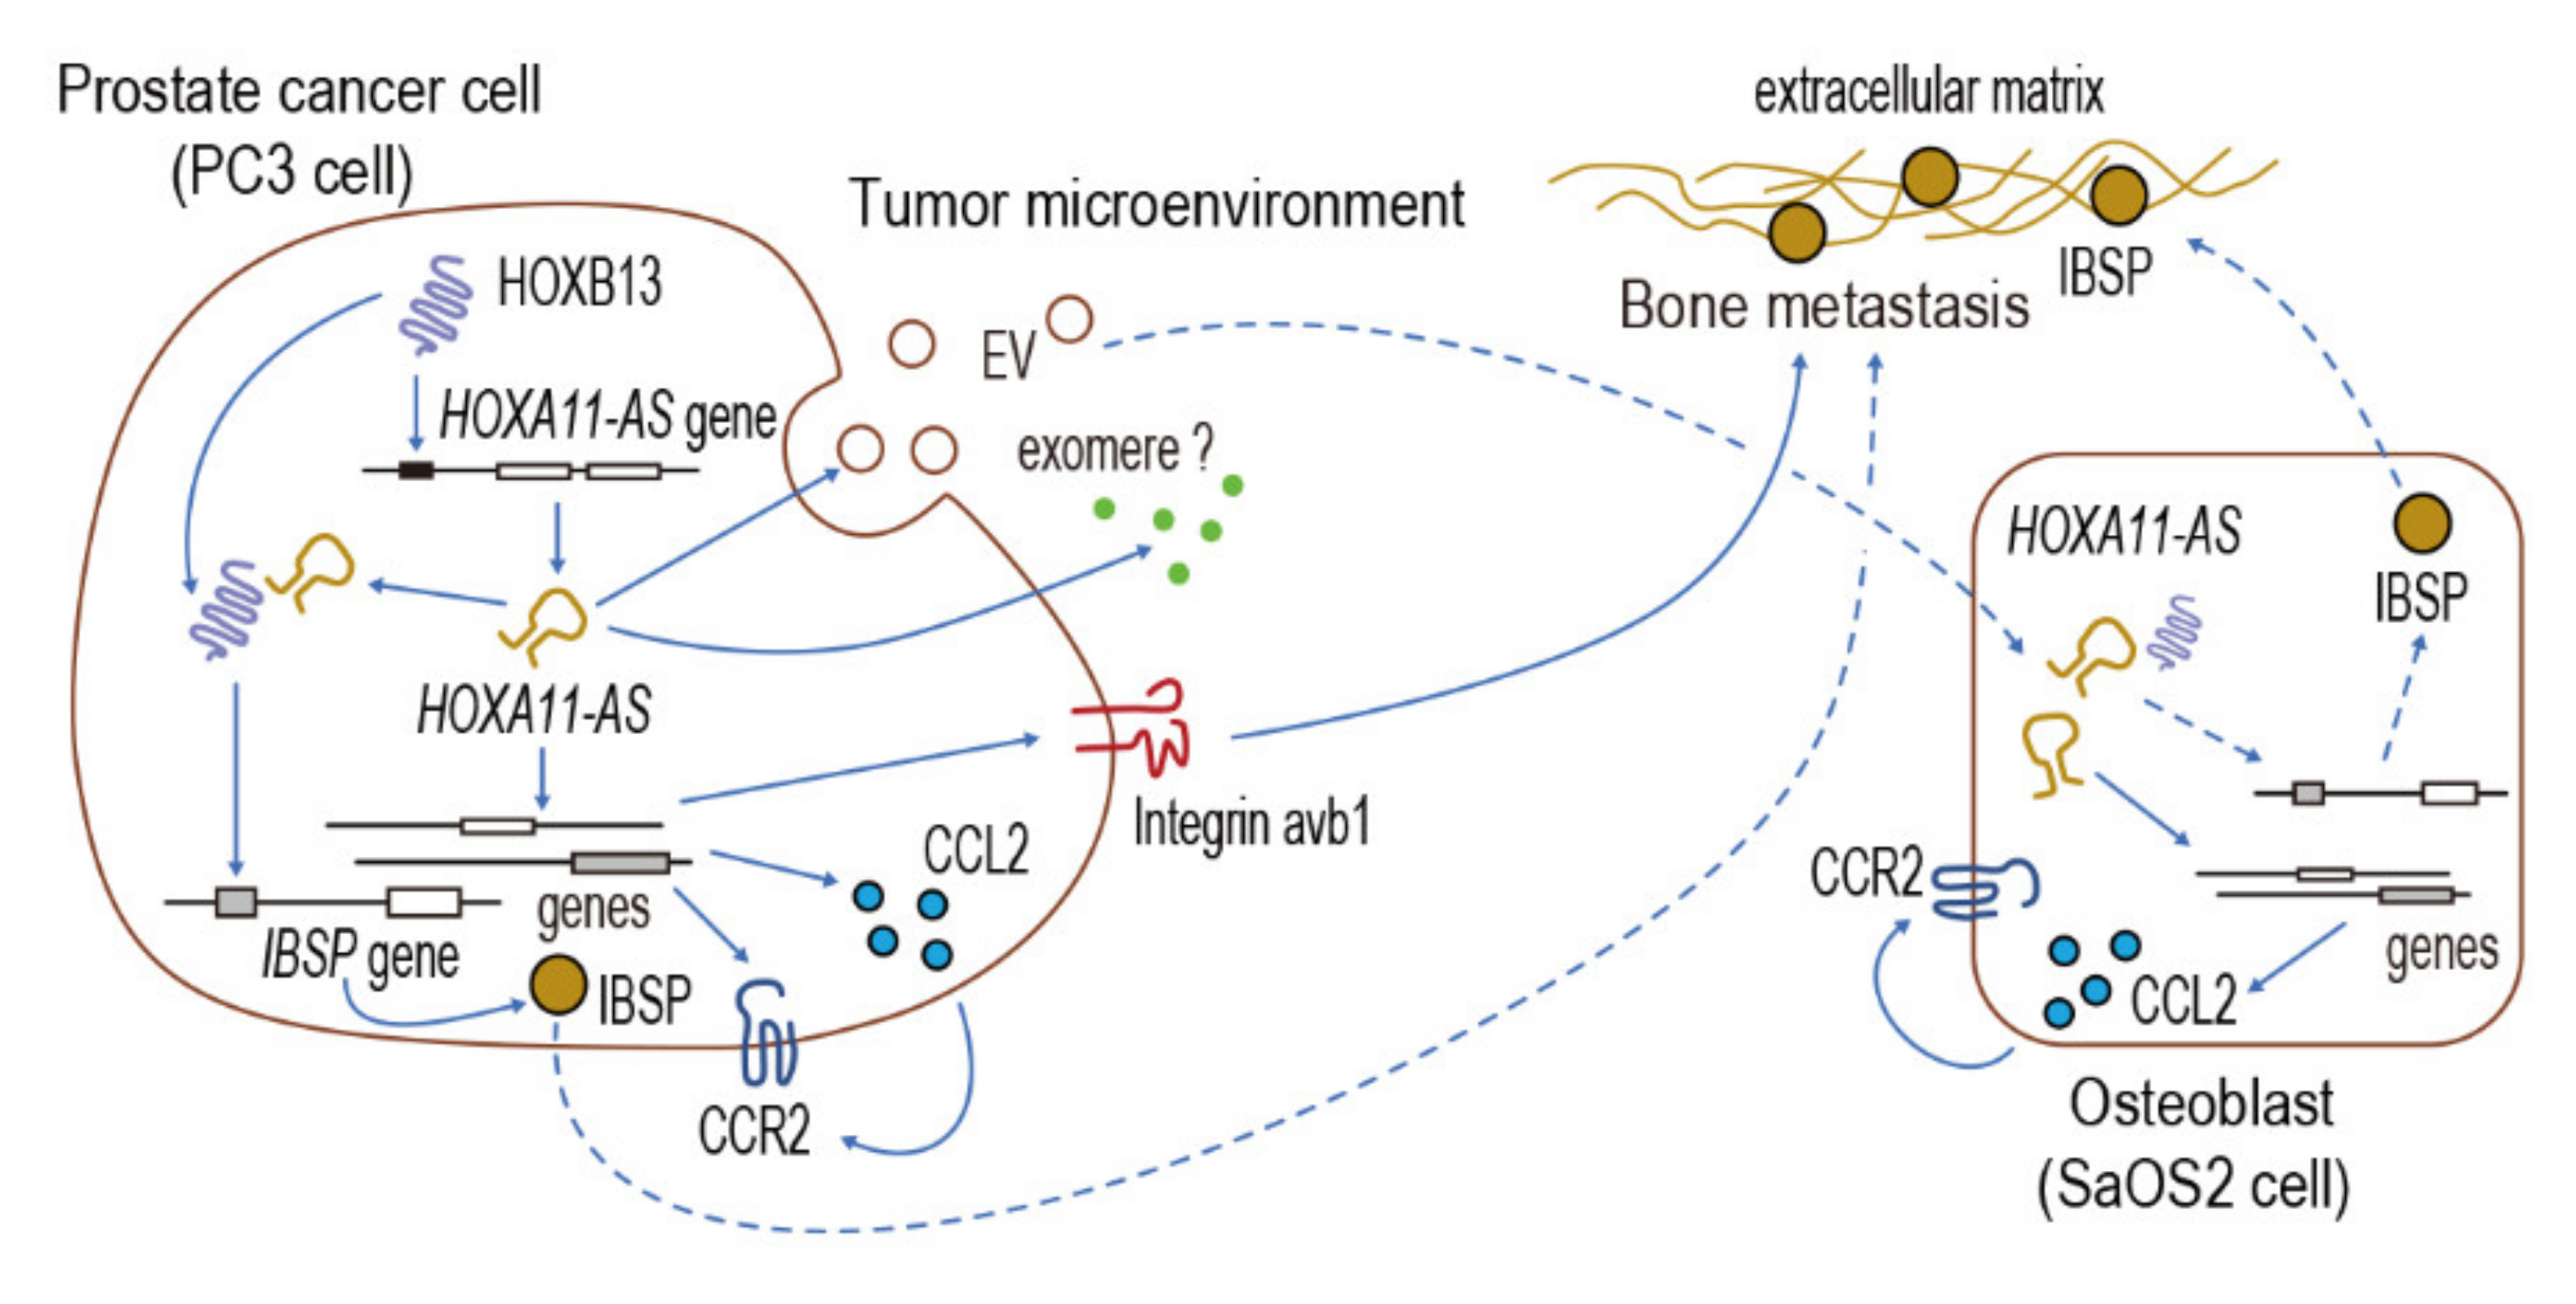
3.7. HOXA11-AS Secreted from Prostate Cancer Cells Modulates the Expression of CCL2 and IBSP in Osteoblastic Cells

Extracellular vesicles (EVs) including exosomes, which are small cell-derived vesicles (40–150 nm in diameter), are mediators of the communication between cancer cells and the tumor microenvironment [23]. In a previous work, cellular and exosomal lncRNAs expressed in four prostate cancer cell lines (VCaP, PC3, LNCaP, and DU145) and a normal prostate epithelium cell line (PNT2) were characterized by lncRNA array analysis [24]. We utilized a lncRNA array dataset (GSE81034) to analyze the expression of well-known, cancer metastasis-associated lncRNAs (i.e., MALAT-1, NEAT-1, HOTAIR, and HOXA11-AS) in the five cell lines by comparing exosomal RNA versus total RNA (Figure 5A). Notably, HOXA11-AS was among the detected lncRNAs in exosomal RNA purified from prostate cancer cell lines (Figure 5A). We hypothesized that HOXA11-AS may be transferred from prostate cancer cells to osteoblasts, possibly via EVs, to promote CCL2 expression in the recipient cells.
To investigate the transfer of PC3-derived HOXA11-AS to human osteoblastic osteosarcoma cell SaOS2 cells, we constructed stable clones overexpressing HOXA11-AS (designated as A11AS-PC3; Figure 5B). HOXA11-AS was significantly highly enriched in conditioned medium (CM) from A11AS-PC3 cells cultured for 48 h compared with control cells (wild type PC3 cells), as detected by qPCR analysis (Figure 5B). After 48 h of culture with A11AS-PC3-CM, HOXA11-AS was significantly upregulated in SaOS2 cells (Figure 5C). Moreover, culturing SaOS2 cells with A11AS-PC3-CM for 48 h led to significantly greater expression levels of CCL2 and IBSP (Figure 5D). These results indicate that PC3-derived HOXA11-AS is transferred to SaOS2 cells, suggesting that cancer HOXA11-AS modulates the expression of osteoblastic cytokine CCL2 and bone matrix protein IBSP to attract cancer cells.
To assess whether PC3-derived HOXA11-AS is present in EVs in PC3-CM, EVs were isolated from wild type PC3-CM in accordance with the differential ultracentrifugation approach described by Thery et al. [12]. PC3 EVs exhibited sizes of 147.8 ± 45.3 nm (mean ± standard deviation) (Figure 5E, left panel). HOXA11-AS was present in PC3-derived EVs (Figure 5E, center panel). However, HOXA11-AS was enriched in the EV-subtracted supernatant (designated as EV-sup; Figure 5E, right panel), which suggests that non-vesicular forms are equipped to transfer HOXA11-AS to the recipient cells.

4. Discussion

Cancer transcriptome analysis has identified thousands of lncRNAs that are associated with different types of cancers [25]. Recently, there has been increasing evidence that lncRNAs play fundamental roles in regulation of the immune system; immune-related lncRNAs (including HOXA11-AS) involved in cancer have been systematically identified [26,27,28]. Several studies have shown that HOXA11-AS exhibited oncogenic roles through different mechanisms in various types of cancers (e.g., breast cancer, lung cancer, liver cancer, gastric carcinoma, and osteosarcoma) [8,9,10,11,29,30,31,32,33,34]. This work is the first to demonstrate that HOXA11-AS is highly expressed in prostate cancer cell lines derived from bone metastases (PC3 and VCaP cells), and that it contributes to prostate cancer cell proliferation and invasion. We identified HOXB13 as an upstream regulator of HOXA11-AS, and found that HOXA11-AS regulated the CCL2/CCR2 signaling associated with prostate cancer bone metastasis. Furthermore, we demonstrated that the HOXB13/HOXA11-AS axis regulated IBSP promoter and integrin subunits specific to prostate cancer bone metastasis. Finally, we showed that HOXA11-AS secreted from PC3 cells could accelerate CCL2 and IBSP expression in recipient SaOS2 osteoblastic cells.
In this study, we identified HOXB13 as an upstream transcriptional regulator of HOXA11-AS in human bone metastatic prostate PC3 cells. Deregulation of HOXB13 expression has been implicated in a variety of other human cancers, functioning as a tumor-promoting factor in some tumor types and a tumor-repressing factor in other tumor types [35,36,37,38,39,40,41,42]. Within the context of HOXB13-associated binding partners, HOXB13 may provide specificity for DNA binding and subsequent tumor progression or repression. In prostate cancer, HOXB13, which is highly expressed in adulthood in the normal prostate [43], functions as a coregulator of AR, together with FOXA1, to modulate the epigenetic status required for prostate tumorigenesis [15,16]. In the present work, we elucidated a novel mechanism for the promotion of prostate cancer bone metastasis, whereby HOXB13 transcriptionally activates and cooperates with HOXA11-AS, another putative binding partner of HOXB13. HOXB13 was shown to positively regulate both HOXA11-AS and HOXA11 through a bidirectional promoter. As HOXA11-AS repressed HOXA11, while HOXA11 enhanced HOXA11-AS, further analyses are necessary to unveil the relation among HOXA11-AS, HOXA11, and HOXB13.
Although we did not experimentally confirm direct regulation of CDH1 and MMP3 by HOXA11-AS, we found several HOXB13 binding sites in the genomic or intergenic region of these genes though ChIP Atlas database using Integrative Genomics Viewer (IGV) software (Figure S6). Relatively strong HOXB13 binding site (MACS2 score: 739) was found 6 kb upstream the transcription initiation site of MMP3. Another HOXB13 binding site (MACS2 score: 607) was found at the 3′ end of MMP3 gene. In the intronic region of CDH1 gene, several HOXB13 binding sites (MACS2 score up to 410) were found. It is possible that HOXB13 and HOXA11-AS, as a possible HOXB13-binding RNA, regulate the expression of MMP3 and CDH1 as well as IBSP (Figure S6).
Our findings indicate that the HOXB13/HOXA11-AS axis may trigger cytokine and integrin signaling through the modulation of CCL2/CCR2. In small cell lung cancer, CXCL12 induces integrin activation, which results in enhanced adhesion of cancer cells to the extracellular matrix, thereby conferring resistance to chemotherapeutic drugs [44]. Integrins are cell adhesion receptors of the extracellular matrix activated by chemokines that regulate the local microenvironment. They are glycoproteins that form 24 distinct heterodimers from a combination of alpha (α) and beta (β) subunits. At least 18 α (ITGA) and 8 β (ITGB) integrin subunits exist [45,46] Altered integrin expression patterns have been linked to many types of cancer [47,48,49]. Sottnik et al. [50] showed that ITGA2:ITGB1 (α2β1) integrin was elevated in prostate cancer skeletal metastases, compared with either prostate cancer primary lesions or soft tissue metastases; this finding suggests that ITGA2:ITGB1 integrin contributes to selective metastasis to the bone. De et al. [51] reported that ITGAV:ITGB3 (αvβ3) and ITGAV:ITGB5 (αvβ5) integrins were significantly upregulated in bone metastases. Our work indicates that the HOXB13/HOXA11-AS axis enhances the expression levels of integrin subunits ITGAV and ITGB1. The results are substantially in agreement with the findings of the previous studies. HOXA11-AS-regulated CCL2/CCR2 may modulate the expression of HOXB13/HOXA11-AS-regulated integrins in prostate cancer; however, this interaction requires further investigation in future studies.
In this study, the expression of IBSP, a gene highly expressed in castration-resistant prostate cancer clinical specimens specifically metastasizing to bone, was found to be positively regulated by HOXB13/HOXA11-AS. IBSP is a non-collagenous protein and a member of the small integrin-binding ligand, n-linked glycoprotein family [52]. IBSP was found to be expressed by all osteotropic cancers examined, including prostate, lung, thyroid, neuroblastoma, and multiple myeloma; thus, this bone matrix protein might be implicated in the preferential seed and growth of metastatic cells in bone [53,54,55]. Previous reports have shown that the IBSP promoter contains a fibroblast growth factor 2 response element (−96 to −89) and a homeodomain protein-binding site (HOX; −200 to −191) [56,57], but the involvement of HOXB13 in IBSP promoter regulation is a novel finding, denoting the importance of the HOXB13/HOXA11-AS axis in prostate cancer bone metastasis.
Many studies have previously investigated cancer–osteoblast interactions in the context of bone metastasis [58,59]. Kimura et al. [60] reported that CM from PC3 cells stimulated calcification in the Tak-10 human osteoblastic cell line. Their findings suggest that some factors generated in prostate cancer cells were secreted and transferred into recipient osteoblasts to modify their function. We demonstrated that HOXA11-AS secreted from prostate cancer PC3 cells was able to modify CCL2 and IBSP expression levels in SaOS2 osteoblastic cells in a paracrine manner. Several lncRNAs are associated with extracellular vesicles [61]. Some cancer-related lncRNAs (e.g., MALAT1, HOTAIR, GAS5, and lincRNA-p21) were found to be enriched in exosomes [62], suggesting that lncRNAs disseminate cell signals and alter the local cellular microenvironment via EVs. In this study, we hypothesized that PC3 cell-derived EVs could serve as a primary mechanism for transfer of HOXA11-AS to SaOS2 cells. Although EVs might partially contribute to the prostate cancer–osteoblast interaction (Figure 5E), PC3-derived HOXA11-AS was presumably transferred to SaOS2 cells in an extracellular vesicle-independent manner. Recently, a novel population of non-membranous nanoparticles, termed exomeres (~35 nm in diameter), was discovered by asymmetric flow field-flow fractionation [63]. Exomeres exhibit a distinct cargo protein profile compared with EVs; exomeres show enriched levels of metabolic enzymes (e.g., MAT1A1 and ST6Gal-I), Argonaute proteins, and amyloid precursor protein [63,64]. Zhang et al. [64] showed that exomere cargos (i.e., ST6Gal-I and EGFR ligand amphiregulin) could be transferred to cancer cells, resulting in modified biological activities of recipient cells. Future studies are needed to identify the main transport systems that permit the transfer of PC3-derived HOXA11-AS to recipient SaOS2 cells.
In conclusion, our study developed a unique model that may explain the interrelationship among lncRNAs, transcription factors, chemokines, and integrins, resulting in the high osteotropism of prostate cancer metastasis (Figure 6). Our results suggest that the lncRNA, HOXA11-AS, together with its transcription factor, HOXB13, regulate the osteotropism of prostate cancer cells through specific downstream cytokine and integrin signals. Although further studies are needed to demonstrate the orchestrated function of HOXA11-AS and HOXB13, additional research regarding the signaling pathways that are intrinsic to the invasive and migratory phenotype of prostate cancer holds promise for the development of novel cancer therapeutics with greater efficacy.

Supplementary Materials

The following are available online at https://www.mdpi.com/2073-4425/12/2/182/s1, Figure S1: AR is not involved in the regulation of HOXA11-AS, Figure S2: FOXA1 is not involved in the regulation of HOXA11-AS, Figure S3: HOXB13 knockdown downregulates HOXA11-AS. Figure S4: HOXB13 knockdown downregulates CCR2, Figure S5: HOXB13 and HOXA11-AS knockdown modulates protein levels of integrin subunits, Figure S6: HOXB13 binding sites on MMP3 and CDH1 gene locus in prostate cancer cells, Table S1: PCR primers used for plasmid construction, Table S2. siRNAs used for gene silencing, Table S3. PCR primers used for qRT-PCR analysis, Table S4. Membrane associated genes commonly upregulated by HOXA11-AS and HOXB13 knockdown, Table S5. Cytokines involved in the progression of prostate cancer bone metastasis.

Author Contributions

T.T. and A.M. conceived and designed the experiments; A.M. and T.T. performed experimental analysis; A.M, Y.K., H.T., and T.T. analyzed the data; A.M. and T.T. drafted the manuscript. All authors have read and agreed to the published version of the manuscript.

Funding

This research was funded by Grants-in-Aid for Scientific Research from the Ministry of Education, Culture, Sports, Science and Technology (MEXT)/Japan Society for the Promotion of Science, Japan, grant numbers 18K09181 to A.M.; 18K08583 to H.T.; 17K11256 and 20K09611 to T.T., and by the Nippon Medical School Grant-in-Aid for Medical Research (2018) to H.T., Y.K., and T.T.

Data Availability Statement

Data available in a publicly accessible repository. The data presented in this study are openly available in the Gene Expression Omnibus database at https://www.ncbi.nlm.nih.gov/geo, reference number GSE147710.

Acknowledgments

The authors thank Takuji Kosuge (Dept. Molecular Medicine and Anatomy, Nippon Medical School) and Ayaka Ando for their technical assistance.

Conflicts of Interest

The authors declare no conflict of interest.

References

  1. Jinnah, A.H.; Zacks, B.C.; Gwam, C.U.; Kerr, B.A. Emerging and Established Models of Bone Metastasis. Cancers (Basel) 2018, 10, 176. [Google Scholar] [CrossRef] [Green Version]
  2. Holland, P.W. Evolution of homeobox genes. Wiley Interdiscip. Rev. Dev. Biol. 2013, 2, 31–45. [Google Scholar] [CrossRef] [PubMed]
  3. Cillo, C.; Faiella, A.; Cantile, M.; Boncinelli, E. Homeobox genes and cancer. Exp. Cell Res. 1999, 248, 1–9. [Google Scholar] [CrossRef] [PubMed]
  4. Bhatlekar, S.; Fields, J.Z.; Boman, B.M. HOX genes and their role in the development of human cancers. J. Mol. Med. (Berlin) 2014, 92, 811–823. [Google Scholar] [CrossRef]
  5. Rinn, J.L.; Kertesz, M.; Wang, J.K.; Squazzo, S.L.; Xu, X.; Brugmann, S.A.; Goodnough, H.L.; Helms, J.A.; Farnham, P.J.; Segal, E.; et al. Functional demarcation of active and silent chromatin domains in human HOX loci by noncoding RNAs. Cell 2007, 129, 1311–1323. [Google Scholar] [CrossRef] [PubMed] [Green Version]
  6. Evans, J.R.; Feng, F.Y.; Chinnaiyan, A.M. The bright side of dark matter: lncRNAs in cancer. J. Clin. Investig. 2016, 126, 2775–2782. [Google Scholar] [CrossRef] [Green Version]
  7. Rinn, J.L. lncRNAs: Linking RNA to chromatin. Cold Spring Harb. Perspect. Biol. 2014, 6, a018614. [Google Scholar] [CrossRef] [Green Version]
  8. Liu, Z.; Chen, Z.; Fan, R.; Jiang, B.; Chen, X.; Chen, Q.; Nie, F.; Lu, K.; Sun, M. Over-expressed long noncoding RNA HOXA11-AS promotes cell cycle progression and metastasis in gastric cancer. Mol. Cancer 2017, 16, 82. [Google Scholar] [CrossRef] [Green Version]
  9. Sun, M.; Nie, F.; Wang, Y.; Zhang, Z.; Hou, J.; He, D.; Xie, M.; Xu, L.; De, W.; Wang, Z.; et al. LncRNA HOXA11-AS Promotes Proliferation and Invasion of Gastric Cancer by Scaffolding the Chromatin Modification Factors PRC2, LSD1, and DNMT1. Cancer Res. 2016, 76, 6299–6310. [Google Scholar] [CrossRef] [Green Version]
  10. Xue, J.Y.; Huang, C.; Wang, W.; Li, H.B.; Sun, M.; Xie, M. HOXA11-AS: A novel regulator in human cancer proliferation and metastasis. Onco Targets Ther. 2018, 11, 4387–4393. [Google Scholar] [CrossRef] [Green Version]
  11. Cui, M.; Wang, J.; Li, Q.; Zhang, J.; Jia, J.; Zhan, X. Long non-coding RNA HOXA11-AS functions as a competing endogenous RNA to regulate ROCK1 expression by sponging miR-124-3p in osteosarcoma. Biomed. Pharmacother. 2017, 92, 437–444. [Google Scholar] [CrossRef] [PubMed]
  12. Thery, C.; Amigorena, S.; Raposo, G.; Clayton, A. Isolation and characterization of exosomes from cell culture supernatants and biological fluids. Curr. Protoc. Cell Biol. 2006, 3, 22. [Google Scholar] [CrossRef] [PubMed]
  13. Yoshioka, Y.; Kosaka, N.; Konishi, Y.; Ohta, H.; Okamoto, H.; Sonoda, H.; Nonaka, R.; Yamamoto, H.; Ishii, H.; Mori, M.; et al. Ultra-sensitive liquid biopsy of circulating extracellular vesicles using ExoScreen. Nat. Commun. 2014, 5, 3591. [Google Scholar] [CrossRef] [PubMed]
  14. Xing, Z.; Li, S.; Liu, Z.; Zhang, C.; Bai, Z. CTCF-induced upregulation of HOXA11-AS facilitates cell proliferation and migration by targeting miR-518b/ACTN4 axis in prostate cancer. Prostate 2020, 80, 388–398. [Google Scholar] [CrossRef] [PubMed]
  15. Stelloo, S.; Nevedomskaya, E.; Kim, Y.; Hoekman, L.; Bleijerveld, O.B.; Mirza, T.; Wessel, L.F.A.; van Weerden, W.M.; Alteraal, A.F.M.; Bergamn, A.M.; et al. Endogenous androgen receptor proteomic profiling reveals genomic subcomplex involved in prostate tumorigenesis. Oncogene 2018, 37, 313–322. [Google Scholar] [CrossRef] [PubMed]
  16. Pomerantz, M.M.; Li, F.; Takeda, D.Y.; Lenci, R.; Chonkar, A.; Chabot, M.; Cejas, P.; Vasquez, F.; Cook, J.; Shivdasani, R.A.; et al. The androgen receptor cistrome is extensively reprogrammed in human prostate tumorigenesis. Nat. Genet. 2015, 47, 1346–1351. [Google Scholar] [CrossRef]
  17. Wang, L.; Cui, Y.; Sheng, J.; Yang, Y.; Kuang, G.; Fan, Y.; Jin, J.; Zhang, Q. Epigenetic inactivation of HOXA11, a novel functional tumor suppressor for renal cell carcinoma, is associated with RCC TNM classification. Oncotarget 2017, 8, 21861–21870. [Google Scholar] [CrossRef] [Green Version]
  18. Viola, A.; Luster, A.D. Chemokines and their receptors: Drug targets in immunity and inflammation. Annu. Rev. Pharmacol. Toxicol. 2008, 48, 171–197. [Google Scholar] [CrossRef]
  19. Zhang, J.; Lu, Y.; Pienta, K.J. Multiple roles of chemokine (C-C motif) ligand 2 in promoting prostate cancer growth. J. Natl. Cancer Inst. 2010, 102, 522–528. [Google Scholar] [CrossRef] [Green Version]
  20. Kinashi, T. Intracellular signalling controlling integrin activation in lymphocytes. Nat. Rev. Immunol. 2005, 5, 546–559. [Google Scholar] [CrossRef]
  21. Ganss, B.; Kim, R.H.; Sodek, J. Bone sialoprotein. Crit. Rev. Oral Biol. Med. 1999, 10, 79–98. [Google Scholar] [CrossRef] [PubMed]
  22. Tu, Q.; Zhang, J.; Fix, A.; Brewer, E.; Li, Y.P.; Zhang, Z.Y.; Chen, J. Targeted overexpression of BSP in osteoclasts promotes bone metastasis of breast cancer cells. J. Cell Physiol. 2009, 218, 135–145. [Google Scholar] [CrossRef] [PubMed] [Green Version]
  23. Ruivo, C.F.; Adem, B.; Silva, M.; Melo, S.A. The Biology of Cancer Exosomes: Insights and New Perspectives. Cancer Res. 2017, 77, 6480–6488. [Google Scholar] [CrossRef] [PubMed] [Green Version]
  24. Ahadi, A.; Khoury, S.; Losseva, M.; Tran, N. A comparative analysis of lncRNAs in prostate cancer exosomes and their parental cell lines. Genom. Data 2016, 9, 7–9. [Google Scholar] [CrossRef] [Green Version]
  25. Huarte, M. The emerging role of lncRNAs in cancer. Nat. Med. 2015, 21, 1253–1261. [Google Scholar] [CrossRef]
  26. Chen, Y.G.; Satpathy, A.T.; Chang, H.Y. Gene regulation in the immune system by long noncoding RNAs. Nat. Immunol. 2017, 18, 962–972. [Google Scholar] [CrossRef]
  27. Hur, K.; Kim, S.H.; Kim, J.M. Potential Implications of Long Noncoding RNAs in Autoimmune Diseases. Immune Netw. 2019, 19, e4. [Google Scholar] [CrossRef]
  28. Li, Y.; Jiang, T.; Zhou, W.; Li, J.; Li, X.; Wang, Q.; Jin, X.; Yin, J.; Chen, L.; Zhang, Y.; et al. Pan-cancer characterization of immune-related lncRNAs identifies potential oncogenic biomarkers. Nat. Commun. 2020, 11, 1000. [Google Scholar] [CrossRef] [Green Version]
  29. Yu, W.; Peng, W.; Jiang, H.; Sha, H.; Li, J. LncRNA HOXA11-AS promotes proliferation and invasion by targeting miR-124 in human non-small cell lung cancer cells. Tumour Biol. 2017, 39, 1010428317721440. [Google Scholar] [CrossRef] [Green Version]
  30. Zhao, X.; Li, X.; Zhou, L.; Ni, J.; Yan, W.; Ma, R.; Wu, J.; Feng, J.; Chen, P. LncRNA HOXA11-AS drives cisplatin resistance of human LUAD cells via modulating miR-454-3p/Stat3. Cancer Sci. 2018, 109, 3068–3079. [Google Scholar] [CrossRef]
  31. Li, N.; Yang, M.; Shi, K.; Li, W. Long non-coding RNA HOXA11-AS in human cancer: A meta-analysis. Clin. Chim. Acta 2017, 474, 165–170. [Google Scholar] [CrossRef] [PubMed]
  32. Chen, D.; Sun, Q.; Zhang, L.; Zhou, X.; Cheng, X.; Zhou, D.; Ye, F.; Lin, J.; Wang, W. The lncRNA HOXA11-AS functions as a competing endogenous RNA to regulate PADI2 expression by sponging miR-125a-5p in liver metastasis of colorectal cancer. Oncotarget 2017, 8, 70642–70652. [Google Scholar] [CrossRef] [PubMed]
  33. Li, W.; Jia, G.; Qu, Y.; Du, Q.; Liu, B.; Liu, B. Long Non-Coding RNA (LncRNA) HOXA11-AS Promotes Breast Cancer Invasion and Metastasis by Regulating Epithelial-Mesenchymal Transition. Med. Sci. Monit. 2017, 23, 3393–3403. [Google Scholar] [CrossRef] [PubMed] [Green Version]
  34. Zhang, W.L.; Zhao, Y.N.; Shi, Z.Z.; Gu, G.Y.; Cong, D.; Wei, C.; Bai, Y.S. HOXA11-AS promotes the migration and invasion of hepatocellular carcinoma cells by inhibiting miR-124 expression by binding to EZH2. Hum. Cell 2019, 32, 504–514. [Google Scholar] [CrossRef]
  35. Zhao, Y.; Yamashita, T.; Ishikawa, M. Regulation of tumor invasion by HOXB13 gene overexpressed in human endometrial cancer. Oncol. Rep. 2005, 13, 721–726. [Google Scholar] [CrossRef]
  36. Miao, J.; Wang, Z.; Provencher, H.; Muir, B.; Dahiya, S.; Carney, E.; Leong, C.O.; Sgroi, D.C.; Orsulic, S. HOXB13 promotes ovarian cancer progression. Proc. Natl. Acad. Sci. USA 2007, 104, 17093–17098. [Google Scholar] [CrossRef] [Green Version]
  37. Lopez, R.; Garrido, E.; Pina, P.; Hidalgo, A.; Lazos, M.; Ochoa, R.; Salcedo, M. HOXB homeobox gene expression in cervical carcinoma. Int. J. Gynecol. Cancer 2006, 16, 329–335. [Google Scholar] [CrossRef]
  38. Maeda, K.; Hamada, J.; Takahashi, Y.; Tada, M.; Yamamoto, Y.; Sugihara, T.; Moriuchi, T. Altered expressions of HOX genes in human cutaneous malignant melanoma. Int. J. Cancer 2005, 114, 436–441. [Google Scholar] [CrossRef]
  39. Ma, X.J.; Wang, Z.; Ryan, P.D.; Isakoff, S.J.; Barmettler, A.; Fuller, A.; Muir, B.; Mohapatra, G.; Salunga, R.; Tuggle, J.T.; et al. A two-gene expression ratio predicts clinical outcome in breast cancer patients treated with tamoxifen. Cancer Cell 2004, 5, 607–616. [Google Scholar] [CrossRef] [Green Version]
  40. Okuda, H.; Toyota, M.; Ishida, W.; Furihata, M.; Tsuchiya, M.; Kamada, M.; Tokito, T.; Shuin, T. Epigenetic inactivation of the candidate tumor suppressor gene HOXB13 in human renal cell carcinoma. Oncogene 2006, 25, 1733–1742. [Google Scholar] [CrossRef] [Green Version]
  41. Xie, B.; Bai, B.; Xu, Y.; Liu, Y.; Lv, Y.; Gao, X.; Wu, F.; Fang, Z.; Lou, Y.; Pan, H.; et al. Tumor-suppressive function and mechanism of HOXB13 in right-sided colon cancer. Signal Transduct. Target Ther. 2019, 4, 51. [Google Scholar] [CrossRef] [PubMed]
  42. Cantile, M.; Scognamiglio, G.; La Sala, L.; La Mantia, E.; Scaramuzza, V.; Valentino, E.; Tatangelo, F.; Losito, S.; Pezzullo, L.; Chifalo, M.G.; et al. Aberrant expression of posterior HOX genes in well differentiated histotypes of thyroid cancers. Int. J. Mol. Sci. 2013, 14, 21727–21740. [Google Scholar] [CrossRef] [PubMed] [Green Version]
  43. Brechka, H.; Bhanvadia, R.R.; VanOpstall, C.; Vander, G.D.J. HOXB13 mutations and binding partners in prostate development and cancer: Function, clinical significance, and future directions. Genes Dis. 2017, 4, 75–87. [Google Scholar] [CrossRef] [PubMed]
  44. Hartmann, T.N.; Burger, J.A.; Glodek, A.; Fujii, N.; Burger, M. CXCR4 chemokine receptor and integrin signaling co-operate in mediating adhesion and chemoresistance in small cell lung cancer (SCLC) cells. Oncogene 2005, 24, 4462–4471. [Google Scholar] [CrossRef] [Green Version]
  45. Hood, J.D.; Cheresh, D.A. Role of integrins in cell invasion and migration. Nat. Rev. Cancer 2002, 2, 91–100. [Google Scholar] [CrossRef]
  46. Hamidi, H.; Ivaska, J. Every step of the way: Integrins in cancer progression and metastasis. Nat. Rev. Cancer 2018, 18, 533–548. [Google Scholar] [CrossRef] [Green Version]
  47. Seguin, L.; Desgrosellier, J.S.; Weis, S.M.; Cheresh, D.A. Integrins and cancer: Regulators of cancer stemness, metastasis, and drug resistance. Trends Cell Biol. 2015, 25, 234–240. [Google Scholar] [CrossRef] [PubMed] [Green Version]
  48. Hamidi, H.; Pietila, M.; Ivaska, J. The complexity of integrins in cancer and new scopes for therapeutic targeting. Br. J. Cancer 2016, 115, 1017–1023. [Google Scholar] [CrossRef] [PubMed] [Green Version]
  49. Raab-Westphal, S.; Marshall, J.F.; Goodman, S.L. Integrins as Therapeutic Targets: Successes and Cancers. Cancers (Basel) 2017, 9, 110. [Google Scholar] [CrossRef]
  50. Sottnik, J.L.; Daignault-Newton, S.; Zhang, X.; Morrissey, C.; Hussain, M.H.; Keller, E.T.; Hall, C.L. Integrin alpha2beta 1 (alpha2beta1) promotes prostate cancer skeletal metastasis. Clin. Exp. Metastasis 2013, 30, 569–578. [Google Scholar] [CrossRef] [PubMed] [Green Version]
  51. De, S.; Chen, J.; Narizhneva, N.V.; Heston, W.; Brainard, J.; Sage, E.H.; Byzova, T.V. Molecular pathway for cancer metastasis to bone. J. Biol. Chem. 2003, 278, 39044–39050. [Google Scholar] [CrossRef] [PubMed] [Green Version]
  52. Fisher, L.W.; Jain, A.; Tayback, M.; Fedarko, N.S. Small integrin binding ligand N-linked glycoprotein gene family expression in different cancers. Clin. Cancer Res. 2004, 10, 8501–8511. [Google Scholar] [CrossRef] [Green Version]
  53. Waltregny, D.; Bellahcene, A.; van Riet, I.; Fisher, L.W.; Young, M.; Fernandez, P. Prognostic value of bone sialoprotein expression in clinically localized human prostate cancer. J. Natl. Cancer Inst. 1998, 90, 1000–1008. [Google Scholar] [CrossRef] [PubMed] [Green Version]
  54. Bellahcene, A.; Maloujahmoum, N.; Fisher, L.W.; Pastorino, H.; Tagliabue, E.; Menard, S.; Castronovo, V. Expression of bone sialoprotein in human lung cancer. Calcif. Tissue Int. 1997, 61, 183–188. [Google Scholar] [CrossRef] [PubMed]
  55. Bellahcene, A.; Albert, V.; Pollina, L.; Basolo, F.; Fisher, L.W.; Castronovo, V. Ectopic expression of bone sialoprotein in human thyroid cancer. Thyroid 1998, 8, 637–641. [Google Scholar] [CrossRef] [PubMed]
  56. Kim, R.H.; Shapiro, H.S.; Li, J.J.; Wrana, J.L.; Sodek, J. Characterization of the human bone sialoprotein (BSP) gene and its promoter sequence. Matrix Biol. 1994, 14, 31–40. [Google Scholar] [CrossRef]
  57. Nakayama, Y.; Nakajima, Y.; Kato, N.; Takai, H.; Kim, D.S.; Arai, M.; Mezawa, M.; Araki, S.; Sodek, J.; Ogata, Y. Insulin-like growth factor-I increases bone sialoprotein (BSP) expression through fibroblast growth factor-2 response element and homeodomain protein-binding site in the proximal promoter of the BSP gene. J. Cell Physiol. 2006, 208, 326–335. [Google Scholar] [CrossRef]
  58. Krishnan, R.; Klumpers, D.D.; Park, C.Y.; Rajendran, K.; Trepat, X.; van Bezu, J.; van Hinsbergh, V.W.M.; Carman, V.C.; Brain, J.D.; Fredberg, J.J.; et al. Substrate stiffening promotes endothelial monolayer disruption through enhanced physical forces. Am. J. Physiol. Cell Physiol. 2011, 300, C146–C154. [Google Scholar] [CrossRef] [Green Version]
  59. Rajski, M.; Vogel, B.; Baty, F.; Rochlitz, C.; Buess, M. Global gene expression analysis of the interaction between cancer cells and osteoblasts to predict bone metastasis in breast cancer. PLoS ONE 2012, 7, e29743. [Google Scholar] [CrossRef] [Green Version]
  60. Kimura, G.; Sugisaki, Y.; Masugi, Y.; Nakazawa, N. Calcification in human osteoblasts cultured in medium conditioned by the prostatic cancer cell line PC-3 and prostatic acid phosphatase. Urol. Int. 1992, 48, 25–30. [Google Scholar] [CrossRef]
  61. Ma, P.; Pan, Y.; Li, W.; Sun, C.; Liu, J.; Xu, T.; Shu, Y. Extracellular vesicles-mediated noncoding RNAs transfer in cancer. J. Hematol. Oncol. 2017, 10, 57. [Google Scholar] [CrossRef] [PubMed] [Green Version]
  62. Gezer, U.; Ozgur, E.; Cetinkaya, M.; Isin, M.; Dalay, N. Long non-coding RNAs with low expression levels in cells are enriched in secreted exosomes. Cell Biol. Int. 2014, 38, 1076–1079. [Google Scholar] [CrossRef] [PubMed]
  63. Zhang, H.; Freitas, D.; Kim, H.S.; Fabijanic, K.; Li, Z.; Chen, H.; Tesic, M.M.; Molina, H.; Martin, A.B.; Bojmar, L.; et al. Identification of distinct nanoparticles and subsets of extracellular vesicles by asymmetric flow field-flow fractionation. Nat. Cell Biol. 2018, 20, 332–343. [Google Scholar] [CrossRef] [PubMed]
  64. Zhang, Q.; Higginbotham, J.N.; Jeppesen, D.K.; Yang, Y.P.; Li, W.; McKinley, E.T.; Graves-Deal, R.; Ping, J.; Britain, C.M.; Dorsett, K.A.; et al. Transfer of Functional Cargo in Exomeres. Cell Rep. 2019, 27, 940–954.e6. [Google Scholar] [CrossRef] [Green Version]
Figure 1. Identification of HOXA11-AS as a lncRNA highly expressed in bone metastasis-derived prostate cancer. (A) Flow diagram for the analysis of lncRNAs in VCaP and LNCaP cell lines. Sequencing data were downloaded from NCBI Gene Expression Omnibus (GSE82225). (B) Expression analysis of HOX cluster-derived lncRNAs in VCaP and LNCaP cell lines. Y-axis shows the fold change of the number of reads per kilobase of exon model per million mapped reads (RPKM) in VCaP cells with respect to the RPKM in LNCaP cells, calculated as the ratio between RPKM (VCaP)/RPKM(LNCaP) for each lncRNA shown in the X-axis. (C) HOXA11-AS expression analysis by qPCR in four different prostate cancer cell lines. (D) HOXA11-AS knockdown efficiency assessed by qPCR in PC3 cells transfected with siRNAs targeting HOXA11-AS. (E) xCELLigence real-time invasion assay of PC3 cells transfected with siRNA targeting HOXA11-AS; cell index represents invading cells at 48 h (left panel). xCELLigence real-time proliferation assay of PC3 cells transfected with siRNA targeting HOXA11-AS; cell index represents proliferating cells at 48 h (right panel). (F) CDH1 and MMP3 expression analysis by qPCR in PC3 cells transfected with siRNAs targeting HOXA11-AS. qPCR analyses were performed in triplicate (n = 3). Expression levels are presented relative to values of GAPDH, used as a reference gene. Values represent mean ± standard deviation. Statistical significance was determined by unpaired t-tests. *, p < 0.05. **, p < 0.01.
Genes 12 00182 g001
Figure 2. HOXB13 is an upstream regulator of HOXA11-AS. (A) Analysis of HOXB13 (orange box) and AR binding sites near HOXA11-AS gene (red box) using ChIP-Atlas database (https://chip-atlas.org/). The colors of peaks indicate the statistical significance values calculated by the peak-caller MACS2 (MACS2 scores). (B) Analysis of HOXB13 gene expression levels in 16 different cancers using Oncomine database (https://www.oncomine.org/resource/login.html). HOX13 expression levels in prostate cancer are indicated by a red box. Values on y-axis indicate log2 median-centered intensity, which ranges from 6.5 to −5.0. (CE) Expression analysis by qPCR of PC3 cells transfected for 48 h with siRNAs targeting HOXA11-AS, HOXB13, and HOXA11. (F) Microarray analysis of PC3 cells transfected with siRNAs. Heatmap represents gene expression changes in PC3 cells transfected for 48 h with siRNAs targeting HOXA11-AS, HOXB13, and HOXA11. Red and green colors represent genes with increased (>2) and decreased (2<) expression levels, respectively, relative to negative control siRNA (siNC)-transfected cells. (G) HOXA11-AS exons, promoter region, and luciferase vector insert region are shown. HOXA11-AS Prom (+) includes the promoter region and part of exon 1 of the HOXA11-AS gene. HOXA11-AS Prom (−) covers the region after the promoter and part of exon 1. (H) Knockdown efficiency of PC3 cells transfected with siHOXB13. (I) Luciferase assay of PC3 cells co-transfected with siHOXB13 and luciferase vector, with or without HOXA11-AS promoter region (HOXA11-AS Prom (+) or HOXA11-AS Prom (−)). Vectors with siNC were used as control. Values were normalized to Renilla luciferase activity. (J) CDH1, MMP3, and HOXA11-AS expression analysis by qPCR in PC3 cells transfected with siRNAs targeting HOXB13. Data represent mean ± standard deviation. qPCR analyses were performed in triplicate (n = 3). Expression levels are presented relative to values of GAPDH, used as a reference gene. Values represent mean ± standard deviation. Statistical significance was determined by unpaired t-tests. *, p < 0.05. **, p < 0.01.
Genes 12 00182 g002
Figure 3. HOXB13/HOXA11-AS axis regulates CCL2/CCR2 signaling and integrin subunits specific to prostate cancer bone metastasis. (A) Pathway analysis of HOXB13/HOXA11-AS-regulated genes. Most relevant signaling pathways with lower p values are shown. (B) qPCR analysis of CCL2 and CCR2 in PC3 cells transfected for 48 h with siHOXA11-AS. (C) qPCR analysis of CCL2, CCR2, and HOXA11-AS in SaOS2 cells transfected for 24 h with siHOXA11-AS. (D) Expression analysis of different integrin subunits, IBSP, HOXB13, and CCL2, in castration-resistant prostate cancer clinical specimens that had metastasized to bone and other organs. A set of clinical samples from the NCBI Gene Expression Omnibus database (GEO Accession No. GSE74685) was analyzed. Values on y-axis represent batch-normalized log2 Cy3 signal intensity. (E) qPCR analysis of different integrin subunits (ITGA5, ITGAV, ITGB1, ITGB3, ITGB4, and ITGB5) of PC3 cells transfected for 48 h with siHOXB13 and siHOXA11-AS. qPCR analyses were performed in triplicate (n = 3). Expression levels are presented relative to values of GAPDH, used as a reference gene. Values represent mean ± standard deviation. Statistical significance was determined by unpaired t-tests. *, p < 0.05. **, p < 0.01.
Genes 12 00182 g003
Figure 4. IBSP promoter is directly regulated by HOXB13 in combination with HOXA11-AS. (A) IBSP expression analysis by qPCR in PC3 cells transfected for 48 h with siHOXB13 or siHOXA11-AS. (B) IBSP exons, promoter region with HOXB13 binding site, and luciferase vector insert are shown. (C) Luciferase assay of PC3 cells co-transfected with siHOXB13 or siHOXA11-AS and luciferase vector. Vectors with negative control siRNA (siNC) were used as controls. Values were normalized to Renilla luciferase activity. Data represent mean ± standard deviation. (D) Expression analysis of HOXA11-AS and IBSP by qPCR in PC3 cells transfected for 48 h with or without HOXA11-AS expression vector. (E) ChIP analysis of HOXB13 in IBSP promoter region in PC3 cells transfected for 24 h with siHOXA11-AS. IBSP promoter enrichment relative to input was measured by qPCR. qPCR analyses were performed in triplicate (n = 3). Expression levels are presented relative to values of GAPDH, used as a reference gene. Values represent mean ± standard deviation. Statistical significance was determined by unpaired t-tests. *, p < 0.05. **, p < 0.01.
Genes 12 00182 g004
Figure 5. Prostate cancer PC3 cell-derived HOXA11-AS modulates IBSP and CCL2 expression in SaOS2 osteoblastic cells in a paracrine manner. (A) The expression levels of well-known, cancer metastasis-associated lncRNAs (MALAT-1, NEAT-1, HOTAIR, and HOXA11-AS) in exosomes of prostate cancer cell lines by comparison of exosomal RNA versus total RNA. A lncRNA array dataset from NCBI Gene Expression Omnibus (GSE81034) was used; values represent raw signal intensities. (B) HOXA11-AS expression of PC3 stable cells overexpressing HOXA11-AS (designated as A11AS-PC3) and wild type PC3 cells (Wild); HOXA11-AS detection in conditioned medium (CM) of A11AS-PC3 and Wild. (C) HOXA11-AS expression of SaOS2 cells treated for 48 h with CM of A11AS-PC3 and Wild. (D) CCL2 and IBSP expression of SaOS2 cells treated for 48 h with CM of A11AS-PC3 and Wild. qPCR analyses were performed in triplicate (n = 3). Expression levels are presented relative to values of GAPDH, used as a reference gene, except for the right panel of B. The expression level of HOXA11-AS in CM of Wild was set to 1.0 in the right panel of B. Values represent mean ± standard deviation. Statistical significance was determined by unpaired t-tests. (E) Analysis of the size distribution of isolated EVs from wild type PC3-CM by the NanoSight nanoparticle tracking system (left panel). Comparison of relative abundances of HOXA11-AS in PC3 cell, and EV and EV-subtracted supernatant [EV-sup] fractions of PC3-CM by qPCR; equal amounts of RNA were applied (center panel). Relative abundances of HOXA11-AS in PC3 cell, and EV and EV-sup fractions are also shown as values per cell and values per mL of CM, respectively (right panel). The expression levels of PC3 were set to 1.0. Data are presented as mean ± standard deviation of triplicate data (n = 1).
Genes 12 00182 g005
Figure 6. Working model of HOXB13 and HOXA11-AS for promotion of prostate cancer bone metastasis. HOXB13/HOXA11-AS axis regulates integrin and CCL2/CCR2 cytokine signaling in prostate cancer cells, while paracrine action of HOXA11-AS-secreted from prostate cancer PC3 cells is able to modulate CCL2/CCR2 cytokine signaling in osteoblasts within the bone marrow milieu.
Genes 12 00182 g006
Publisher’s Note: MDPI stays neutral with regard to jurisdictional claims in published maps and institutional affiliations.

