
Diversity, Dispersal and Mode of Reproduction of Amanita exitialis in Southern China


1
College of Life Science, Hunan Normal University, Changsha 410081, China
2
Department of Biology, McMaster University, Hamilton, ON L8S 4K1, Canada
*
Author to whom correspondence should be addressed.
†
These two authors contributed equally.
Genes 2021, 12(12), 1907; https://doi.org/10.3390/genes12121907
Submission received: 3 November 2021
/
Revised: 26 November 2021
/
Accepted: 26 November 2021
/
Published: 27 November 2021
(This article belongs to the Special Issue Population Genetics of Fungi)
Abstract
:Amanita exitialis is a poisonous mushroom and has caused many deaths in southern China. In this study, we collected 118 fruiting bodies of A. exitialis from seven different sites in Guangdong Province in southern China and investigated their genetic relationships using 14 polymorphic molecular markers. These 14 markers grouped the 118 fruiting bodies into 20 multilocus genotypes. Among these 20 genotypes, eight were each found only once while the remaining 12 were each represented by two to 54 fruiting bodies. Interestingly, among the 12 shared genotypes, four were shared between/among local populations that were separated by as far as over 80 km, a result consistent with secondary homothallic reproduction and long-distance spore dispersal. Despite the observed gene flow, significant genetic differentiations were found among the local populations, primarily due to the over-representation of certain genotypes within individual local populations. STRUCTURE analyses revealed that the 118 fruiting bodies belonged to three genetic clusters, consistent with divergence within this species in this geographic region. Interestingly, we found an excess of heterozygous individuals at both the local and the total sample level, suggesting potential inbreeding depression and heterozygous advantage in these populations of A. exitialis. We discuss the implications of our results for understanding the life cycle, dispersal, and evolution of this poisonous mushroom.
1. Introduction
Over the last decade, more than 10,000 mushroom poisonings have been reported in China, including at least 788 deaths. In addition, from 2010 to 2020, the number of recorded mushroom poisoning has increased significantly, from 37 in 2010 to 2,705 in 2020 [1]. In China, 480 mushroom taxa are known to be poisonous [2], among which 12 belonged to the genus Amanita [3,4,5]. These 12 Amanita species contain the lethal amanitin toxins and are among the deadliest mushrooms known. From 1994 to 2012, more than 90% of fatal mushroom poisonings were caused by ingestion of lethal amanitas in Australia, East Asia, and North America [6,7,8,9]. Investigations from 2000 to 2019 in southern China indicated that Amanita exitialis Zhu L. Yang & T.H. Li caused at least 116 poisoning cases including 44 fatalities, accounted for 73.33 % of the mortality from lethal mushroom poisoning cases in the area [6,10,11,12]. The early reports of A. exitialis poisoning mainly came from Guangdong Province in southern China [13]. However, in the last few years, documented A. exitialis poisoning cases have been reported in Yunnan and Guizhou Provinces in China as well as in Thailand [14,15,16]. The toxins in A. exitialis include α-amanitin (α-AMA), β-amanitin (β-AMA), phallacidin (PCD), phallisacin (PSC), phallisin (PHS) and phalloin (PHN), with the highest content being α-AMA [17,18,19]. Ingestion of these toxins can lead to acute liver failure and death [13,17,18].
The fungus A. exitialis was first described in China by Yang and Li in 2001 [20] and was subsequently reported from India and Thailand [21]. This species belongs to the lethal Amanita subclade in Amanita section Phalloideae (Fr.) Que´l. Morphologically, the fruiting bodies are white for both the cap and stipe, with the center of the cap often appearing creamy. The fruiting bodies are typically small to medium-sized with pileus 4 to 8 cm in diameter, with a friable annulus and a subglobose basal bulb. The basidiospores of A. exitialis are relatively large, 9.5–12.0 × 9.0–11.5 µm, globose to subglobose in shape, and amyloid. Unlike most agaric mushrooms which typically have four-spored basidia, the basidia of A. exitialis are almost entirely two-spored [3]. It is noteworthy that A. exitialis forms basidiomata in early spring to early summer in Guangdong Province but in middle to late summer in Yunnan Province [4]. Field observations suggested that A. exitialis associates mycorrhizally with Castanopsis fissa (Champ. ex Benth.) Rehd. et Wils. or Lithocarpus glaber (Thunb.) Nakai, two deciduous Fagaceae tree species found only in East Asia and South Asia.
Like most mushrooms, the fruiting bodies of A. exitialis represent only the sexual reproductive structure while most of the biomass of the fungus in nature are present underground as vegetative mycelia. Fruiting bodies at close proximity to each other but sharing the same genotype could be derived from the same vegetative mycelia, from the same ancestral spore/mating event and represent the same genetic individual of A. exitialis in nature. Thus, the relationship between physical distance and genotypes among the fruiting bodies within each site could help shed light on the potential size and longevity of the genetic individuals of this species in nature. At present, the size of genetic individuals of A. exitialis in nature is not known.
Several recent studies of A. exitialis have greatly contributed to our understanding of this species at the molecular level. For example, the transcriptome data for A. exitialis were obtained in 2013 [22,23]. Comparative genome analyses with other poisonous amanitas helped researchers identify the genes responsible for α-AMA biosynthesis in A. exitialis fruiting bodies [24], as well as MSDIN genes and the gene coding for prolyl oligopeptidase B (POPB) [22]. Based on the transcriptome sequence, He et al. designed MSDIN and POPB gene-specific primers for rapid assays of toxic mushrooms in 2019 [25]. However, there has been no research on the patterns of genetic variation in natural populations of A. exitialis.
In this study, we collected and analyzed fruiting bodies of A. exitialis from seven sites in Guangdong Province in southern China. These samples were used to address several issues. First, are local and regional populations genetically differentiated, or are gene flows abundant among local and regional populations? Second, do all strains in the currently recognized A. exitialis species belong to one inter-breeding population in nature, or are there differentiated genetic clusters within this species from Guangdong Province? Third, what’s the likely mode of reproduction for A. exitialis in nature? Is it a homothallic, secondary homothallic, or heterothallic species?
2. Materials and Methods
2.1. Materials
The fruiting bodies of A. exitialis were collected over a five year span, from 2007 to 2012 in Guangdong Province. In total, we collected 118 fruiting body samples of A. exitialis from seven sites. Figure 1 shows the typical fresh basidiocarps of A. exitialis. Information about the seven collection sites is shown in Table 1.
2.2. DNA Extraction, Primer Selection and SNP Markers
To screen for polymorphic molecular markers, we first extracted the genomic DNA of a representative fruiting body of A. exitialis, using the CTAB-based method that was slightly modified for fungi as described previously [26]. The genomic DNA was digested by the HaeIII endonuclease and run on 1% agarose gel [27]. The DNA fragments between 1kb to 1.5kb were excised from the agarose gel and purified with the QIAquick PCR purification Kit. The obtained DNA fragments were subcloned into pPCR-Script Amp predigested cloning vector with a PCR-Script Amp Cloning Kit (Stratagene, La Jolla, CA, USA). The recombinant molecules were transformed into the XL10-Gold® Kan Ultracompetent cells. The transformed cells were grown and screened for E. coli colonies containing recombinant molecules. The A. exitialis genomic DNA fragments inserted into the cloning vector were individually amplified by PCR and sequenced.
From the obtained A. exitialis DNA sequences, we designed a total of 80 primer pairs to screen for DNA fragments with readily recognizable sequence polymorphisms, including single nucleotide polymorphisms (SNPs) and insertion/ deletions, within the same fruiting body that we used to construct the genomic library. Among these 80 primer pairs, six pairs amplified fragments containing sequence polymorphisms within the mushroom. The SNPs within the fruiting body were shown as double peaks in the sequence chromatograph at specific positions. In contrast, the insertions/deletions were shown as either amplified fragment length polymorphisms on the agarose gel (large insertion/deletions) or in chromatographs where the 5’ portion of the sequence was clean while the remaining portion towards the 3’ end after the insertion/deletion was unreadable. The sequences for the six primer pairs are as follows (5’-3’): (1) A31-F GGGCGCAGTGGAATAGTAGA, A31-R TCCACAGATGGATGGACAAA; (2) G24-F CCTCTGGAGAAGTGGTTGGA, G24-R GGATGCAGCCTTACTGGAAA; (3) C21-F: TATCCAAAGACGTCCCCTCA, C21-R CGATTTTCCAGCTCGCTAAC; (4) H11F: GAGATGCGAGAGATCATACCG, H11R: GGTTCAGGTTCGTCCGAGT; (5) K47-F CGGAGTGGAACATGGTGTATC, K47-R: GCACTCCCACACCTCAACTT; (6) M12-F: GGGTGGGCAACTCTCTGTTA, M12-R AGGAGCTAGGGCTCAACTG. These six primer pairs were used to amplify and sequence all 118 fruiting bodies of A. exitialis. A total of 482 sequences and amplified fragment length polymorphisms shown on agarose gels (after electrophoresis) from these samples were analyzed to identify the patterns of genetic variation within and among fruiting bodies and populations of A. exitialis in Guangdong Province.
2.3. Data and Statistical Analysis
2.3.1. Analyses of Molecular Variance (AMOVA)
The program GenAlEx v6.5 was used to infer the relationships among local populations through the analysis of molecular variance (AMOVA) based on the observed DNA polymorphisms data [28]. In addition, the potential relationship between genetic distance and geographic distances among fruiting bodies from the seven geographical populations was examined using a Mantel test [29] as implemented in GenAlEx.
2.3.2. STRUCTURE for Population Genetic Structure Analysis
To identify whether our samples contain divergent genetic clusters of A. exitialis, we analyzed our A. exitialis samples using the program STRUCTURE v2.3.4, based on an admixture model. Models were tested for K-values ranging from 2 to 7, with 10 independent runs per K value. For each run, the initial burn-in period was set to 100,000 with 1,200,000 MCMC iterations. To determine the most probable value of K, the delta K method was used and implemented in Structure Harvester [30,31]. In addition, Distruct1.1 [32] and CLUMPP v1.1.2b [33] were used to infer the optimal K-cluster affiliations of individual fruiting bodies and populations based on STRUCTURE results respectively. The geographic map of A. exitialis fruiting bodies and populations was generated with ArcGIS v10.0 (http://www.esri.com/software/arcgis/arcgis-for-desktop, accessed on 1 November 2021) and modified manually by highlighting different landscape features and different genotypes with different colors using Adobe Photoshop CS6 (http://www.adobe.com/products/photoshop, accessed on 1 November 2021).
2.3.3. Genetic Relationships among Fruiting Bodies
To illustrate the relationships among the fruiting bodies based on their genotypes at the 14 molecular markers, we used the program MEGA v7 based on the Neighbor-Joining algorithm [34,35]. The potential migration among the seven geographical populations was detected by the Treemix program based on allele counts at these marker loci [36]. The specimen collection diagram uses Adobe Photoshop CS6 and Google Maps, and the colors are marked based on the population genetic structure data. Furthermore, the software OriginPro2018 (https://www.originlab.com/, accessed on 28 October 2021) was used to identify genetic clusters among individuals, which were then transformed into a three-dimensional principal components analysis (PCA) plot [37].
2.3.4. Mode of Reproduction in Nature
To investigate the potential mode of reproduction of A. exitialis, we compared the observed and expected counts of genotypes at each of the 14 molecular markers. The expected counts were derived based on the observed allele frequencies at each of the 14 markers and assuming random mating. Specifically, if there is random mating in the population, we expect that the observed genotype frequencies will be in Hardy–Weinberg equilibrium. Rejection of the Hardy–Weinberg equilibrium hypothesis would be inconsistent with random mating. Tests of Hardy–Weinberg equilibrium were conducted using the GenAlEx 6.5 program.
In addition to the test of Hardy–Weinberg equilibrium, we also examined the relationship between physical distance and genotypes of our fruiting bodies within each of the seven sites to determine the potential size of genetic individuals at each site.
3. Results
In this study, we developed 14 molecular markers and used these markers to analyze their patterns of genetic variation within and among 118 fruiting bodies of the poisonous mushroom A. exitialis from seven sites in Guangdong Province in southern China. Our genetic analysis grouped the 118 fruiting bodies into 20 multilocus genotypes. Below we describe the observed population genetic variation within and among the seven sites.
3.1. Distributions of Multilocus Genotypes within and among Sites
The distribution of the 20 multilocus genotypes is shown in Figure 2. Among these 20 genotypes, eight were unique, with multilocus genotype represented by only one fruiting body each. These eight multilocus genotypes are represented by pink squares in Figure 2. Among these eight genotypes, three were found in site A, two were in site C, one was in site D, and two were in site F. The remaining 12 genotypes were shared by two to 54 fruiting bodies distributed within and among the seven sites.
Here, the 12 shared genotypes are labeled as “a, b, c, d, e, f, g, h, i, j, k, l”, and they are represented by circles with different colors (Figure 2). Among these 12 shared genotypes, seven (“a”, “b”, “c”, “e”, “f”, “j”, “l”) only appeared in one local population each (the numbers of fruiting bodies for these seven shared genotypes are as follows: “a” = 2, “b” = 2, “c” = 3, “e” = 2, “f” = 2, “j” = 2, “l” = 3). Of the remaining five, genotype “d” contained 27 fruiting bodies distributed in six sites A, C, D, E, F, and G; genotype “g” contained three fruiting bodies distributed in two sites C and D; genotype “h” contained four fruiting bodies distributed in two sites A and C; genotype “i” contained 54 fruiting bodies distributed in five sites A, B, C, E, and F; and genotype “k” contained six fruiting bodies distributed in two sites A and C.
Overall, among the seven local populations, a range of one to nine genotypes was found at each site. Specifically, nine genotypes were found in site A, one in site B, seven in site C, four in site D, three in site E, four in site F, and three in site G.
Based on the distributions of shared genotype(s) within each of the sites, we estimated the approximate size of each genetic individual. As described above, among the 12 shared genotypes, seven (“a”, “b”, “c”, “e”, “f”, “j”, “l”) were found shared among fruiting bodies from within the same site. Their maximum physical distance between the two furthest fruiting bodies ranged from 10m (genotype “b” at site E and genotype “j” at site A) to 200 meters (genotype “f” at site G) (Figure 2). However, among sites, the physical distance between the fruiting bodies with shared genotypes ranged from 8km (genotype “g”) to over 80 kilometers (genotype “d”).
3.2. AMOVA Analysis and Mantel Test Results
For the seven natural geographical populations of A. exitialis, the analysis of molecular variance (AMOVA) showed that most (81%) of the observed genetic variations were found within individual local populations. However, 19% of total genetic diversity was attributable to among-population variation (p < 0.01; Table 2), consistent with significant genetic differentiation among these seven local populations. Despite the observed statistically significant differentiation, the estimated overall gene flow among the seven local populations was greater than 1 (Nm = 1.056), suggesting that the local populations are unlikely to be completely differentiated into different geographic species.
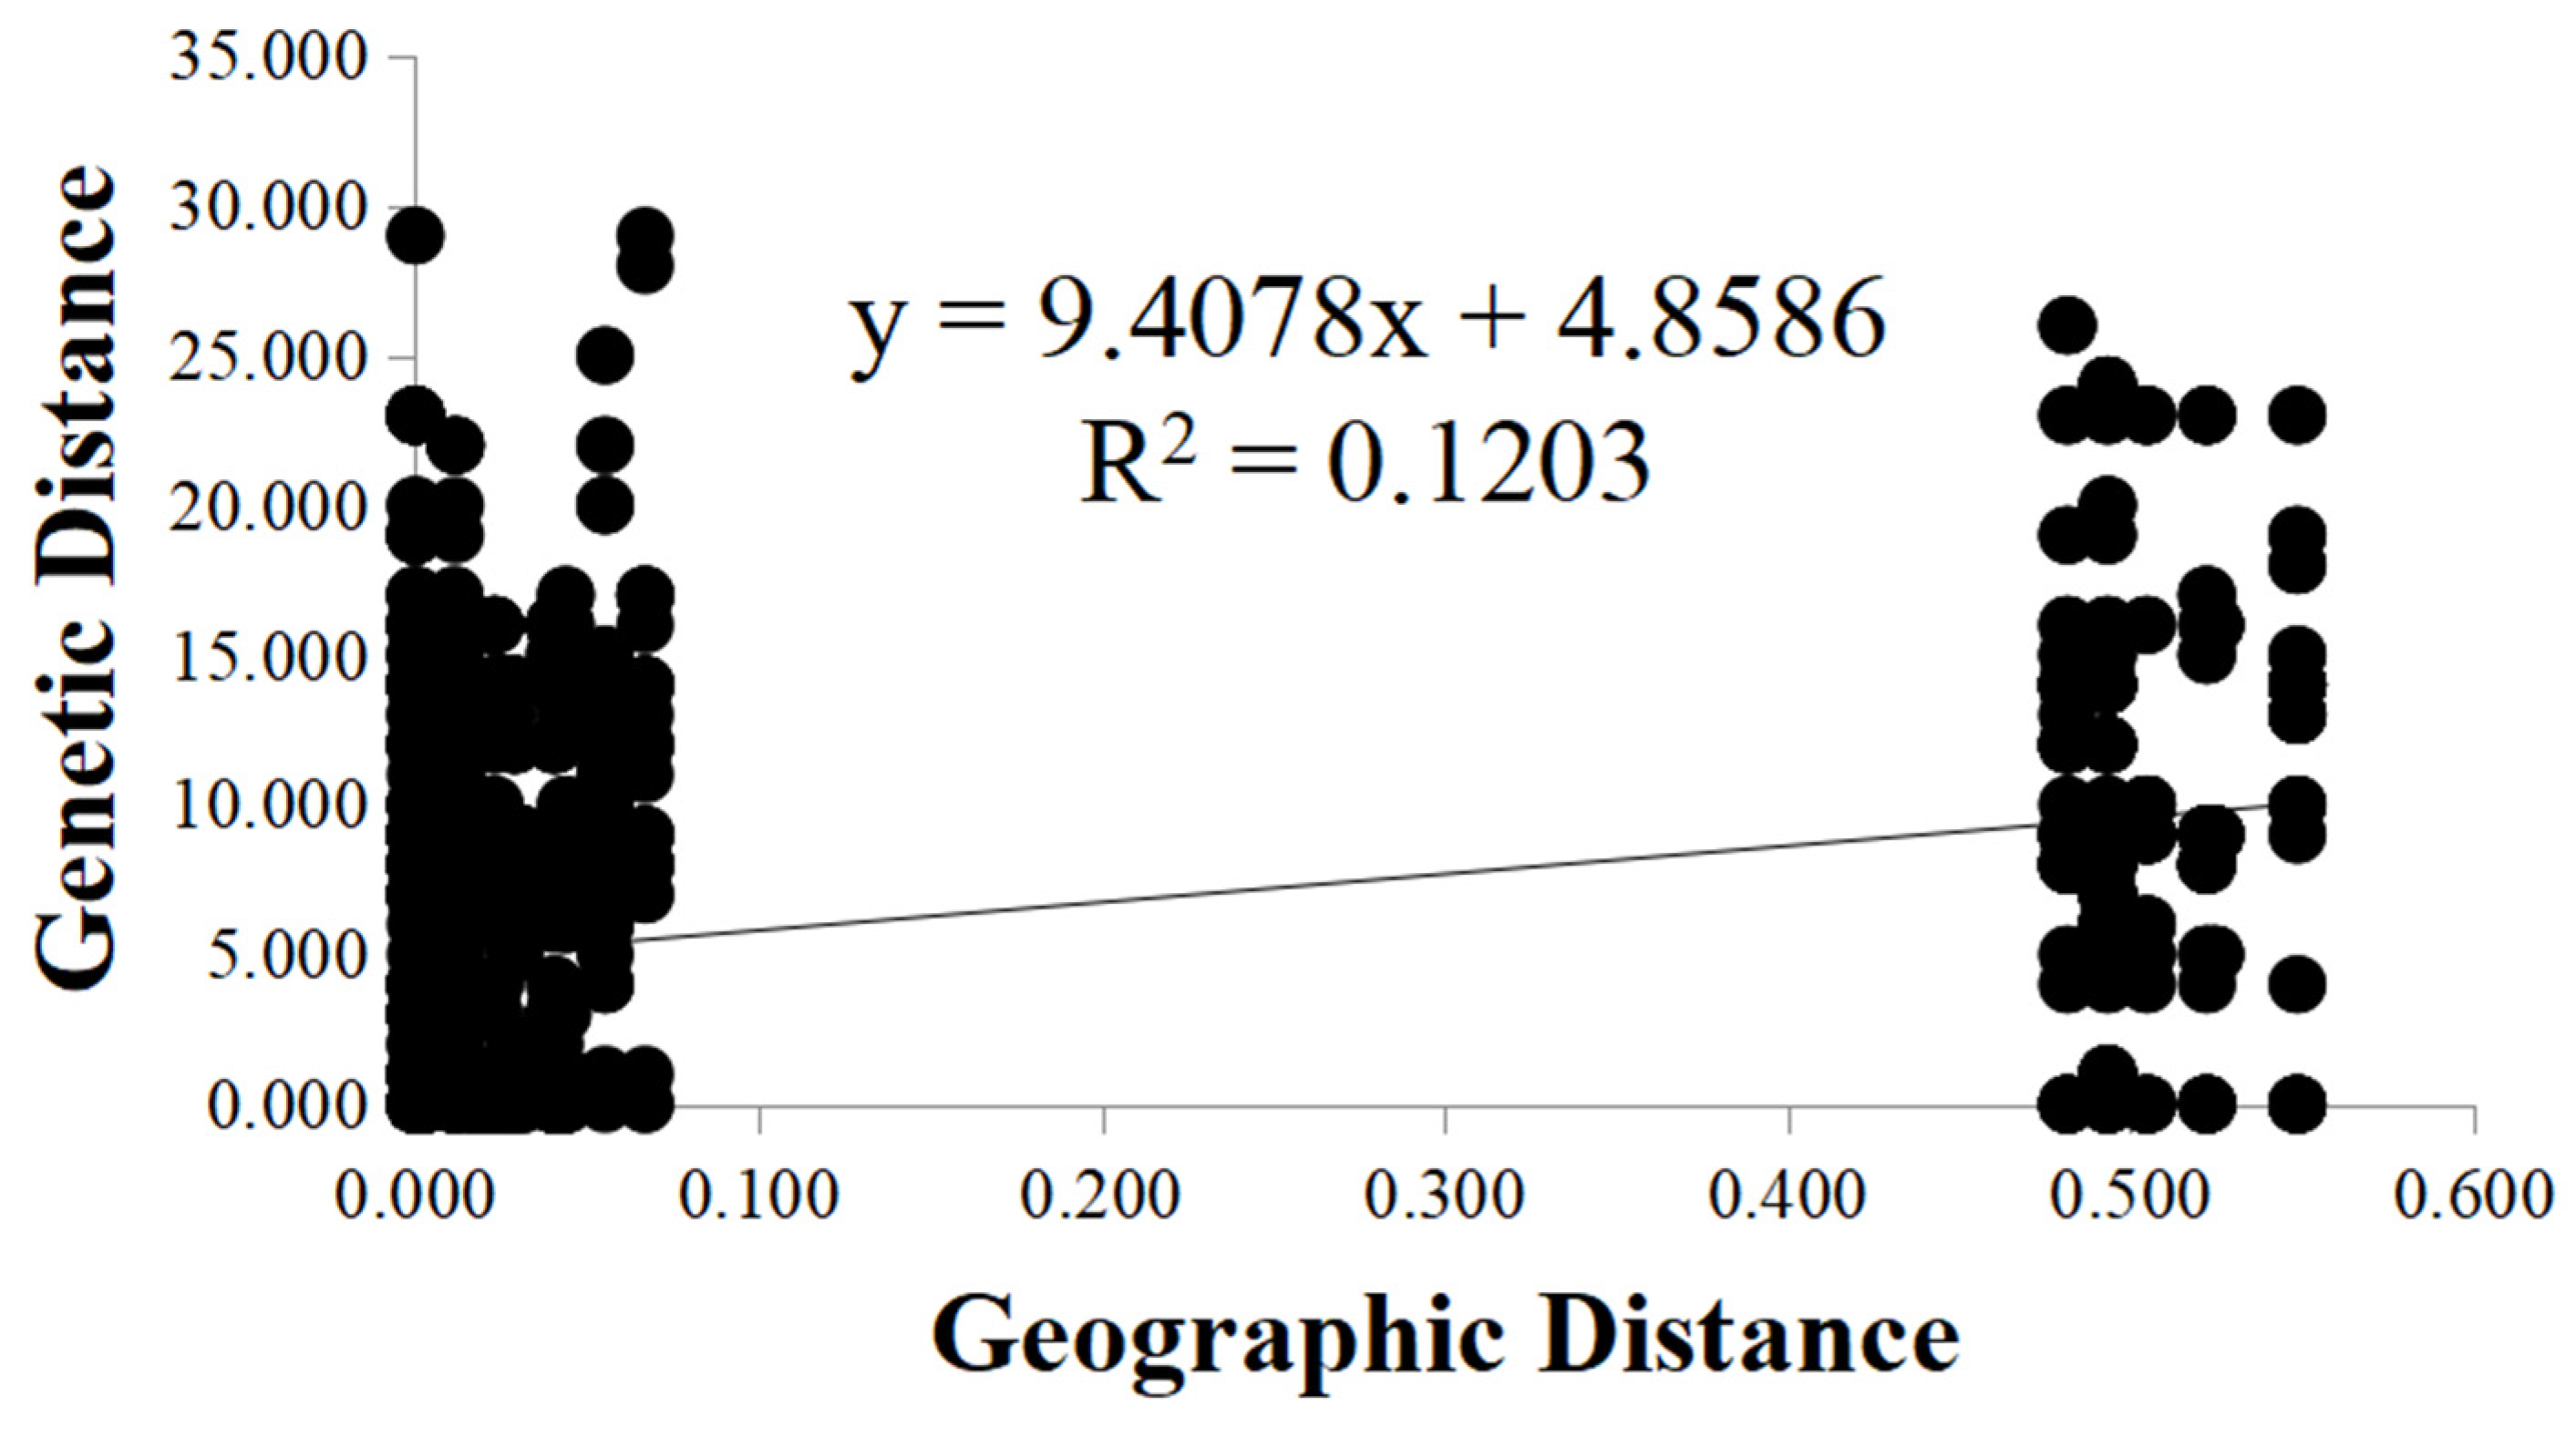
To investigate whether the geographic distance was a contributor to the observed genetic differentiation among the seven local populations, we determined the relationship between geographic distance and genetic distance between all pairs of fruiting bodies analyzed here using the Mantel test. Our analysis indicated a positive correlation between the genetic distance and geographic distance among the 118 fruiting bodies at the seven sites (R2 = 0.1203, p = 0.001) (Figure 3). The results suggested that physical distance was an important factor shaping the genetic structure among local populations of A. exitialis.
3.3. Genetic Clustering
The STRUCTURE program was used to infer the potential number of genetic clusters in our sample. Our analysis identified a strong peak of ΔK = 3, which indicated that the 118 fruiting bodies of A. exitialis were optimally clustered into three groups which we defined them as “Cluster 1” (in red), “Cluster 2” (in blue), and “Cluster 3” (in yellow) (Figure 4). Overall, Cluster 3 contained the highest number of fruiting bodies, followed by Cluster 2 and Cluster 1. Except for site B which contained only four fruiting bodies with all four belonging to Cluster 3, the remaining six local geographic populations each contained genetic elements from at least two clusters. Among the seven local populations, four local populations were dominated by genotypes in Cluster 3 (with all four in Guangzhou); one each in Guangzhou and Shenzhen were dominated by Cluster 2 genotypes, and the last local population in Guangzhou was dominated by Cluster 1 genotypes (Figure 4).
3.4. Neighbor-Joining (NJ) Phylogenetic Tree and PCA Analysis
To analyze the genetic relationships among the 118 A. exitialis fruiting bodies, we used the linear genetic distance based on their allelic composition at the 14 marker loci to build a neighbor-joining dendrogram (Figure 5a). The dendrogram results are largely consistent with those inferred based on the STRUCTURE program. Here, three fan-shaped colors correspond to the three genetic clusters as inferred based on the STRUCTURE program. Clade 1 is marked by the pale red fan-shape and it contains 25 fruiting bodies. Clade 2 is marked by the pale-blue fan-shape and it contains 31 fruiting bodies. Clade 3 is marked by the pale-yellow fan-shape and it contains 62 fruiting bodies. At the genotype level, the shared genotypes “d”, “e” and “f” are found in Clade 2. Shared genotypes “i”, “j” and “k” are found in Clade 3. The remaining shared genotypes as well as the eight unique genotypes (i.e., those represented by only one fruiting body each) are mainly found in Clade 1. As indicated above, the shared genotypes “d” and “i” were the most frequently found genotypes, represented by 27 and 54 fruiting bodies respectively.
Similarly, principal components analysis (PCA) showed the separation of the 118 fruiting bodies into three groups on this two-dimensional space (Figure 5b). Individuals in Cluster 2 and Cluster 3 are grouped relatively tightly within each group, while some individuals in Cluster 1 are relatively scattered. Overall, results from the neighbor-joining dendrogram, PCA, and STRUCTURE analyses are largely consistent with each other. However, inconsistencies were also observed. For example, phylogenetically, strains D4, D5, and D6 were close to A14 but they belonged to two different genetic clusters (Figure 5a).
3.5. Hardy–Weinberg Equilibrium Test
Based on the genotypes and allele frequencies in our sample of the 118 fruiting bodies of A. exitialis, we assessed whether the total population was in Hardy–Weinberg equilibrium (HWE). If the total population was randomly mating, we expected that the population would be in HWE, with the observed heterozygosity not significantly different from the expected heterozygosity at each locus. Our results rejected the null hypothesis of HWE for the total population at each of the 14 marker loci (Table 3). Interestingly, among the 14 loci, nine showed excess observed heterozygosity over expected heterozygosity while five loci showed the opposite pattern (Table 3).
4. Discussion
Each year, poisonous mushrooms kill hundreds of people worldwide. However, little is known about the population biology and mode of reproduction of these mushrooms. In this study, we analyzed the fine-scale genetic variation of the poisonous mushroom A. exitialis from Guangdong Province in southern China. Our results revealed a relatively limited number of genotypes, much lower than would be expected under the assumption of random mating and independent assortment among the six amplified DNA fragments. Interestingly, we found significant genetic differentiation among the local geographic populations. Furthermore, the analyzed samples were grouped into three genotype clusters which were broadly supported by different analytical methods. However, there was also abundant genotype-sharing among the local sites. Below we discuss the implications of our results for understanding the evolution and mode of reproduction of A. exitialis in nature.
The fixation index Fst and Nm (number of migrants) are important indicators for genetic, structural and gene flow analyses among geographic populations. Based on Wright’s finite island model of population structure, Nm = [(1/Fst) – 1]/4, Fst values of 0.05–0.15, 0.15 < Fst < 0.25, and >0.25 are indicative of moderate, high, and very high genetic differentiation among populations, respectively. If neutral genetic markers are used and assuming constant population size, the degree of genetic differentiation among geographic populations would be closely related to gene flow and to genetic drift within and between populations. In general, Nm values > 1.0 indicate that the populations are unlikely to be completely differentiated. When Nm < l.0, increasing genetic differentiation among populations over time is expected due to genetic drift [38,39], and local selection would accelerate the differentiation among sites. In the case of A. exitialis, the observed Fst value was 0.19, corresponding to a high level of genetic differentiation among the local populations. On the other hand, shared genotypes were common among the sites. However, the shared genotypes were not uniformly distributed among different local populations. Instead, differential over-representation of certain genotypes was common in each of the seven local populations, causing significantly biased allele frequencies for one or the other allele at each of the 14 marker loci and contributing to the high-level differentiation among the local populations. Indeed, if clone-corrected data were used, the overall Fst value would decrease drastically to <0.05 (due to the small sample sizes after clone correction at all sites, details of the clone-corrected analyses results are not shown). At present, the reasons why certain multilocus genotypes are more broadly distributed than other genotypes are not known. However, both the age of the founding population and the location-specific selection forces could have contributed. For example, an older founding population and a more favorable mushroom growth and fruiting environment may lead to the production of more fruiting bodies from a bigger genetic individual with the same genotype.
Based on the observed basidia structure where most basidia had only two basidiospores each, the most likely mode of reproduction is secondary homothallism, similar to that of the commercial button mushroom Agaricus bisporus var. bisporus [40]. In secondary homothallic reproduction, most basidia produce two basidiospores each and each basidiospore receives two nuclei that are non-sisters to each other. Consequently, the two nuclei within each basidiospore likely have different mating types and such basidiospores would be capable of completing the sexual reproductive life cycle and forming a fruiting body all by itself without the need for mating. Furthermore, if recombination frequency is low between homologous chromosomes, these basidiospores will retain (almost) all alleles of the parental nuclei, maintaining the parental genotype [41]. These basidiospores could be dispersed by wind or by anthropogenic activities. Based on the observations, we propose the following model for the most likely mode of reproduction for A. exitialis in nature (Figure 6).
However, we should note that if secondary homothallism was the only mode of reproduction, heterozygosity would likely decrease over time due to meiotic crossing over and segregation during basidiospore formation, causing lower observed heterozygosity than expected heterozygosity over time. However, as was shown in Table 3, nine of the 14 marker loci showed excess heterozygosity. At present, the mechanism for the observed excess heterozygosity at the nine marker loci is not known. There are three non-exclusive possibilities. In the first, the mutation rate in this species might be higher than the recombination rate, leading to the accumulation of genetic variations within individual genomes in certain genetic individuals. A similar argument was recently presented to explain the human opportunistic fungal pathogen Candida tropicalis [42]. In the second, heterozygotes are more advantageous than homozygous in these environments, causing selective elimination of homozygotes from natural environments. Indeed, evidence for excess heterozygosity and inbreeding degression has been reported in the secondary homothallic mushroom A. bisporus [43,44]. In the third, there may be rare homokaryotic self-sterile basidiospores in A. exitialis that upon germination, can mate with homokaryons with compatible mating types to form fertile heterokaryons and increase heterozygosity. All three mechanisms could contribute to the heterogeneous distribution of heterozygosity in the natural population of A. exitialis, with excess heterozygosity in certain regions of the genome while lower than expected heterozygosity in other parts of the genome.
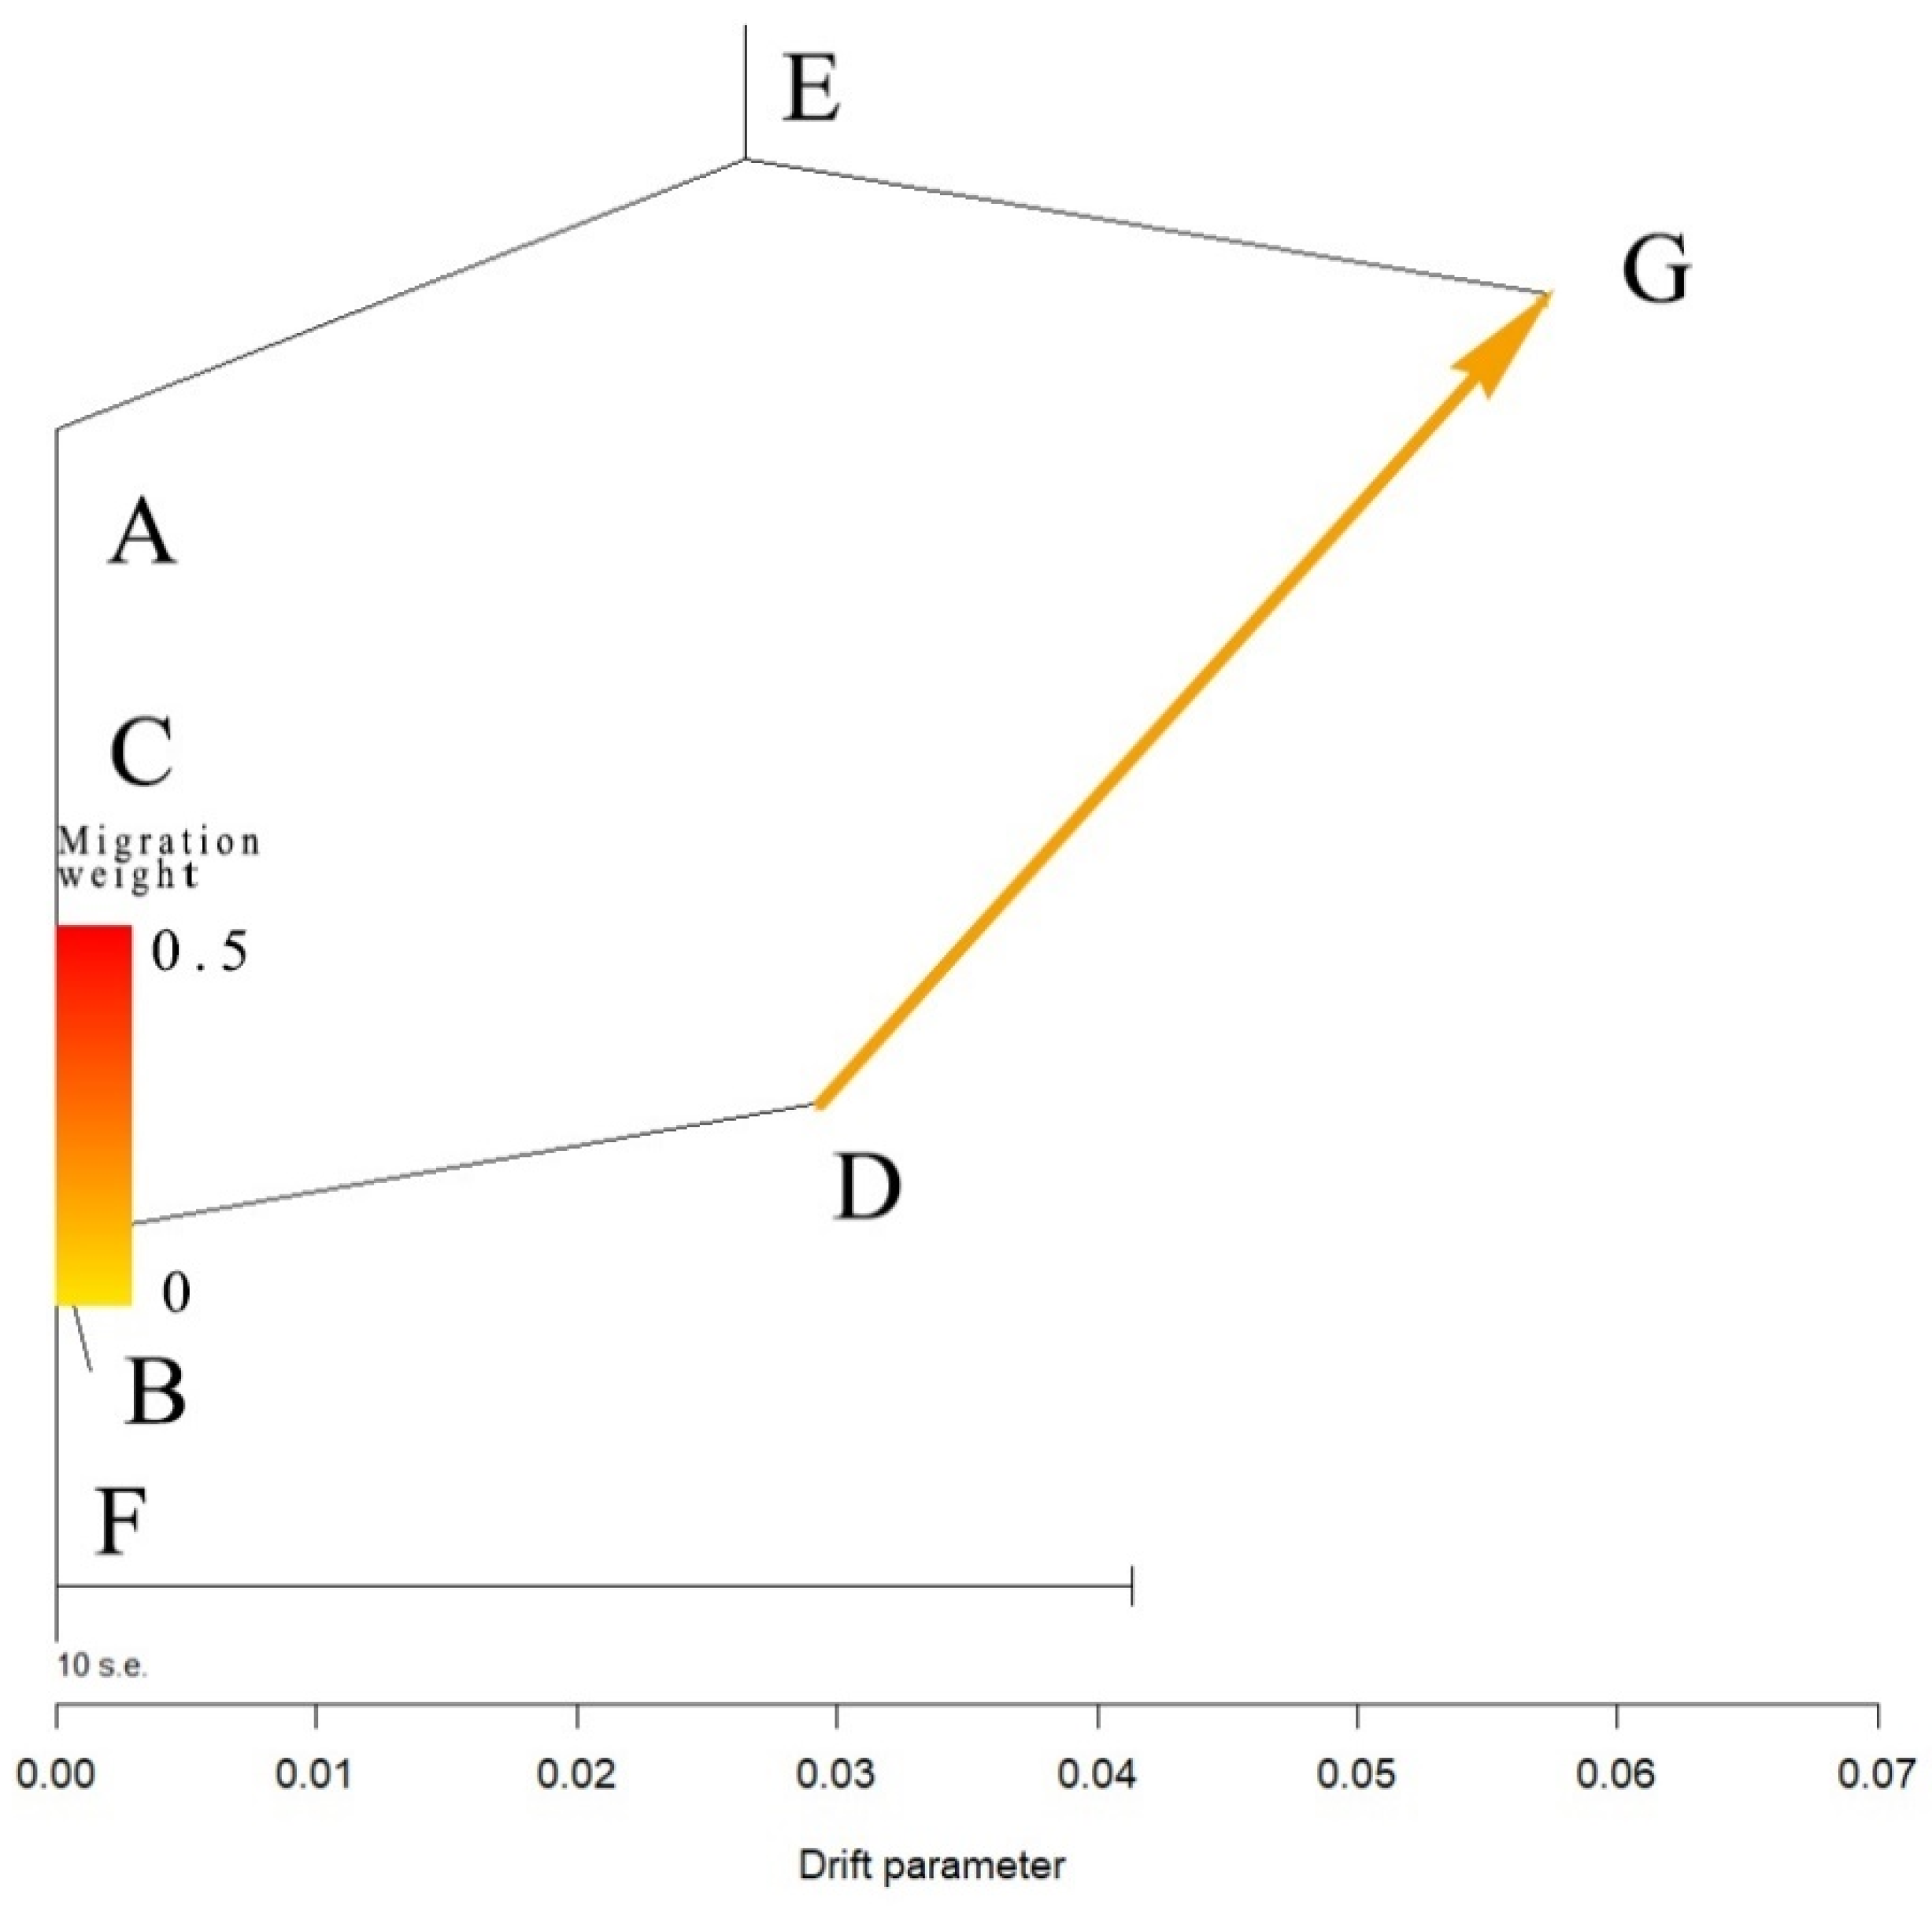
The geographical distribution of genotypes provides important information for understanding the biogeography and evolution of populations and species, including for tracking the origin and dispersal routes of specific genotypes and lineages. Between Guangzhou city and Shenzhen city, there are several mountains, rivers, densely populated cities, and other geographic barriers. However, in our study, one genotype “d” was broadly shared between these two cities separated by over 80 kilometers. Both wind-aided dispersal and anthropogenic activities could have facilitated the dispersal of self-fertile basidiospores between the two cities. In this case, the TreeMix analysis revealed that the dispersal was most likely from site D in Guangzhou to site G in Shenzhen (Figure 7). However, more sampling between these two cities and more detailed genotype analyses, such as through whole-genome sequencing is needed to identify whether this genotype (and potentially other genotypes) is broadly distributed throughout Guangdong Province and if so, what the likely colonization and dispersal history of this genotype might have been in this geographic region.
In Guangdong Province, A. exitialis is commonly associated with Castanopsis fissa, an evergreen tree in Fagaceae that is broadly distributed in southern China and Southeast Asia. This evergreen tree species has been considered the host species of A. exitialis. However, in most of the seven sites, fruiting bodies of A. exitialis were found growing under a mixture of trees, including a different evergreen species, Lithocarpus glaber. L. glaber is distributed in Japan and China. At present, the importance of other trees, such as L. glaber in the growth and reproduction and in ectomycorrhizal associations with A. exitialis awaits further investigation.
5. Conclusions
In this study, our focus was on spatial distributions of A. exitialis genotypes. Temporally, both identical and different genotypes of A. exitialis were found within the same site between years during our sampling period from 2007 to 2012. This is not surprising given the secondary homothallic reproduction of this species and its ectomycorrhizal association with trees that may last many years. Our results are different from those in Amanita manginiana where no identical genotype was found between two years of sampling at a site in Sichuan Province, southwestern China [45]. The reason for the difference between these two species was likely due to their different reproductive life cycles. A. manginiana is a heterothallic species with four spores per basidia, as well as has small and short-lived genetic individuals in nature. In contrast, as shown here, A. exitialis has a secondary homothallic life cycle and likely has large long-lived genetic individuals. The spatial and population genetic features of A. exitialis identified in our study could help prevent future mushroom poisoning. For example, warning signs containing pictures of A. exitialis fruiting bodies should be installed at specific locations within each site to explicitly warn people to not pick this poisonous mushroom.
Author Contributions
Conceptualization, J.X. and P.Z.; methodology, J.X. and P.Z.; software, J.Z.; validation, J.X., P.Z. and J.Z.; formal analysis, J.X.; investigation, P.Z.; resources, P.Z.; data curation, J.Z.; writing—original draft preparation, J.Z. and J.X.; writing—review and editing, J.X., P.Z. and J.Z.; visualization, J.X. and J.Z.; supervision, J.X. and P.Z.; project administration, P.Z.; funding acquisition, P.Z. All authors have read and agreed to the published version of the manuscript.
Funding
This research was funded by National Natural Science Foundation of China, grant number 31750001 and 31670015.
Institutional Review Board Statement
Not applicable.
Informed Consent Statement
Not applicable.
Data Availability Statement
Not applicable.
Acknowledgments
We thank colleagues in the Department of Biology, McMaster University, and Kunming Institute of Botany for their expert technical assistance during marker development.
Conflicts of Interest
The authors declare no conflict of interest.
References
- Li, W.W.; Pires, S.M.; Liu, Z.T.; Liang, J.J.; Wang, Y.F.; Chen, W.; Liu, C.W.; Liu, J.K.; Han, H.H.; Fu, P.; et al. Vital surveillances: Mushroom poisoning outbreaks—China, 2010–2020. China CDC Wkly. 2021, 3, 518–522. [Google Scholar] [CrossRef] [PubMed]
- Wu, F.; Zhou, L.W.; Yang, Z.L.; Bau, T.; Li, T.H.; Dai, Y.C. Resource diversity of Chinese macrofungi: Edible, medicinal and poisonous species. Fungal Divers. 2019, 98, 1–76. [Google Scholar] [CrossRef]
- Cui, Y.Y.; Cai, Q.; Tang, L.P.; Liu, J.W.; Yang, Z.L. The family Amanitaceae: Molecular phylogeny, higher-rank taxonomy and the species in China. Fungal Divers. 2018, 91, 5–230. [Google Scholar] [CrossRef]
- Cai, Q.; Cui, Y.Y.; Yang, Z.L. Lethal amanita species in China. Mycological 2016, 108, 993–1009. [Google Scholar] [CrossRef] [PubMed] [Green Version]
- Chen, Z.H. Poisonous Mushrooms: Recognition and Poisoning Treatment; Better Health Channel: Beijing, China, 2016; pp. 1–308. [Google Scholar]
- Chen, Z.H. New advances in researches on poisonous mushrooms since 2000. Mycosystema 2014, 33, 493–516. [Google Scholar] [CrossRef]
- Unluoglu, I.; Tayfur, M. Mushroom poisoning: An analysis of the data between 1996 and 2000. Eur. J. Emerg. Med. 2003, 10, 23–26. [Google Scholar] [CrossRef] [PubMed]
- Roberts, D.M.; Hall, M.J.; Falkland, M.M.; Strasser, S.I.; Buckley, N.A. Amanita phalloides poisoning and treatment with silibinin in the Australian Capital Territory and New South Wales. Med. J. Aust. 2013, 198, 43–47. [Google Scholar] [CrossRef] [Green Version]
- Ward, J.; Kapadia, K.; Brush, E.; Salhanick, S.D. Amatoxin poisoning: Case reports and review of current therapies. J. Emerg. Med. 2013, 44, 116–121. [Google Scholar] [CrossRef]
- Liu, M.; Gan, L.X.; Zhang, L.P.; Li, T.H.; Deng, W.Q. Optimization of Ultrasonic Extraction of α-Amanitin from Amanita exitialis by Box-Benhnken Response Surface Design. Acta Edulis Fungi 2021, 28, 93–101. (In Chinese) [Google Scholar]
- Chen, Z.H.; Zhang, P.; Zhang, Z.G. Investigation and analysis of 102 mushroom poisoning cases in Southern China from 1994 to 2012. Fungal Divers. 2014, 64, 123–131. [Google Scholar] [CrossRef]
- Li, P.; Deng, W.Q.; Li, T.H. Molecular cloning of α-amanitin and characterization of its expression pattern in different parts and development stages of Amanita exitialis fruitbody. Mycol. Prog. 2014, 13, 988. [Google Scholar] [CrossRef]
- Chen, Z.H.; Hu, J.S.; Zhang, Z.G.; Zhang, P.; Li, D.P. Determination and analysis of the main amatoxins and phallotoxins in 28 species of Amanita from China. Mycosystema 2003, 22, 565–573. (In Chinese) [Google Scholar] [PubMed]
- Parnmen, S.; Sikaphan, S.; Leudang, S.; Boonpratuang, T.; Rangsiruji, A.; Naksuwankul, K. Molecular identification of poisonous mushrooms using nuclear ITS region and peptide toxins: A retrospective study on fatal cases in Thailand. J. Toxicol. Sci. 2016, 41, 65–76. [Google Scholar] [CrossRef] [PubMed] [Green Version]
- Sun, J.; Li, H.J.; Zhang, H.S.; Zhang, Y.Z.; Sun, C.Y. Investigating and analyzing three cohorts of mushroom poisoning caused by Amanita exitialis in Yunnan, China. Hum. Exp. Toxicol. 2017, 37, 665–678. [Google Scholar] [CrossRef]
- Li, H.J.; Zhang, H.S.; Zhang, Y.Z.; Zhang, K.P.; Zhou, J.; Yin, Y.; Jiang, S.F.; Ma, P.B.; He, Q.; Zhang, Y.T.; et al. Preplanned Studies: Mushroom Poisoning Outbreaks—China, 2019. China CDC Wkly. 2020, 2, 19–24. [Google Scholar] [CrossRef] [PubMed]
- Zhong, J.J.; Yao, Q.M.; Li, H.J.; Pu, Y.; Li, C.H.; Yu, C.M. Detection and analysis of cyclopeptides in Amanita exitialis from Chuxiong Prefecture, Yunnan Province. Mycosystema 2020, 39, 1766–1773. (In Chinese) [Google Scholar]
- Hu, J.S. The Determination, Isolation, Identification and Function of Main Peptide Toxins in Amanita exitialis. Ph.D. Thesis, Hunan Normal University, Changsha, China, 2013. [Google Scholar]
- Zhang, P.; Chen, Z.H.; Hu, J.S.; Wei, B.Y.; Zhang, Z.G.; Hu, W.Q. Production and characterization of Amanitin toxins from a pure culture of Amanita exitialis. FEMS Microbiol. Lett. 2005, 252, 223–228. [Google Scholar] [CrossRef] [PubMed] [Green Version]
- Yang, Z.L.; Li, T.H. Notes on three white Amanitae of section Phalloideae (Amanitaceae) from China. Mycotaxon 2001, 78, 439–448. [Google Scholar]
- Bhatt, R.; Tulloss, R.E.; Semwal, K.C.; Bhatt, V.K.; Moncalvo, J.M.; Stephenson, S. Amanitaceae reported from India. A critically annotated checklist. Mycotaxon 2003, 88, 249–270. [Google Scholar]
- Li, P.; Deng, W.Q.; Li, T.H.; Song, B.; Shen, Y.H. Illumina-based de novo transcriptome sequencing and analysis of Amanita exitialis basidiocarps. Gene 2013, 532, 63–71. [Google Scholar] [CrossRef]
- Luo, H. Advances of omics research on poisonous mushrooms. Mycosystema 2019, 38, 2087–2098. [Google Scholar]
- Zhang, C.H.; Zou, J.P.; Deng, W.Q.; Li, T.H.; Jiang, Z.D. Molecular cloning and the expression pattern of AePOPB involved in the α-amanitin biosynthesis in Amanita exitialis fruiting bodies. Gene 2018, 662, 123–130. [Google Scholar] [CrossRef]
- He, Z.M. Isothermal Amplification Detection for Lethal Amanitas and the Diversity of Toxin Genes in Amanita Mushrooms. Ph.D. Thesis, Hunan Normal University, Changsha, China, 2019. [Google Scholar]
- Doyle, J.J.; Doyle, J.L. A rapid DNA isolation procedure for small amounts of fresh leaf tissue. Phytochem. Bull. 1987, 19, 11–15. [Google Scholar]
- Johnson, P.H.; Lee, A.S.; Sinsheimer, R.L. Production of specific fragments of φX174 replicative form DNA by a restriction enzyme from Haemophilus parainfluenzae, endonuclease HP. J. Virol. 1973, 11, 596–599. [Google Scholar] [CrossRef] [Green Version]
- Peakall, R.; Smouse, P.E. GenAlEx 6.5: Genetic analysis in Excel. Population genetic software for teaching and research—an update. Bioinformatics 2012, 28, 2537–2539. [Google Scholar] [CrossRef] [Green Version]
- Mantel, N. The detection of disease clustering and a generalized regression approach. Cancer Res. 1967, 27 Pt 1, 209–220. [Google Scholar]
- Evanno, G.; Regnaut, S.; Goudet, J. Detecting the number of clusters of individuals using the software STRUCTURE: A simulation study. Mol. Ecol. 2005, 14, 2611–2620. [Google Scholar] [CrossRef] [Green Version]
- Earl, D.A.; VonHoldt, B.M. STRUCTURE HARVESTER: A website and program for visualizing STRUCTURE output and implementing the Evanno method. Conserv. Genet. Resour. 2012, 4, 359–361. [Google Scholar] [CrossRef]
- Rosenberg, N.A. DISTRUCT: A program for the graphical display of population structure. Mol. Ecol. Notes 2004, 4, 137–138. [Google Scholar] [CrossRef]
- Jakobsson, M.; Rosenberg, N.A. CLUMPP: A cluster matching and permutation program for dealing with label switching and multimodality in analysis of population structure. Bioinformatics 2007, 23, 1801–1806. [Google Scholar] [CrossRef] [Green Version]
- Kumar, S.; Stecher, G.; Tamura, K. MEGA7: Molecular evolutionary genetics analysis version 7.0 for bigger datasets. Mol. Biol. Evol. 2016, 33, 1870–1874. [Google Scholar] [CrossRef] [Green Version]
- Saitou, N.; Nei, M. The neighbor-joining method: A new method for reconstructing phylogenetic trees. Mol. Biol. Evol. 1987, 4, 406–425. [Google Scholar] [CrossRef]
- Pickrell, J.K.; Pritchard, J.K. Inference of population splits and mixtures from genome-wide allele frequency data. Nat. Preced. 2012, 1, 1–17. [Google Scholar] [CrossRef]
- Pearson, K. LIII. On lines and planes of closest fit to systems of points in space. Lond. Edinb. Dublin Philos. Mag. J. Sci. 1901, 2, 559–572. [Google Scholar] [CrossRef] [Green Version]
- Holsinger, K.E.; Weir, B.S. Genetics in geographically structured populations: Defining, estimating and interpreting FST. Nat. Rev. Genet. 2009, 10, 639–650. [Google Scholar] [CrossRef] [PubMed] [Green Version]
- Wright, S. Genetic structure of populations. Br. Med. J. 1950, 2, 36. [Google Scholar] [PubMed] [Green Version]
- Summerbell, R.C.; Castle, A.J.; Horgen, P.A.; Anderson, J.B. Inheritance of restriction fragment length polymorphisms in Agaricus brunnescens. Genetics 1989, 123, 293–300. [Google Scholar] [CrossRef]
- Sonnenberg, A.; Baars, J.; Hendrickx, P.; Lavrijssen, B.; Gao, W.; Weijn, A.; Mes, J. Breeding and strain protection in the button mushroom Agaricus bisporus. In Proceedings of the 7th International Conference of the World Society for Mushroom Biology and Mushroom Products, Arcachon, France, 4–7 October 2011; ICMBMP: Arcachon, France, 2011; pp. 7–15. [Google Scholar]
- Xu, J.P. Is natural population of Candida tropicalis sexual, parasexual, and/or asexual? Front. Cell. Infect. Microbiol. 2021, 11, 1066. [Google Scholar] [CrossRef] [PubMed]
- Xu, J.P.; Desmerger, C.; Callac, P. Fine-scale genetic analyses reveal unexpected spatial-temporal heterogeneity in two natural populations of the commercial mushroom Agaricus bisporus. Microbiology 2002, 148, 1253–1262. [Google Scholar] [CrossRef] [PubMed] [Green Version]
- Xu, J.P. Analysis of inbreeding depression in Agaricus bisporus. Genetics 1995, 141, 137–145. [Google Scholar] [CrossRef]
- Liang, Y.; Guo, L.D.; Ma, K.P. Population genetic structure of an ectomycorrhizal fungus Amanita manginiana in a subtropical forest over two years. Mycorrhiza 2005, 15, 137–142. [Google Scholar] [CrossRef] [PubMed]
Figure 1.
The basidiocarps of A. exitialis.
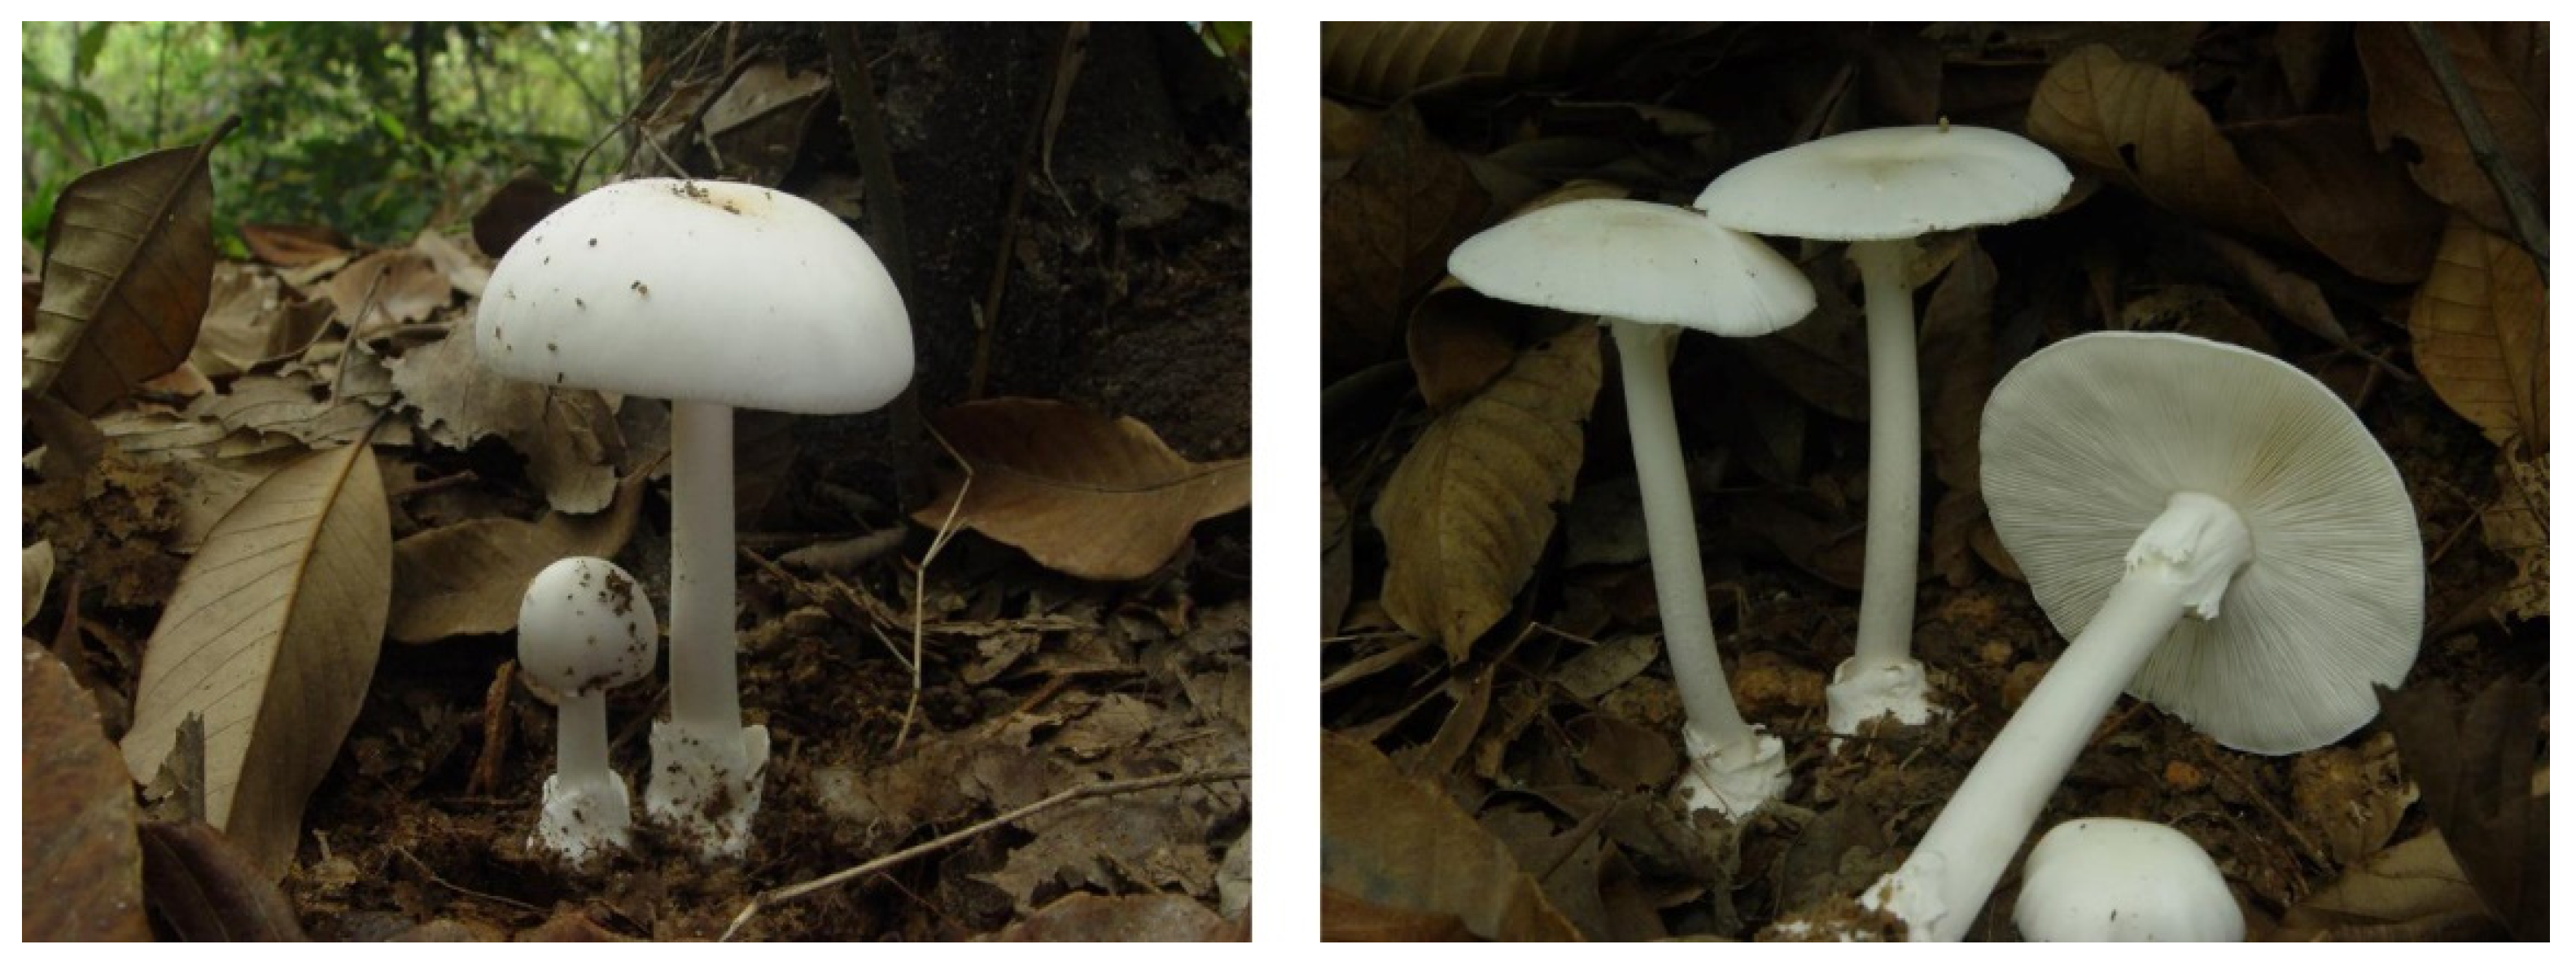
Figure 2.
Distributions of multilocus genotypes within and among the seven collection sites. Sub-figures A to G illustrate the spatial distribution of individual fruiting bodies and their multilocus genotypes in site A to G. Filled circles of the color represent the same multilocus genotype: site A contains 36 fruiting bodies belonging to nine genotypes; site B contains four fruiting bodies belonging to one genotype; site C contains 27 fruiting bodies belonging to seven genotypes; site D contains six fruiting bodies belonging to four genotypes; site E contains eight fruiting bodies belonging to three genotypes; site F contains 22 fruiting bodies belonging to four genotypes; and site G contains 15 fruiting bodies belonging to three genotypes. The geographic location of sites A to G are shown in Table 1.
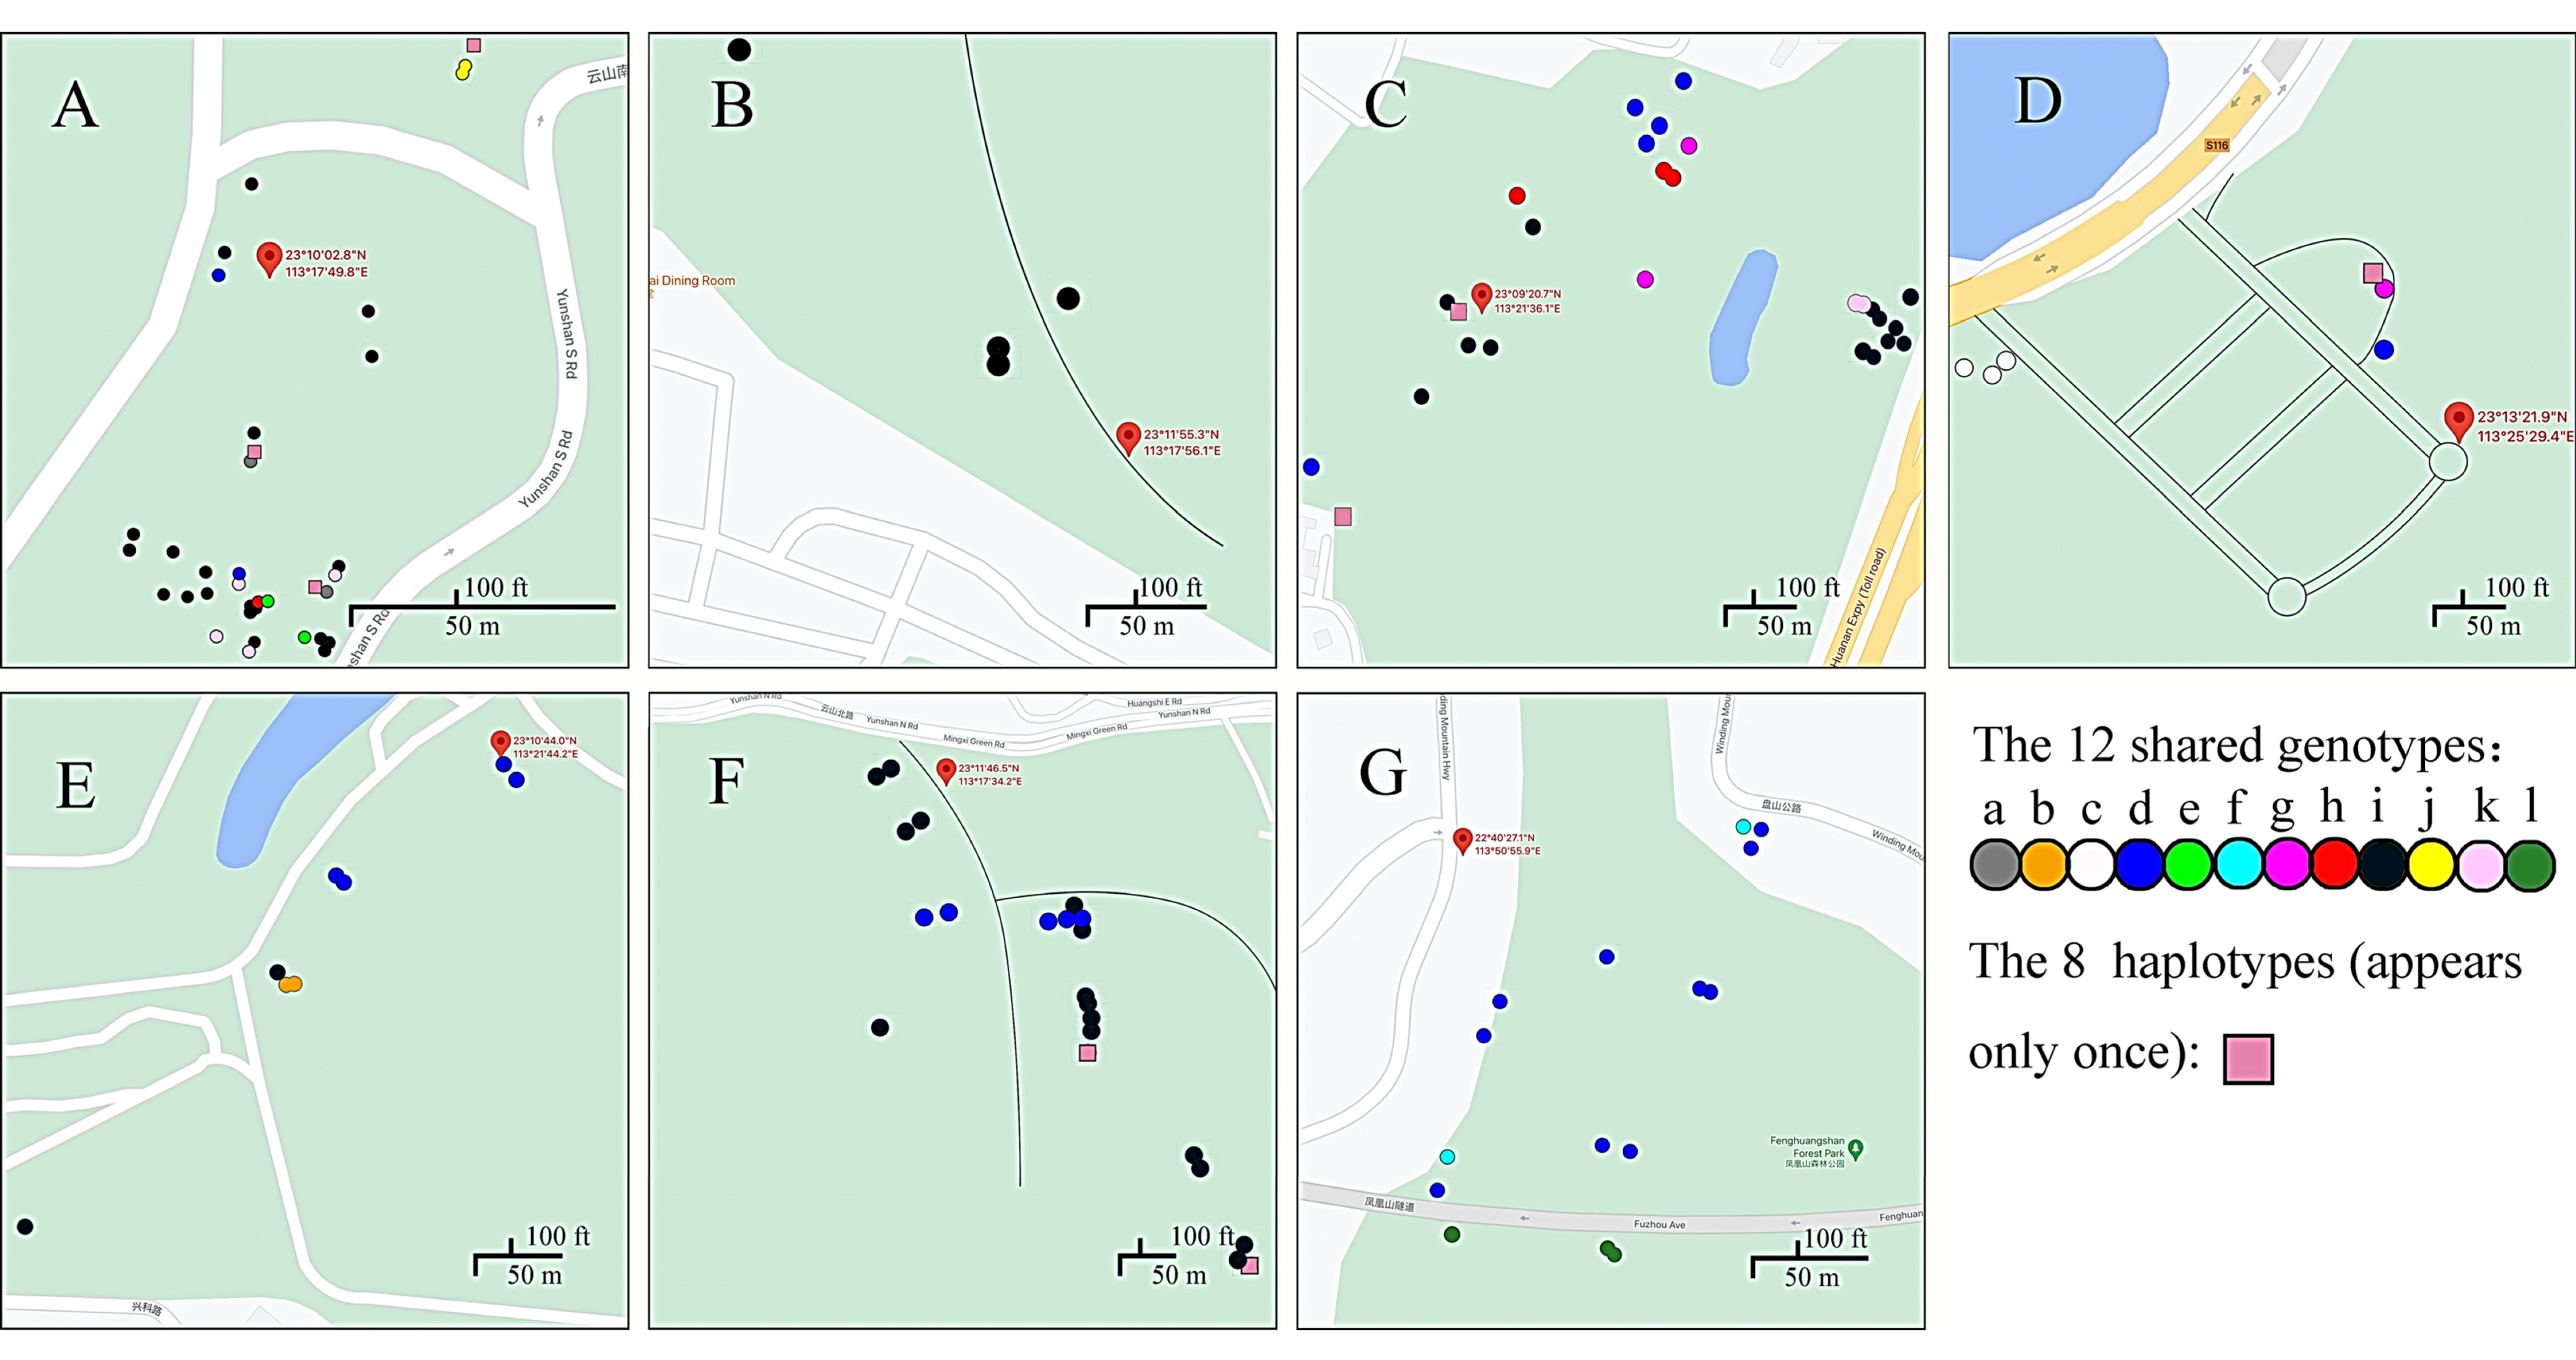
Figure 3.
Mantel test between genetic distance and geographic distance among the A. exitialis populations.
Figure 3.
Mantel test between genetic distance and geographic distance among the A. exitialis populations.

Figure 4.
Locations and genetic structure of seven populations of A. exitialis. STRUCTURE clustering analysis results based on their geographic distribution on the left. Codes of the populations are given in Table 1.
Figure 4.
Locations and genetic structure of seven populations of A. exitialis. STRUCTURE clustering analysis results based on their geographic distribution on the left. Codes of the populations are given in Table 1.
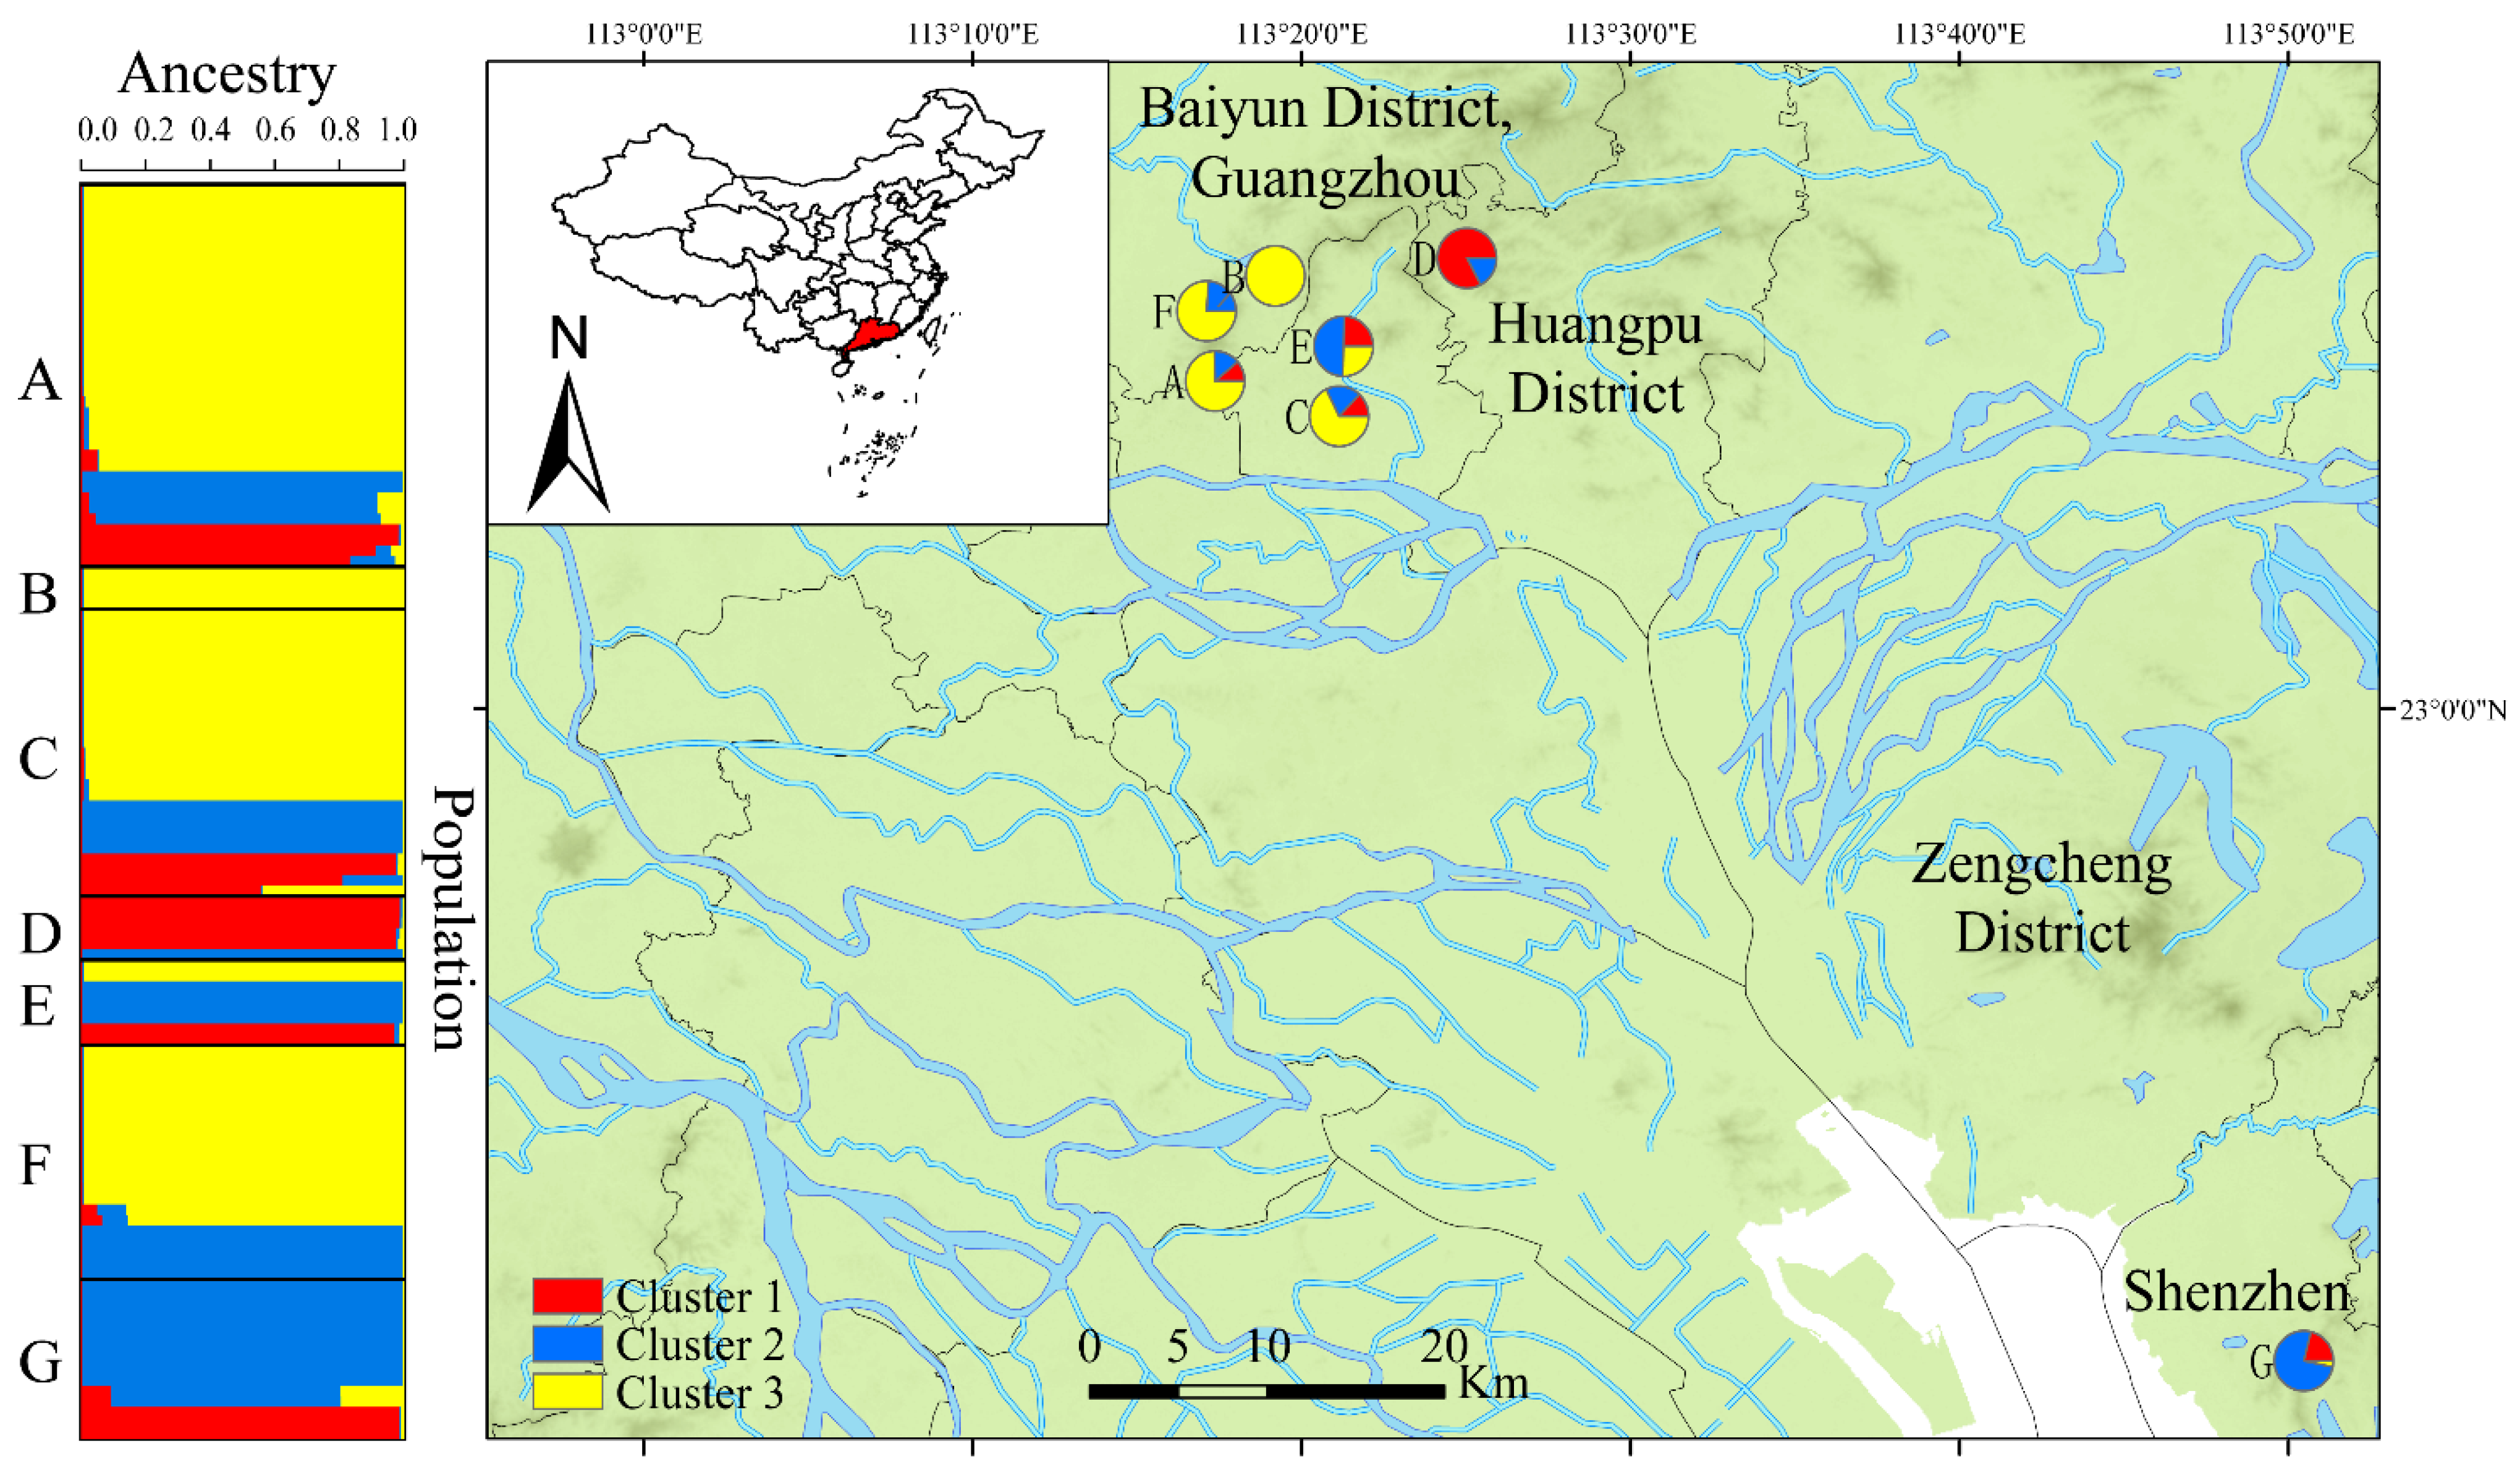
Figure 5.
(a). Dendrogram obtained for the 118 A. exitialis fruiting bodies based on their genetic distance; (b). The hierarchical clustering results of 118 A. exitialis fruiting bodies based on principal component analyses.
Figure 5.
(a). Dendrogram obtained for the 118 A. exitialis fruiting bodies based on their genetic distance; (b). The hierarchical clustering results of 118 A. exitialis fruiting bodies based on principal component analyses.
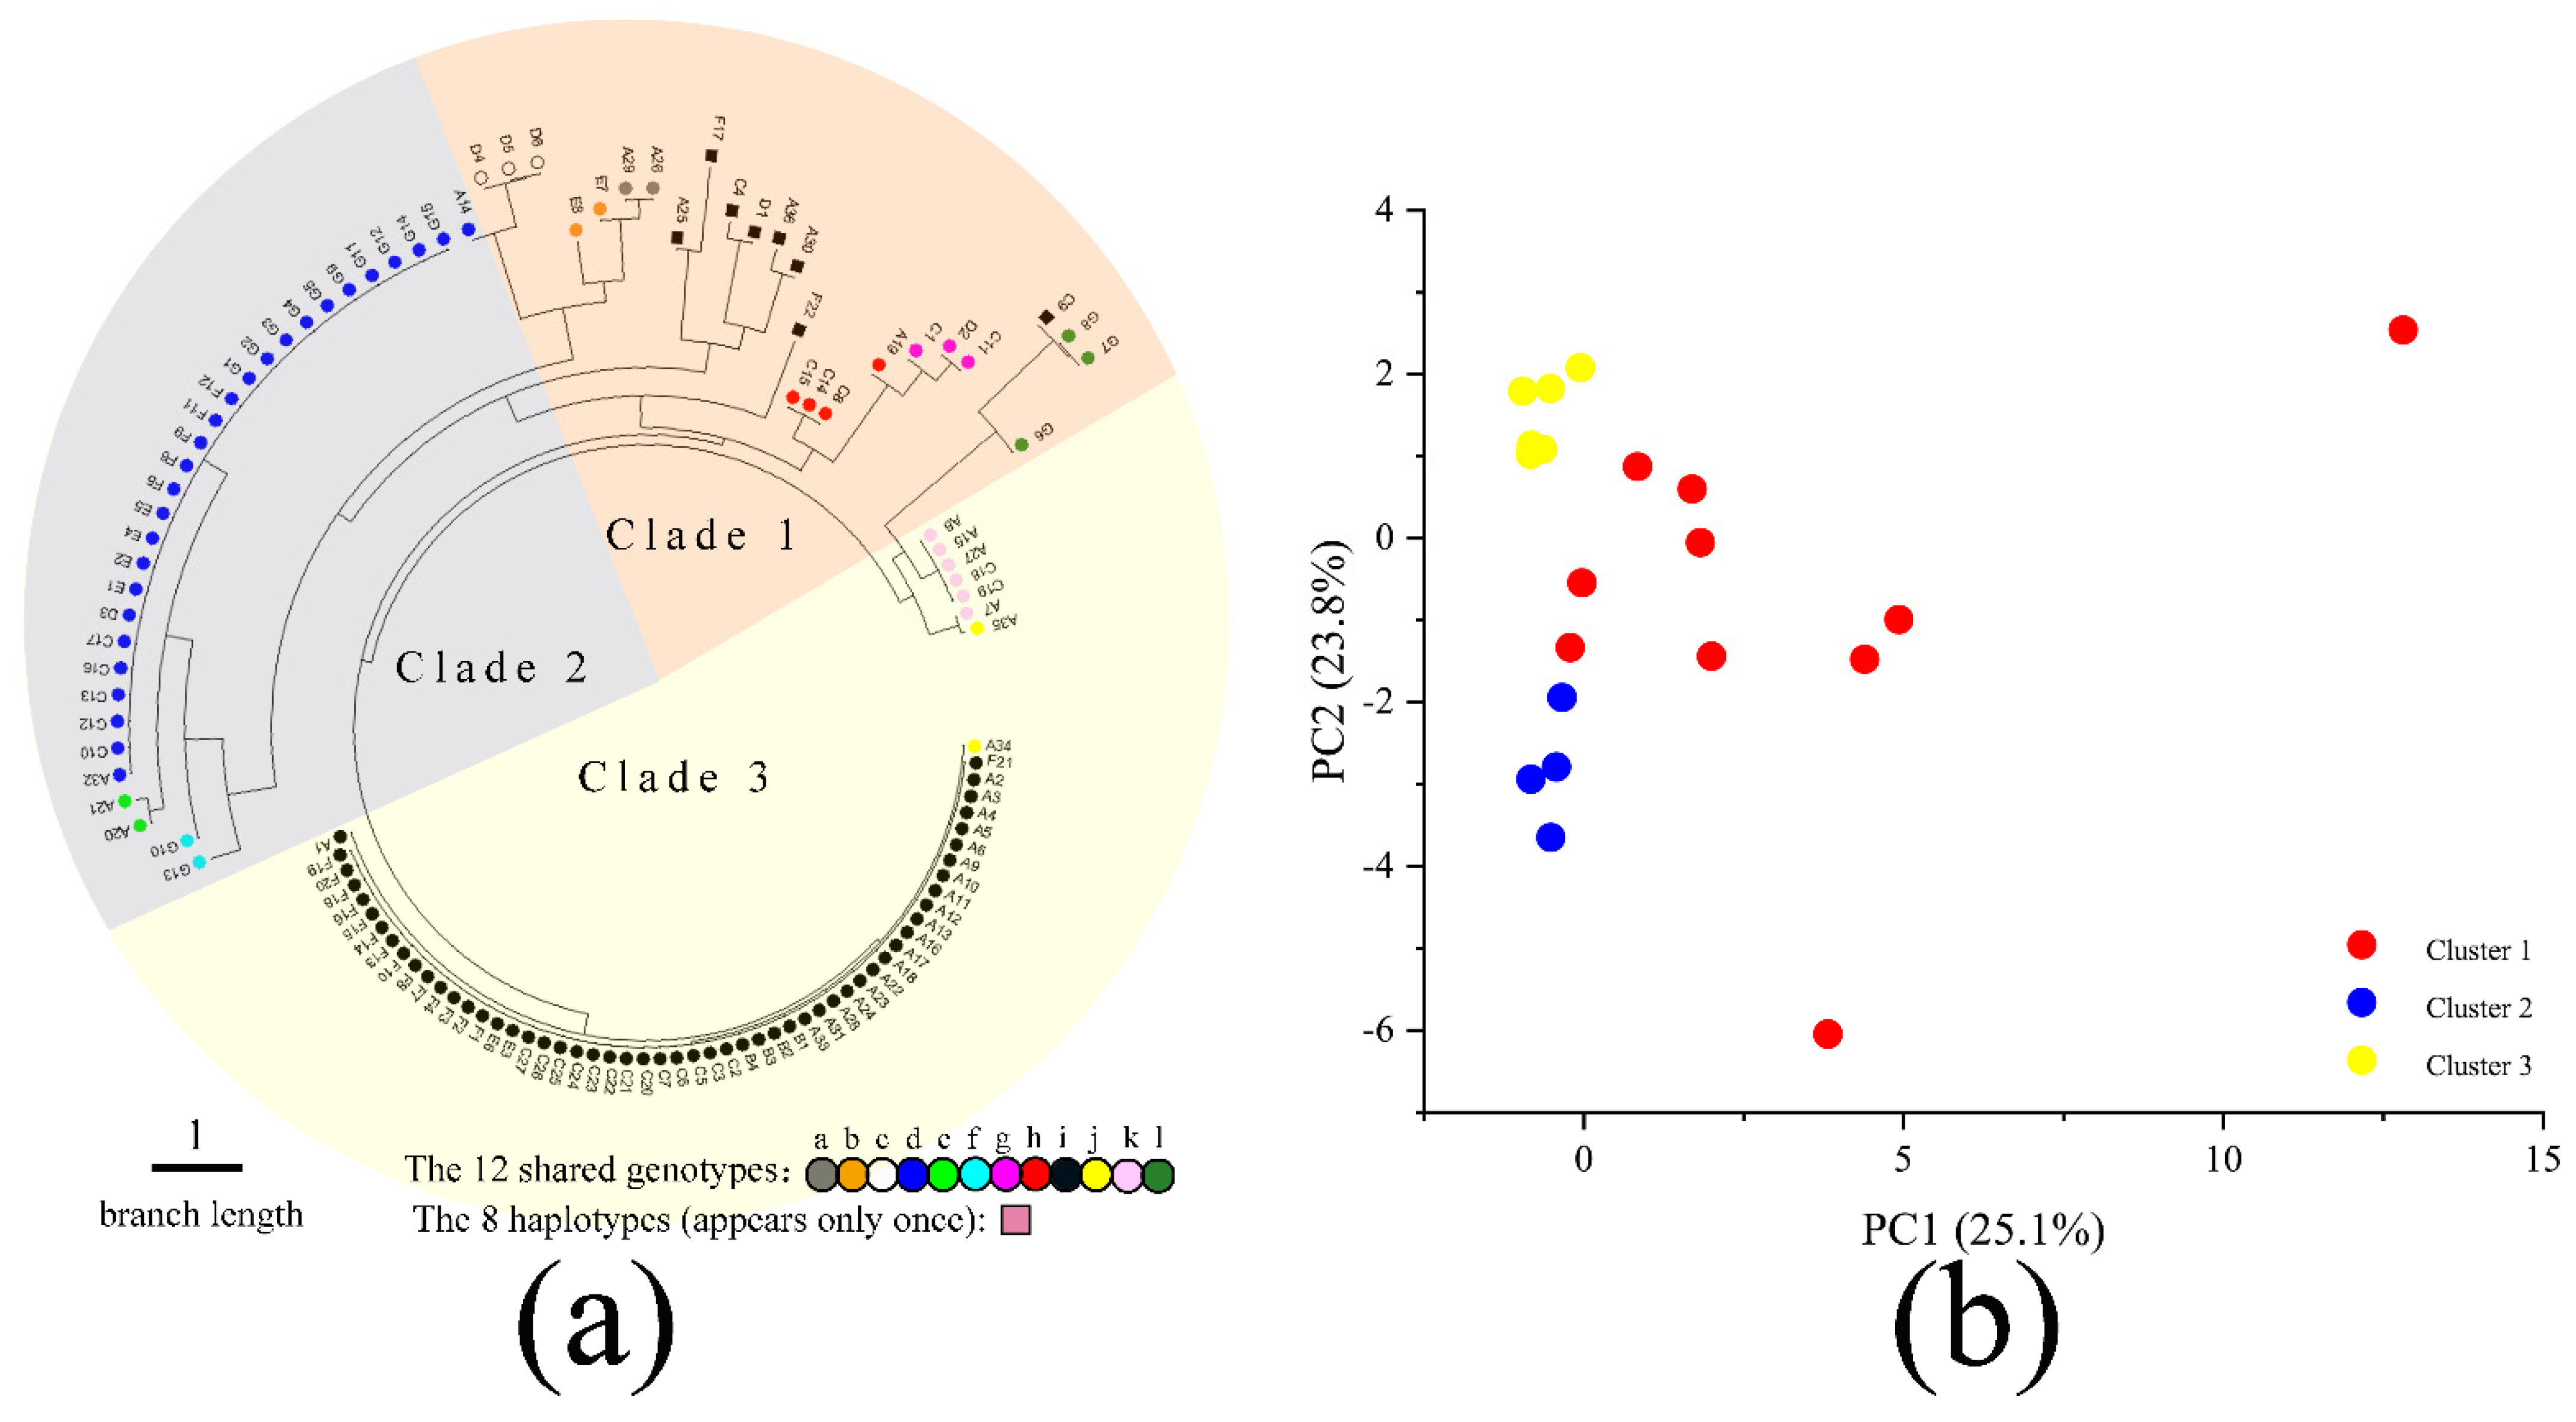
Figure 6.
A proposed model for the most likely mode of reproduction for A. exitialis in nature.
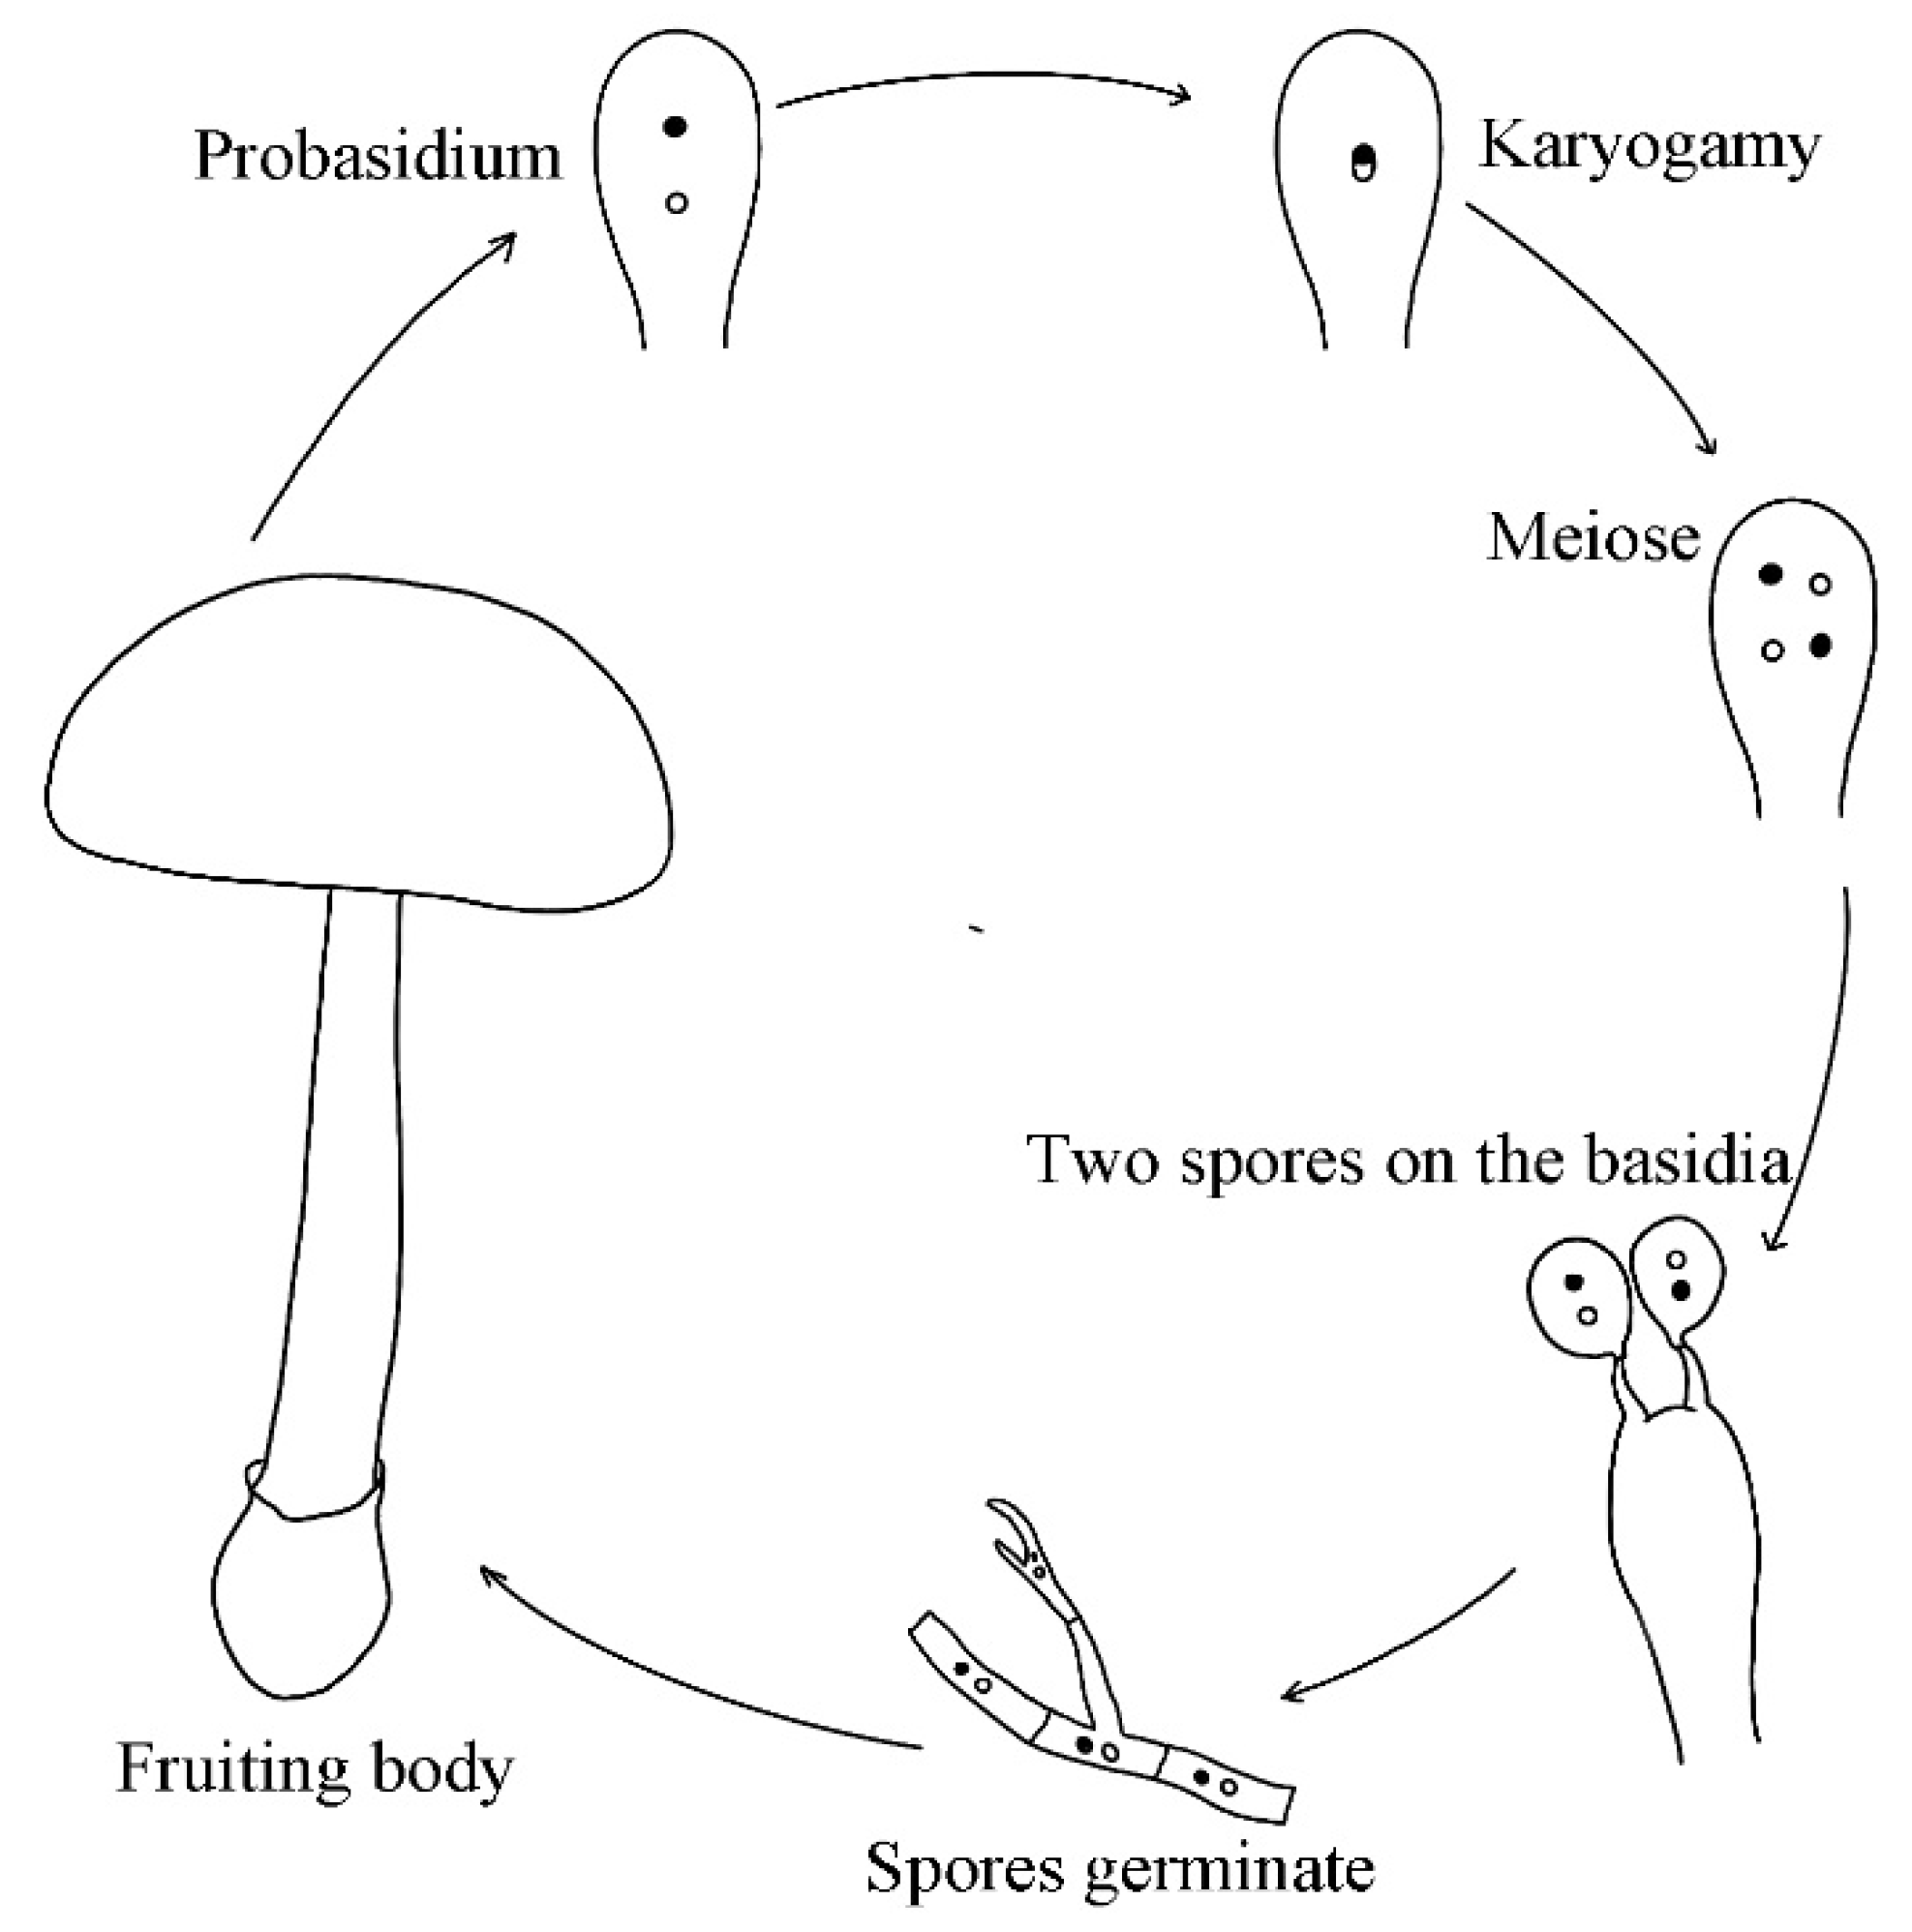
Figure 7.
Detection of gene flows among A. exitialis populations by TreeMix analysis.

Table 1.
Amanita exitialis sample collection information.
| Code | City | Location | Sample Size | Latitude | Longitude | Altitude (above Sea Level) |
|---|---|---|---|---|---|---|
| A | Guangzhou | Duguting, Baiyunshan Mountain | 36 | 23.1674292 | 113.2971586 | 200–300 m |
| B | Guangzhou | Guangzhou University of Foreign Studies | 4 | 23.1986838 | 113.2989164 | 0–50 m |
| C | Guangzhou | South China Agricultural University | 27 | 23.1557492 | 113.3600235 | 0–50 m |
| D | Guangzhou | Guangzhou Tianluhu Forest Park | 6 | 23.2227467 | 113.4248414 | 200–300 m |
| E | Guangzhou | South China Botanical Garden | 8 | 23.1788847 | 113.3622869 | 0–50 m |
| F | Guangzhou | BeeWorld, Baiyunshan District | 22 | 23.1963429 | 113.2928271 | 100–200 m |
| G | Shenzhen | Fenghuangshan Forest Park | 15 | 22.6742000 | 113.8488670 | 100–200 m |
Table 2.
AMOVA of genetic variation among seven populations of A. exitialis.
| Source of Variation | d.f. | Sum of Squares | Variance Components | Percentage of Variation (%) | Fst | Nm |
|---|---|---|---|---|---|---|
| Among-population | 6 | 71.906 | 11.984 | 19% | 0.191 *** | 1.056 |
| Within-population | 111 | 282.780 | 2.548 | 81% | ||
| Total | 117 | 354.686 | 100% |
*** p < 0.01.
Table 3.
Chi-Square Tests for Hardy–Weinberg Equilibrium using the total A. exitialis sample.
| Locus | Observed Heterozygotes | Expected Heterozygotes | Chi-Square Value |
|---|---|---|---|
| M12 | 73 | 49.640 | 21.849 *** |
| C21 | 106 | 59.000 | 74.881 *** |
| H11-300 | 64 | 53.809 | 5.104 * |
| A31-88 | 0 | 5.847 | 118.000 *** |
| A31-138 | 0 | 1.983 | 118.000 *** |
| A31-425 | 3 | 46.182 | 103.167 *** |
| A31-440 | 71 | 55.436 | 9.301 ** |
| G24-106 | 6 | 11.390 | 26.424 *** |
| G24-163 | 41 | 33.877 | 5.217 * |
| G24-489 | 77 | 51.877 | 27.674 *** |
| G24-600 | 106 | 58.390 | 78.453 *** |
| G24-615 | 5 | 10.487 | 32.305 *** |
| K47-355 | 103 | 58.962 | 65.826 *** |
| K47-556 | 103 | 58.962 | 65.826 *** |
* p < 0.05, ** p < 0.01, *** p < 0.001.
Publisher’s Note: MDPI stays neutral with regard to jurisdictional claims in published maps and institutional affiliations. |
© 2021 by the authors. Licensee MDPI, Basel, Switzerland. This article is an open access article distributed under the terms and conditions of the Creative Commons Attribution (CC BY) license (https://creativecommons.org/licenses/by/4.0/).
Share and Cite
MDPI and ACS Style
Zhong, J.; Xu, J.; Zhang, P. Diversity, Dispersal and Mode of Reproduction of Amanita exitialis in Southern China. Genes 2021, 12, 1907. https://doi.org/10.3390/genes12121907
AMA Style
Zhong J, Xu J, Zhang P. Diversity, Dispersal and Mode of Reproduction of Amanita exitialis in Southern China. Genes. 2021; 12(12):1907. https://doi.org/10.3390/genes12121907
Chicago/Turabian StyleZhong, Juan, Jianping Xu, and Ping Zhang. 2021. "Diversity, Dispersal and Mode of Reproduction of Amanita exitialis in Southern China" Genes 12, no. 12: 1907. https://doi.org/10.3390/genes12121907
Note that from the first issue of 2016, this journal uses article numbers instead of page numbers. See further details here.