Enhanced Co-Expression Extrapolation (COXEN) Gene Selection Method for Building Anti-Cancer Drug Response Prediction Models

 , and
, and
Abstract
1. Background
2. Methods
3. Results
4. Conclusions
Author Contributions
Funding
Conflicts of Interest
Abbreviations
References
- Xia, F.; Shukla, M.; Brettin, T.; Garcia-Cardona, C.; Cohn, J.; Allen, J.; Maslov, S.; Holbeck, S.; Doroshow, J.; Evrard, Y.; et al. Predicting tumor cell line response to drug pairs with deep learning. BMC Bioinform. 2018, 19, 486. [Google Scholar] [CrossRef] [PubMed]
- Menden, M.; Wang, D.; Mason, M.; Szalai, B.; Bulusu, K.; Guan, Y.; Yu, T.; Kang, J.; Jeon, M.; Wolfinger, R.; et al. Community assessment to advance computational prediction of cancer drug combinations in a pharmacogenomic screen. Nat. Commun. 2019, 10, 2674. [Google Scholar] [CrossRef] [PubMed]
- Rampášek, L.; Hidru, D.; Smirnov, P.; Haibe-Kains, B.; Goldenberg, A. Dr.VAE: Improving drug response prediction via modeling of drug perturbation effects. Bioinformatics 2019, 35, 3743–3751. [Google Scholar] [CrossRef] [PubMed]
- Huang, C.; Mezencev, R.; McDonald, J.; Vannberg, F. Open source machine-learning algorithms for the prediction of optimal cancer drug therapies. PLoS ONE 2017, 12, e0186906. [Google Scholar] [CrossRef]
- Menden, M.; Iorio, F.; Garnett, M.; McDermott, U.; Benes, C.; Ballester, P.; Saez-Rodriguez, J. Machine learning prediction of cancer cell sensitivity to drugs based on genomic and chemical properties. PLoS ONE 2013, 8, e61318. [Google Scholar] [CrossRef]
- Costello, J.; Heiser, L.; Georgii, E.; Gönen, M.; Menden, M.; Wang, N.; Bansal, M.; Ammad-ud-din, M.; Hintsanen, P.; Khan, S.; et al. A community effort to assess and improve drug sensitivity prediction algorithms. Nat. Biotechnol. 2014, 32, 1202–1212. [Google Scholar] [CrossRef]
- Jang, I.; Neto, E.; Guinney, J.; Friend, S.; Margolin, A. Systematic assessment of analytical methods for drug sensitivity prediction from cancer cell line data. In Proceedings of the Pacific Symposium on Biocomputing, Kohala Coast, HI, USA, 3–7 January 2014; pp. 63–74. [Google Scholar]
- Lee, J.; Havaleshko, D.; Cho, H.; Weinstein, J.; Kaldjian, E.; Karpovich, J.; Grimshaw, A.; Theodorescu, D. A strategy for predicting the chemosensitivity of human cancers and its application to drug discovery. Proc. Natl. Acad. Sci. USA 2007, 104, 13086–13091. [Google Scholar] [CrossRef]
- Kim, Y.; Kim, D.; Cao, B.; Carvajal, R.; Kim, M. PDXGEM: Patient-derived tumor xenograft based gene expression model for predicting clinical response to anticancer therapy in cancer patients. bioRxiv 2019. [Google Scholar] [CrossRef]
- Lee, J.; Coutant, C.; Kim, Y.; Qi, Y.; Theodorescu, D.; Symmans, W.; Baggerly, K.; Rouzier, R.; Pusztai, L. Prospective comparison of clinical and genomic multivariate predictors of response to neoadjuvant chemotherapy in breast cancer. Clin. Cancer Res. 2010, 16, 711–718. [Google Scholar] [CrossRef]
- Smith, S.; Baras, A.; Lee, J.; Theodorescu, D. The COXEN principle: Translating signatures of in vitro chemosensitivity into tools for clinical outcome prediction and drug discovery in cancer. Cancer Res. 2010, 70, 1753–1758. [Google Scholar] [CrossRef]
- Nagji, A.; Cho, S.; Liu, Y.; Lee, J.; Jones, D. Multigene expression-based predictors for sensitivity to Vorinostat and Velcade in non-small cell lung cancer. Mol. Cancer Ther. 2010, 9, 2834–2843. [Google Scholar] [CrossRef] [PubMed]
- Fowles, J.; Brown, K.; Hess, A.; Duval, D.; Gustafson, D. Intra- and interspecies gene expression models for predicting drug response in canine osteosarcoma. BMC Bioinform. 2016, 17, 93. [Google Scholar] [CrossRef] [PubMed]
- Ferriss, J.; Kim, Y.; Duska, L.; Birrer, M.; Levine, D.; Moskaluk, C.; Theodorescu, D.; Lee, J. Multi-gene expression predictors of single drug responses to adjuvant chemotherapy in ovarian carcinoma: Predicting platinum resistance. PLoS ONE 2012, 7, e30550. [Google Scholar] [CrossRef] [PubMed]
- Chang, Y.; Park, H.; Yang, H.; Lee, S.; Lee, K.; Kim, T.; Jung, J.; Shin, J. Cancer drug response profile scan (CDRscan): A deep learning model that predicts drug effectiveness from cancer genomic signature. Sci. Rep. 2018, 8, 8857. [Google Scholar] [CrossRef] [PubMed]
- Manica, M.; Oskooei, A.; Born, J.; Subramanian, V.; Sáez-Rodríguez, J.; Martínez, M. Towards explainable anticancer compound sensitivity prediction via multimodal attention-based convolutional encoders. arXiv 2019, arXiv:1904.11223v3. [Google Scholar] [CrossRef]
- Li, L. A concordance correlation coefficient to evaluate reproducibility. Biometrics 1989, 45, 255–268. [Google Scholar]
- Barretina, J.; Caponigro, G.; Stransky, N.; Venkatesan, K.; Margolin, A.; Kim, S.; Wilson, C.; Lehár, J.; Kryukov, G.; Sonkin, D.; et al. The Cancer Cell Line Encyclopedia enables predictive modelling of anticancer drug sensitivity. Nature 2012, 483, 603–607. [Google Scholar] [CrossRef]
- Haverty, P.; Lin, E.; Tan, J.; Yu, Y.; Lam, B.; Lianoglou, S.; Neve, R.; Martin, S.; Settleman, J.; Yauch, R.; et al. Reproducible pharmacogenomic profiling of cancer cell line panels. Nature 2016, 533, 333–337. [Google Scholar] [CrossRef]
- Yang, W.; Soares, J.; Greninger, P.; Edelman, E.J.; Lightfoot, H.; Forbes, S. Genomics of Drug Sensitivity in Cancer (GDSC): A resource for therapeutic biomarker discovery in cancer cells. Nucleic Acids Res. 2013, 41, D955–D961. [Google Scholar] [CrossRef]
- Ke, G.; Meng, Q.; Finley, T.; Wang, T.; Chen, W.; Ma, W.; Ye, Q.; Liu, T.-Y. LightGBM: A highly efficient gradient boosting decision tree. In Proceedings of the 31st International Conference on Neural Information Processing Systems (NIPS), Long Beach, CA, USA, 4–9 December 2017; pp. 3149–3157. [Google Scholar]
- Subramanian, A.; Narayan, R.; Corsello, S.; Peck, D.; Natoli, T.; Lu, X.; Gould, J.; Davis, J.; Tubelli, A.; Asiedu, J.; et al. A next generation connectivity map: L1000 platform and the first 1,000,000 profiles. Cell 2017, 171, 1437–1452.e17. [Google Scholar] [CrossRef]
- Benjamini, Y.; Hochberg, Y. Controlling the false discovery rate: A practical and powerful approach to multiple testing. J. R. Stat. Soc. Ser. B Stat. Methodol. 1995, 57, 289–300. [Google Scholar] [CrossRef]
- Azuaje, F.; Kaoma, T.; Jeanty, C.; Nazarov, P.V.; Muller, A.; Kim, S.; Dittmar, G.; Golebiewska, A.; Niclou, S.P. Hub genes in a pan-cancer co-expression network show potential for predicting drug responses. F1000Research 2018, 7, 1906. [Google Scholar] [CrossRef] [PubMed]


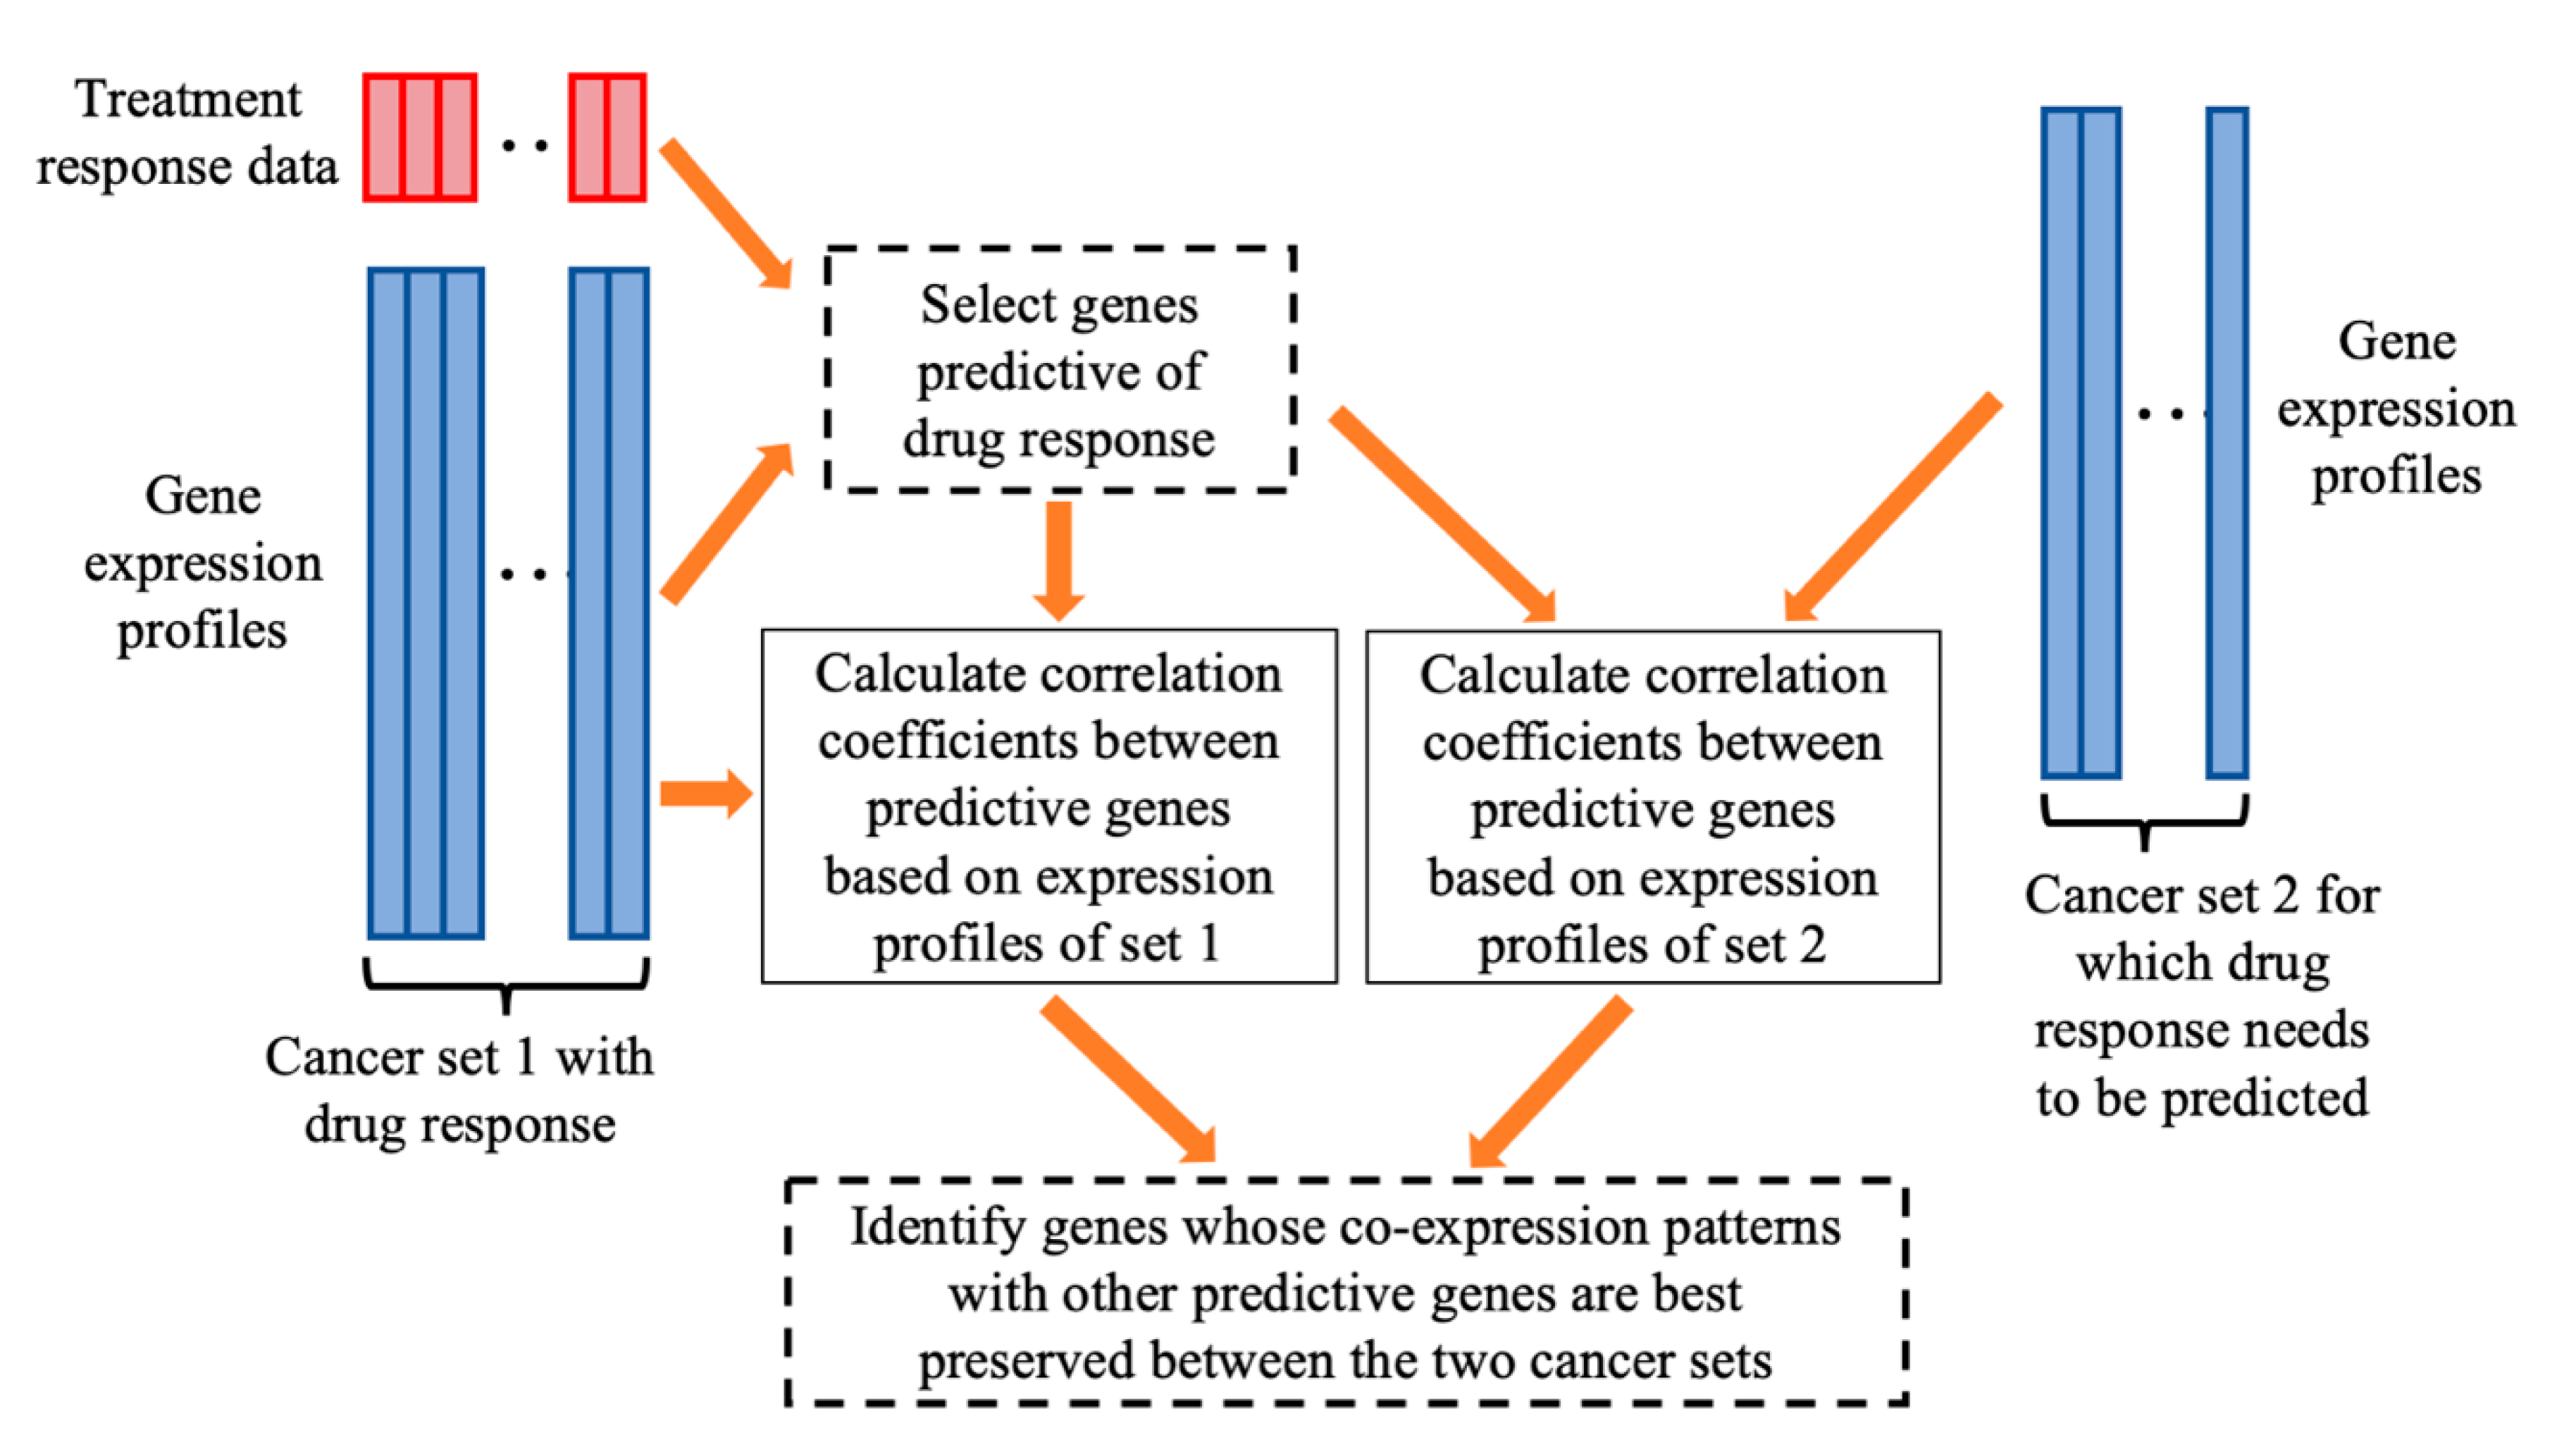
| Given: | Dataset 1 that includes an matrix of gene expressions for P genes and cancer cases and the response values of the cancer cases to the treatment of a drug. Dataset 2, an matrix of gene expressions for cancer cases, for which we want to predict their sensitivities to the drug treatment. Two positive integers and , > > 1. |
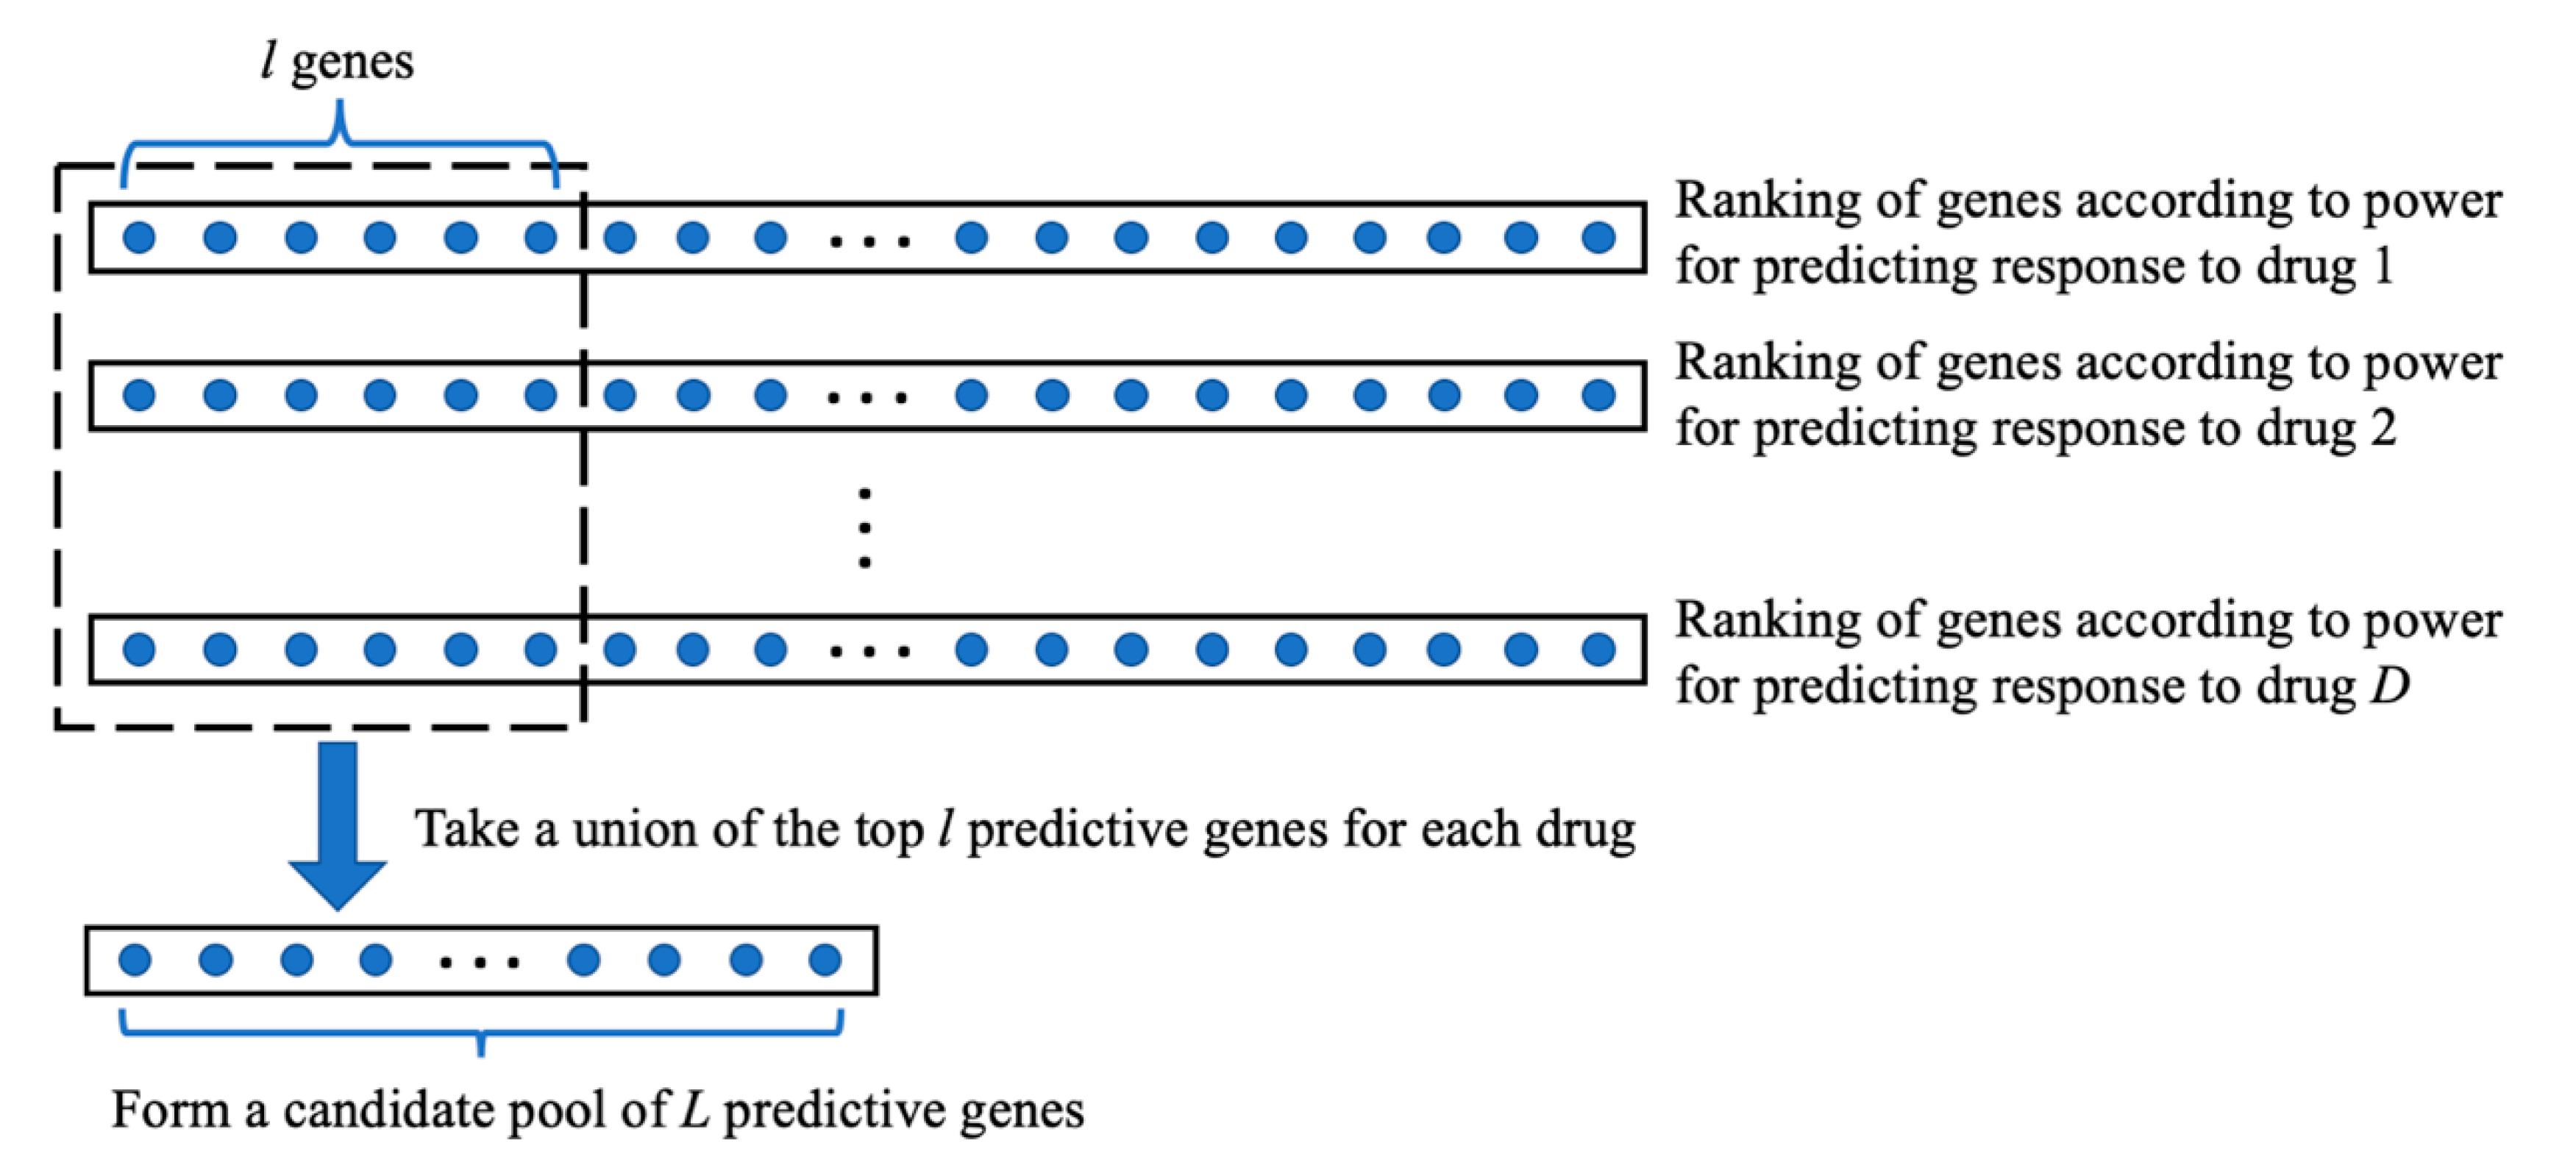
| Step 1: | On dataset 1, for every gene, calculate the gene’s prediction power for drug response using a defined PPM. Select genes with the strongest prediction power. |
| Step 2: | For each of the genes, do the following.
|
| Step 3: | Among the genes, select genes with the highest generalization scores, which will be used for building a prediction model of drug response. |
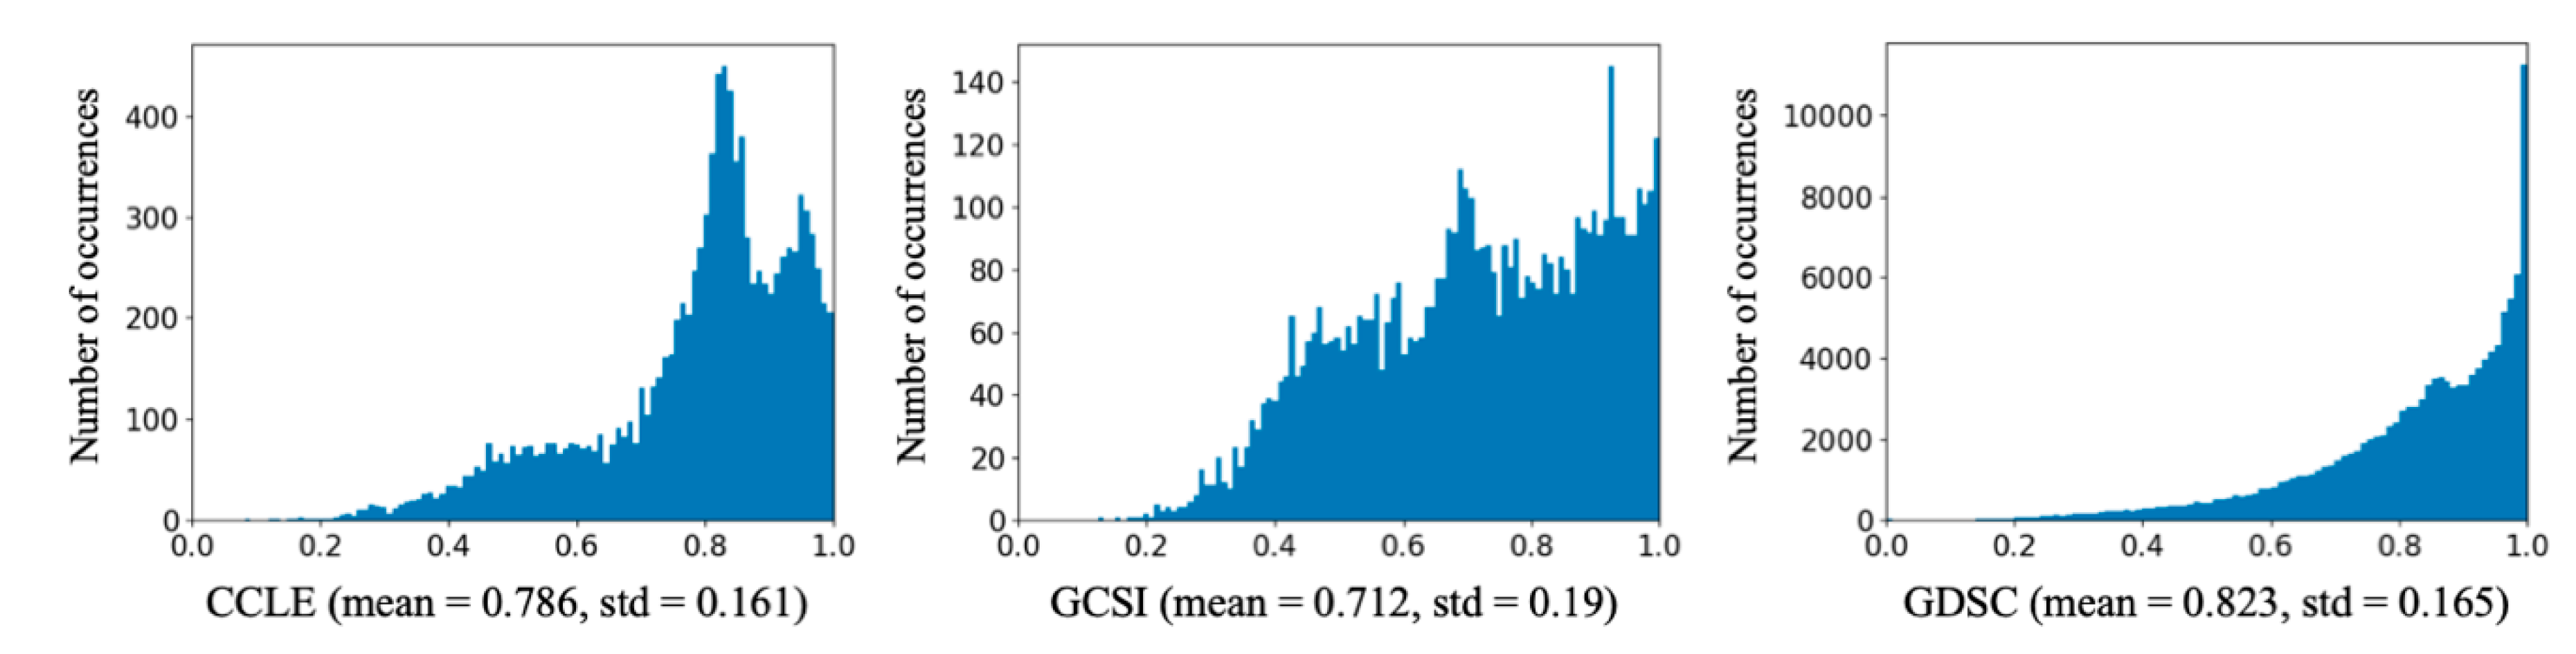
| Dataset | # CCLs | # Drugs | # Experiments |
|---|---|---|---|
| GCSI | 357 | 16 | 5647 |
| CCLE | 474 | 24 | 10,971 |
| GDSC | 659 | 238 | 125,712 |
| Dataset | Total Variation | Between-Class Variation (CCL) | Within-Class Variation (CCL) | Between-Class Variation (Drug) | Within-Class Variation (Drug) |
|---|---|---|---|---|---|
| CCLE | 282.97 | 21.93 | 261.05 | 192.60 | 90.37 |
| GCSI | 203.14 | 22.43 | 180.71 | 122.85 | 80.30 |
| GDSC | 3413.74 | 218.11 | 3195.64 | 1954.38 | 1459.37 |
| Data | N1 | N2 | Enhanced COXEN | Random All | Random LINCS | Original COXEN | ||||||
|---|---|---|---|---|---|---|---|---|---|---|---|---|
| R2 | R2 | Adjusted p-Value | PIP | R2 | Adjusted p-Value | PIP | R2 | Adjusted p-Value | PIP | |||
| CCLE | 1600 | 800 | 0.725 (0.018) | 0.715 (0.019) | 4.32 × 10⁻²⁵ | 27.3% | 0.716 (0.018) | 1.57 × 10⁻²⁴ | 23.0% | 0.719 (0.018) | 2.58 × 10⁻¹⁹ | 16.0% |
| 800 | 400 | 0.724 (0.018) | 0.712 (0.019) | 7.04 × 10⁻³⁰ | 33.5% | 0.714 (0.018) | 8.04 × 10⁻²⁴ | 26.5% | 0.717 (0.018) | 1.36 × 10⁻¹⁵ | 16.3% | |
| 400 | 200 | 0.721 (0.019) | 0.710 (0.019) | 5.74 × 10⁻²⁴ | 33.5% | 0.711 (0.018) | 9.66 × 10⁻²⁰ | 29.9% | 0.715 (0.019) | 2.81 × 10⁻¹¹ | 14.8% | |
| 200 | 100 | 0.719 (0.019) | 0.706 (0.019) | 6.23 × 10⁻²⁰ | 43.5% | 0.708 (0.020) | 1.74 × 10⁻¹⁸ | 37.2% | 0.713 (0.018) | 2.81 × 10⁻¹⁰ | 17.9% | |
| GCSI | 1600 | 800 | 0.678 (0.032) | 0.670 (0.031) | 1.03 × 10⁻¹⁰ | 11.7% | 0.669 (0.032) | 2.60 × 10⁻¹³ | 14.4% | 0.676 (0.032) | 4.10 × 10⁻³ | 3.4% |
| 800 | 400 | 0.678 (0.034) | 0.666 (0.032) | 6.64 × 10⁻¹³ | 18.0% | 0.666 (0.033) | 1.54 × 10⁻¹³ | 18.0% | 0.675 (0.031) | 2.21 × 10⁻² | 3.0% | |
| 400 | 200 | 0.675 (0.036) | 0.661 (0.033) | 3.97 × 10⁻¹³ | 23.8% | 0.661 (0.032) | 2.60 × 10⁻¹³ | 22.7% | 0.672 (0.033) | 1.62 × 10⁻² | 4.0% | |
| 200 | 100 | 0.672 (0.036) | 0.653 (0.033) | 1.59 × 10⁻¹⁵ | 35.1% | 0.654 (0.033) | 9.29 × 10⁻¹⁸ | 32.1% | 0.668 (0.032) | 1.00 × 10⁻² | 5.6% | |
| GDSC | 1600 | 800 | 0.625 (0.017) | 0.618 (0.017) | 7.40 × 10⁻²⁴ | 15.0% | 0.619 (0.017) | 1.64 × 10⁻²⁰ | 12.2% | 0.621 (0.017) | 9.52 × 10⁻¹² | 6.3% |
| 800 | 400 | 0.624 (0.018) | 0.616 (0.017) | 2.35 × 10⁻²⁰ | 15.5% | 0.617 (0.017) | 4.99 × 10⁻¹⁸ | 13.0% | 0.619 (0.018) | 3.86 × 10⁻¹² | 8.4% | |
| 400 | 200 | 0.622 (0.017) | 0.614 (0.018) | 3.95 × 10⁻²⁵ | 19.9% | 0.615 (0.018) | 1.35 × 10⁻¹⁸ | 15.3% | 0.617 (0.017) | 3.55 × 10⁻¹⁶ | 11.1% | |
| 200 | 100 | 0.620 (0.018) | 0.610 (0.018) | 4.65 × 10⁻²⁵ | 24.7% | 0.612 (0.018) | 1.76 × 10⁻¹⁵ | 18.1% | 0.614 (0.017) | 5.21 × 10⁻¹⁹ | 13.4% | |
| Data | N1 | N2 | Enhanced COXEN | Random All | Random LINCS | Original COXEN | |||
|---|---|---|---|---|---|---|---|---|---|
| R2 | R2 | Adjusted p-Value | R2 | Adjusted p-Value | R2 | Adjusted p-Value | |||
| CCLE | 1600 | 800 | 0.160 (0.110) | 0.147 (0.100) | 2.63 × 10⁻³ | 0.139 (0.091) | 4.72 × 10⁻⁴ | 0.147 (0.103) | 1.66 × 10⁻² |
| 800 | 400 | 0.153 (0.110) | 0.143 (0.096) | 8.80 × 10⁻² | 0.136 (0.091) | 7.26 × 10⁻³ | 0.144 (0.103) | 1.68 × 10⁻¹ | |
| 400 | 200 | 0.141 (0.109) | 0.135 (0.093) | 2.85 × 10⁻¹ | 0.133 (0.087) | 1.80 × 10⁻¹ | 0.138 (0.102) | 7.42 × 10⁻¹ | |
| 200 | 100 | 0.130 (0.105) | 0.126 (0.088) | 5.21 × 10⁻¹ | 0.129 (0.087) | 9.21 × 10⁻¹ | 0.129 (0.097) | 7.98 × 10⁻¹ | |
| GCSI | 1600 | 800 | 0.222 (0.103) | 0.215 (0.104) | 3.05 × 10⁻¹ | 0.207 (0.102) | 1.93 × 10⁻² | 0.213 (0.101) | 2.50 × 10⁻¹ |
| 800 | 400 | 0.219 (0.107) | 0.206 (0.100) | 1.10 × 10⁻¹ | 0.206 (0.100) | 4.97 × 10⁻² | 0.216 (0.102) | 7.42 × 10⁻¹ | |
| 400 | 200 | 0.208 (0.107) | 0.198 (0.096) | 2.30 × 10⁻¹ | 0.190 (0.097) | 1.93 × 10⁻² | 0.205 (0.100) | 7.42 × 10⁻¹ | |
| 200 | 100 | 0.203 (0.101) | 0.181 (0.095) | 4.16 × 10⁻² | 0.178 (0.092) | 1.03 × 10⁻² | 0.195 (0.095) | 5.34 × 10⁻¹ | |
| GDSC | 1600 | 800 | 0.085 (0.118) | 0.074 (0.113) | 2.99 × 10⁻²⁵ | 0.073 (0.116) | 1.78 × 10−38 | 0.080 (0.116) | 1.37 × 10⁻¹¹ |
| 800 | 400 | 0.083 (0.117) | 0.074 (0.111) | 9.36 × 10⁻²¹ | 0.073 (0.113) | 4.54 × 10⁻²⁶ | 0.077 (0.114) | 1.38 × 10⁻¹⁰ | |
| 400 | 200 | 0.083 (0.115) | 0.070 (0.110) | 4.26 × 10⁻²⁶ | 0.072 (0.113) | 4.92 × 10⁻²² | 0.075 (0.114) | 5.24 × 10⁻¹⁴ | |
| 200 | 100 | 0.080 (0.114) | 0.067 (0.105) | 1.14 × 10⁻²⁰ | 0.069 (0.109) | 4.62 × 10⁻²² | 0.071 (0.113) | 3.70 × 10⁻¹⁷ | |
| Data | N1 | N2 | R2 (Enhanced COXEN) | R2 (Hub Genes) | Adjusted p-Value | PIP |
|---|---|---|---|---|---|---|
| CCLE | 90 | 45 | 0.716 (0.019) | 0.709 (0.020) | 1.14 × 10⁻¹⁰ | 25.2% |
| GCSI | 90 | 45 | 0.668 (0.035) | 0.655 (0.033) | 5.07× 10⁻⁹ | 23.3% |
| GDSC | 90 | 45 | 0.616 (0.018) | 0.617 (0.017) | 6.75× 10⁻¹ | −0.7% |
© 2020 by the authors. Licensee MDPI, Basel, Switzerland. This article is an open access article distributed under the terms and conditions of the Creative Commons Attribution (CC BY) license (http://creativecommons.org/licenses/by/4.0/).
Share and Cite
Zhu, Y.; Brettin, T.; Evrard, Y.A.; Xia, F.; Partin, A.; Shukla, M.; Yoo, H.; Doroshow, J.H.; Stevens, R.L. Enhanced Co-Expression Extrapolation (COXEN) Gene Selection Method for Building Anti-Cancer Drug Response Prediction Models. Genes 2020, 11, 1070. https://doi.org/10.3390/genes11091070
Zhu Y, Brettin T, Evrard YA, Xia F, Partin A, Shukla M, Yoo H, Doroshow JH, Stevens RL. Enhanced Co-Expression Extrapolation (COXEN) Gene Selection Method for Building Anti-Cancer Drug Response Prediction Models. Genes. 2020; 11(9):1070. https://doi.org/10.3390/genes11091070
Chicago/Turabian StyleZhu, Yitan, Thomas Brettin, Yvonne A. Evrard, Fangfang Xia, Alexander Partin, Maulik Shukla, Hyunseung Yoo, James H. Doroshow, and Rick L. Stevens. 2020. "Enhanced Co-Expression Extrapolation (COXEN) Gene Selection Method for Building Anti-Cancer Drug Response Prediction Models" Genes 11, no. 9: 1070. https://doi.org/10.3390/genes11091070
APA StyleZhu, Y., Brettin, T., Evrard, Y. A., Xia, F., Partin, A., Shukla, M., Yoo, H., Doroshow, J. H., & Stevens, R. L. (2020). Enhanced Co-Expression Extrapolation (COXEN) Gene Selection Method for Building Anti-Cancer Drug Response Prediction Models. Genes, 11(9), 1070. https://doi.org/10.3390/genes11091070