Growth Trajectories in Genetic Subtypes of Prader–Willi Syndrome

 ,
,  , and
, and
Abstract
1. Introduction
2. Materials and Methods
2.1. Victorian Prader–Willi Syndrome Register
2.2. Study Cohort
2.3. Statistical Analysis
2.3.1. Modeling Longitudinal Growth of Anthropometric Measures
2.3.2. Estimating Average Rate of Growth over Age
3. Results
3.1. Description of the Study Cohort
3.2. Growth in PWS Individuals and Comparison to Expected Growth in the Population
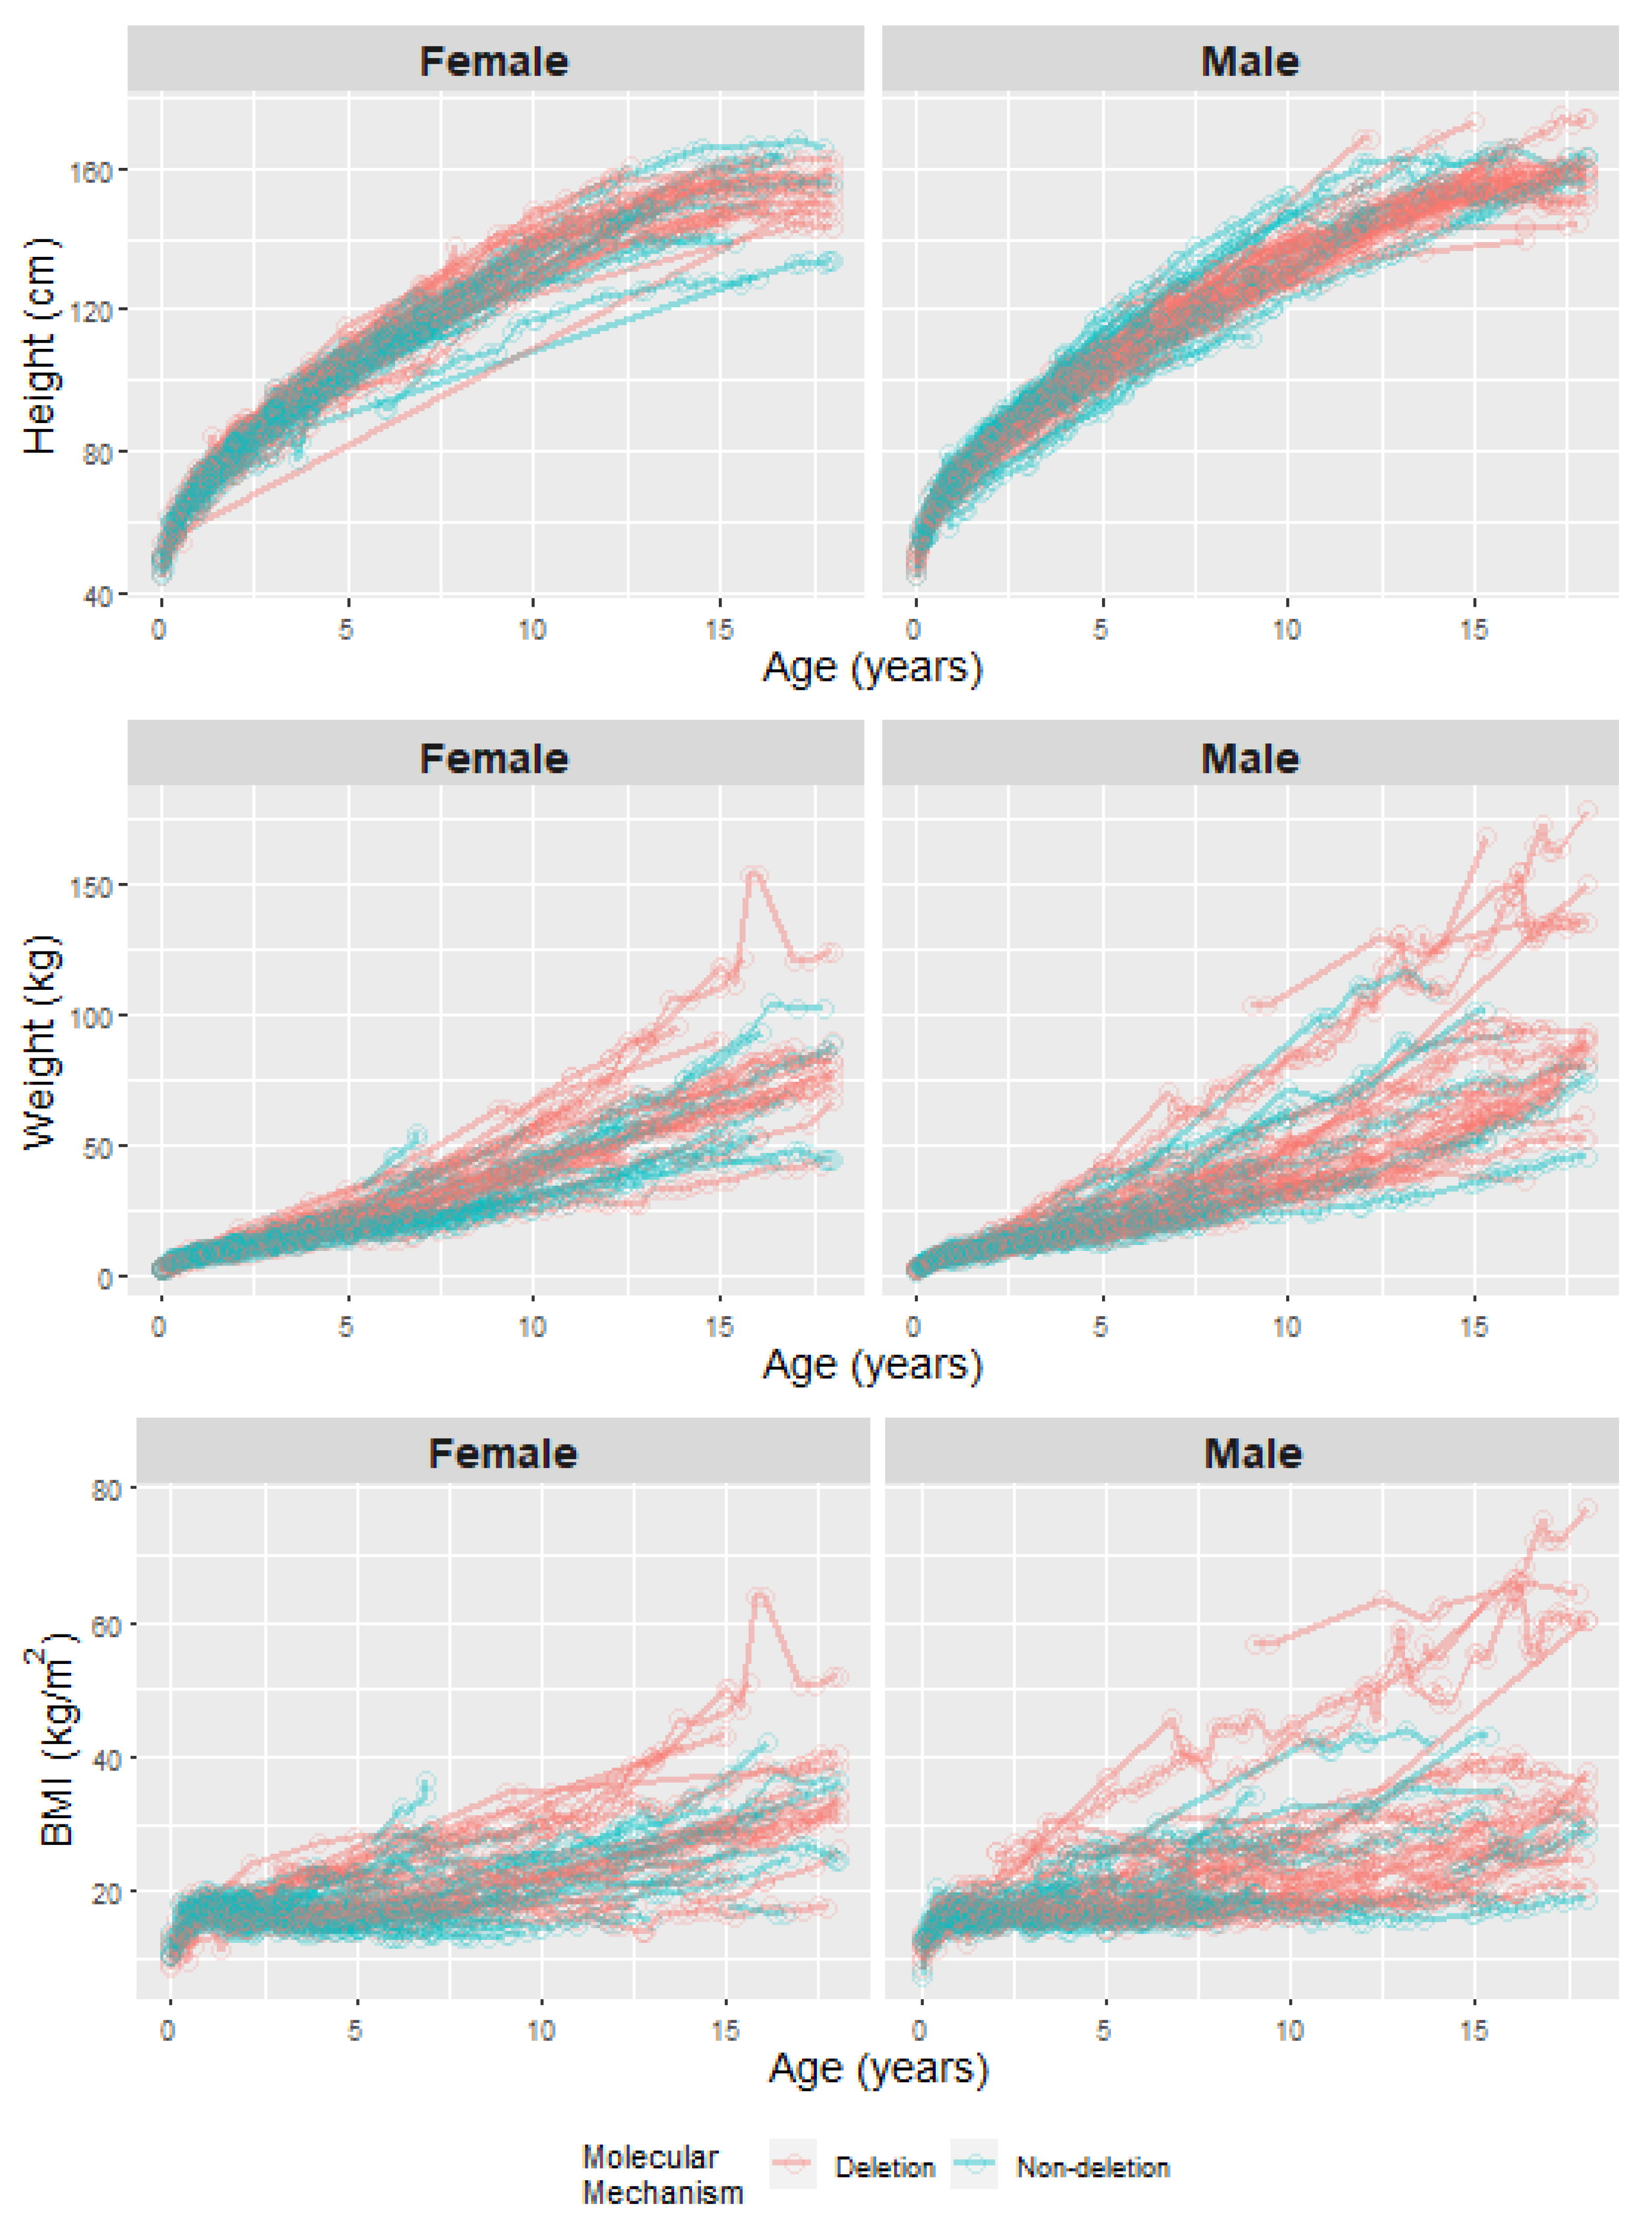
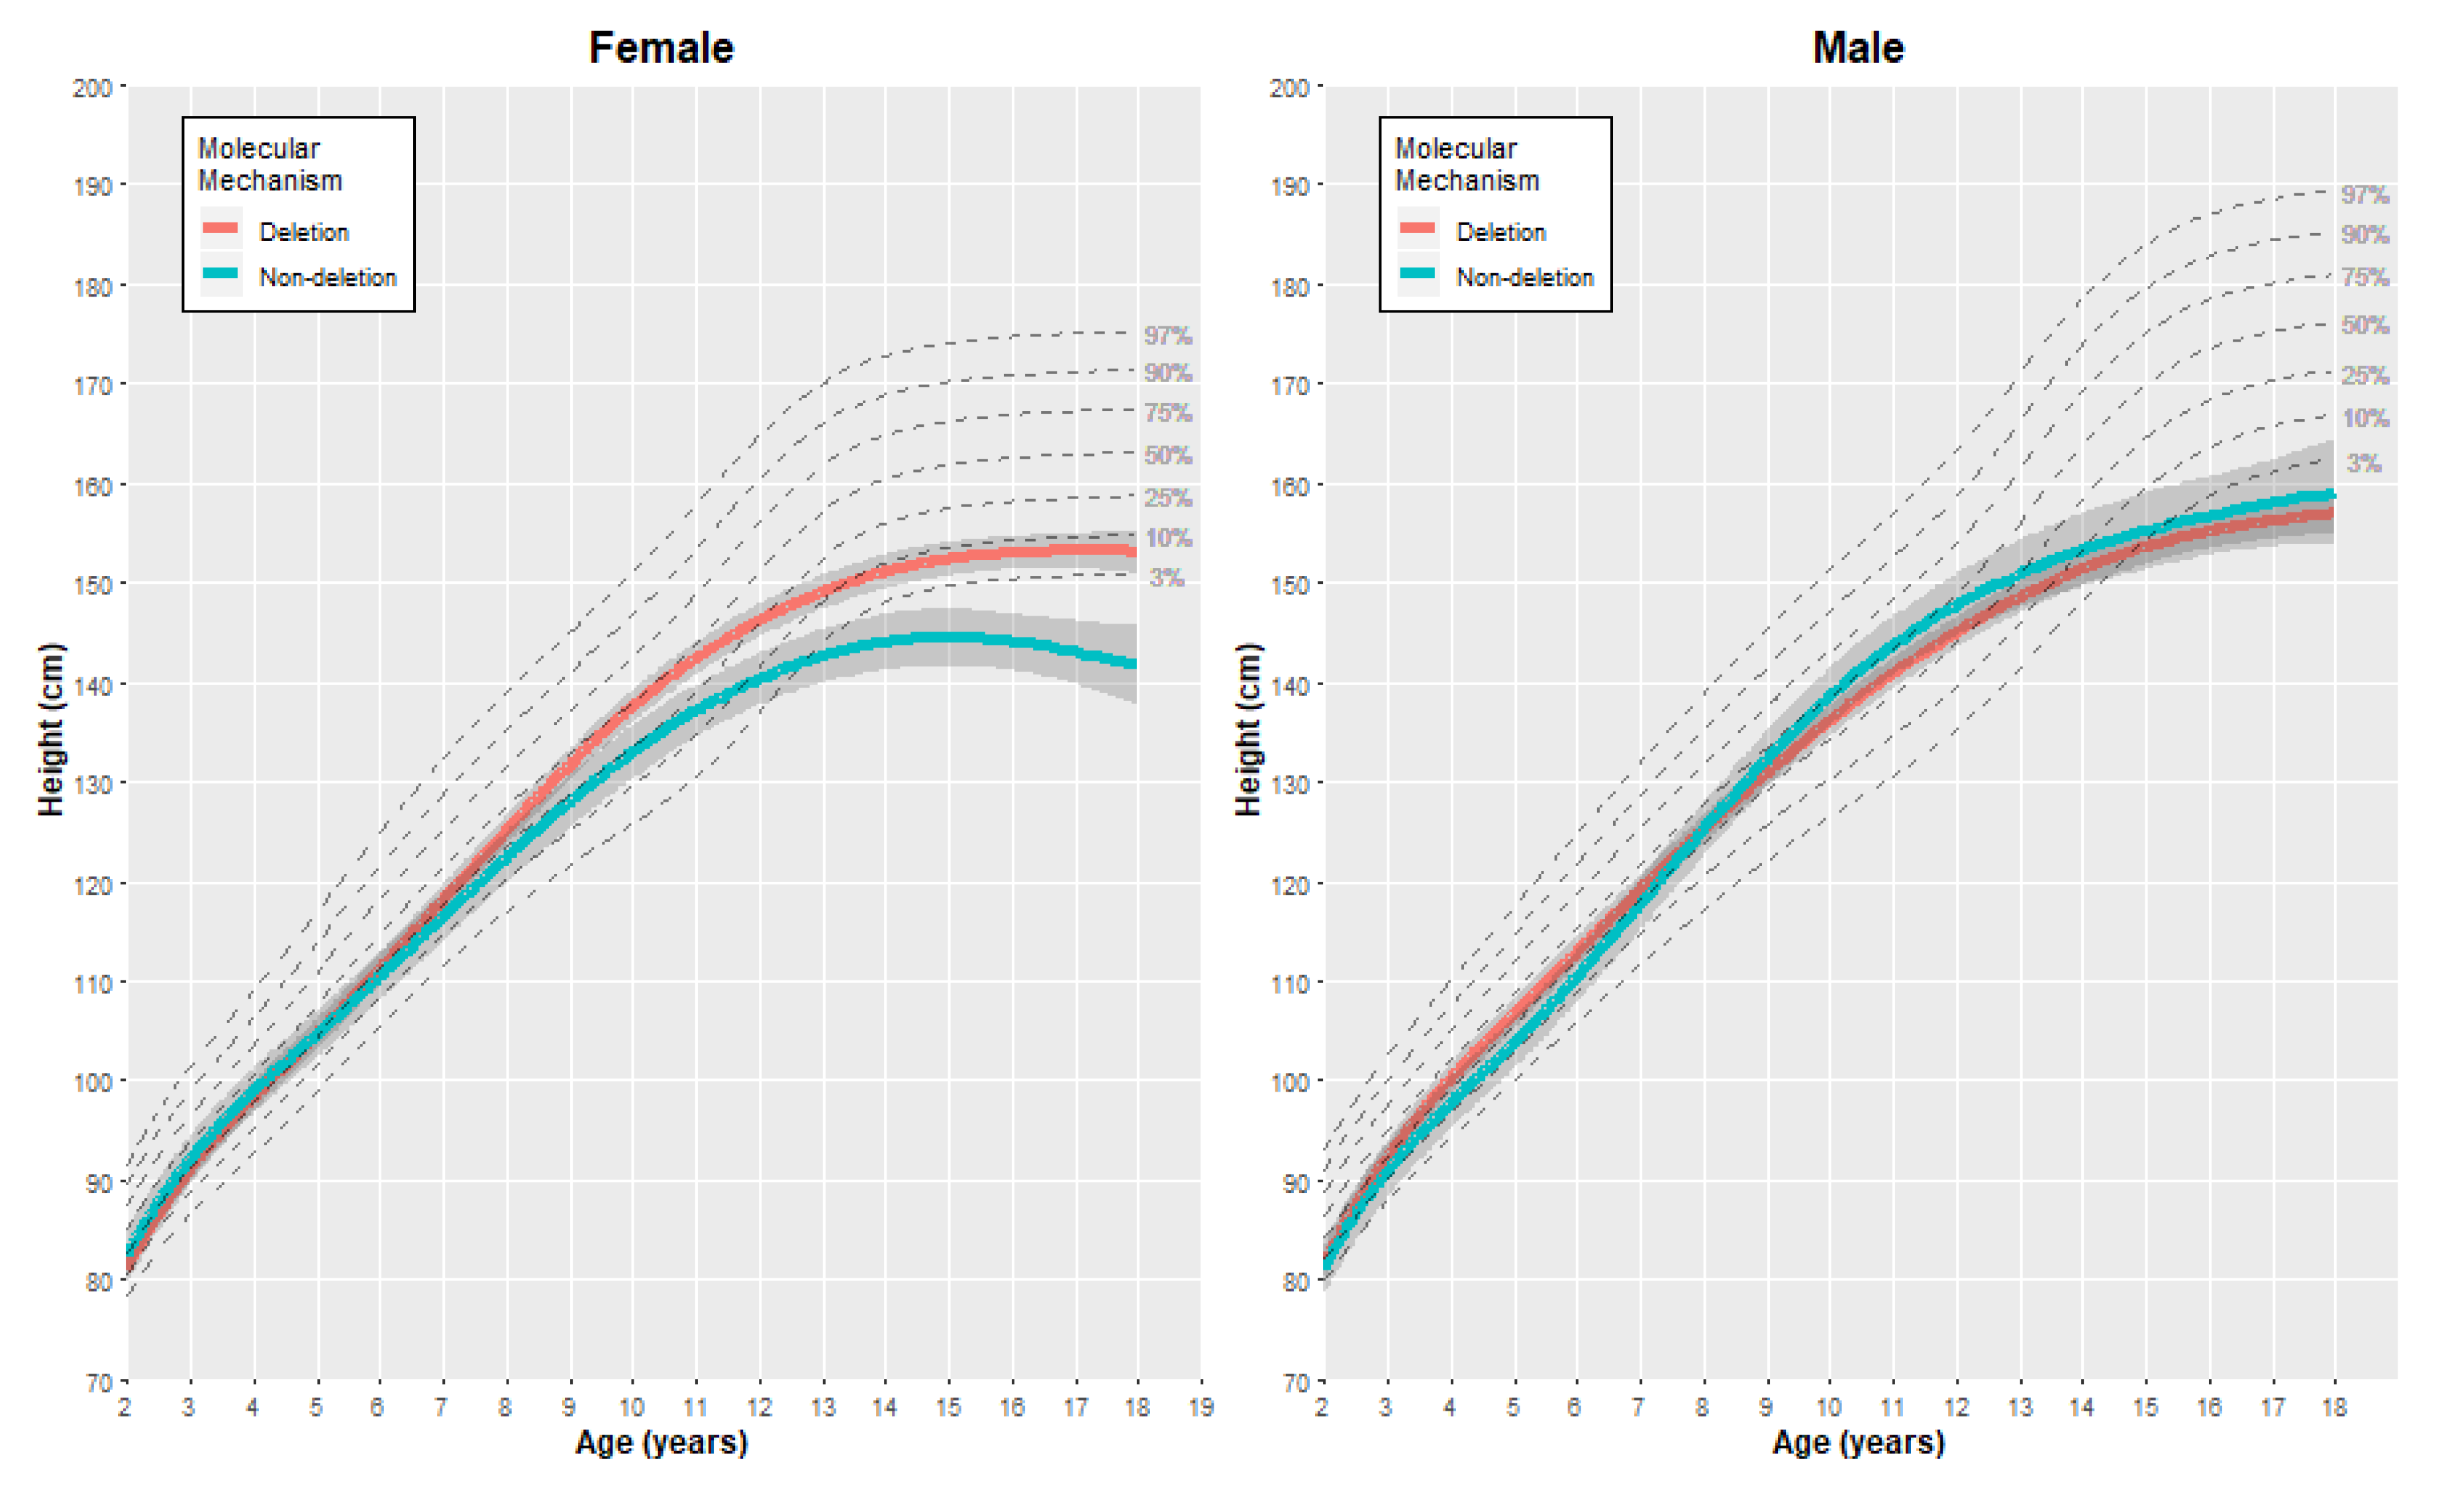
3.2.1. Height
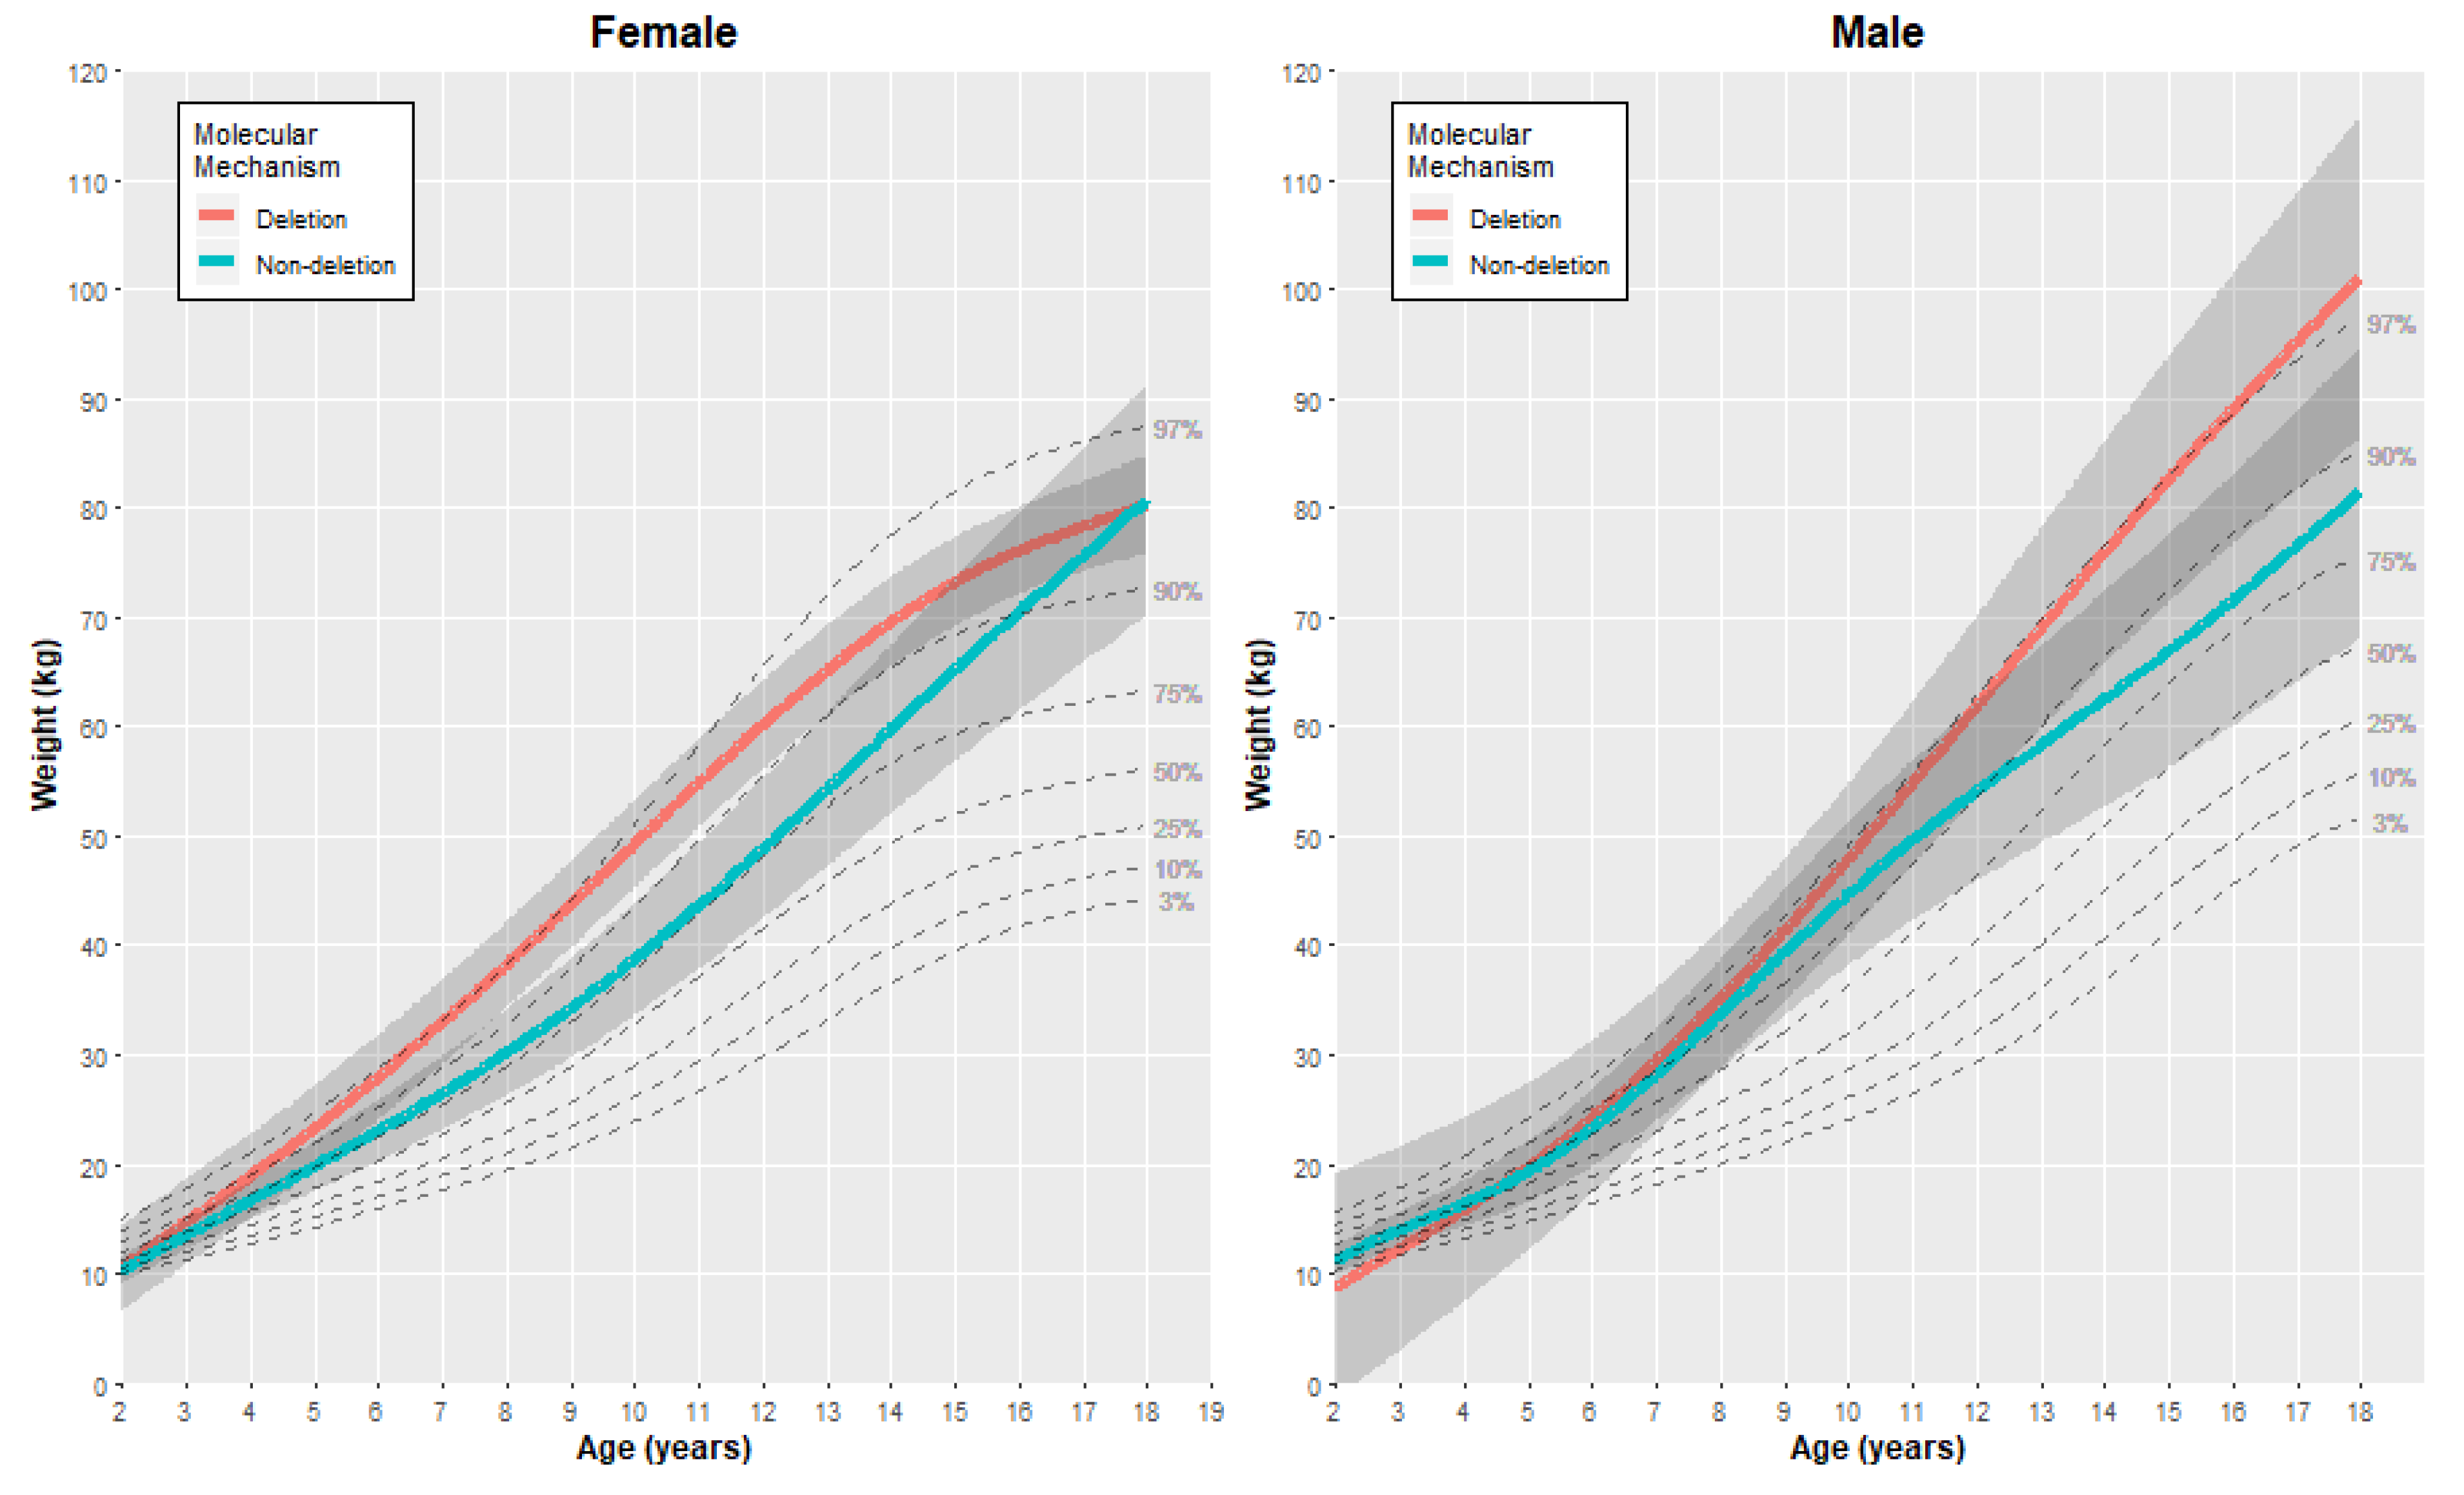
3.2.2. Weight
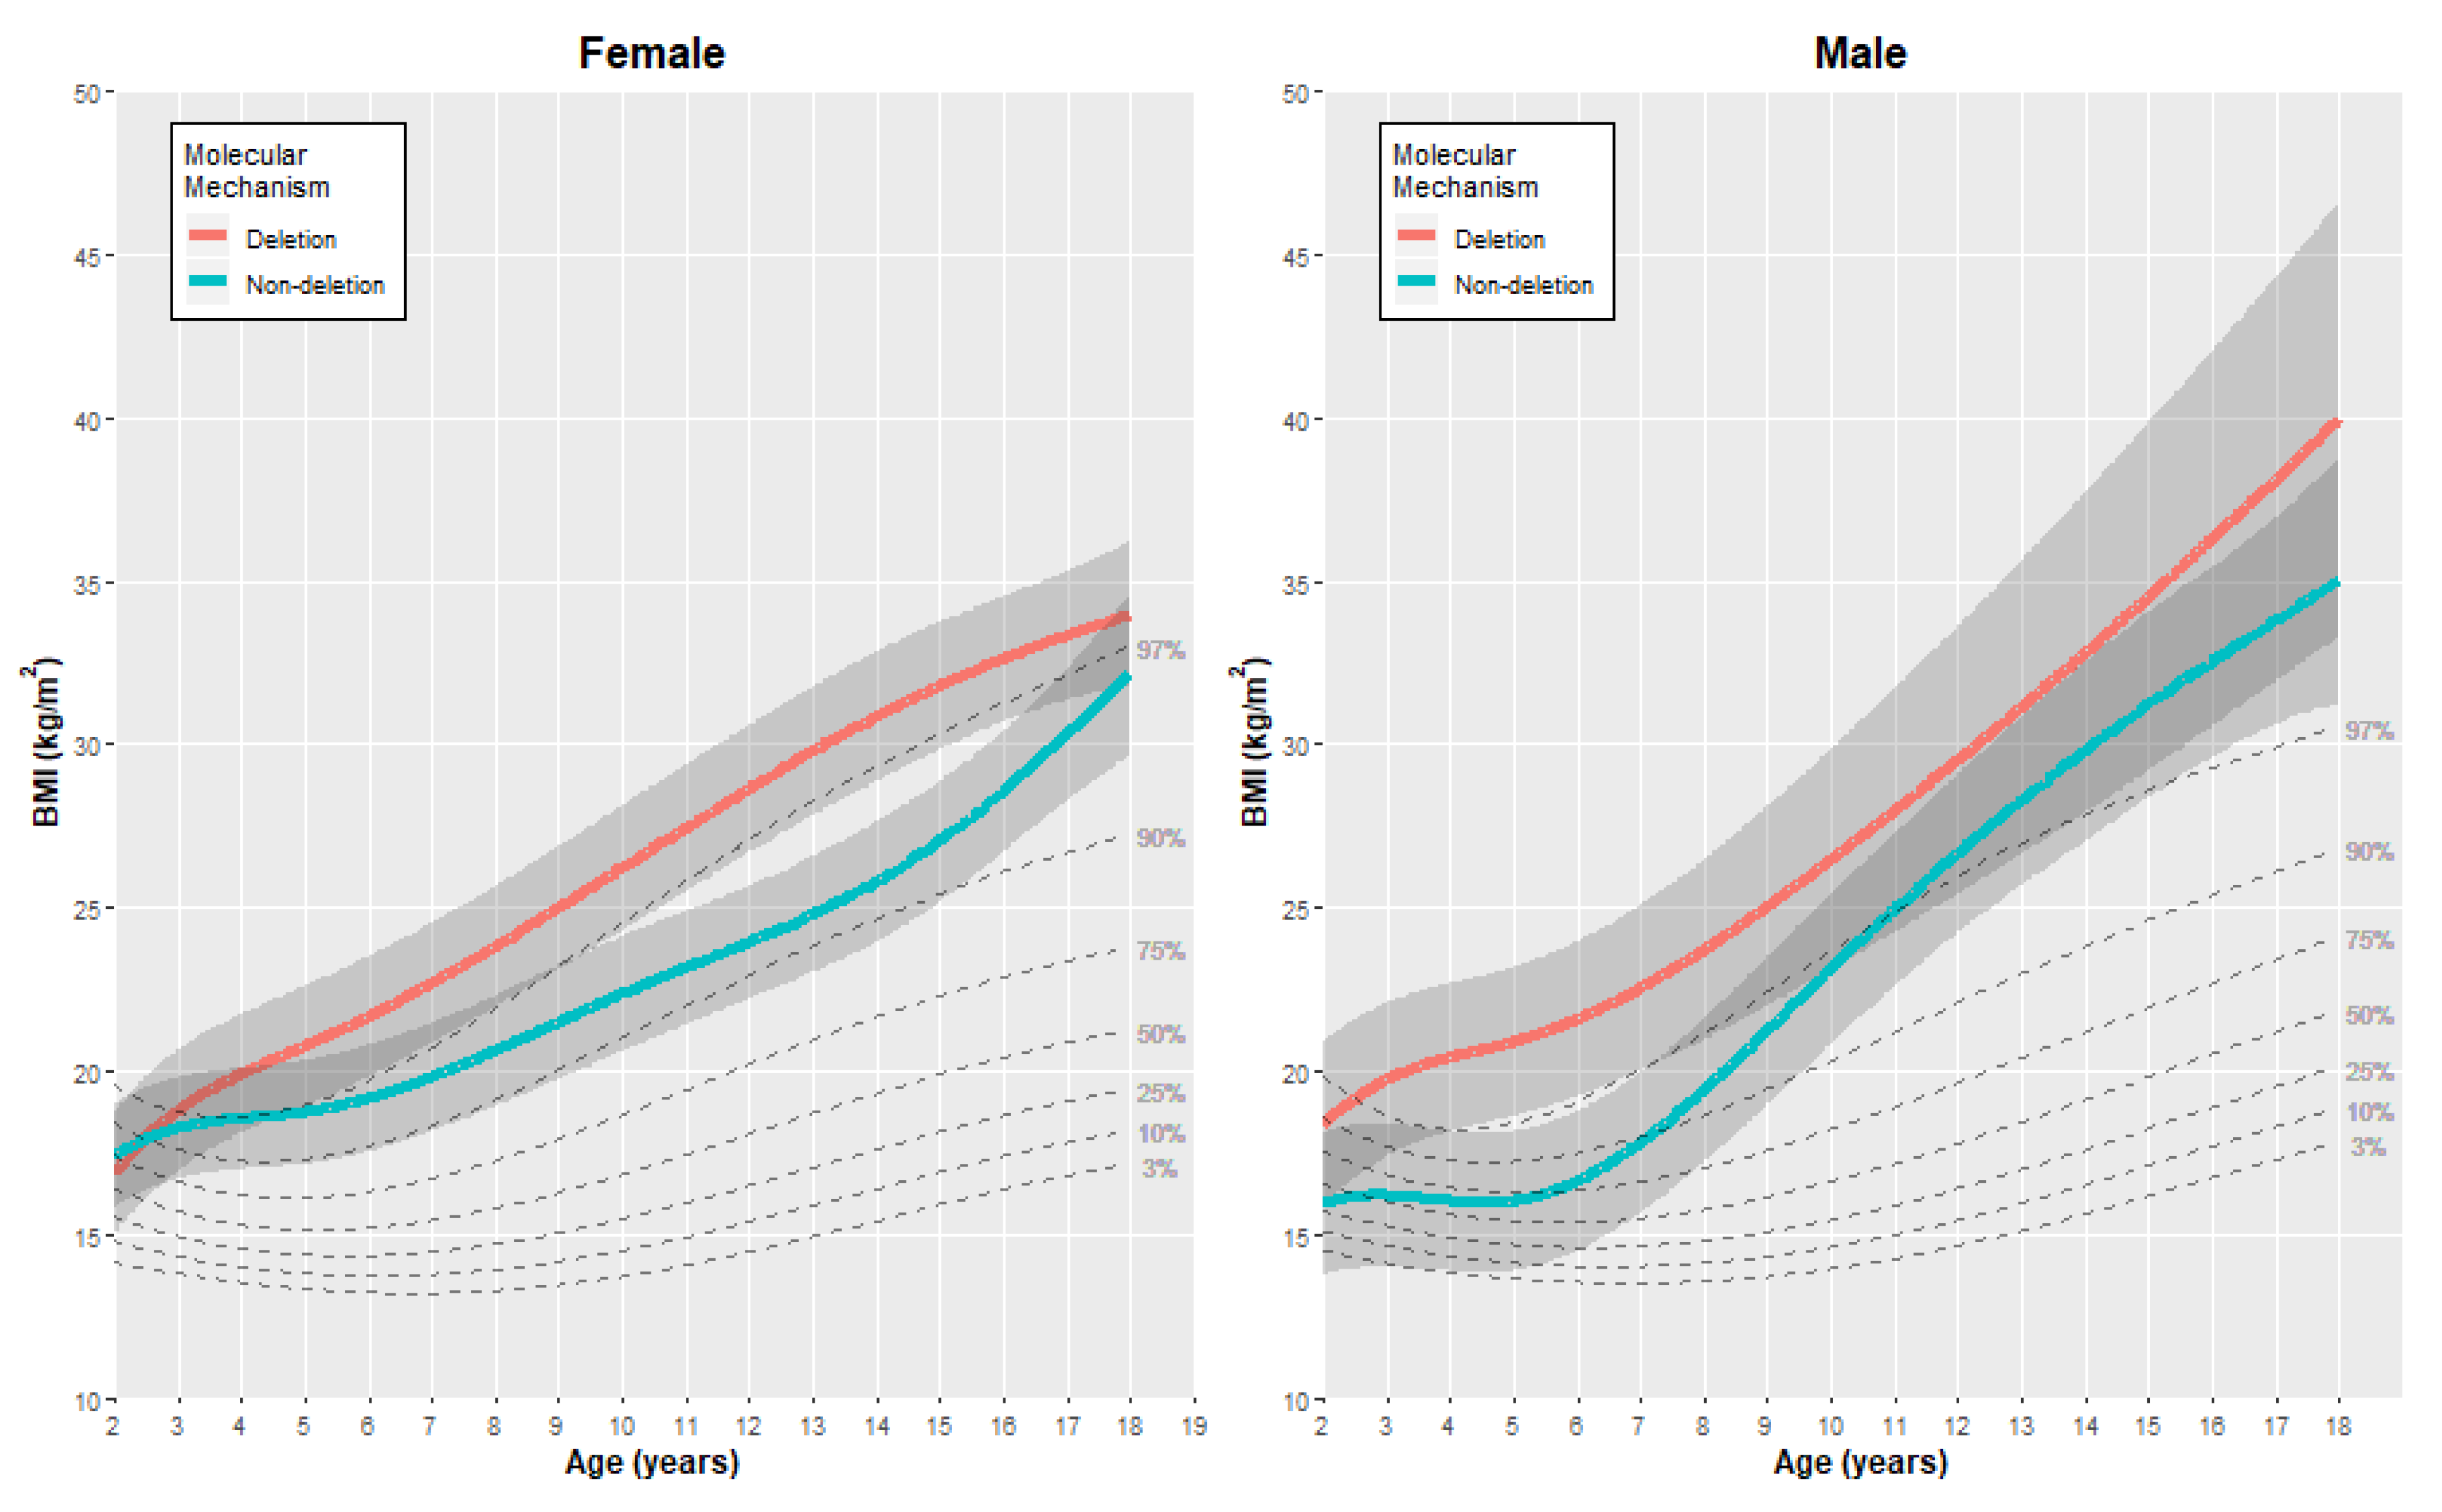
3.2.3. Body Mass Index (BMI)
3.3. Comparing the Average Rate of Growth between Genetic Subgroups
3.3.1. Height
3.3.2. Weight
3.3.3. Body Mass Index (BMI)
4. Discussion
5. Conclusions
Supplementary Materials
Author Contributions
Funding
Conflicts of Interest
References
- Cassidy, S.B.; Schwartz, S.; Miller, J.L.; Driscoll, D.J. Prader-Willi syndrome. Genet. Med. 2012, 14, 10–26. [Google Scholar] [CrossRef] [PubMed]
- Butler, M.G. Prader-Willi syndrome: Current understanding of cause and diagnosis. Am. J. Med. Genet. 1990, 35, 319–332. [Google Scholar] [CrossRef] [PubMed]
- Butler, M.G. Management of obesity in Prader-Willi syndrome. Nat. Clin. Pract. Endocrinol. Metab. 2006, 2, 592–593. [Google Scholar] [CrossRef] [PubMed]
- Lionti, T.; Reid, S.M.; Rowell, M.M. Prader-Willi syndrome in Victoria: Mortality and causes of death. J. Paediatr. Child Health 2012, 48, 506–511. [Google Scholar] [CrossRef]
- Butler, M.G.; Miller, J.L.; Forster, J.L. Prader-Willi syndrome—Clinical genetics, diagnosis and treatment approaches: An update. Curr. Pediatr. Rev. 2019, 15, 207–244. [Google Scholar] [CrossRef]
- Lionti, T.; Reid, S.M.; White, S.M.; Rowell, M.M. A population-based profile of 160 Australians with Prader-Willi syndrome: Trends in diagnosis, birth prevalence and birth characteristics. Am. J. Med. Genet. A 2015, 167A, 371–378. [Google Scholar] [CrossRef]
- Butler, M.G.; Bittel, D.C.; Kibiryeva, N.; Talebizadeh, Z.; Thompson, T. Behavioral differences among subjects with Prader-Willi syndrome and type I or type II deletion and maternal disomy. Pediatrics 2004, 113, 565–573. [Google Scholar] [CrossRef]
- Milner, K.M.; Craig, E.E.; Thompson, R.J.; Veltman, M.W.; Thomas, N.S.; Roberts, S.; Bellamy, M.; Curran, S.R.; Sporikou, C.M.; Bolton, P.F. Prader-Willi syndrome: Intellectual abilities and behavioural features by genetic subtype. J. Child Psychol. Psychiatry 2005, 46, 1089–1096. [Google Scholar] [CrossRef]
- Roof, E.; Stone, W.; MacLean, W.; Feurer, I.D.; Thompson, T.; Butler, M.G. Intellectual characteristics of Prader-Willi syndrome: Comparison of genetic subtypes. J. Intellect. Disabil. Res. 2000, 44 Pt 1, 25–30. [Google Scholar] [CrossRef]
- Torrado, M.; Araoz, V.; Baialardo, E.; Abraldes, K.; Mazza, C.; Krochik, G.; Ozuna, B.; Leske, V.; Caino, S.; Fano, V.; et al. Clinical-etiologic correlation in children with Prader-Willi syndrome (PWS): An interdisciplinary study. Am. J. Med. Genet. A 2007, 143A, 460–468. [Google Scholar] [CrossRef]
- Whittington, J.; Holland, A.; Webb, T.; Butler, J.; Clarke, D.; Boer, H. Cognitive abilities and genotype in a population-based sample of people with Prader-Willi syndrome. J. Intellect. Disabil. Res. 2004, 48, 172–187. [Google Scholar] [CrossRef] [PubMed]
- Yang, L.; Zhan, G.D.; Ding, J.J.; Wang, H.J.; Ma, D.; Huang, G.Y.; Zhou, W.H. Psychiatric illness and intellectual disability in the Prader-Willi syndrome with different molecular defects—A meta analysis. PLoS ONE 2013, 8, e72640. [Google Scholar] [CrossRef] [PubMed]
- Descheemaeker, M.J.; Govers, V.; Vermeulen, P.; Fryns, J.P. Pervasive developmental disorders in Prader-Willi syndrome: The Leuven experience in 59 subjects and controls. Am. J. Med. Genet. A 2006, 140, 1136–1142. [Google Scholar] [CrossRef] [PubMed]
- Veltman, M.W.; Craig, E.E.; Bolton, P.F. Autism spectrum disorders in Prader-Willi and Angelman syndromes: A systematic review. Psychiatr. Genet. 2005, 15, 243–254. [Google Scholar] [CrossRef] [PubMed]
- Soni, S.; Whittington, J.; Holland, A.J.; Webb, T.; Maina, E.; Boer, H.; Clarke, D. The course and outcome of psychiatric illness in people with Prader-Willi syndrome: Implications for management and treatment. J. Intellect. Disabil. Res. 2007, 51, 32–42. [Google Scholar] [CrossRef] [PubMed]
- Holland, A.J.; Whittington, J.E.; Butler, J.; Webb, T.; Boer, H.; Clarke, D. Behavioural phenotypes associated with specific genetic disorders: Evidence from a population-based study of people with Prader-Willi syndrome. Psychol. Med. 2003, 33, 141–153. [Google Scholar] [CrossRef]
- Spritz, R.A.; Bailin, T.; Nicholls, R.D.; Lee, S.T.; Park, S.K.; Mascari, M.J.; Butler, M.G. Hypopigmentation in the Prader-Willi syndrome correlates with P gene deletion but not with haplotype of the hemizygous P allele. Am. J. Med. Genet. 1997, 71, 57–62. [Google Scholar] [CrossRef]
- Gardner, R.J.M.; Amor, D.J. Chromosome Abnormalities and Genetic Counseling, 5th ed.; Oxford Monographs on Medical Genetics; Oxford University Press: New York, NY, USA, 2018. [Google Scholar]
- Butler, M.G.; Lee, J.; Cox, D.M.; Manzardo, A.M.; Gold, J.A.; Miller, J.L.; Roof, E.; Dykens, E.; Kimonis, V.; Driscoll, D.J. Growth charts for Prader-Willi syndrome during growth hormone treatment. Clin. Pediatr. 2016, 55, 957–974. [Google Scholar] [CrossRef]
- Butler, M.G.; Lee, J.; Manzardo, A.M.; Gold, J.A.; Miller, J.L.; Kimonis, V.; Driscoll, D.J. Growth charts for non-growth hormone treated Prader-Willi syndrome. Pediatrics 2015, 135, e126–e135. [Google Scholar] [CrossRef]
- Grajeda, L.M.; Ivanescu, A.; Saito, M.; Crainiceanu, C.; Jaganath, D.; Gilman, R.H.; Crabtree, J.E.; Kelleher, D.; Cabrera, L.; Cama, V.; et al. Modelling subject-specific childhood growth using linear mixed-effect models with cubic regression splines. Emerg. Themes Epidemiol. 2016, 13, 1. [Google Scholar] [CrossRef]
- Hastie, T.; Tibshirani, R.; Friedman, J. The Elements of Statistical Learning, Data Mining, Inference and Prediction; Springer: New York, NY, USA, 2001. [Google Scholar]
- Centres for Disease Control and Prevention. CDC Growth Charts; Centers for Disease Control and Prevention, National Center for Health Statistics: Atlanta, GA, USA, 2010.
- R Core Team. R: A Language and Environment for Statistical Computing; R Foundation for Statistical Computing: Vienna, Austria, 2017. [Google Scholar]
- Bates, D.; Machler, M.; Bolker, B.; Walker, S. Fitting Linear Mixed-Effects Models using lme4. J. Stat. Softw. 2015, 67, 1–48. [Google Scholar] [CrossRef]
- Pinheiro, J.; Bates, D.; DebRoy, S.; Sarkar, D.; R Development Core Team. nlme: Linear and Nonlinear Mixed Effects Models. R Package; R Foundation for Statistical Computing: Vienna, Austria, 2013. [Google Scholar]
- Wickham, H. ggplot2: Elegant Graphics for Data Analysis; Springer: New York, NY, USA, 2009. [Google Scholar]
- Laurier, V.; Lapeyrade, A.; Copet, P.; Demeer, G.; Silvie, M.; Bieth, E.; Coupaye, M.; Poitou, C.; Lorenzini, F.; Labrousse, F.; et al. Medical, psychological and social features in a large cohort of adults with Prader-Willi syndrome: Experience from a dedicated centre in France. J. Intellect. Disabil. Res. 2015, 59, 411–421. [Google Scholar] [CrossRef] [PubMed]
- Coupaye, M.; Tauber, M.; Cuisset, L.; Laurier, V.; Bieth, E.; Lacorte, J.M.; Oppert, J.M.; Clement, K.; Poitou, C. Effect of genotype and previous GH treatment on adiposity in adults with Prader-Willi syndrome. J. Clin. Endocrinol. Metab. 2016, 101, 4895–4903. [Google Scholar] [CrossRef] [PubMed]
- Kennedy, L.; Bittel, D.C.; Kibiryeva, N.; Kalra, S.P.; Torto, R.; Butler, M.G. Circulating adiponectin levels, body composition and obesity-related variables in Prader-Willi syndrome: Comparison with obese subjects. Int. J. Obes. 2006, 30, 382–387. [Google Scholar] [CrossRef] [PubMed][Green Version]
- Theodoro, M.F.; Talebizadeh, Z.; Butler, M.G. Body composition and fatness patterns in Prader-Willi syndrome: Comparison with simple obesity. Obesity 2006, 14, 1685–1690. [Google Scholar] [CrossRef] [PubMed]
- Butler, M.G.; Sturich, J.; Myers, S.E.; Gold, J.A.; Kimonis, V.; Driscoll, D.J. Is gestation in Prader-Willi syndrome affected by the genetic subtype? J. Assist. Reprod. Genet. 2009, 26, 461–466. [Google Scholar] [CrossRef]
- Varela, M.C.; Kok, F.; Setian, N.; Kim, C.A.; Koiffmann, C.P. Impact of molecular mechanisms, including deletion size, on Prader-Willi syndrome phenotype: Study of 75 patients. Clin. Genet. 2005, 67, 47–52. [Google Scholar] [CrossRef]
- Dykens, E.M.; Maxwell, M.A.; Pantino, E.; Kossler, R.; Roof, E. Assessment of hyperphagia in Prader-Willi syndrome. Obesity 2007, 15, 1816–1826. [Google Scholar] [CrossRef] [PubMed]
- Muscogiuri, G.; Formoso, G.; Pugliese, G.; Ruggeri, R.M.; Scarano, E.; Colao, A. Prader-Willi syndrome: An uptodate on endocrine and metabolic complications. Rev. Endocr. Metab. Disord. 2019, 20, 239–250. [Google Scholar] [CrossRef]
- Scheermeyer, E.; Hughes, I.; Harris, M.; Ambler, G.; Crock, P.; Verge, C.F.; Craig, M.E.; Bergman, P.; Werther, G.; van Driel, M.; et al. Response to growth hormone treatment in Prader-Willi syndrome: Auxological criteria versus genetic diagnosis. J. Paediatr. Child Health 2013, 49, 1045–1051. [Google Scholar] [CrossRef]


| Genetic Subtype | ||||
|---|---|---|---|---|
| Deletion (n = 72) | Non-Deletion (n = 53) | |||
| Females | n (%) | 31 (50) | 31 (50) | |
| Number of measurements | 915 | 723 | ||
| Age at time of measurement, years–median (IQR) | 7.0 (3.2–12.0) | 4.7 (2.0–8.9) | ||
| Year of birth–n (%) | ||||
| 1970–1989 | 4 (12.9) | 1 (3.2) | ||
| 1990–1999 | 13 (41.9) | 3 (9.7) | ||
| 2000–2009 | 9 (29.0) | 14 (45.2) | ||
| 2010–2019 | 5 (16.1) | 13 (41.9) | ||
| Participants with ≥ 1 measurement in each age interval–n (%) | ||||
| Birth–2 years | 26 (83.9) | 26 (83.9) | ||
| > 2–5 years | 23 (74.2) | 21 (67.7) | ||
| > 5–10 years | 24 (77.4) | 21 (67.7) | ||
| > 10–15 years | 18 (58.1) | 10 (32.3) | ||
| > 15 years | 15 (48.4) | 8 (25.8) | ||
| Males | n (%) | 41 (65.1) | 22 (34.9) | |
| Number of measurements | 1225 | 702 | ||
| Age at time of measurement, years–median (IQR) | 7.6 (3.7–12.3) | 4.8 (2.0–8.6) | ||
| Year of birth–n (%) | ||||
| 1970–1989 | 11 (26.8) | 2 (9.1) | ||
| 1990–1999 | 12 (29.3) | 3 (13.6) | ||
| 2000–2009 | 7 (17.1) | 6 (27.3) | ||
| 2010–2018 | 11 (26.8) | 11 (50.0) | ||
| Participants with ≥ 1 measurement in each age interval–n (%) | ||||
| Birth–2 years | 27 (65.9) | 20 (90.9) | ||
| > 2–5 years | 28 (68.3) | 19 (86.4) | ||
| > 5–10 years | 32 (78.0) | 16 (72.7) | ||
| > 10–15 years | 26 (63.4) | 9 (40.9) | ||
| > 15 years | 21 (51.2) | 6 (27.3) | ||
| Gender | Outcome | Age (Years) | Deletion | Non-Deletion | Difference (Deletion – Non-Deletion) | |||
|---|---|---|---|---|---|---|---|---|
| Mean | (SE) | Mean | (SE) | Mean | [95% CI] | |||
| Female | Height (cm) | 2 | 81.23 | (0.81) | 82.61 | (1.19) | −1.38 | [−4.32, 1.56] |
| 5 | 104.63 | (0.78) | 104.62 | (1.20) | 0.01 | [−2.91, 2.93] | ||
| 10 | 137.58 | (0.83) | 133.00 | (1.37) | 4.58 | [1.31, 7.85] | ||
| 15 | 152.36 | (0.87) | 144.49 | (1.46) | 7.87 | [4.40, 11.34] | ||
| 18 | 153.11 | (1.12) | 141.71 | (2.04) | 11.40 | [6.65, 16.15] | ||
| Female | Weight (kg) | 2 | 10.46 | (1.99) | 10.33 | (0.63) | 0.13 | [−4.13, 4.39] |
| 5 | 23.25 | (1.97) | 19.81 | (1.15) | 3.44 | [−1.22, 8.10] | ||
| 10 | 49.26 | (2.05) | 38.73 | (2.62) | 10.53 | [3.74, 17.32] | ||
| 15 | 73.22 | (2.08) | 65.21 | (4.27) | 8.01 | [−1.69, 17.71] | ||
| 18 | 80.26 | (2.32) | 80.73 | (5.38) | −0.47 | [−12.44, 11.50] | ||
| Female | BMI (kg/m2) | 2 | 16.88 | (0.95) | 17.41 | (0.80) | −0.53 | [−3.07, 2.01] |
| 5 | 20.76 | (0.94) | 18.73 | (0.81) | 2.03 | [−0.50, 4.56] | ||
| 10 | 26.22 | (0.98) | 22.37 | (0.90) | 3.85 | [1.13, 6.57] | ||
| 15 | 31.80 | (1.00) | 27.05 | (0.94) | 4.75 | [1.95, 7.55] | ||
| 18 | 34.00 | (1.14) | 32.18 | (1.26) | 1.82 | [−1.65, 5.29] | ||
| Male | Height (cm) | 2 | 81.85 | (0.83) | 81.41 | (1.37) | 0.44 | [−2.89, 3.77] |
| 5 | 106.70 | (0.78) | 103.78 | (1.32) | 2.92 | [−0.27, 6.11] | ||
| 10 | 136.17 | (0.80) | 138.58 | (1.49) | −2.41 | [−5.93, 1.11] | ||
| 15 | 153.60 | (0.88) | 155.23 | (1.96) | −1.63 | [−6.10, 2.84] | ||
| 18 | 157.01 | (1.05) | 159.16 | (2.74) | −2.15 | [−8.25, 3.95] | ||
| Male | Weight (kg) | 2 | 8.75 | (5.27) | 11.27 | (0.66) | −2.52 | [−13.57, 8.53] |
| 5 | 19.75 | (3.89) | 19.30 | (1.43) | 0.45 | [−8.17, 9.07] | ||
| 10 | 47.92 | (3.51) | 44.72 | (3.35) | 3.20 | [−6.89, 13.29] | ||
| 15 | 82.62 | (5.73) | 66.94 | (5.45) | 15.68 | [−0.77, 32.13] | ||
| 18 | 101.11 | (7.54) | 81.50 | (6.80) | 29.61 | [−1.51, 40.73] | ||
| Male | BMI (kg/m2) | 2 | 18.35 | (1.28) | 15.93 | (1.11) | 2.42 | [−1.10, 5.94] |
| 5 | 20.89 | (1.16) | 16.02 | (1.09) | 4.87 | [1.56, 8.18] | ||
| 10 | 26.49 | (1.72) | 23.14 | (1.17) | 3.35 | [−0.98, 7.68] | ||
| 15 | 34.53 | (2.78) | 31.22 | (1.45) | 3.31 | [−3.10, 9.72] | ||
| 18 | 39.95 | (3.39) | 35.02 | (1.90) | 4.93 | [−3.15, 13.01] | ||
| Outcome | Age (Years) | Average Difference in Mean Rate of Growth (Deletion – Non-Deletion) | |||||
|---|---|---|---|---|---|---|---|
| Females | Males | ||||||
| Estimate | [95% CI] | p-Value | Estimate | [95% CI] | p-Value | ||
| Height (cm/year) | < 2 | 0.10 | [−1.09, 1.29] | 0.87 | 1.35 | [−0.20, 2.91] | 0.09 |
| 2–5 | 0.37 | [−1.23, 1.98] | 0.65 | −1.30 | [−3.14, 0.5] | 0.17 | |
| 5–10 | 0.14 | [−0.92, 1.20] | 0.80 | −1.41 | [−2.55, −0.28] | 0.01 | |
| 10–15 | −0.75 | [−1.75, 0.25] | 0.14 | 2.76 | [1.64, 3.89] | <0.01 | |
| > 15 | 1.09 | [−0.76, 2.93] | 0.25 | 1.82 | [−0.29, 3.93] | 0.09 | |
| Weight (kg/year) | < 2 | 0.73 | [−0.71, 2.16] | 0.32 | −0.15 | [−2.56, 2.26] | 0.90 |
| 2–5 | −0.36 | [−2.14, 1.41] | 0.69 | 0.19 | [−2.08, 2.46] | 0.87 | |
| 5–10 | 1.03 | [−0.14, 2.20] | 0.08 | −0.23 | [−1.67, 1.21] | 0.75 | |
| 10–15 | −1.56 | [−2.66, −0.46] | 0.01 | 3.71 | [2.30, 5.12] | <0.01 | |
| > 15 | −1.87 | [−3.90, 0.16] | 0.07 | 1.36 | [−1.30, 4.02] | 0.32 | |
| BMI ((kg/m2)/year) | < 2 | 1.36 | [0.58, 2.15] | <0.01 | 1.07 | [−0.11, 2.25] | 0.07 |
| 2–5 | −1.06 | [−2.08, −0.05] | 0.04 | −0.57 | [−1.85, 0.70] | 0.38 | |
| 5–10 | −0.12 | [−0.76, 0.54] | 0.73 | −0.42 | [−1.22, 0.38] | 0.31 | |
| 10–15 | −0.38 | [−0.99, 0.24] | 0.23 | 0.40 | [−0.39, 1.19] | 0.32 | |
| > 15 | −0.94 | [−2.10, 0.22] | 0.11 | 0.20 | [−1.27, 1.67] | 0.79 | |
© 2020 by the authors. Licensee MDPI, Basel, Switzerland. This article is an open access article distributed under the terms and conditions of the Creative Commons Attribution (CC BY) license (http://creativecommons.org/licenses/by/4.0/).
Share and Cite
Shepherd, D.A.; Vos, N.; Reid, S.M.; Godler, D.E.; Guzys, A.; Moreno-Betancur, M.; Amor, D.J. Growth Trajectories in Genetic Subtypes of Prader–Willi Syndrome. Genes 2020, 11, 736. https://doi.org/10.3390/genes11070736
Shepherd DA, Vos N, Reid SM, Godler DE, Guzys A, Moreno-Betancur M, Amor DJ. Growth Trajectories in Genetic Subtypes of Prader–Willi Syndrome. Genes. 2020; 11(7):736. https://doi.org/10.3390/genes11070736
Chicago/Turabian StyleShepherd, Daisy A., Niels Vos, Susan M. Reid, David E. Godler, Angela Guzys, Margarita Moreno-Betancur, and David J. Amor. 2020. "Growth Trajectories in Genetic Subtypes of Prader–Willi Syndrome" Genes 11, no. 7: 736. https://doi.org/10.3390/genes11070736
APA StyleShepherd, D. A., Vos, N., Reid, S. M., Godler, D. E., Guzys, A., Moreno-Betancur, M., & Amor, D. J. (2020). Growth Trajectories in Genetic Subtypes of Prader–Willi Syndrome. Genes, 11(7), 736. https://doi.org/10.3390/genes11070736