Article

PURα Promotes the Transcriptional Activation of PCK2 in Oesophageal Squamous Cell Carcinoma Cells

State Key Laboratory of Molecular Oncology, National Cancer Center/National Clinical Research Center for Cancer/Cancer Hospital, Chinese Academy of Medical Sciences and Peking Union Medical College, Beijing 100021, China
*
Author to whom correspondence should be addressed.
Genes 2020, 11(11), 1301; https://doi.org/10.3390/genes11111301
Submission received: 5 September 2020 / Revised: 15 October 2020 / Accepted: 30 October 2020 / Published: 31 October 2020
(This article belongs to the Section Human Genomics and Genetic Diseases)

Abstract

:
Esophageal squamous cell carcinoma (ESCC) is one of the most lethal gastrointestinal malignancies due to its characteristics of local invasion and distant metastasis. Purine element binding protein α (PURα) is a DNA and RNA binding protein, and recent studies have showed that abnormal expression of PURα is associated with the progression of some tumors, but its oncogenic function, especially in ESCC progression, has not been determined. Based on the bioinformatic analysis of RNA-seq and ChIP-seq data, we found that PURα affected metabolic pathways, including oxidative phosphorylation and fatty acid metabolism, and we observed that it has binding peaks in the promoter of mitochondrial phosphoenolpyruvate carboxykinase (PCK2). Meanwhile, PURα significantly increased the activity of the PCK2 gene promoter by binding to the GGGAGGCGGA motif, as determined though luciferase assay and ChIP-PCR/qPCR. The results of Western blotting and qRT-PCR analysis showed that PURα overexpression enhances the protein and mRNA levels of PCK2 in KYSE510 cells, whereas PURα knockdown inhibits the protein and mRNA levels of PCK2 in KYSE170 cells. In addition, measurements of the oxygen consumption rate (OCR) and extracellular acidification rate (ECAR) indicated that PURα promoted the metabolism of ESCC cells. Taken together, our results help to elucidate the molecular mechanism by which PURα activates the transcription and expression of PCK2, which contributes to the development of a new therapeutic target for ESCC.

1. Introduction

Esophageal squamous cell carcinoma (ESCC) is one of the deadliest malignant tumors in the world. Although the management and treatment of patients with ESCC have been improved, the 5-year survival rate (~20–30%) of patients with ESCC is still low [1]. In recent years, large-scale genome sequencing and protein maps have provided novel insights into the diagnosis of early esophageal cancer, the prediction of susceptibility genes and the discovery of biomarkers that may be used in targeted therapy for ESCC [2]. An increasing number of researchers have mainly explored ESCC in terms of tumor immunity, lncRNAs, drug therapy and biomarkers [3,4,5,6].
The human purine-rich element binding protein (PUR) consists of the Pur-alpha (PURα) and Pur-beta (PURβ) and two forms of the Pur-gamma (PURγ) proteins, respectively [7]. Among these proteins, PURα contains 322 amino acids. PURα is a sequence-specific single-stranded DNA and RNA binding protein that participates in a variety of biological processes, including myoblast differentiation, hematopoietic and nervous system development, virus activation, tumorigenesis and drug resistance [8,9,10,11,12,13]. The protein sequence of PURα with three repeated nucleic acid binding domains is highly conserved from bacteria to humans [11,14] and plays an important role in the development of the mammalian hematopoiesis and the central nervous system. PURA homozygous knockout mice survive briefly, exhibit movement disorders and develop memory deficits after birth [15,16]. In addition, deletions or mutations in PURA have now been implicated in acute myeloid leukemia (AML), myelodysplastic syndrome (MDS) and PURA syndrome characterized by neonatal hypotonia, respiratory compromise, feeding difficulties, severe intellectual disability and epilepsy [17,18,19,20]. Moreover, abnormal expression of PURα is also correlated with proliferation and the anchorage-independent colony formation of ovarian or prostate cancer cells [12,21,22]. Recent elucidation of the abnormal expression of PURα in ESCC helps to provide a basic-research support for the tumor progression [23,24]. Similarly, our previous research observed high expression of PURα in ESCC tissue samples, suggesting that PURα plays an essential role in ESCC (unpublished data). However, the molecular pathways involved in the occurrence, development and treatment of ESCC are very complex [25], and little is known regarding the oncogenic function of PURα in ESCC. Consequently, we performed a chromatin immunoprecipitation sequencing (ChIP-seq) and RNA-seq analysis of ESCC cells to determine the global occupancy and underlying functions of PURα. Through the bioinformatic analysis of ChIP-seq and RNA-seq, we found that PURα was strongly associated with metabolic pathways and that mitochondrial phosphoenolpyruvate carboxykinase (PCK2) was an optimal candidate gene for PURα. Our results demonstrated the novel specific motifs and functions of PURα and elucidated the transcriptional regulation mechanism of PURα for the PCK2 gene. The results of this study may serve to elucidate the molecular mechanism of ESCC and facilitate the diagnosis and treatment of ESCC.

2. Materials and Methods

2.1. Cell Culture

The human ESCC cell lines KYSE510 and KYSE170 were generously provided by Dr Shimada (Hyogo College of Medicine, Hyogo, Japan). KYSE170-shNC and KYSE170-shPURα32/34 cells, stable PURα-knockdown cells, were constructed via infection with shPURα32/34 lentiviral particles (Fulengen, Guangzhou, China) and selection with 100 μM hygromycin B (Invitrogen, Carlsbad, CA, USA) for more than 2 weeks. The shRNA sequences are listed in Table 5. KYSE510-pCMV6 and KYSE510-PURα, stable PURα-overexpressing cells, were generated via transfection of the pCMV6 and pCMV6-PURα plasmid into KYSE510 cells, respectively, and selection with 400μg/mL G418 (Sigma-Aldrich, St. Louis, MO, USA) was for more than 2 weeks. The cells were cultured in RPMI 1640 medium (GE Healthcare Life Sciences, Pittsburgh, PA, USA) with 10% fetal bovine serum (FBS) (HyClone, Logan, UT, USA) in a humidified cell incubator (NAPCO, Winchester, VA, USA) with 5% CO2 at 37 °C.

2.2. RNA Extraction, Real-Time Quantitative PCR (qRT-PCR) and RNA Sequencing (RNA-seq)

Total RNA from cells was isolated and extracted with a TRIzol kit (Invitrogen, Carlsbad, CA, USA) and Direct-zolTM RNA MiniPrep kit (Zymo Research, Irvine, CA, USA). Reverse transcription synthesis of cDNA was performed using 2 μg RNA as template and a HiFiScript cDNA Synthesis kit (CWBIO, Beijing, China). Real-time quantitative RT-PCR was performed out using a TB Green® Premix Ex Taq quantitative kit (Tli RNaseH Plus) (Takara, Kyoto, Japan) and QuantStudio quantitative 5 instrument (Applied Biosystems, Foster, CA, USA). The expression of mRNA for all genes was normalized to β-actin. The primer sequences are listed in Table 1, and the final raw data were analyzed by the 2−∆∆Ct calculation method [26].
Total RNA from KYSE510-pCMV6 and KYSE510-PURα stable cells was isolated from 1 × 10⁷ cells and treated with RQ1 DNase (Promega, Wisconsin, WI, USA) to remove DNA. Polyadenylated mRNAs were purified and concentrated with oligo (dT)-conjugated magnetic beads (Invitrogen, Carlsbad, CA, USA) before directional RNA-seq library preparation. Then, the purified mRNAs were fragmented at 95°C followed by end repair and 5' adaptor ligation and the cleaved RNA fragments were reverse-transcribed to generate cDNAs using primers containing a 3' adaptor sequence and random hexamers. The cDNAs were purified and amplified and PCR products corresponding to 200-500 bp were purified, quantified and stored at −80 °C until used for sequencing was performed.
For high-throughput sequencing with biological triplicates per group, the Illumina HiSeq X Ten (Illumina, San Diego, CA, USA) system was used to obtain 150-nt paired-end sequencing reads by ABLife Inc. (Wuhan, China). Briefly, the clean reads were generated after removing adaptor sequences and low-quality sequences. A FASTX-Toolkit (Version 0.0.13) software was used to obtain the filtered clean reads. Then, filtered reads were mapped to human genome hg38 using TopHat2 version 2.1.0 [27] with default settings and reads summarized by gene feature using htseq-count [28]. Expression levels of each gene were calculated by counting the number of sequenced tags mapped to the gene and normalized by mapped reads per kilo base of exon per million mapped reads (RPKM) based on a previous method [29]. Differentially expressed genes (DEGs) with a RPKM logFC ≥ 0.5 or ≤ −0.5 and p < 0.01 were analyzed using the edgeR package embedded in R software [30].

2.3. ChIP-seq and ChIP-PCR Assay

Transcriptome sequencing libraries were prepared using the ThruPLEX DNA-seq Kit (Rubicon Genomics, Ann Arbor, MI, USA) by following the manufacturer’s procedure. Whole cell extracts of KYSE510-PURα cells were prepared from formaldehyde fixed cells resuspended in 1 mL lysis buffer containing 50 mM Tris pH 7.4, 150 mM NaCl, 2 mM EDTA, 0.1% SDS, 0.5% NP-40 and 0.5% deoxycholate. The DNA fragments ranging from 200 to 500 bp were sonicated from suspension, centrifuged at 12,000× g for 10 min and collected from the supernatant. For each immunoprecipitation, 300 µL of DNA fragments was incubated with 10 μg PURα antibody (Abcam, Cambridge, MA, USA, Cat#ab125200) and corresponding rabbit anti-Ig G antibody (Cell Signaling Technology, Danvers, MA, USA, Cat#2729P), respectively, overnight at 4 °C, and the immunoprecipitates were further incubated with protein A Dynabeads for 3 h at 4 °C. After applying the magnet and removing the supernatants, the beads were sequentially washed with lysis buffer, high-salt buffer (250 mM Tris pH 7.4, 750 mM NaCl, 10 mM EDTA, 0.1% SDS, 0.5% NP-40 and 0.5 deoxycholate), and PNK buffer (50 mM Tris, 20 mM EGTA and 0.5% NP-40) twice. The immunoprecipitates were eluted from the beads with elution buffer (50 nM Tris pH 8.0, 10 mM EDTA and 1% SDS) and reverse cross-linked by overnight incubation at 65 °C. After sequential RNase A (Thermo, Waltham, MA, USA) and proteinase K (Invitrogen, Carlsbad, CA, USA) treatment, DNA fragments were purified by phenol extraction and ethanol precipitation. To generate libraries for high-throughput sequencing, purified DNA fragments were end-repaired, adenylated, ligated to adaptors and PCR amplified for 18 cycles. The PCR products measuring 250–450 bp were gel-purified, quantified and stored at −80 °C until they were used for sequencing.
For high-throughput sequencing, the libraries were prepared following the manufacturer's instructions and applied to an Illumina NextSeq 500 (Illumina, San Diego, CA, USA) system for 151-nt paired-end sequencing by ABLife (Wuhan, China). The raw reads obtained after sequencing were processed to obtain the filtered clean reads using FASTX toolkit (http://hannonlab.cshl.edu/fastx_toolkit) to remove low quality (< 20) and short (<16 nt) reads. The quality filtered reads were mapped to the human genome hg38 by Bowtie2 [31]. Only the uniquely mapped reads were kept for further analysis. Enriched binding peaks were generated after filtering through control input by MACS14 (version 1.4) [32] with default thresholds to identify significant PURα binding sites/peaks. Peaks were annotated by using bedtools software (v2.24.0) (https://bedtools.readthedocs.io/en/latest/). Plots showing representative peak regions were generated using Integrated Genome Viewer (version 2.5.2). Motif enrichment analysis was done using HOMER [33] at default parameters. Range of motif widths was set to 4 and 20 as the minimum motif width and maximum motif width, respectively.
ChIP-PCR assay was carried out using the SimpleChIP® Enzymatic Chromatin IP kit (Magnetic Beads) (Cell Signaling Technology, Danvers, MA, USA) by following the manufacturer’s procedure. Briefly, the KYSE170 cells were seeded in 15 cm dishes until they grew to more than 90% of confluence. The full cells were fixed with 1% formaldehyde (16% formaldehyde, methanol-free) (Cell Signaling Technology, Danvers, MA, USA) for 10 min at room temperature (RT), stopped cross-linking with glycine for 5 min at RT, washed twice with ice-cold PBS containing protease inhibitor, added 2 mL ice-cold PBS, scraped off the cells with a scraper and finally centrifuged at 2000× g for 5 min at 4 °C to collect cell precipitation. The prepared nuclei were digested into 150–1000 bp chromatin DNA fragments by nuclease and sonication, and then their concentration was determined. Immunoprecipitation was performed with 5 μg PURα antibody (Abcam, Cambridge, MA, USA, Cat#ab125200) and corresponding rabbit anti-Ig G antibody (from the kit), respectively. The immunoprecipitates were incubated with protein G magnetic beads, and the antibody-protein G magnetic bead complex was collected for subsequent elution and reverse cross-linking. Five microliters of initial chromatin DNA fragment lysate were used as an input control. Finally, 2 μL purified DNA was used as template for PCR and qRT-PCR verification. The primer design is shown in Table 2. The final raw data of ChIP-qPCR was also performed by the 2−∆∆Ct calculation method [26].

2.4. Western Blot Analysis

Cell lysates were collected by RIPA buffer (CWBIO, Beijing, China) with a protease inhibitor. Then, the lysates were centrifuged at 15,000× g for 15 min at 4 °C after sonicating for 30 s on ice. Protein concentration was determined by BCA (Thermo, Waltham, MA, USA) protein assay. Proteins were separated on 10% SDS-PAGE and transferred to a polyvinylidene fluoride (PVDF) membrane. The membrane with protein bands was sealed with 5% skim milk (Becton, Dickinson and Company, Franklin Lakes, NJ, USA) for 1 h at RT, and incubated with diluted antibodies overnight at 4 °C. The membrane was incubated with the corresponding secondary antibody for 1 h at RT after washing with TBST three times. Finally, the membrane was added to chemiluminescence chromogenic solution (Biokits, Barcelona, Spain) after washing 3 times with TBST and was measured by exposure imaging analysis in an ImageQuant LAS4000 chemiluminescence imaging analyser (GE Healthcare Life Sciences, Pittsburgh, PA, USA). The information and dilution multiples of the antibodies are listed in Table 3.

2.5. Plasmid Construction

The pCMV6-Myc-DDK-AC control plasmid and pCMV6-PURα (Myc-DDK-tagged) plasmid were purchased from OriGene (Rockville, MD, USA). The pCMV6-PURα-NLS vector was constructed including the coding sequence (CDS) and the C-terminus of the PURA gene containing 3× Flag and 3× nuclear localization signal (NLS) sequences (Figure S1).
Construction of pCMV6-ATF4: the CDS regions of the ATF4 gene (accession numbers: 468) were obtained from NCBI. The corresponding CDS regions of ATF4 were amplified by employing the whole genome of KYSE170 cells as the template, a 2× GoldStar Best MasterMix (Dye) kit (CWBIO, Beijing, China) and primers. A universal DNA Purification kit (Tiangen, Beijing, China) was used to purify amplified or digested DNA products. In total, 1 μg purified DNA products were double-digested by 1 μL enzyme Xhol and HindIII (New England Biolabs, Ipswich, MA, USA) in 50 μL system at 37 °C. Then, these digested products further were purified and measured. After purification, a Quick LigationTM kit (New England Biolabs, Ipswich, MA, USA) was used to ligate the fragments with linearized vectors for 5 min at 25 °C. The ligated DNA products were transformed using DH5α competent cells (CWBIO, Beijing, China) and the monoclonal clones were picked out and sequenced.
Construction of PCK2 promoter truncation: the PCK2 promoter region was the sequence between the upstream 2000 bp and downstream 5’ noncoding regions of the transcriptional start site (TSS) of the PCK2 gene (accession numbers: 5106) from the UCSC Genome Browser website. The three truncated sequences were divided into the regions of 1727 bp (−1500/+227), 1060 bp (−953/+107) and 328 bp (−221/+107) as necessary. Primers were designed at both ends of the truncated regions (Table 4). The corresponding truncated regions of the PCK2 promoter were also amplified by using the whole genome of KYSE170 cells as the template, a 2× GoldStar Best MasterMix (Dye) kit (CWBIO, Beijing, China) and these corresponding truncated primers. Utilizing same reagent and methods above, a pGL3-Basic plasmid (Promega, Wisconsin, WI, USA) and truncated regions of the PCK2 promoter were constructed to the PCK2 promoter truncation.
Construction of the PCK2 promoter S1 site mutant: similarly, the reagent and methods mentioned above were adopted, and pGL3-Basic-PCK2-Luc-1500-227 was employed as the template. A PrimeSTAR® GXL DNA Polymerase kit (Takara, Kyoto, Japan), the purified product amplified by corresponding primers, and a Fasta-II rapid site-directed mutagenesis kit (Sbsgene, Beijing, China) were constructed for the PCK2 promoter S1 site mutant. All primers for the recombinant plasmids are listed in Table 4.

2.6. RNAi Interference

KYSE170 cells were seeded in a 6-well plate at a density of 4 × 10⁵ cells/well. Next, cells were transfected with siRNA (400 pmol/well) via Lipofectamine 2000 (Invitrogen, Carlsbad, CA, USA) and Opti-MEM medium (Gibco/BRL, Grand Island, NY, USA) when cells grew for 18-24 h and the convergence degree of cells was 40–50%. After 6 h of transfection, the same volume of RPMI 1640 medium with 20% FBS was added to every well. The sequences of siRNA-PURα (GenePharma, Shanghai, China) are listed in Table 5.

2.7. Transfection and Luciferase Assay

Common transfection. KYSE510 and KYSE170 cells were seeded in 6-well plates at a density of 8 × 10⁵ cells/well and 5 × 10⁵ cells/well, respectively. Then, the cells were transfected with plasmid (2 μg cell/well) via Lipofectamine 3000 (Invitrogen, Carlsbad, CA, USA), P3000 (Invitrogen, Carlsbad, CA, USA) and Opti-MEM (Gibco/BRL, Grand Island, NY, USA) medium, when the cells had grown for 18-24 h and the confluence degree of the cells was 60–70%. After 6h of transfection, the same volume of RPMI 1640 medium with 20% FBS was added to every well.
Luciferase assay. KYSE170 cells were seeded in 24-well plates at a density of 9 × 10⁴ cells/well. Next, cells were commonly transfected with RL-TK (100 ng cell/well), pCMV6/pCMV6-PURα (400 ng cell/well) and pGL3-basic-PCK2-luc-truncation/mutant (100 ng cell/well). Fresh medium was placed on cells after 24 h transfection, and the cell lysates were collected after 48 h transfection. The fluorescence intensity was measured by a Dual-Luciferase® Reporter Assay System kit (Promega, Wisconsin, WI, USA) on a Turner chemiluminescence instrument (TurnerBioSystems, Sunnyvale, CA, USA).

2.8. Metabolic Phenotypes

Oxygen consumption rate (OCR) and extracellular acidification rate (ECAR) were detected with a Seahorse Bioscience Analyzer (Seahorse XFe96, Agilent, Santa Clara, CA, USA), cell culture medium XF RPMI Base Media (pH 7.4, 500 mL), cell culture plate (Seahorse XFe96 FluxPak mini, Agilent, Santa Clara, CA, USA), Seahorse XF Cell Mito Stress Test kit, Seahorse XF Glycolysis Stress Test kit, XF 1.0 m Glucose Solution (50 mL), XF 100 mM Pyruvate Solution (50 mL) and XF 200 mM Glutamine Solution (50 mL) according instructions. All products and instruments were purchased from Agilent (Santa Clara, CA, USA). On the first day, cells were seeded in a special 96-well plate at a density of 8 × 10³ cells/well with 80 μL culture medium per well and cultured overnight for at least 16 h. On the second day, the culture medium was changed to the corresponding ECAR/OCR experimental base medium (ECAR base medium: 2 mM glutamine, pH 7.35; OCR base medium: 10 mM glucose, 2 mM glutamine, 1 mM pyruvate, pH 7.4). For ECAR analysis, cells were detected every 3 min after continuous administration of 10 mM glucose and inhibitors (1 μM oligomycin and 50 mM 2-deoxyglucose). For OCR analysis, cells were detected every 3 min after continuous administration of (2 μM oligomycin, 2 μM MFCCP and 0.5 μM rotenone/antimycin A). A BCA protein assay was employed to standardize the metabolic rates to the number of cells.

2.9. Statistical Analysis

The specific binding peaks of the PURα sample were obtained and calculated by MACS (version 1.4) software [32], taking the input sample as the background. The further screening criteria of differentially expressed genes (DEGs) of ChIP-seq is logFC ≥ 1 or ≤ −1, p ≤ 0.01, FDR ≤ 1.5% and that of RNA-seq is logFC ≥ 0.5 or ≤−0.5, p ≤ 0.01, FDR ≤ 1.5%. The functions of DEGs were analyzed by Gene Ontology (GO, http://www.geneontology.org/) annotation and gene set enrichment analysis (GSEA, https://www.gsea-msigdb.org/gsea) [34,35]. The KEGG pathway analyses for the DEGs and overlapping genes were performed by KORAS 3.0 [36] (http://kobas.cbi.pku.edu.cn/kobas3/genelist/). Heatmaps for metabolic signatures were created in R using a pheatmap package (https://cran.r-project.org/web/packages/pheatmap/index.html). Peak visualizations of ChIP-seq for candidate genes were analyzed and magnified by IGV software [37,38].
The experimental data were analyzed and plotted by GraphPad Prism 8.0 (San Diego, CA, USA) and calculated as means ± SD. Significant differences between the experimental group and the control group were determined by Student’s t test. The figures are shown as follows: *** p < 0.001, ** p < 0.01, * p < 0.05, ns p > 0.05. P-values < 0.05 were considered to be significant.

3. Results

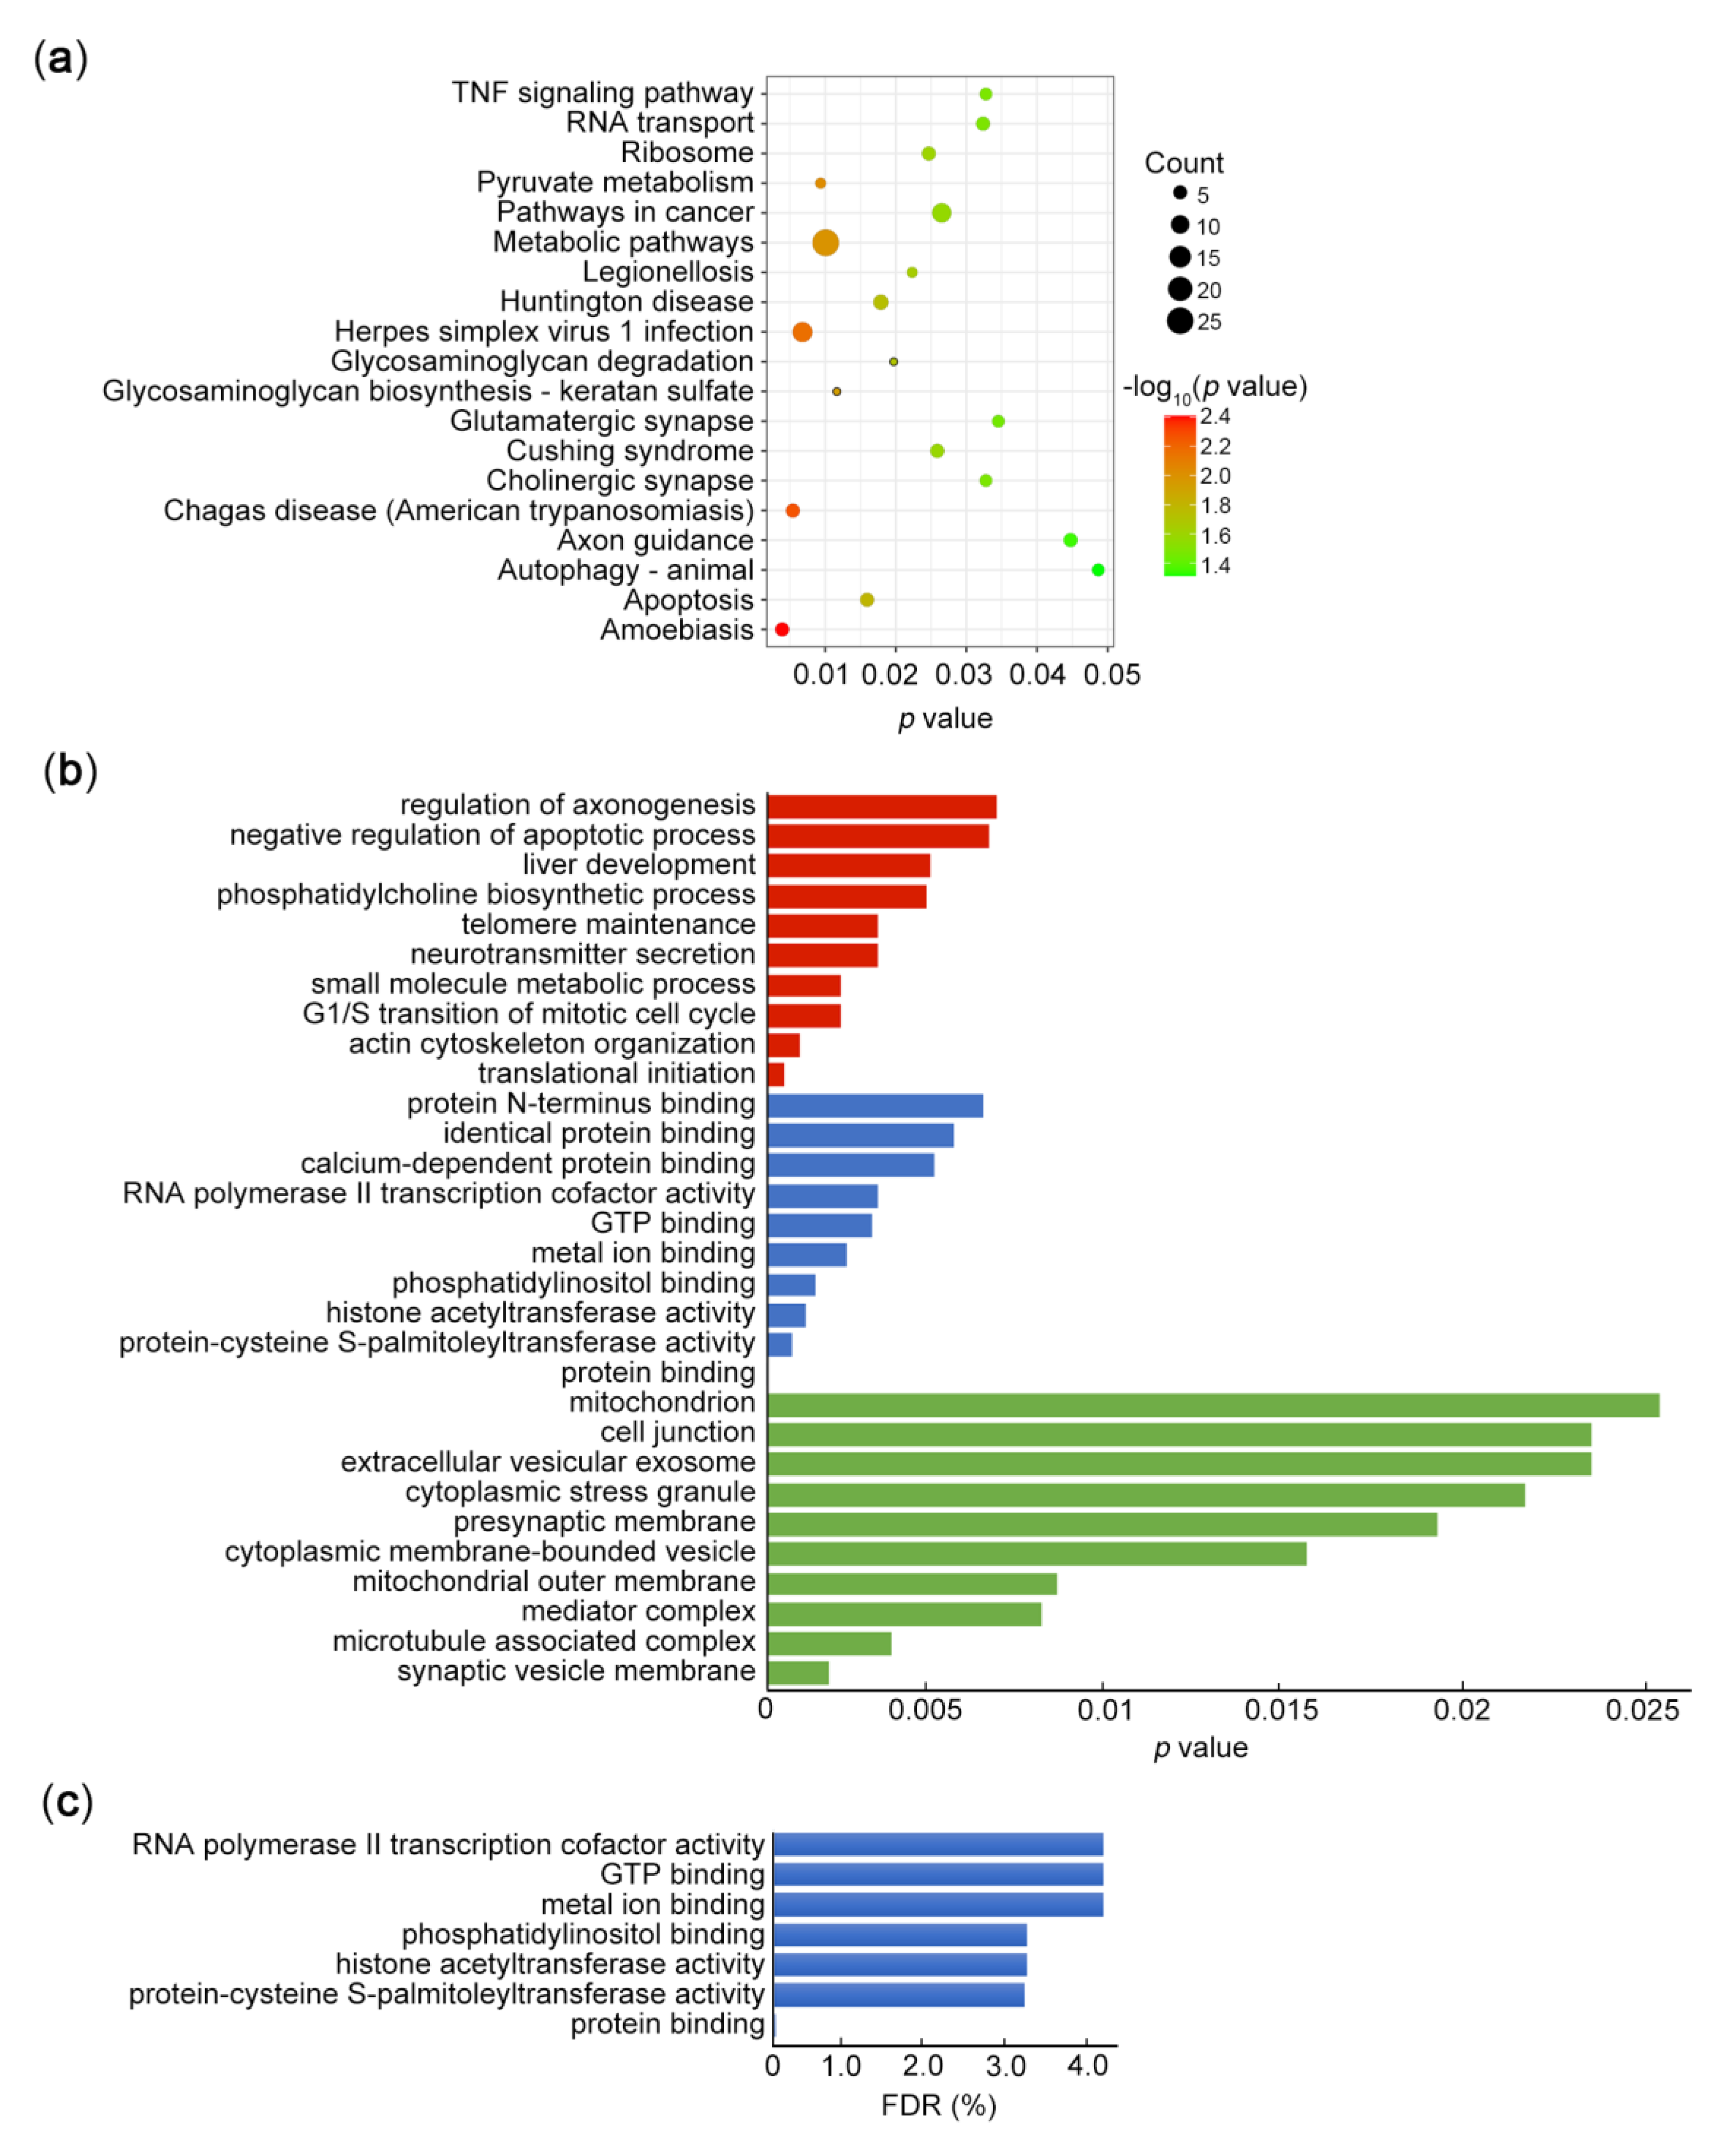
3.1. Motif and Function Analysis of ChIP-seq

As a multifunctional RNA and DNA binding protein, PURα not only regulates DNA replication and transcription but also plays an important role in binding with RNA [39,40,41]. To investigate the features of PURα binding motifs, we performed a ChIP-seq analysis in KYSE510 cells, which yielded a total of 56974 peaks and 2353 peak-associated genes were detected. Among the total peaks, a marked enrichment for introns and exons is shown in a pie chart (Figure 1a). Next, we identified the top 10 motif elements of PURα through motif scan analysis (Figure 1b), which indicated that PURα can bind to several new motifs, such as “TA”, “TC” and “TTN”, apart from the reported “GA”, “GC” and “GGN” [42,43,44].
Moreover, GO analyses were performed to investigate the biological processes and functions associated with PURα. Interestingly, KEGG pathway analysis showed a marked enrichment of metabolic pathways, herpes simplex virus 1 infection and amoebiasis (Figure 2a). The top 10 enriched biological process (BP), cellular component (CC) and molecular function (MF) terms are listed in Figure 2b. The GO analysis demonstrated that PURα was correlated with translational initiation, protein binding and synaptic vesicle membrane, implying multiple functions of PURα in biological processes. We further carried out FDR correction for the pathway and functional results enriched by KEGG and GO analysis, respectively. In the KEGG analysis, we found that the FDR values of the pathways with p < 0.05 were close to 1 (not shown), suggesting that these enrichment pathways were not significant. Similarly, among the GO function enrichment of BP, CC and MF, except for BP type, the other two types have higher FDR values (Figure 2c). These results corrected by FDR may more strictly reflect the gene functions of PURα binding.

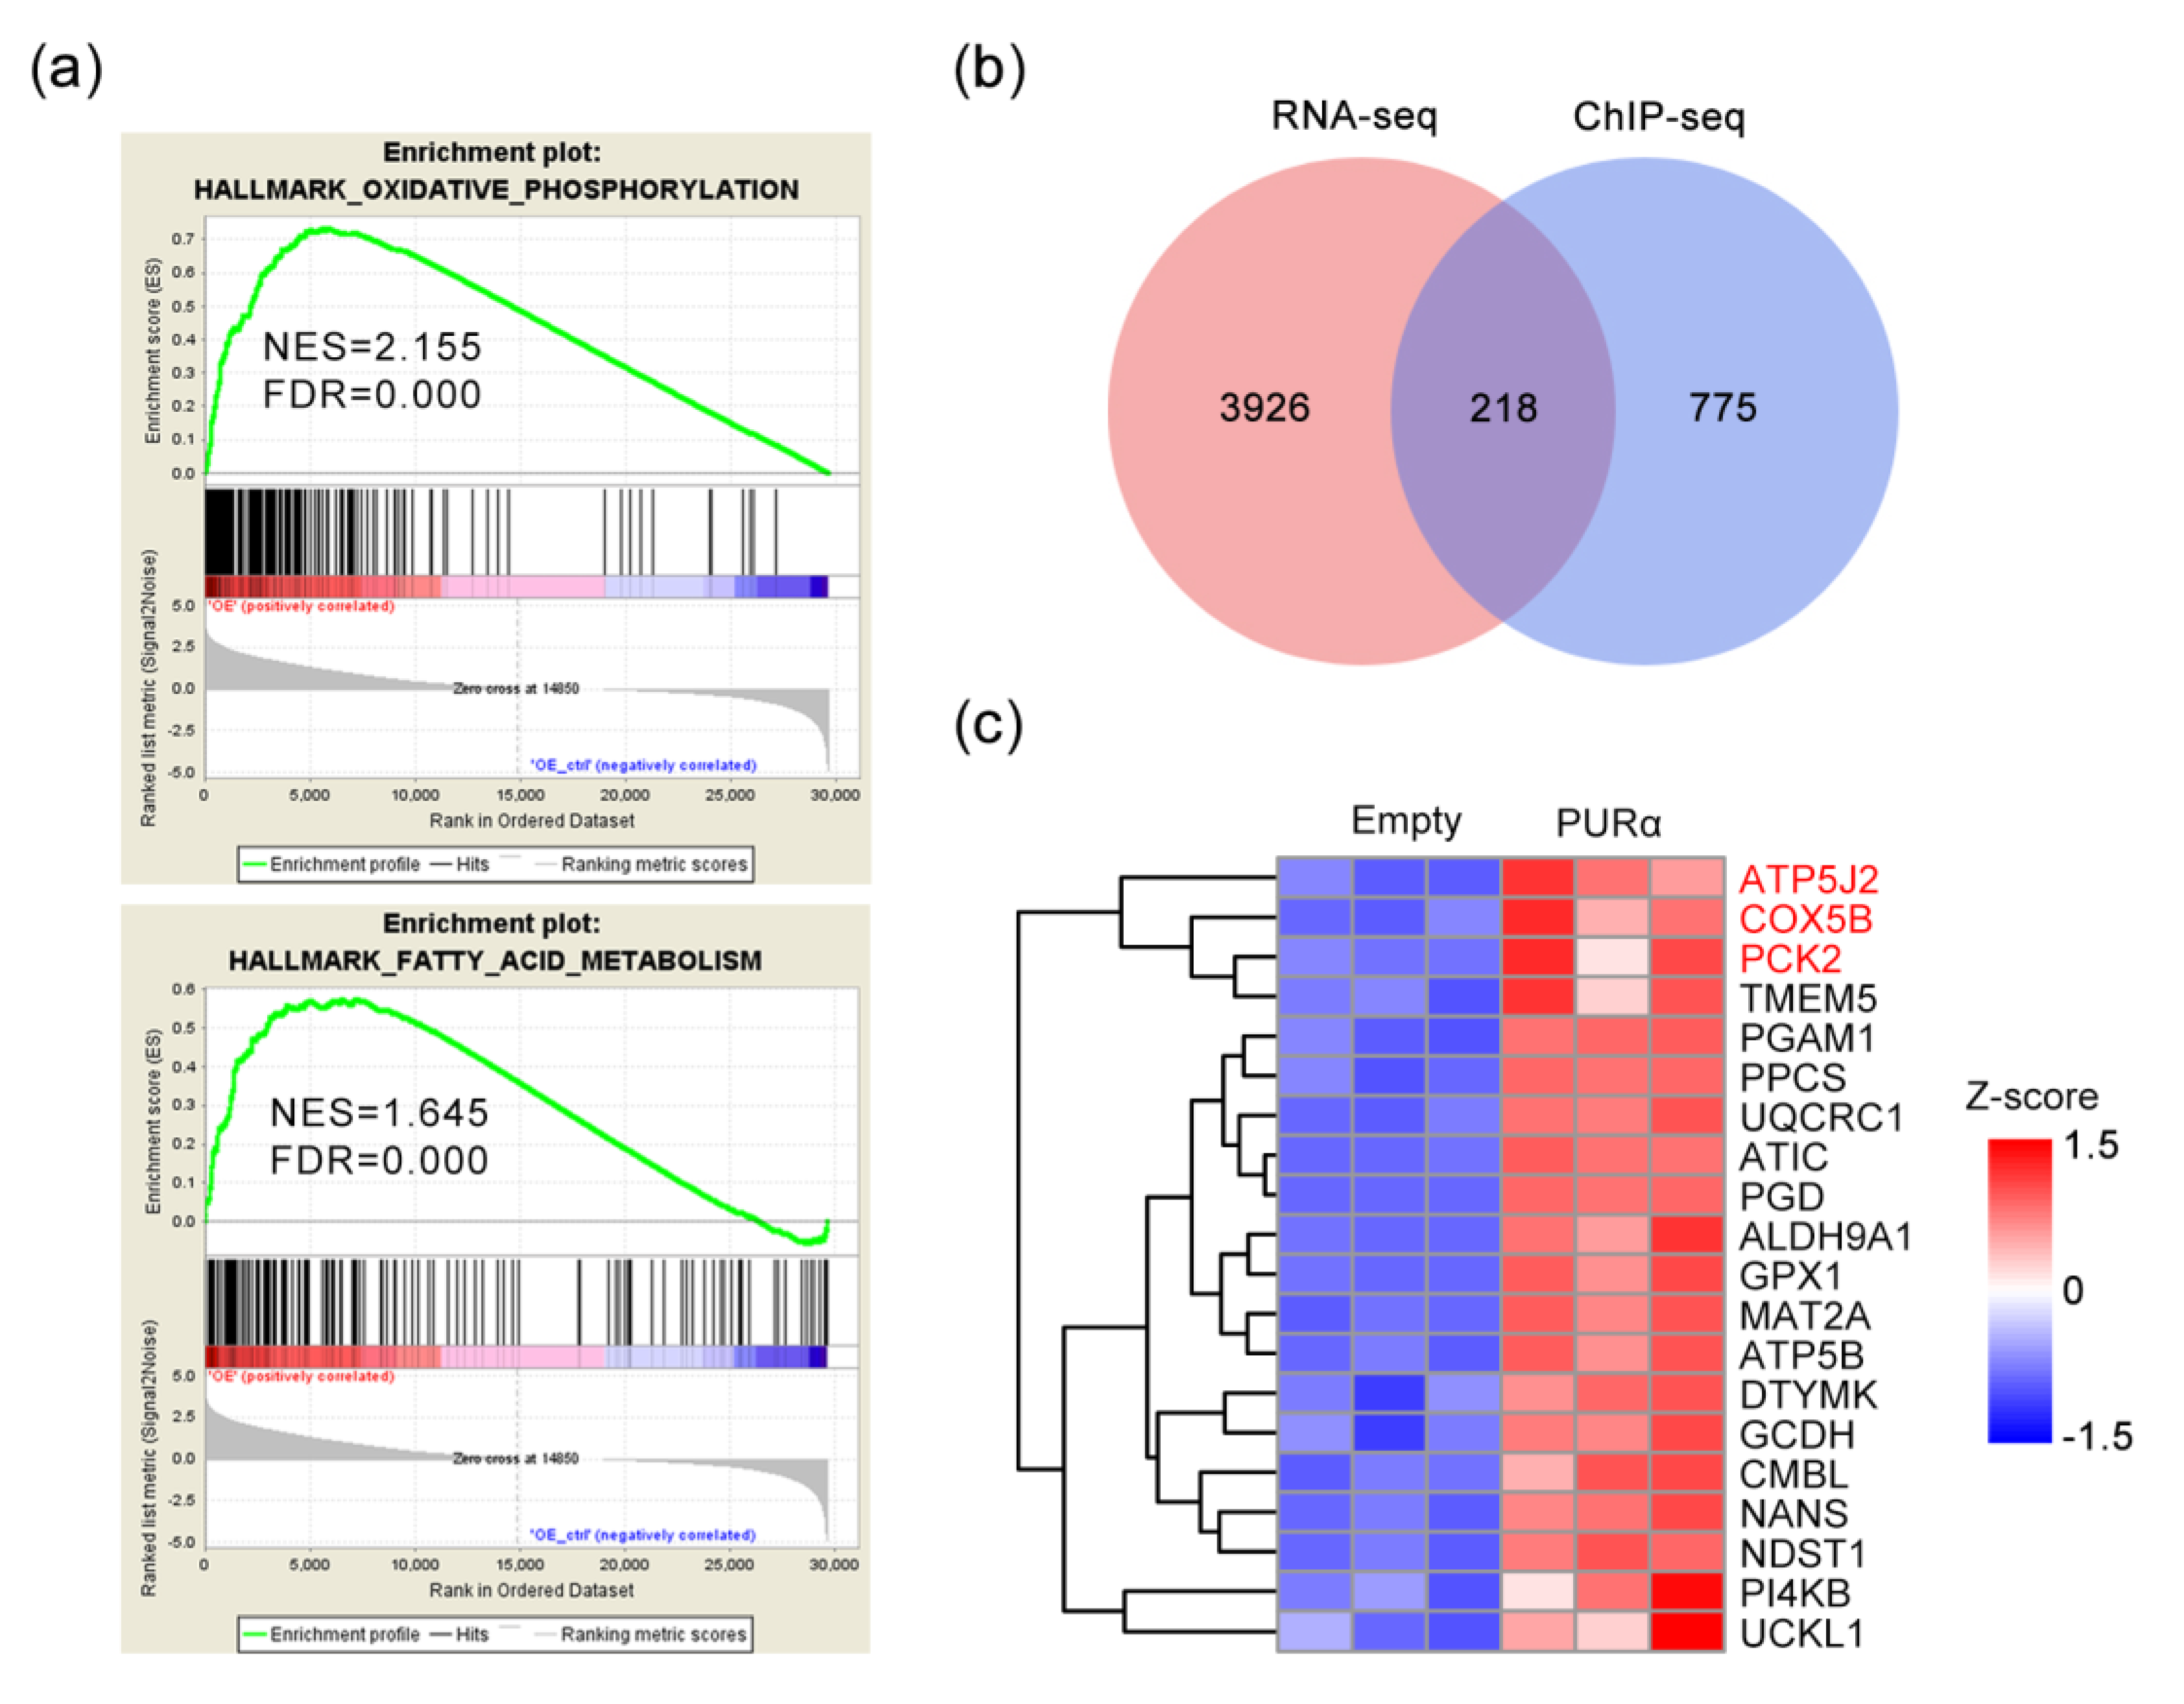
3.2. Screening of Potential Candidate Regulated Genes for PURα

Previous research has determined that PURα promotes the invasion and migration of ESCC cells via epithelial-mesenchymal transition (EMT) [9]. To investigate other functions of PURα in ESCC cells, we analyzed the RNA-seq data via GSEA. As expected, a significant increase in metabolic pathways, including oxidative phosphorylation and fatty acid metabolism genes, was observed after PURα overexpression (Figure 3a). These results suggest that PURα may play an important role in metabolism.
To further explore whether PURα regulates metabolic genes, we analyzed RNA-seq and ChIP-seq data to identify optimal candidates. First, we evaluated the overlap of the pre-processed DEGs between RNA-seq and ChIP-seq, as shown in the Venn diagram. There were 218 overlapping genes (Figure 3b). Next, gene enrichment analysis demonstrated a significant increase in metabolic pathways, including fatty acid degradation, adipocytokine signaling pathway, oxidative phosphorylation and glycolysis/gluconeogenesis genes, upon PURα overexpression (Figure 3c). The top 3 genes were ATP5J2, COX5B and PCK2.

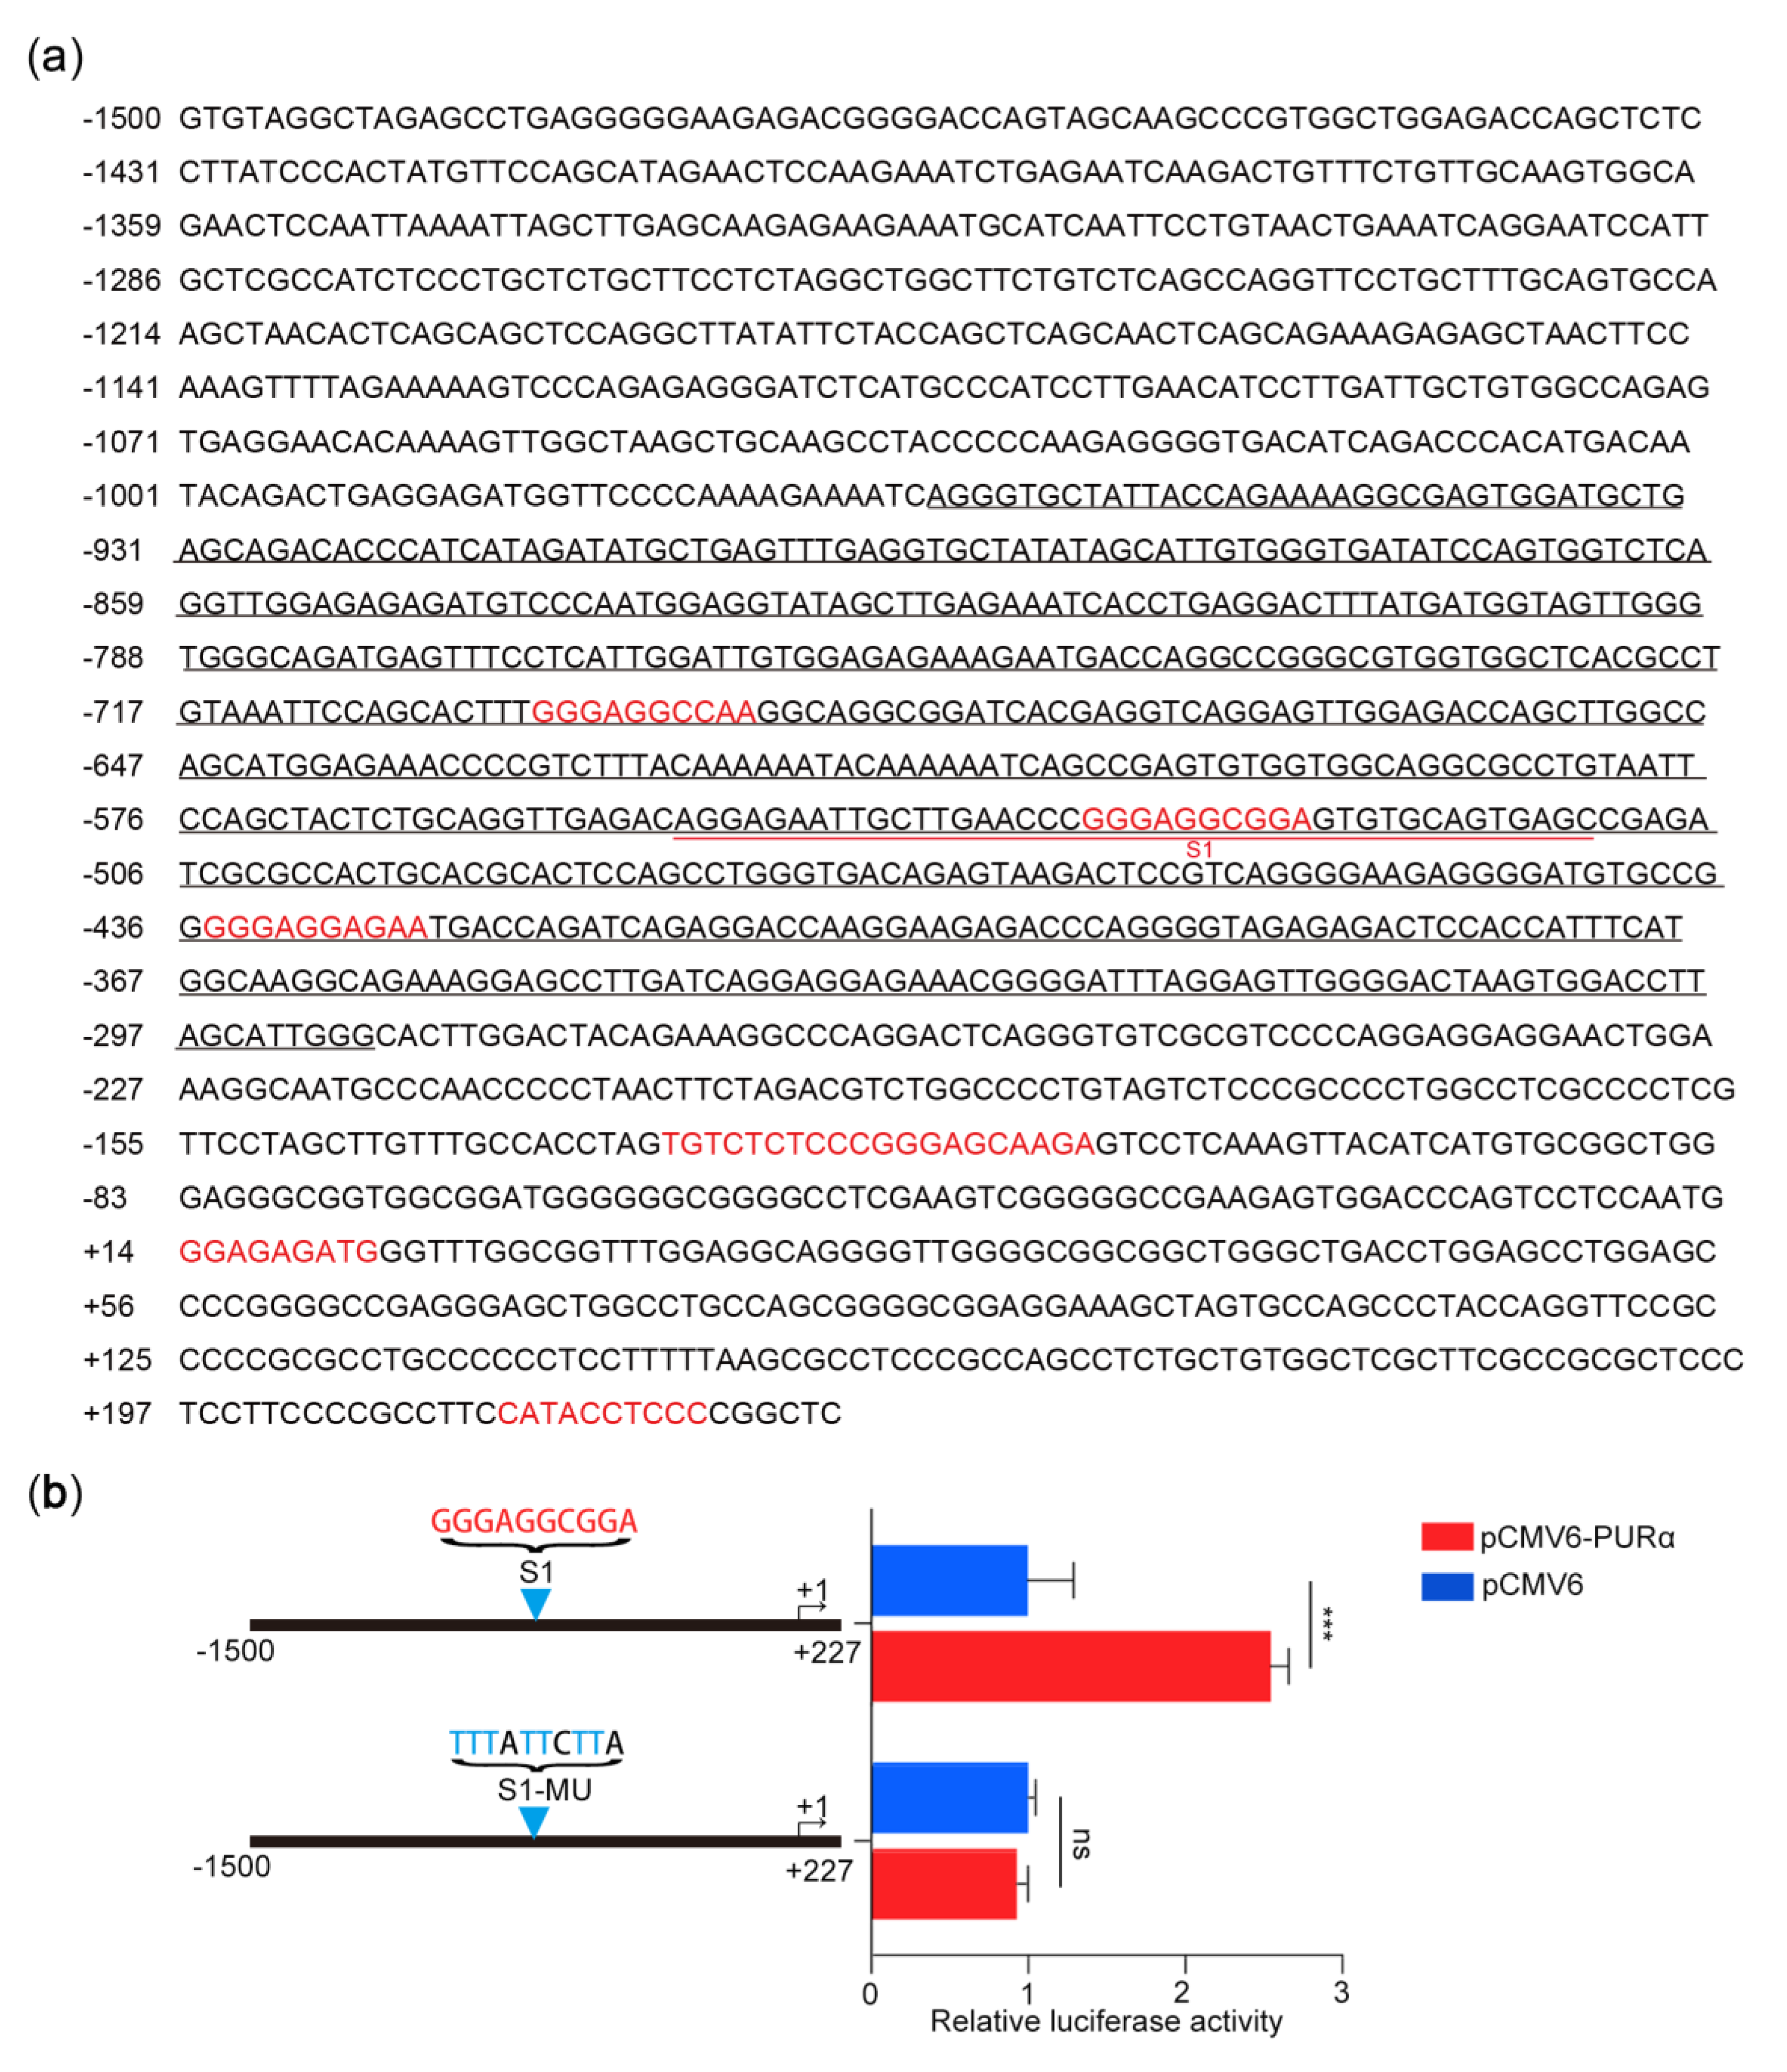
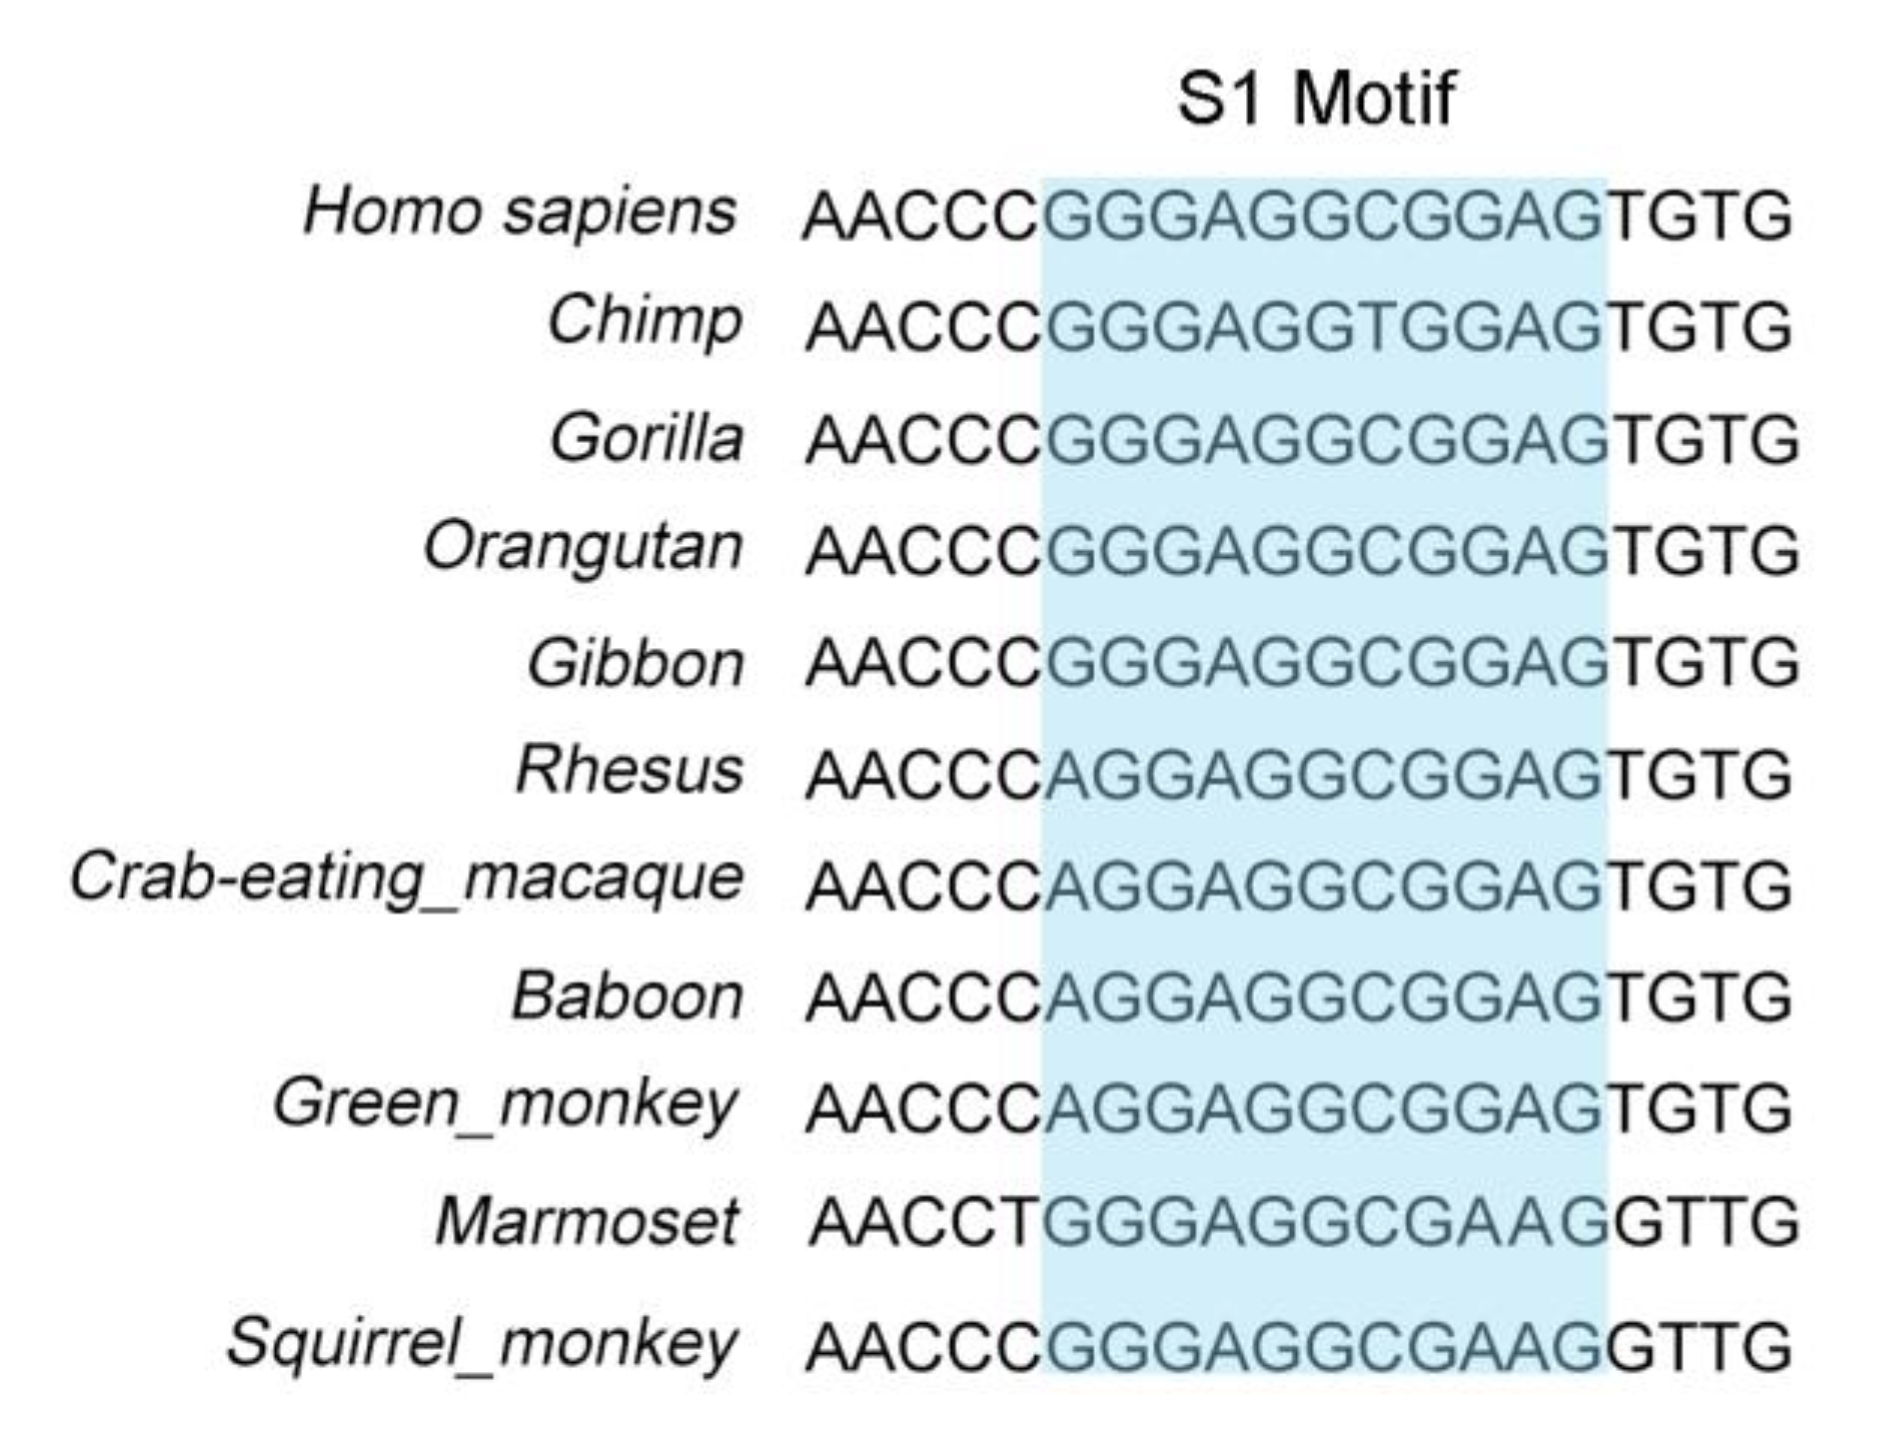
3.3. Transcriptional Activation of thePCK2 Promoter Depends on the GGN Motif bound by PURα

Considering that PCK2 plays an important rate-limiting role in gluconeogenesis and participates in the synthesis of glycerol, amino acids and nucleotides and cataplerosis in the tricarboxylic acid (TCA) cycle [45,46], we focused on the regulation of PCK2 by PURα. To investigate whether PURα binds to the promoter region of the PCK2 gene, we downloaded the sequence of the PCK2 promoter region (−1500/+227) from the UCSC Genome Browser and predicted whether there were PURα binding sites in the promoter region of PCK2 gene through ALGGEN-PROMO [47]. Indeed, there were seven predicted binding sites in this region (Figure 4a). To further determine which predicted binding sites of PURα may play a role, the PURα binding peak in the promoter region of the PCK2 gene from ChIP-seq was magnified and analysed by IGV. There were three predicted binding sites of PURα in the binding peak region (Chr14:24093172-24093825), which were GGGAGGCCAA, GGGAGGCGGA and GGGAGGAGAA, respectively (Figure 4a). To elucidate the exact binding sequence, we enlarged the visual peak region and obtained the specific sequence of the highest peak, which was AGGAGAATTGCTTGAACCCGGGAGGCGGAGTGTGCAGTGAGC (Figure 5). In addition, this specific sequence contained the S1 (GGGAGGCGGA) motif. These results suggested that PURα may be involved in the transcriptional regulation of the PCK2 gene.
To better determine whether the S1 motif is a specific binding site for PURα, we designed the mutant S1-MU as a luciferase reporter construct for verification. Under the condition of exogenous overexpression of pCMV6/pCMV6-PURα, we measured the luciferase activity of the mutant S1-MU construct in KYSE170 cells. Compared with the control group, the S1-MU group had almost no activity, indicating that PURα binds to the GGGAGGCGGA motif (-534, -525) of the PCK2 promoter (Figure 4b).
Next, to confirm the conservation of the regulation of the transcriptional activation of PCK2 by PURα, we compared and analyzed the S1 motif of the PCK2 promoter in different primates. We found that compared with the S1 locus upstream of the human PCK2 gene, most primates had the same S1 locus, while the minority had some differences in the sequence, and the overall motif was highly similar (Figure 6). This result indicates that the transcriptional regulation of PCK2 by PURα may be ubiquitous in primates.

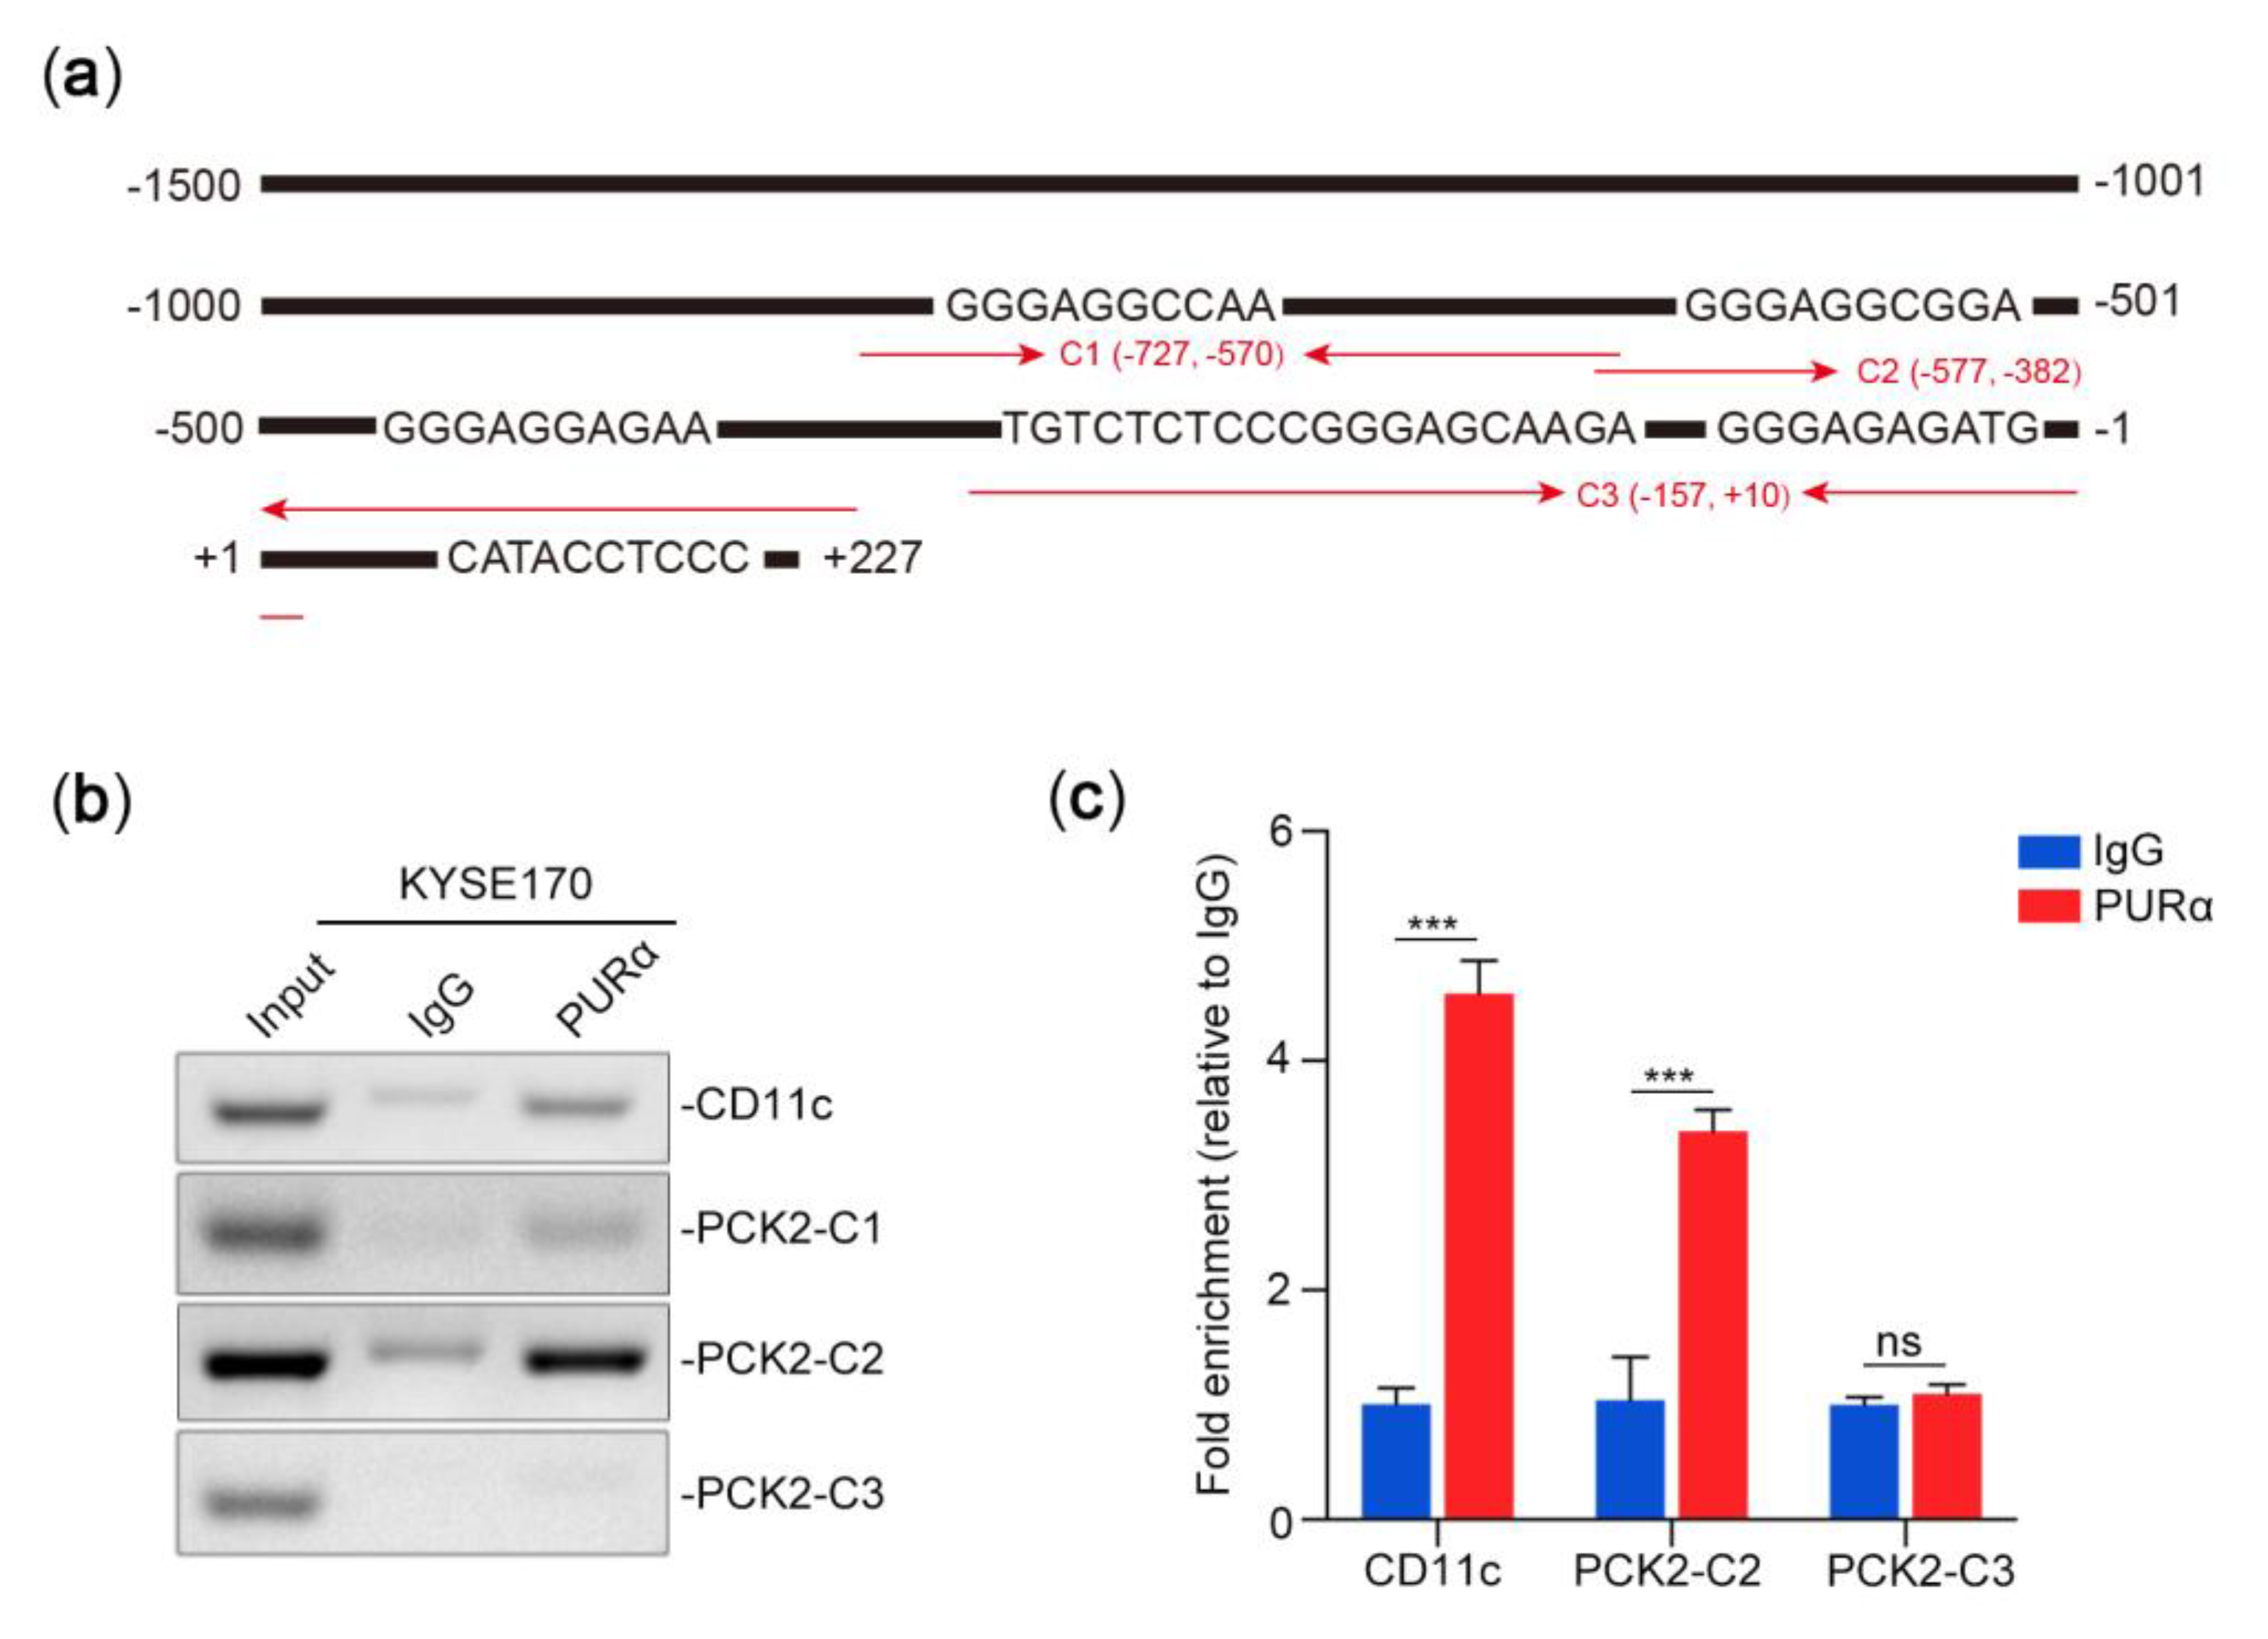
3.4. Identification of the Core Binding Region of the PCK2 Gene for PURα

To examine the core binding region of the PCK2 gene for PURα, the PCK2 promoter region was truncated into three fragments (−1500/+227; 953/+107; and −221/+107). These fragments were engineered as truncated luciferase reporter constructs (Figure 7a). Under the condition of exogenous overexpression of pCMV6/pCMV6-PURα, we detected luciferase activity after transient transfection of these truncated constructs into KYSE170 cells. Additionally, we engineered a pCMV6-ATF4 [24] construct as a positive control for the luciferase assay. Clearly, compared with the pCMV6 group, the positive control and negative PCK2 (−221/+107) groups displayed almost 16-fold higher and no relative luciferase activity, respectively (Figure 7b). Although the relative luciferase activity of PCK2 (−1500/+227) was considerably higher than that of PCK2 (−953/+107) under the condition of exogenous overexpression of PURα, the overall trend of luciferase activity was the same (Figure 7b). These results demonstrated that PURα may bind to the upstream region (−953/−221) of TSS in the PCK2 gene.
Based on PURα binding to the S1 motif of the upstream region (-953/-221) of TSS in the PCK2 gene, we further examined whether PURα binds directly to this motif. According to the predicted sites and truncation experiments, we selected C1, C2 and C3 regions for ChIP-PCR/qPCR verification. As shown in Figure 8a, PURα can not only directly bind to the CD11c promoter as a positive control [48] but can also bind to the C1 and C2 regions of the PCK2 promoter. Since the binding band between PURα and the C2 region was stronger than that between PURα and C1, we selected the C2 region and the CD11c promoter for further qPCR verification (Figure 8b,c). The luciferase assay of truncated constructs and the ChIP-PCR/qPCR results further confirmed that the core promoter region of the PCK2 gene is the upstream -727/-382 region of TSS.

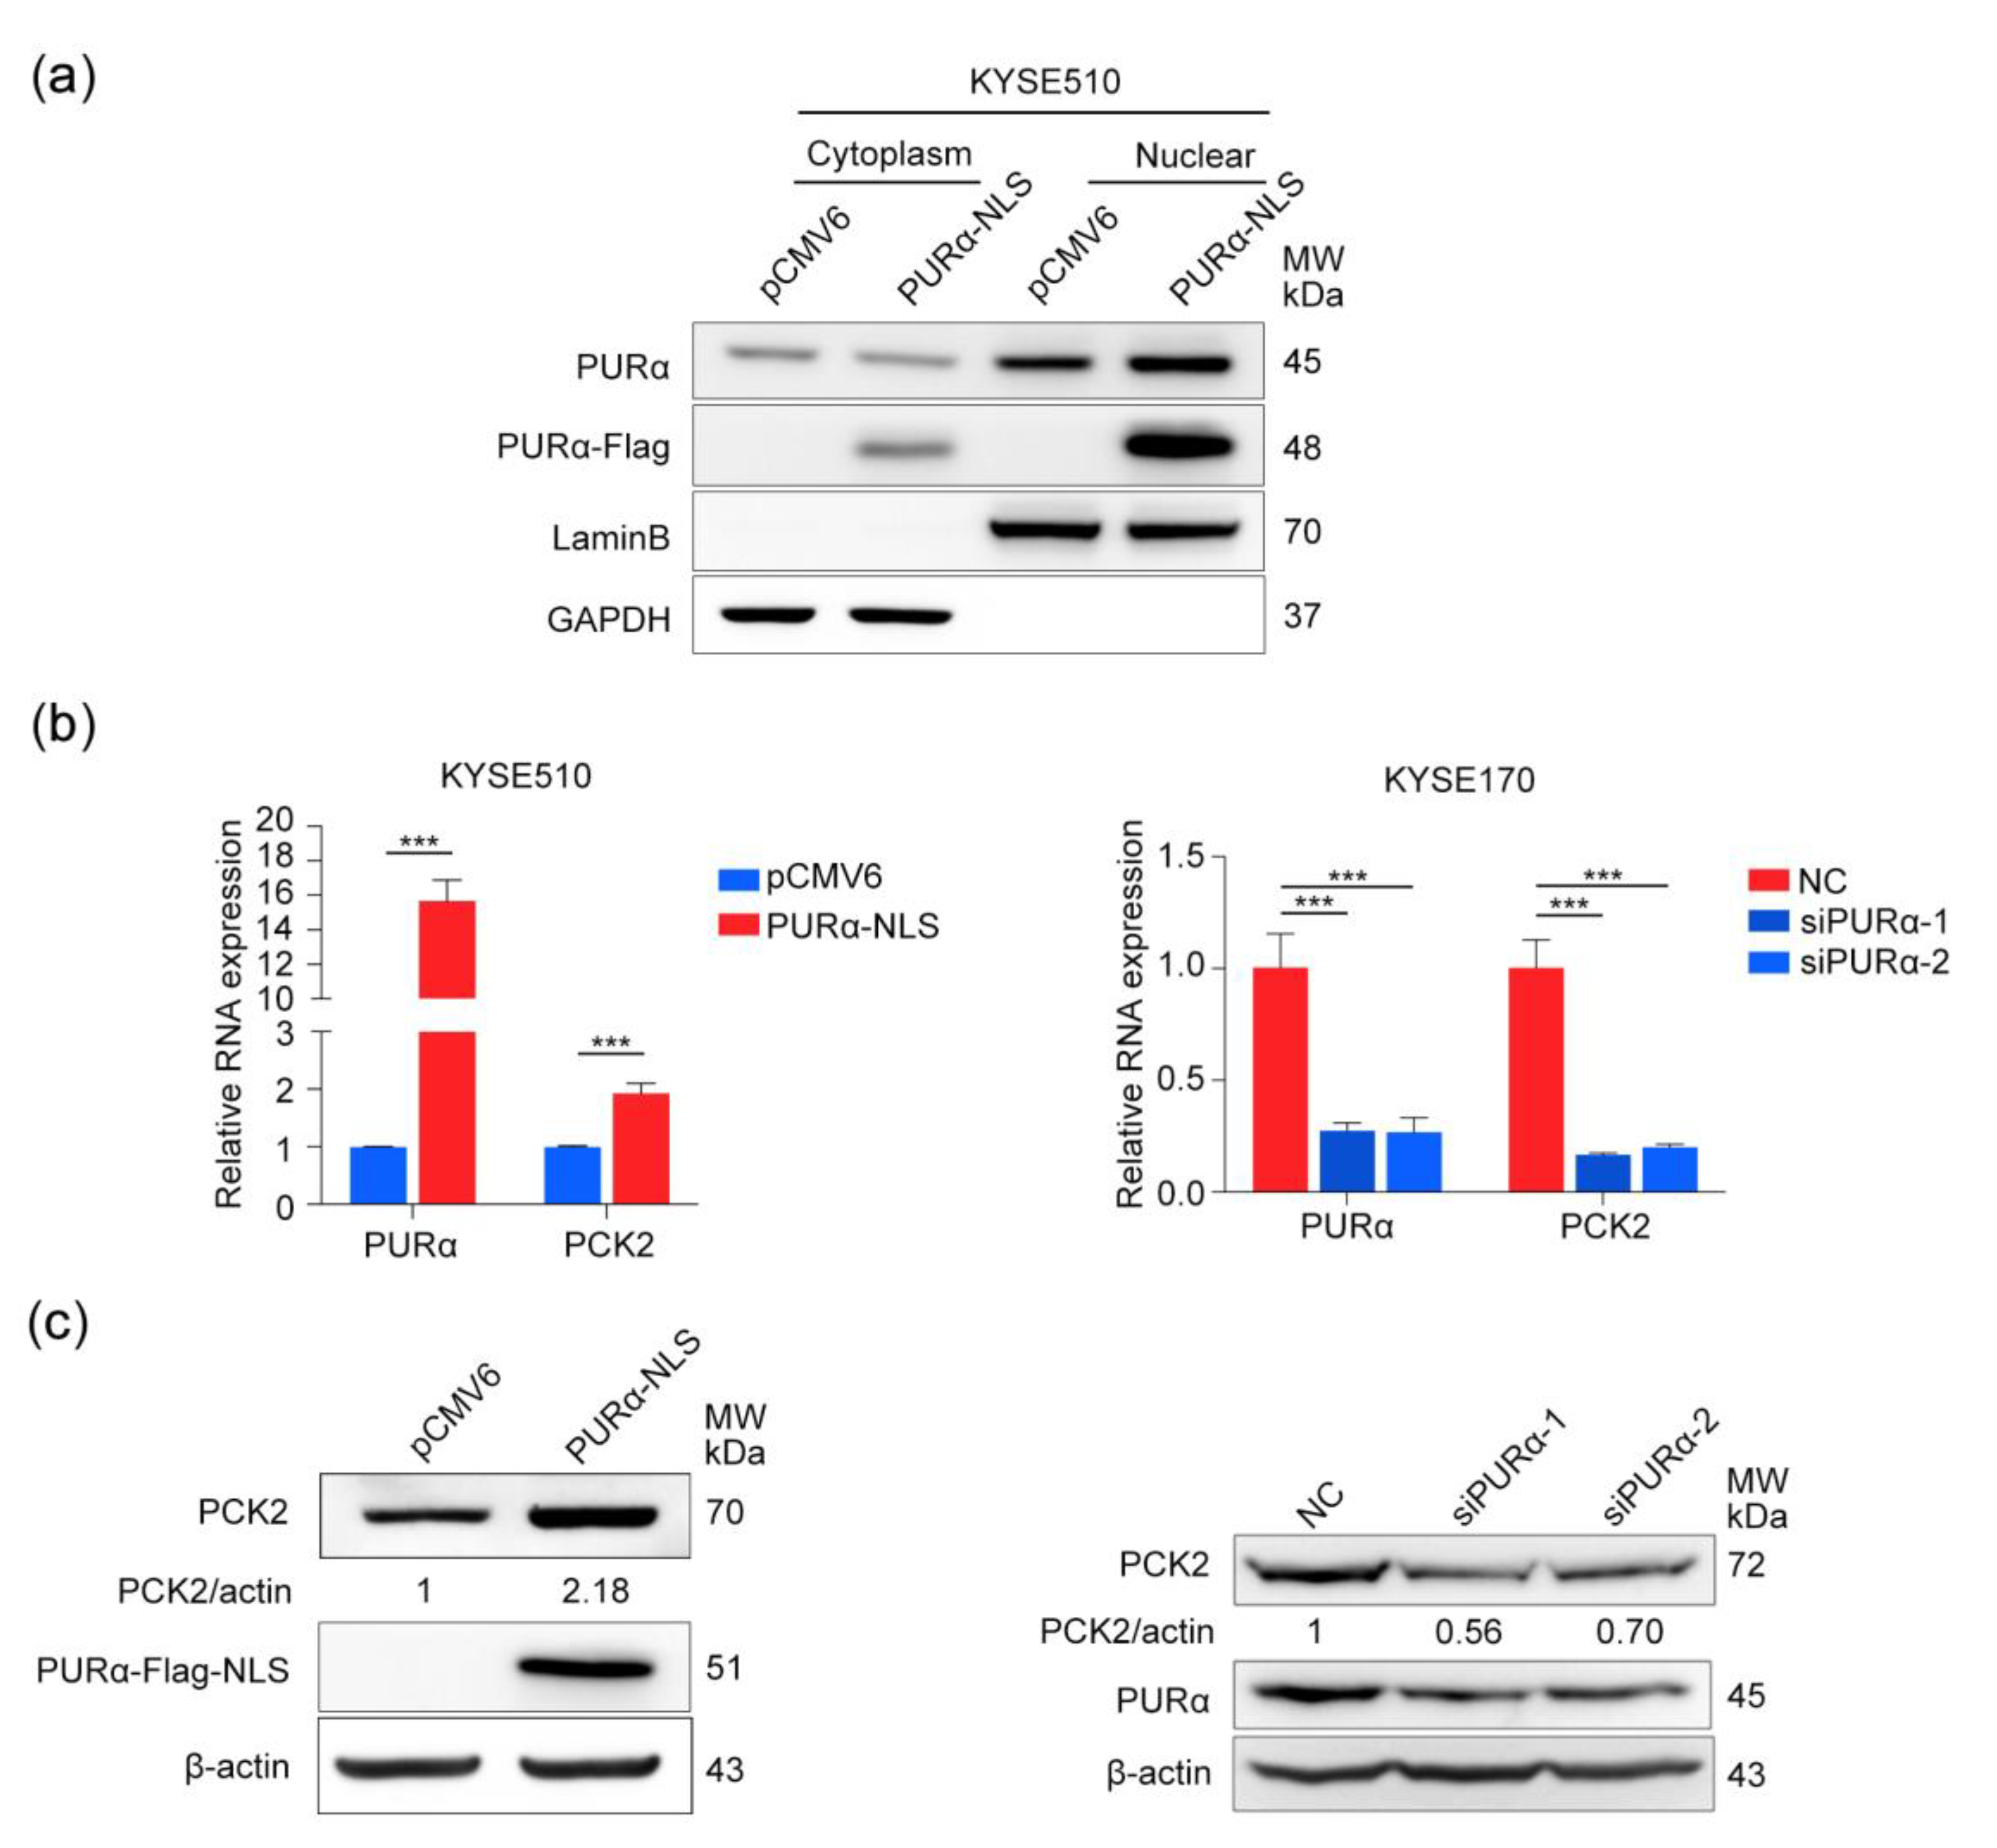
3.5. PURα Activates the Transcription and Expression of PCK2

To determine whether the transcriptional activation of PCK2 by PURα can affect the expression and enzyme activity of PCK2, qRT-PCR and Western blot analyses were performed. Overexpression of the common pCMV6-PURα vector did not change the protein and mRNA levels of PCK2 in KYSE510 cells (Figure S2). Because PURα is a cytoplasmic/nuclear protein, considering that PURα acts as a transcription factor in the nucleus, we reconstructed another PURα vector only expressed in the nucleus, pCMV6-PURα-NLS. After the pCMV6-PURα-NLS vector was overexpressed in KYSE510 cells, PURα was determined to be overexpressed in the nucleus compared with the cytoplasm (Figure 9a). First, the mRNA levels of PCK2 in KYSE510 cells overexpressing pCMV6-PURα-NLS and KYSE170 cells knocked down for PURα were detected by qRT-PCR, and it was found that PURα could indeed promote the transcriptional activation of PCK2 (Figure 9b). Next, through Western blot analysis overexpression of PURα in KYSE510 cells could also promote the expression of PCK2. Similarly, the expression level of PCK2 decreased after knockdown of PURα in KYSE170 cells (Figure 9c). These findings confirmed that PURα can not only activate the transcription of PCK2 but can also promote its expression.

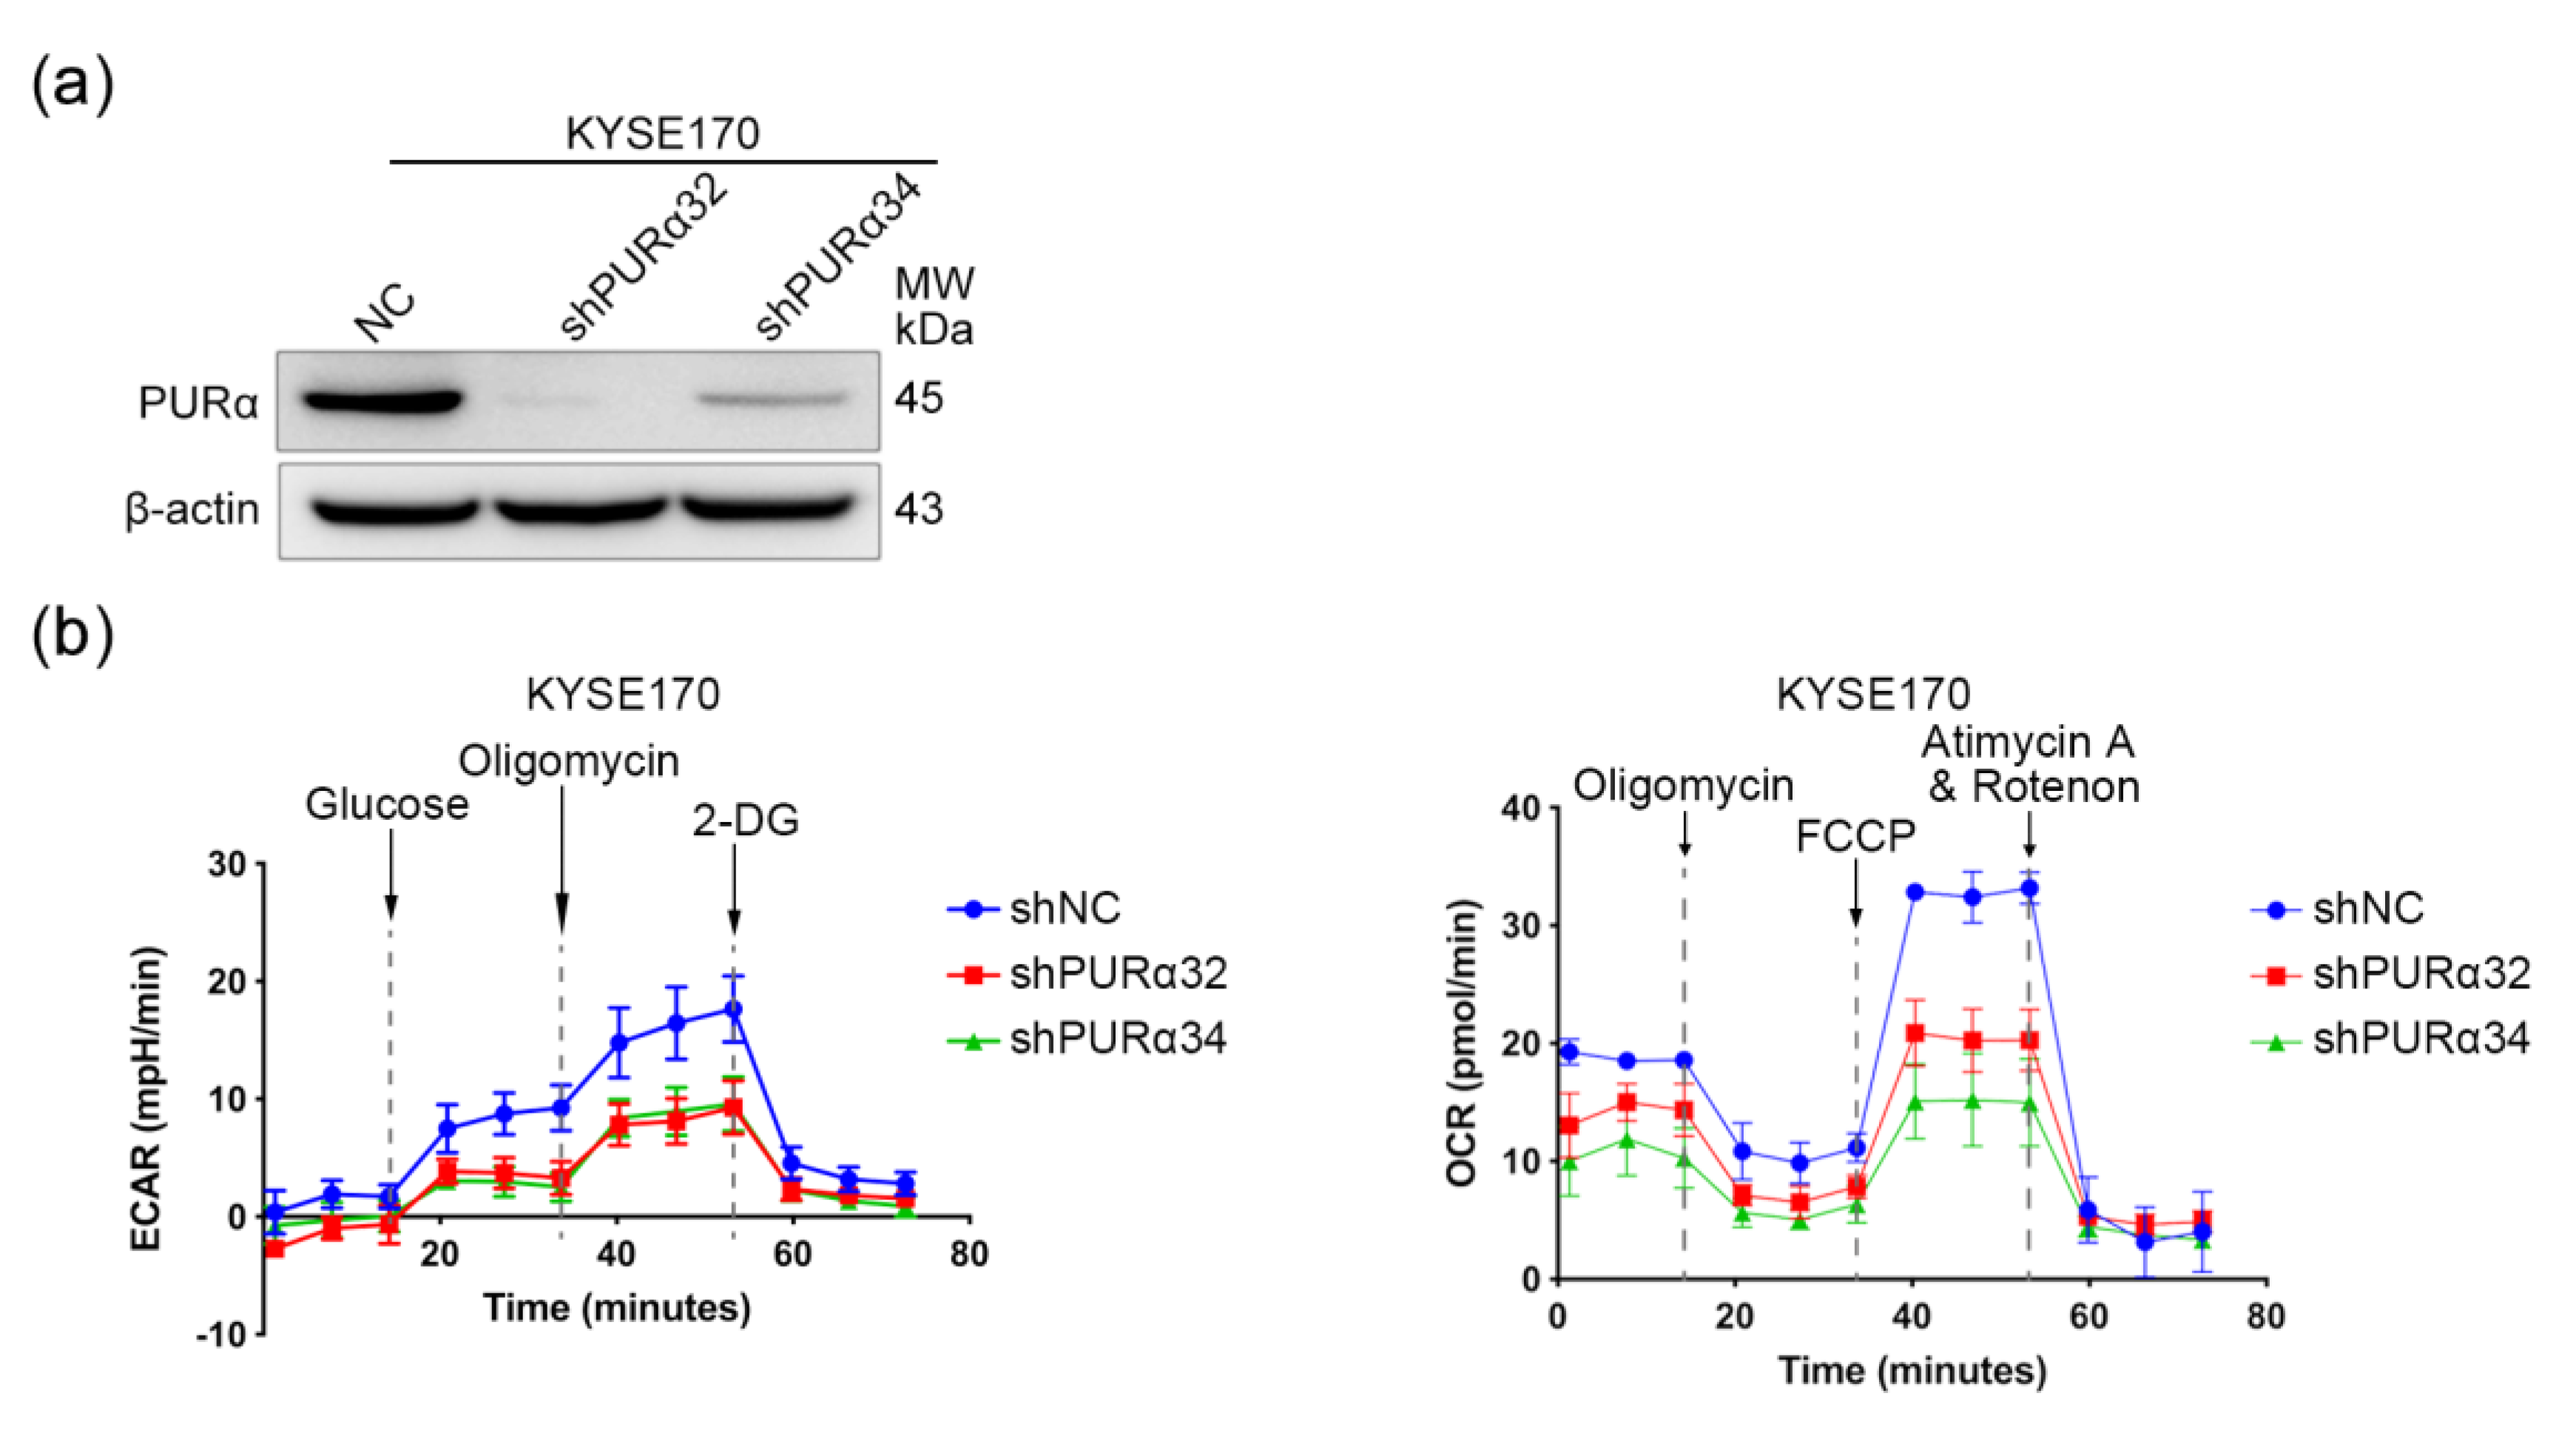
3.6. PURα Promotes the Mitochondrial Respiration and Glycolysis in ECSCs

To investigate whether the ESCC cells affected by PURα have metabolic phenotypic changes, KYSE170-shPURα32/34 cells were used to detect OCR and ECAR. As expected, when glucose was added, the ECAR in the KYSE170-shPURα32/34 groups was significantly lower than those in the control group, implying that knocking down PURα can reduce the basal glycolysis and maximum glycolytic capacity of KYSE170 cells (Figure 10b). Similarly, when FCCP, an uncoupling agent, was added to medium, the OCR in the KYSE170-shPURα32/34 groups was significantly lower than those in the control group, implying that knocking down PURα can reduce the maximal mitochondrial respiratory and spare respiratory capacity of KYSE170 cells (Figure 10b). Summarily, the results indicate that knocking down PURα can significantly reduce the mitochondrial respiration and glycolysis ability of KYSE170 cells.

4. Discussion

It has been observed that both PURα and heterogeneous nuclear ribonucleoprotein K (hnRNP-K) bind to the CD43 gene promoter and co-inhibit its transcriptional activity in the process of leukocyte differentiation [49,50]. In addition, PURα can also bind to the CD11cβ2 integrin gene promoter to induce its transcription and expression [48]. Furthermore, PURα promotes myogenesis by downregulating MHC transcription [8] and attenuates the transactivation of the smooth muscle actin gene in myofibroblasts [51]. These studies indicate that PURα plays a vital role in transcriptional regulation. A patient with a frame-shift deletion in the PURA gene not only has the classical PURα deficiency phenotype, but also has a significant hypoglycorrhachia. This phenotype overlaps with the clinical manifestations of glucose transporter type 1 (GLUT1) deficiency syndrome, suggesting that PURα may be involved in the regulation of GLUT1 or affect the function of glucose metabolism [52]. However, the relationship and mechanism between PURα and tumor metabolism have not been elucidated, and research on the regulation of metabolic genes by PURα has not been reported. Therefore, we first performed ChIP-seq analysis of KYSE510-input/PURα cells to identify the specific binding motifs, candidate genes and enriched functions of PURα. Next, we analyzed RNA-seq data via GSEA to determine the relationship between PURα and metabolism. Then, we validated the optimal candidate genes related to metabolism from the overlap of between RNA-seq and ChIP-seq data. We observed a metabolic gene, PCK2. Further IGV visual analysis showed that there was a PURα binding peak in the PCK2 promoter.
To investigate the transcriptional regulation of PCK2 by PURα, we first predicted the binding sites in the PCK2 promoter bound by PURα via ALGGEN-PROMO and UCSC. Then, mutant constructs of the PCK2 promoter were designed through predicted sites. Finally, the specific site S1 (GGGAGGCGGA) of the PURα binding PCK2 promoter was confirmed by luciferase assay. Moreover, ChIP-PCR/qPCR and the luciferase assay of the truncated PCK2 promoter that PURα directly bound to the core promoter region (−727/−382) of PCK2. PURα is a highly conserved protein, therefore, it is speculated that the transcriptional regulation of the PCK2 gene by PURα is conserved. To investigate this possibility the S1 motif of the PCK2 promoter in different primates was analyzed by searching the UCSC and NCBI databases. It was found that all the motifs of different species were highly similar, suggesting that the transcriptional regulation of PCK2 by PURα may be common in other primates.
In recent years, PCK2 has been abnormally expressed in a variety of cancers, such as liver cancer, colorectal cancer, lung cancer, melanoma and prostate cancer, which is closely related to the occurrence and development of cancer [53,54,55,56,57]. Sequence analysis of the PCK2 promoter region revealed that it contained several potential regulatory elements, including the SREBP, CREB, C/EBP, AP-1, AP-2 and SRY elements [58]. However, Stark et al. believed that PCK2 is a weaker molecule for rapid transcriptional regulation because of its mitochondrial location [59]. In contrast, cyclic AMP-dependent transcription factor (ATF4) enhances the transcriptional activity of PCK2 and activates its dependent pro-survival pathways under amino acid deprivation or endoplasmic reticulum stress by binding to the ATF/CRE site in the PCK2 promoter. PCK2 participates in the supportive adaptations of breast and cervical cancer cells to adapt to the stress state in the tumor environment [60]. In addition, hypoxia-inducible factor 1-α (HIF1-α) in breast cancer negatively regulates PCK2 at the transcriptional level causing breast cancer tumor-repopulating cells (TRCs) to grow in anoxic environments [61]. Therefore, although PCK2 is located in the mitochondria, it is still subject to rapid transcriptional regulation and subsequently participates in the process of tumorigenesis and development.
Since PURα can activate the transcription of PCK2, we hypothesized that PCK2 must perform its metabolic enzyme function in the form of protein. Therefore, the question arose of whether the transcriptional activation of PCK2 by PURα further affects its expression. Western blot analysis showed that PURα not only activated the transcription of PCK2 but also promoted its expression. Previous research has indicated that PURα promotes the invasion and migration of ESCC cells via EMT [9]. Additionally, EMT and metabolic reprogramming in various cancer cells is related. EMT-related transcription factors can not only promote EMT but also regulate metabolic genes in metabolic pathways. Conversely, crucial metabolic enzymes involved in metabolic reprogramming, such as glycolysis, mitochondrial metabolism, lipid metabolism and glutaminolysis, also activate EMT in cancer cells [62]. Overall, these findings indicate that PURα promotes EMT and the transcriptional activation of the PCK2 gene in ESCC cells, while PCK2 can participate in the metabolic reprogramming of cancer cells. Therefore, we hypothesized that PURα affects metabolic reprogramming and EMT in ESCC cells through transcriptional activation of PCK2. OCR and ECAR detection were employed to investigate the metabolic phenotypic changes of ESCC cells affected by PURα. Indeed, PURα promotes the mitochondrial respiration and glycolysis in ESCC.
In general, this study identified other new binding motifs and functions of PURα in ESCC cells. Meanwhile, our findings suggest that PURα regulates the transcription and expression of the metabolic enzyme PCK2 and the metabolism of ESCC cells. However, whether PURα can affect the metabolism and EMT of ESCC cells by the transcriptional regulation of PCK2 is not known and warrants further research.

5. Conclusions

In the present study, we discovered novel binding motifs of PURα on a genome-wide scale and its other functions, including metabolic pathway, translational initiation and protein binding. We identified the regulatory mechanism by which PURα activates the transcription and expression of PCK2 in ESCC cells. In addition, PURα can promote mitochondrial respiration and glycolysis in ESCC. Based on the stimulatory effect of PURα on EMT and the important role played by PCK2 in tumor metabolism, PURα and PCK2 may represent new therapeutic targets for ESCC.

Supplementary Materials

The following are available online at https://www.mdpi.com/2073-4425/11/11/1301/s1, Figure S1: The sequence of the pCMV6-PURα-NLS plasmid. Figure S2: The mRNA/protein level of PCK2 in KYSE510 cells of overexpressing pCMV6-PURα was not changed.

Author Contributions

Y.S. (Yan Sun), J.G. substantially contributed to the conception, X.Z. and Y.S. (Yulin Sun) the design; Y.S. (Yulin Sun), J.G., Z.J., Y.Z. contributed to the analysis and interpretation of the data; Y.S. (Yan Sun), J.G. drafted the manuscript; X.Z., Y.S. (Yan Sun) funding acquisition; X.Z. administrative support; and all authors have read and agreed to the published version of the manuscript, and agreed to be accountable for its contents.

Funding

The study was supported by the National Key R and D Programs (Nos. 2018YFC1313101 and 2016YFC0901403), the National Natural Science Foundation (No. 81872033) and the CAMS Innovation Fund for Medical Sciences (Nos. 2016-I2M-1-001, 2017-I2M-3-005 and 2019-I2M-1-003) of China.

Acknowledgments

We thank Lusong Tian, Fang Liu and Lanping Zhou of Cancer Hospital of CAMS and PUMC for manuscript writing assistant, technical supports and helpful suggestions for this study.

Conflicts of Interest

The authors declare no conflict of interest.

References

  1. Zeng, H.; Chen, W.; Zheng, R.; Zhang, S.; Ji, J.S.; Zou, X.; Xia, C.; Sun, K.; Yang, Z.; Li, H.; et al. Changing cancer survival in China during 2003–15: A pooled analysis of 17 population-based cancer registries. Lancet Glob. Health 2018, 6, e555–e567. [Google Scholar] [CrossRef] [Green Version]
  2. Guichard, C.; Amaddeo, G.; Imbeaud, S.; Ladeiro, Y.; Pelletier, L.; Maad, I.B.; Calderaro, J.; Bioulac-Sage, P.; Letexier, M.; Degos, F.; et al. Integrated analysis of somatic mutations and focal copy-number changes identifies key genes and pathways in hepatocellular carcinoma. Nat. Genet. 2012, 44, 694–698. [Google Scholar] [CrossRef] [PubMed]
  3. Yang, H.; Zhang, Q.; Xu, M.; Wang, L.; Chen, X.; Feng, Y.; Li, Y.; Zhang, X.; Cui, W.; Jia, X. CCL2-CCR2 axis recruits tumor associated macrophages to induce immune evasion through PD-1 signaling in esophageal carcinogenesis. Mol. Cancer 2020, 19, 41. [Google Scholar] [CrossRef] [PubMed] [Green Version]
  4. Wang, Q.L.; Santoni, G.; Ness-Jensen, E.; Lagergren, J.; Xie, S.H. Association Between Metformin Use and Risk of Esophageal Squamous Cell Carcinoma in a Population-Based Cohort Study. Am. J. Gastroenterol. 2020, 115, 73–78. [Google Scholar] [CrossRef] [PubMed]
  5. Liu, J.Q.; Deng, M.; Xue, N.N.; Li, T.X.; Guo, Y.X.; Gao, L.; Zhao, D.; Fan, R.T. lncRNA KLF3-AS1 Suppresses Cell Migration and Invasion in ESCC by Impairing miR-185-5p-Targeted KLF3 Inhibition. Mol. Nucleic Acids 2020, 20, 231–241. [Google Scholar] [CrossRef] [PubMed]
  6. Kong, P.; Xu, E.; Bi, Y.; Xu, X.; Liu, X.; Song, B.; Zhang, L.; Cheng, C.; Yan, T.; Qian, Y.; et al. Novel ESCC-related gene ZNF750 as potential Prognostic biomarker and inhibits Epithelial-Mesenchymal Transition through directly depressing SNAI1 promoter in ESCC. Theranostics 2020, 10, 1798–1813. [Google Scholar] [CrossRef] [PubMed]
  7. Daniel, D.C.; Johnson, E.M. PURA, the gene encoding Pur-alpha, member of an ancient nucleic acid-binding protein family with mammalian neurological functions. Gene 2018, 643, 133–143. [Google Scholar] [CrossRef]
  8. Pandey, P.R.; Yang, J.H.; Tsitsipatis, D.; Panda, A.C.; Noh, J.H.; Kim, K.M.; Munk, R.; Nicholson, T.; Hanniford, D.; Argibay, D.; et al. circSamd4 represses myogenic transcriptional activity of PUR proteins. Nucleic Acids Res. 2020, 48, 3789–3805. [Google Scholar] [CrossRef] [Green Version]
  9. Guo, Z.-M.; Li, W.; Zhao, X.-H. Purine-rich element binding protein alpha promotes invasion and migration of esophageal squamous cell carcinoma KYSE 510 cells by inducing epithelial-mesenchymal transition. World Chin. J. Dig. 2014, 22. [Google Scholar] [CrossRef]
  10. Kaminski, R.; Darbinyan, A.; Merabova, N.; Deshmane, S.L.; White, M.K.; Khalili, K. Protective role of Puralpha to cisplatin. Cancer Biol. 2008, 7, 1926–1935. [Google Scholar] [CrossRef] [Green Version]
  11. Bergemann, A.D.; Ma, Z.W.; Johnson, E.M. Sequence of cDNA comprising the human pur gene and sequence-specific single-stranded-DNA-binding properties of the encoded protein. Mol. Cell. Biol. 1992, 12, 5673–5682. [Google Scholar] [CrossRef] [PubMed] [Green Version]
  12. Inoue, T.; Maeno, A.; Talbot, C., Jr.; Zeng, Y.; Yeater, D.B.; Leman, E.S.; Kulkarni, P.; Ogawa, O.; Getzenberg, R.H. Purine-rich element binding protein (PUR) alpha induces endoplasmic reticulum stress response, and cell differentiation pathways in prostate cancer cells. Prostate 2009, 69, 861–873. [Google Scholar] [CrossRef]
  13. Sariyer, I.K.; Sariyer, R.; Otte, J.; Gordon, J. Pur-Alpha Induces JCV Gene Expression and Viral Replication by Suppressing SRSF1 in Glial Cells. PLoS ONE 2016, 11, e0156819. [Google Scholar] [CrossRef] [PubMed] [Green Version]
  14. Ma, Z.W.; Bergemann, A.D.; Johnson, E.M. Conservation in human and mouse Purα of a motif common to several proteins involved in initiation of DNA replication. Gene 1994, 149, 311–314. [Google Scholar] [CrossRef]
  15. Hokkanen, S.; Feldmann, H.M.; Ding, H.; Jung, C.K.; Bojarski, L.; Renner-Muller, I.; Schuller, U.; Kretzschmar, H.; Wolf, E.; Herms, J. Lack of Pur-alpha alters postnatal brain development and causes megalencephaly. Hum. Mol. Genet. 2012, 21, 473–484. [Google Scholar] [CrossRef] [PubMed] [Green Version]
  16. Khalili, K.; Del Valle, L.; Muralidharan, V.; Gault, W.J.; Darbinian, N.; Otte, J.; Meier, E.; Johnson, E.M.; Daniel, D.C.; Kinoshita, Y.; et al. Puralpha is essential for postnatal brain development and developmentally coupled cellular proliferation as revealed by genetic inactivation in the mouse. Mol. Cell. Biol. 2003, 23, 6857–6875. [Google Scholar] [CrossRef] [PubMed] [Green Version]
  17. Trau, S.P.; Pizoli, C.E. PURA Syndrome and Myotonia. Pediatr. Neurol. 2020, 104, 62–63. [Google Scholar] [CrossRef] [PubMed]
  18. Reijnders, M.R.F.; Janowski, R.; Alvi, M.; Self, J.E.; van Essen, T.J.; Vreeburg, M.; Rouhl, R.P.W.; Stevens, S.J.C.; Stegmann, A.P.A.; Schieving, J.; et al. PURA syndrome: Clinical delineation and genotype-phenotype study in 32 individuals with review of published literature. J. Med. Genet. 2018, 55, 104–113. [Google Scholar] [CrossRef] [Green Version]
  19. Lee, B.H.; Reijnders, M.R.F.; Abubakare, O.; Tuttle, E.; Lape, B.; Minks, K.Q.; Stodgell, C.; Bennetto, L.; Kwon, J.; Fong, C.T.; et al. Expanding the neurodevelopmental phenotype of PURA syndrome. Am. J. Med. Genet. A 2018, 176, 56–67. [Google Scholar] [CrossRef]
  20. Lezon-Geyda, K.; Najfeld, V.; Johnson, E.M. Deletions of PURA, at 5q31, and PURB, at 7p13, in myelodysplastic syndrome and progression to acute myelogenous leukemia. Leukemia 2001, 15, 954–962. [Google Scholar] [CrossRef] [Green Version]
  21. Liu, X.; Gomez-Pinillos, A.; Liu, X.; Johnson, E.M.; Ferrari, A.C. Induction of bicalutamide sensitivity in prostate cancer cells by an epigenetic Puralpha-mediated decrease in androgen receptor levels. Prostate 2010, 70, 179–189. [Google Scholar] [CrossRef]
  22. Urzua, U.; Roby, K.F.; Gangi, L.M.; Cherry, J.M.; Powell, J.I.; Munroe, D.J. Transcriptomic analysis of an in vitro murine model of ovarian carcinoma: Functional similarity to the human disease and identification of prospective tumoral markers and targets. J. Cell Physiol. 2006, 206, 594–602. [Google Scholar] [CrossRef]
  23. Wang, M.; An, S.; Wang, D.; Ji, H.; Geng, M.; Guo, X.; Wang, Z. Quantitative Proteomics Identify the Possible Tumor Suppressive Role of Protease-Activated Receptor-4 in Esophageal Squamous Cell Carcinoma Cells. Pathol. Oncol. Res. 2019, 25, 937–943. [Google Scholar] [CrossRef]
  24. Sharma, P.; Saraya, A.; Sharma, R. Potential diagnostic implications of miR-144 overexpression in human oesophageal cancer. Indian J. Med. Res. 2016, 143, S91–S103. [Google Scholar] [CrossRef]
  25. Walker, R.C.; Underwood, T.J. Molecular pathways in the development and treatment of oesophageal cancer. Best Pr. Res Clin. Gastroenterol. 2018, 36–37, 9–15. [Google Scholar] [CrossRef] [PubMed]
  26. Livak, K.J.; Schmittgen, T.D. Analysis of relative gene expression data using real-time quantitative PCR and the 2(-Delta Delta C(T)) Method. Methods 2001, 25, 402–408. [Google Scholar] [CrossRef]
  27. Kim, D.; Pertea, G.; Trapnell, C.; Pimentel, H.; Kelley, R.; Salzberg, S.L. TopHat2: Accurate alignment of transcriptomes in the presence of insertions, deletions and gene fusions. Genome Biol. 2013, 14, R36. [Google Scholar] [CrossRef] [Green Version]
  28. Anders, S.; Huber, W. Differential expression analysis for sequence count data. Genome Biol. 2010, 11, R106. [Google Scholar] [CrossRef] [PubMed] [Green Version]
  29. Mortazavi, A.; Williams, B.A.; McCue, K.; Schaeffer, L.; Wold, B. Mapping and quantifying mammalian transcriptomes by RNA-Seq. Nat. Methods 2008, 5, 621–628. [Google Scholar] [CrossRef]
  30. Robinson, M.D.; McCarthy, D.J.; Smyth, G.K. edgeR: A Bioconductor package for differential expression analysis of digital gene expression data. Bioinformatics 2010, 26, 139–140. [Google Scholar] [CrossRef] [PubMed] [Green Version]
  31. Langmead, B.; Salzberg, S.L. Fast gapped-read alignment with Bowtie 2. Nat. Methods 2012, 9, 357–359. [Google Scholar] [CrossRef] [PubMed] [Green Version]
  32. Zhang, Y.; Liu, T.; Meyer, C.A.; Eeckhoute, J.; Johnson, D.S.; Bernstein, B.E.; Nusbaum, C.; Myers, R.M.; Brown, M.; Li, W.; et al. Model-based analysis of ChIP-Seq (MACS). Genome Biol. 2008, 9, R137. [Google Scholar] [CrossRef] [PubMed] [Green Version]
  33. Heinz, S.; Benner, C.; Spann, N.; Bertolino, E.; Lin, Y.C.; Laslo, P.; Cheng, J.X.; Murre, C.; Singh, H.; Glass, C.K. Simple combinations of lineage-determining transcription factors prime cis-regulatory elements required for macrophage and B cell identities. Mol. Cell 2010, 38, 576–589. [Google Scholar] [CrossRef] [Green Version]
  34. Subramanian, A.; Tamayo, P.; Mootha, V.K.; Mukherjee, S.; Ebert, B.L.; Gillette, M.A.; Paulovich, A.; Pomeroy, S.L.; Golub, T.R.; Lander, E.S.; et al. Gene set enrichment analysis: A knowledge-based approach for interpreting genome-wide expression profiles. Proc. Natl. Acad. Sci. USA 2005, 102, 15545–15550. [Google Scholar] [CrossRef] [PubMed] [Green Version]
  35. Mootha, V.K.; Lindgren, C.M.; Eriksson, K.F.; Subramanian, A.; Sihag, S.; Lehar, J.; Puigserver, P.; Carlsson, E.; Ridderstrale, M.; Laurila, E.; et al. PGC-1α-responsive genes involved in oxidative phosphorylation are coordinately downregulated in human diabetes. Nat. Genet. 2003, 34, 267–273. [Google Scholar] [CrossRef]
  36. Xie, C.; Mao, X.; Huang, J.; Ding, Y.; Wu, J.; Dong, S.; Kong, L.; Gao, G.; Li, C.Y.; Wei, L. KOBAS 2.0: A web server for annotation and identification of enriched pathways and diseases. Nucleic Acids Res. 2011, 39, W316–W322. [Google Scholar] [CrossRef] [Green Version]
  37. Thorvaldsdottir, H.; Robinson, J.T.; Mesirov, J.P. Integrative Genomics Viewer (IGV): High-performance genomics data visualization and exploration. Brief Bioinform. 2013, 14, 178–192. [Google Scholar] [CrossRef] [Green Version]
  38. Robinson, J.T.; Thorvaldsdottir, H.; Winckler, W.; Guttman, M.; Lander, E.S.; Getz, G.; Mesirov, J.P. Integrative genomics viewer. Nat. Biotechnol. 2011, 29, 24–26. [Google Scholar] [CrossRef] [Green Version]
  39. Gallia, G.L.; Johnson, E.M.; Khalili, K. Puralpha: A multifunctional single-stranded DNA- and RNA-binding protein. Nucleic Acids Res. 2000, 28, 3197–3205. [Google Scholar] [CrossRef]
  40. Tretiakova, A.; Gallia, G.L.; Shcherbik, N.; Jameson, B.; Johnson, E.M.; Amini, S.; Khalili, K. Association of Puralpha with RNAs homologous to 7 SL determines its binding ability to the myelin basic protein promoter DNA sequence. J. Biol. Chem. 1998, 273, 22241–22247. [Google Scholar] [CrossRef] [Green Version]
  41. Ma, Z.W.; Pejovic, T.; Najfeld, V.; Ward, D.C.; Johnson, E.M. Localization of PURA, the gene encoding the sequence-specific single-stranded-DNA-binding protein Pur alpha, to chromosome band 5q31. Cytogenet Cell Genet 1995, 71, 64–67. [Google Scholar] [CrossRef]
  42. Johnson, E.M.; Daniel, D.C.; Gordon, J. The pur protein family: Genetic and structural features in development and disease. J. Cell Physiol. 2013, 228, 930–937. [Google Scholar] [CrossRef] [PubMed] [Green Version]
  43. Bergemann, A.D.; Johnson, E.M. The HeLa Pur factor binds single-stranded DNA at a specific element conserved in gene flanking regions and origins of DNA replication. Mol. Cell. Biol. 1992, 12, 1257–1265. [Google Scholar] [CrossRef] [PubMed] [Green Version]
  44. Darbinian, N.; White, M.K.; Khalili, K. Regulation of the Pur-alpha promoter by E2F-1. J. Cell Biochem. 2006, 99, 1052–1063. [Google Scholar] [CrossRef] [PubMed]
  45. Wang, Z.; Dong, C. Gluconeogenesis in cancer: Function and regulation of PEPCK, FBPase, and G6Pase. Trends Cancer 2019, 5, 30–45. [Google Scholar] [CrossRef] [PubMed]
  46. Grasmann, G.; Smolle, E.; Olschewski, H.; Leithner, K. Gluconeogenesis in cancer cells—Repurposing of a starvation-induced metabolic pathway? Biochim. Biophys. Acta Rev. Cancer 2019, 1872, 24–36. [Google Scholar] [CrossRef] [PubMed]
  47. Messeguer, X.; Escudero, R.; Farre, D.; Nunez, O.; Martinez, J.; Alba, M.M. PROMO: Detection of known transcription regulatory elements using species-tailored searches. Bioinformatics 2002, 18, 333–334. [Google Scholar] [CrossRef] [PubMed]
  48. Shelley, C.S.; Teodoridis, J.M.; Park, H.; Farokhzad, O.C.; Bottinger, E.P.; Arnaout, M.A. During differentiation of the monocytic cell line U937, Pur alpha mediates induction of the CD11c beta 2 integrin gene promoter. J. Immunol. 2002, 168, 3887–3893. [Google Scholar] [CrossRef] [Green Version]
  49. Da Silva, N.; Bharti, A.; Shelley, C.S. hnRNP-K and Pur(alpha) act together to repress the transcriptional activity of the CD43 gene promoter. Blood 2002, 100, 3536–3544. [Google Scholar] [CrossRef]
  50. Shelley, C.S.; Da Silva, N.; Teodoridis, J.M. During U937 monocytic differentiation repression of the CD43 gene promoter is mediated by the single-stranded DNA binding protein Pur alpha. Br. J. Haematol. 2001, 115, 159–166. [Google Scholar] [CrossRef]
  51. Hariharan, S.; Kelm, R.J.; Strauch, A.R. The Purα/Purβ Single-Strand DNA-Binding Proteins Attenuate Smooth-Muscle Actin Gene Transactivation in Myofibroblasts. J. Cell. Physiol. 2014, 229, 1256–1271. [Google Scholar] [CrossRef]
  52. Mayorga, L.; Gamboni, B.; Mampel, A.; Roque, M. A frame-shift deletion in the PURA gene associates with a new clinical finding: Hypoglycorrhachia. Is GLUT1 a new PURA target? Mol. Genet Metab. 2018, 123, 331–336. [Google Scholar] [CrossRef]
  53. Liu, M.X.; Jin, L.; Sun, S.J.; Liu, P.; Feng, X.; Cheng, Z.L.; Liu, W.R.; Guan, K.L.; Shi, Y.H.; Yuan, H.X.; et al. Metabolic reprogramming by PCK1 promotes TCA cataplerosis, oxidative stress and apoptosis in liver cancer cells and suppresses hepatocellular carcinoma. Oncogene 2018, 37, 1637–1653. [Google Scholar] [CrossRef]
  54. Zhao, J.; Li, J.; Fan, T.W.M.; Hou, S.X. Glycolytic reprogramming through PCK2 regulates tumor initiation of prostate cancer cells. Oncotarget 2017, 8, 83602–83618. [Google Scholar] [CrossRef]
  55. Luo, S.; Li, Y.; Ma, R.; Liu, J.; Xu, P.; Zhang, H.; Tang, K.; Ma, J.; Liu, N.; Zhang, Y.; et al. Downregulation of PCK2 remodels tricarboxylic acid cycle in tumor-repopulating cells of melanoma. Oncogene 2017, 36, 3609–3617. [Google Scholar] [CrossRef] [PubMed]
  56. Leithner, K.; Hrzenjak, A.; Trotzmuller, M.; Moustafa, T.; Kofeler, H.C.; Wohlkoenig, C.; Stacher, E.; Lindenmann, J.; Harris, A.L.; Olschewski, A.; et al. PCK2 activation mediates an adaptive response to glucose depletion in lung cancer. Oncogene 2015, 34, 1044–1050. [Google Scholar] [CrossRef]
  57. Chun, S.Y.; Johnson, C.; Washburn, J.G.; Cruz-Correa, M.R.; Dang, D.T.; Dang, L.H. Oncogenic KRAS modulates mitochondrial metabolism in human colon cancer cells by inducing HIF-1α and HIF-2α target genes. Mol. Cancer 2010, 9, 293. [Google Scholar] [CrossRef] [Green Version]
  58. Suzuki, M.; Yamasaki, T.; Shinohata, R.; Hata, M.; Nakajima, H.; Kono, N. Cloning and reporter analysis of human mitochondrial phosphoenolpyruvate carboxykinase gene promoter. Gene 2004, 338, 157–162. [Google Scholar] [CrossRef]
  59. Stark, R.; Kibbey, R.G. The mitochondrial isoform of phosphoenolpyruvate carboxykinase (PEPCK-M) and glucose homeostasis: Has it been overlooked? Biochim. Biophys. Acta 2014, 1840, 1313–1330. [Google Scholar] [CrossRef] [Green Version]
  60. Mendez-Lucas, A.; Hyrossova, P.; Novellasdemunt, L.; Vinals, F.; Perales, J.C. Mitochondrial phosphoenolpyruvate carboxykinase (PEPCK-M) is a pro-survival, endoplasmic reticulum (ER) stress response gene involved in tumor cell adaptation to nutrient availability. J. Biol. Chem. 2014, 289, 22090–22102. [Google Scholar] [CrossRef] [Green Version]
  61. Tang, K.; Yu, Y.; Zhu, L.; Xu, P.; Chen, J.; Ma, J.; Zhang, H.; Fang, H.; Sun, W.; Zhou, L.; et al. Hypoxia-reprogrammed tricarboxylic acid cycle promotes the growth of human breast tumorigenic cells. Oncogene 2019, 38, 6970–6984. [Google Scholar] [CrossRef] [PubMed] [Green Version]
  62. Sciacovelli, M.; Frezza, C. Metabolic reprogramming and epithelial-to-mesenchymal transition in cancer. FEBS J. 2017, 284, 3132–3144. [Google Scholar] [CrossRef] [PubMed]
Figure 1. Peak and motif analysis of ChIP-seq. (a) A pie chart of peak distribution on gene elements. (b) Motif scan analysis of significantly enriched DNA-binding regions not collected in the Homer database.
Genes 11 01301 g001
Figure 2. KEGG and GO analysis of ChIP-seq. (a) The significantly enriched KEGG pathways are shown based on ChIP-seq data in KYSE510 cells after PURα overexpression (p < 0.05). (b) The top 10 enriched biological process (BP), cellular component (CC) and molecular function (MF) of the same ChIP-seq data via GO analysis (p < 0.05, the red, blue and green bars refer to CC, BP and MF, respectively). (c) GO analysis of ChIP-seq via FDR correction shown the top 7 enriched BP functions (p < 0.05, FDR < 5%).
Genes 11 01301 g002
Figure 3. Analysis of RNA-seq and ChIP-seq. (a) GSEA of PURα-regulated genes with normalized enrichment score (NES) and false-discovery rate (FDR). (b) Venn diagram showing the overlap of DEGs between RNA-seq (logFC ≥ 0.5 or ≤ −0.5, p ≤ 0.01, FDR ≤ 1.5%) and ChIP-seq (logFC ≥ 1 or ≤ −1, p ≤ 0.01, FDR ≤ 1.5%). (c) Heat map depicting changes in gene expression levels involved in fatty acid degradation, adipocytokine signalling pathway, oxidative phosphorylation and glycolysis/gluconeogenesis based on the overlapping genes. The raw sequence data reported in this paper have been deposited in the Genome Sequence Archive in National Genomics Data Center, Beijing Institute of Genomics (China National Center for Bioinformation), Chinese Academy of Sciences, under accession number CRA003437 that are publicly accessible at https://bigd.big.ac.cn/gsa.
Genes 11 01301 g003
Figure 4. Specific motif of PURα binding to the PCK2 promoter region. (a) Online prediction of the PURα binding sites in the PCK2 promoter region (−1500/+227). (b) Luciferase assay of the point mutant constructor at prediction site S1 in KYSE170 cells under exogenous overexpression of pCMV6/pCMV6-PURα. n = 3. ***, p < 0.001; ns, p > 0.05.
Genes 11 01301 g004
Figure 5. IGV visual analysis. Visual analysis of the PURα binding peak in the PCK2 promoter region from ChIP-seq of KYSE510-input/PURα cells by IGV. The arrows refer to the PCK2 gene.
Genes 11 01301 g005
Figure 6. Sequence analysis of the S1 motif in the PCK2 promoter region of different primates.
Genes 11 01301 g006
Figure 7. Identification of PURα binding to the core promoter region of PCK2. (a) Schematic diagram showing the truncated region of the PCK2 promoter and 7 predicted PURα binding sites. The red triangle represents the TSS, and the blue triangle represents PURα predicted binding sites. (b) Luciferase assay of the positive control and truncated PCK2 promoter in KYSE170 cells under the condition of exogenous overexpression of pCMV6/pCMV6-PURα. n = 3. ***, p < 0.001; ns, p > 0.05.
Genes 11 01301 g007
Figure 8. PURα binds directly to the promoter region of PCK2. (a) Schematic diagram showing the specific motifs of 7 PURα predicted binding sites and the designed C region verified by ChIP-PCR (C1: −727/−570; C2: −577/−382; C3: −157/+10). (b) ChIP-PCR analysis of PURα binding to the PCK2 promoter region (C1, C2 and C3) and CD11c as a positive control in KYSE170 cells. (c) ChIP-qPCR analysis of PURα binding to the PCK2 promoter C2/C3 region and CD11c in KYSE170 cells. n = 3. ***, p < 0.001; ns, p > 0.05.
Genes 11 01301 g008
Figure 9. PURα activates the transcription and expression of PCK2. (a) The cytoplasmic/nuclear protein level of PURα in the KYSE510 cells of overexpressing pCMV6-PURα-NLS. (b) The mRNA level of PCK2 in the KYSE510 cells of overexpressing pCMV6-PURα-NLS or KYSE170 cells with PURα knockdown was detected by qPCR. (c) The protein level of PCK2 in the KYSE510 cells of overexpressing pCMV6-PURα-NLS or the KYSE170 cells with PURα knockdown was verified by Western blotting. n = 3. ***, p < 0.001.
Genes 11 01301 g009
Figure 10. PURα promotes mitochondrial respiration and glycolysis in ESCC cells. (a) The protein levels of PURα in KYSE170-shNC/shPURα32/34 cells were assessed by Western blotting. (b) Oxygen consumption rate (OCR) and extracellular acidification rate (ECAR) detection in KYSE170-shNC/shPURα32/34 cells.
Genes 11 01301 g010
Table 1. Primers of the target gene.
Primer NameSequence (5’→3’)
Human PCK2-FGGGCACTACCTGGAACACTG
Human PCK2-RGCACTGTCCTCCCCCT-CTAA
Human PURA-FTACGGCGTGTTTATGCGAGT
Human PURA-RTTGCAGAAGGTGTGTCCGAA
Human β-actin-FCATGTACGTTGCTATCCAGGC
Human β-actin-RCTCCTTAATGTCAC-GCACGAT
Table 2. ChIP-PCR/qPCR primers.
Primer NameSequence (5’→3’)
PCK2-C1-FGCTCACGCCTGTAAATTCCAG
PCK2-C1-RTAGCTGGAATTACAGGCGC
PCK2-C2-FTCCAGCTACTCTGCAGGTT
PCK2-C2-RTCTCTCTACCCCTGGGTCT
PCK2-C3-FCGTTCCTAGCTTGTTTGCCAC
PCK2-C3-RCCAAACCGCCAAACCCATCT
CD11c-FTCCATCTAAGCAAAGGGCATCA
CD11c-RGCCAGGGGAAGGAAGAAGATT
Table 3. Information and dilution multiple of antibodies.
AntibodySourceIdentifierDilution Multiple
PCK2-Rabbit antibodyCell Signaling TechnologyCat# 6924S1:1000
PURA-Rabbit antibodyAbcamCat# ab799361:1000
β-actin-Mouse antibodyBoao rui jingCat# ab1015t1:5000
Table 4. Primers for the recombinant plasmids.
Primer NameSequence (5’→3’)
PCK2-Luc-1500-227-FCCGCTCGAGGTGTAGGCTAGAGCCTGAG
PCK2-Luc-1500-227-RCCGCTCGAGGTGTAGGCTAGAGCCTGAG
PCK2-Luc-953-107-FCCGCTCGAGCAGAAAAGGCGAGTGGATGC
PCK2-Luc-953-107-RCCCAAGCTTTGGCACTAGCTTTCCTCCG
PCK2-Luc-221-107-FCCGCTCGAGATGCCCAACCCCCTAACTTC
PCK2-Luc-221-107-RCCCAAGCTTTGGCACTAGCTTTCCTCCG
PCK2-Luc-S1-MU-FCCCTTTATTCTTAGTGTGCAGTGAGCCGAGATCG
PCK2-Luc-S1-MU-RGCACACTAAGAATAAAGGGTTCAAGCAATTCTCCTGTCTCA
pCMV6-ATF4-FCCCAAGCTTATGACCGAAATGAGCTTCCT
pCMV6-ATF4-RCCGCTCGAGGGGGACCCTTTTCTTCCC
Table 5. siRNA/shRNA sequences of PURα.
siRNASequence (5’→3’)
siCtrlUUCUCCGAACGUGUCACGU
siPURα-1CCACCUAUCGCAACUCCAUTT
siPURα-2CCAAGUUCGGACACACCUUTT
shNCACAGAAGCGATTGTTGATC
shPURα32CCACCAACTGACAGTTTCTCT
shPURα34AGCCGCCTTACTCTCTCCATG
Publisher’s Note: MDPI stays neutral with regard to jurisdictional claims in published maps and institutional affiliations.

