Comparative Transcriptome Profiling of Skeletal Muscle from Black Muscovy Duck at Different Growth Stages Using RNA-seq


Abstract
1. Introduction
2. Materials and Methods
2.1. Animal and Muscle Tissue Collection
2.2. RNA Extraction, Library Construction and Sequencing
2.3. Sequencing Analysis
2.4. Analysis of SNP/InDel
2.5. Prediction of Variable Splices
2.6. Analysis of DEGs
2.7. Analysis of GO and KEGG Pathway
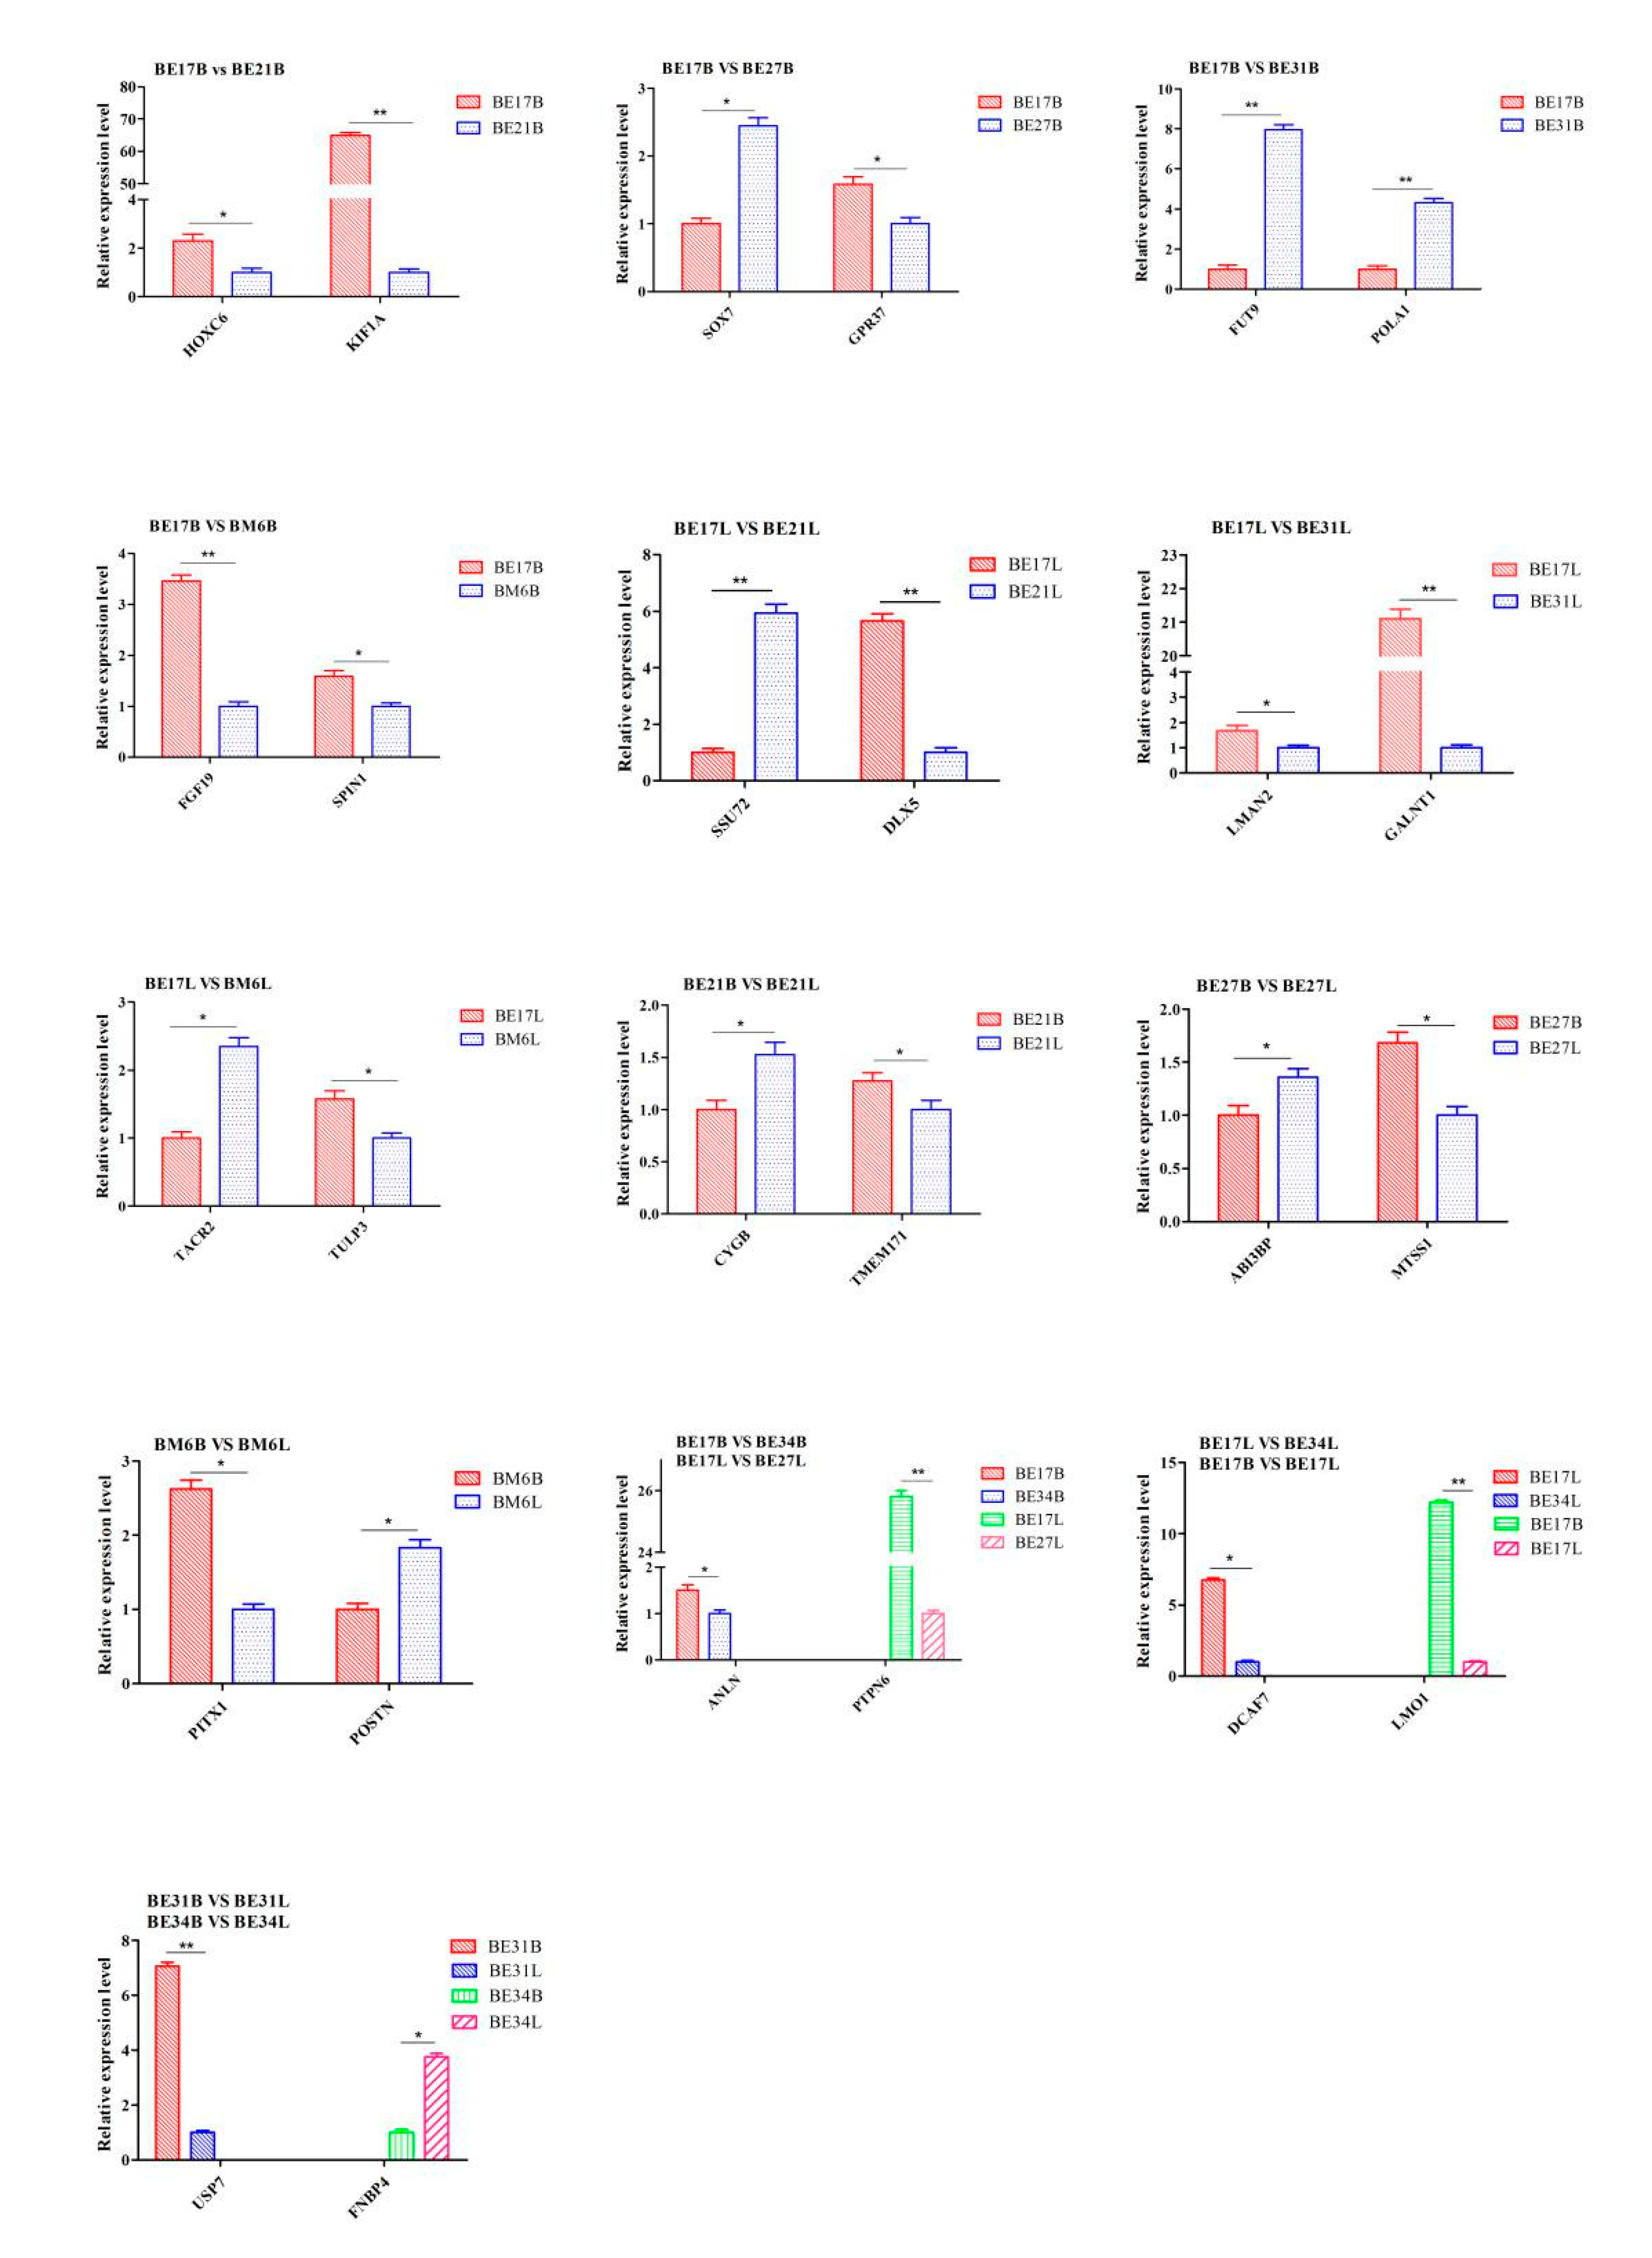
2.8. RNA-seq Validation by qPCR
3. Results
3.1. Transcriptome Profiles
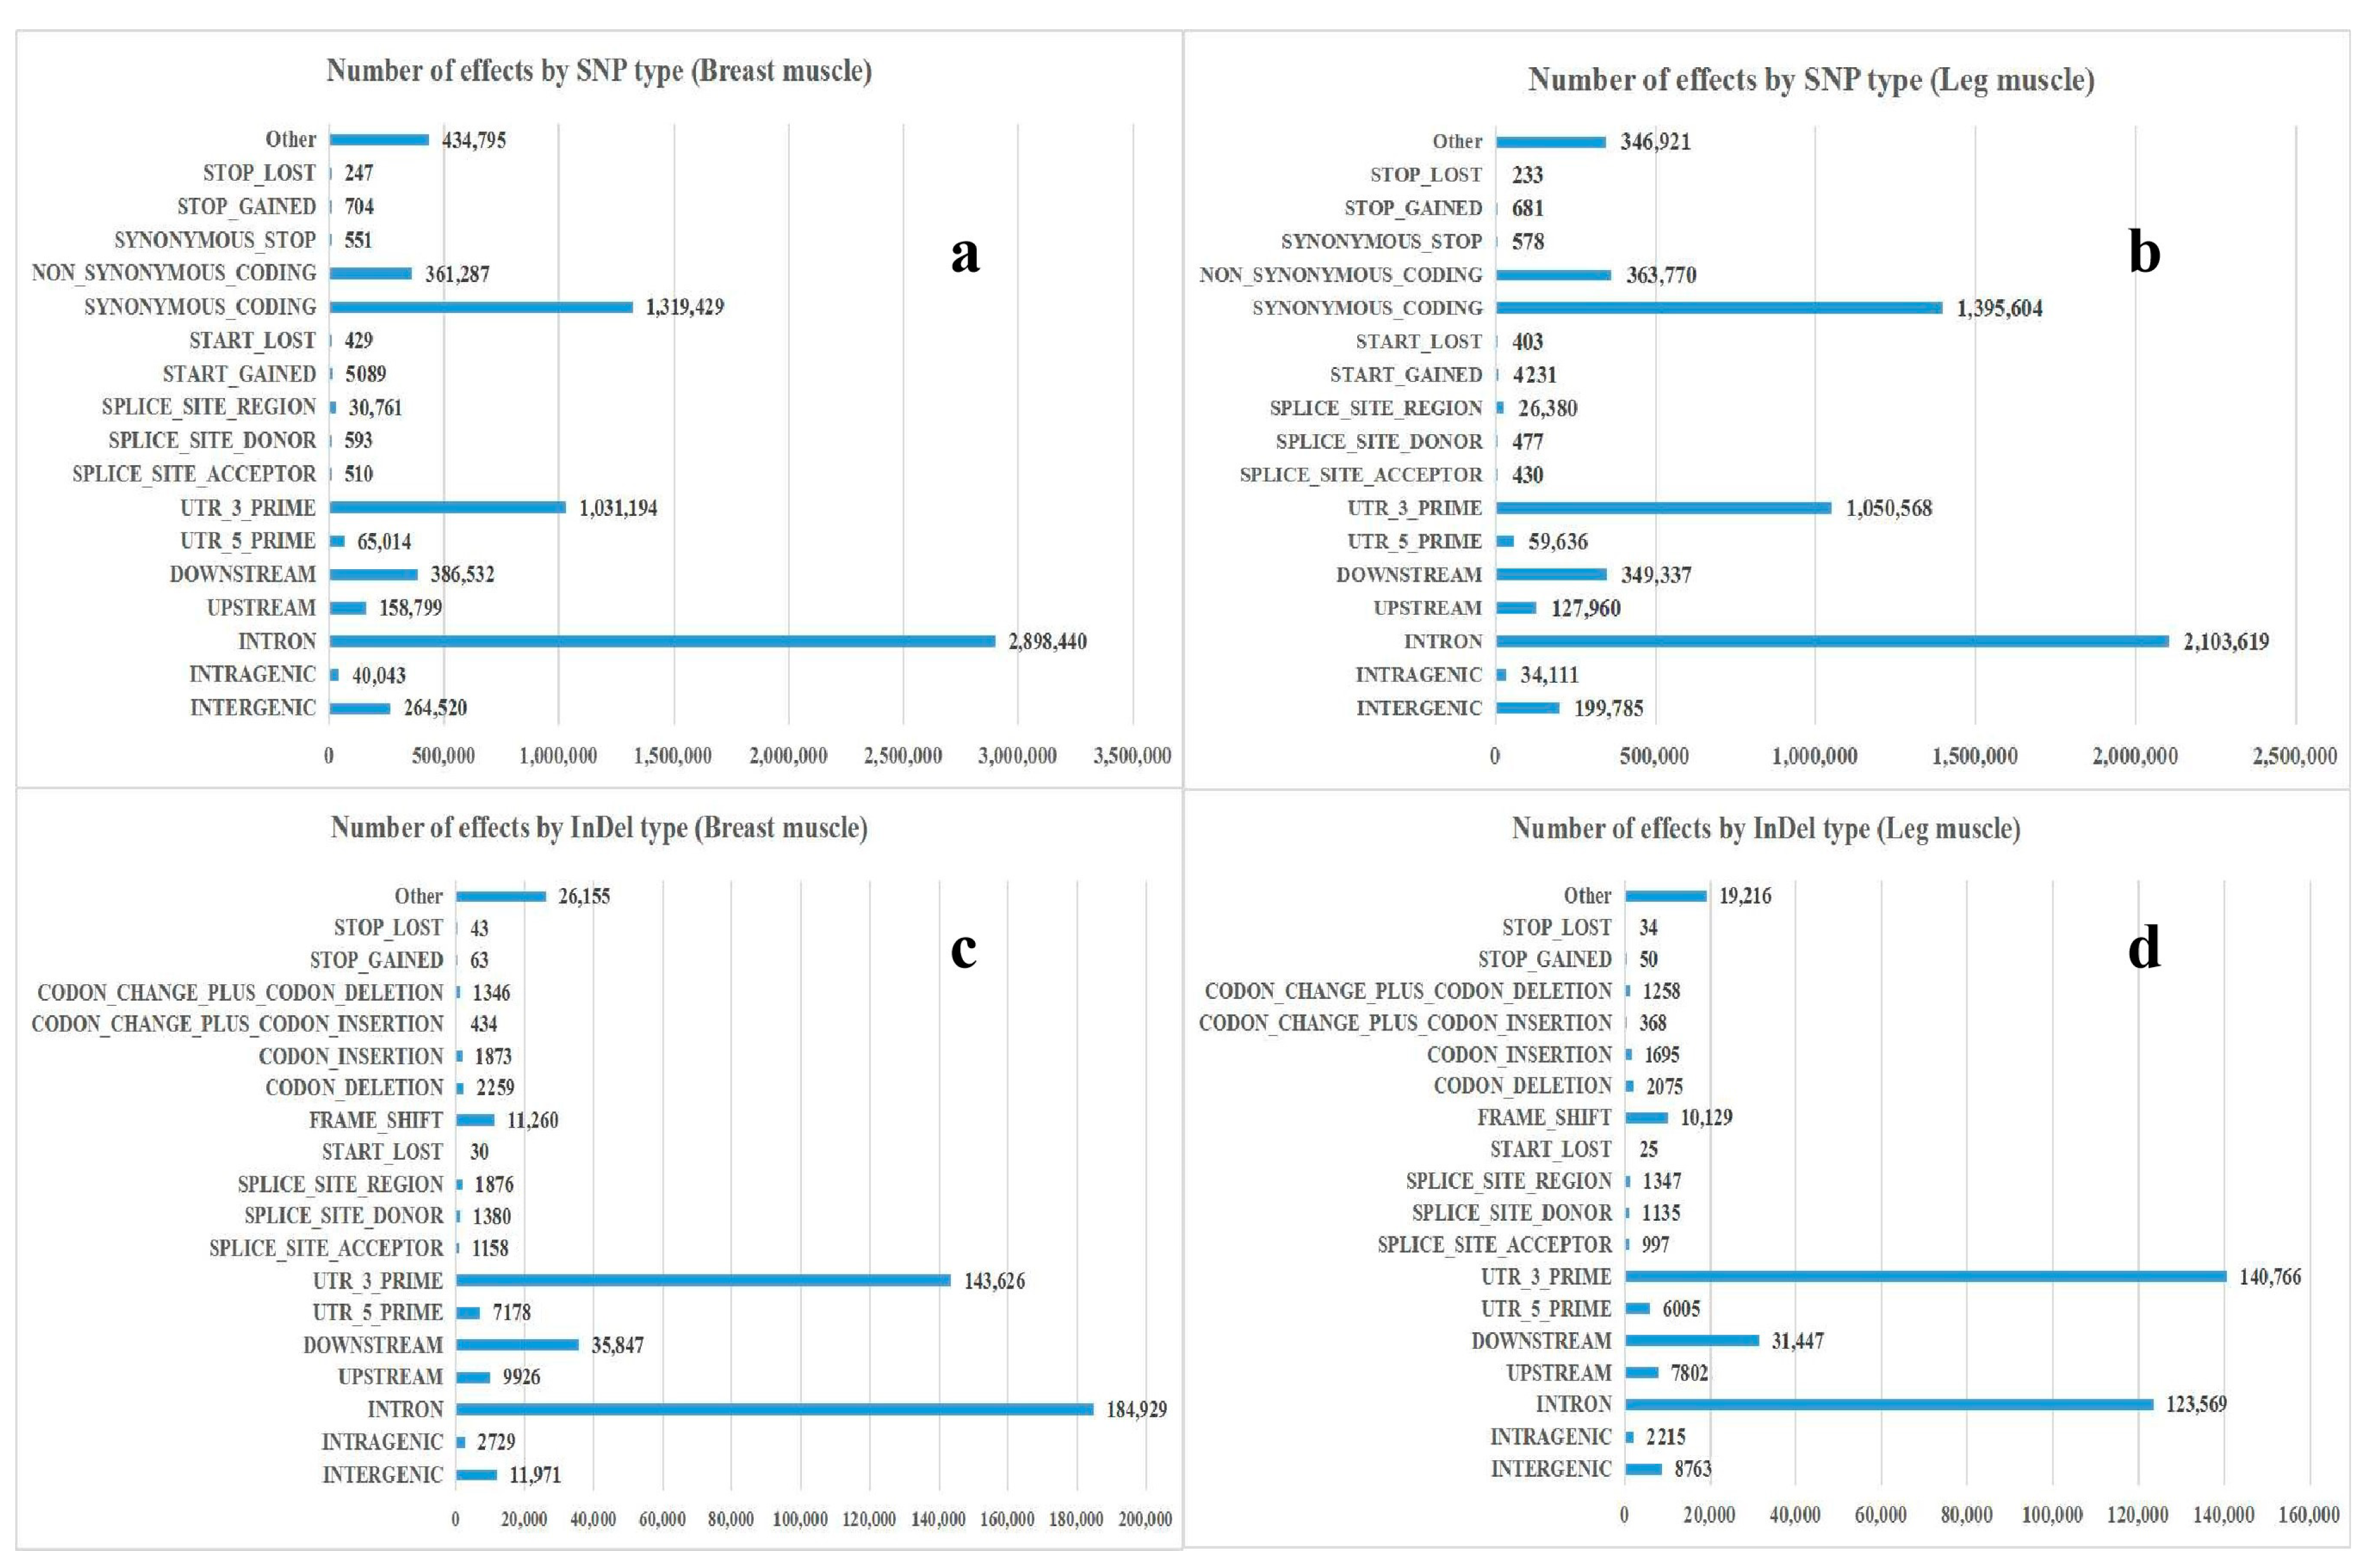
3.2. Annotation and Classification of SNP/InDel
3.3. Prediction of Alternative Splice (AS)
3.4. Analysis of DEGs
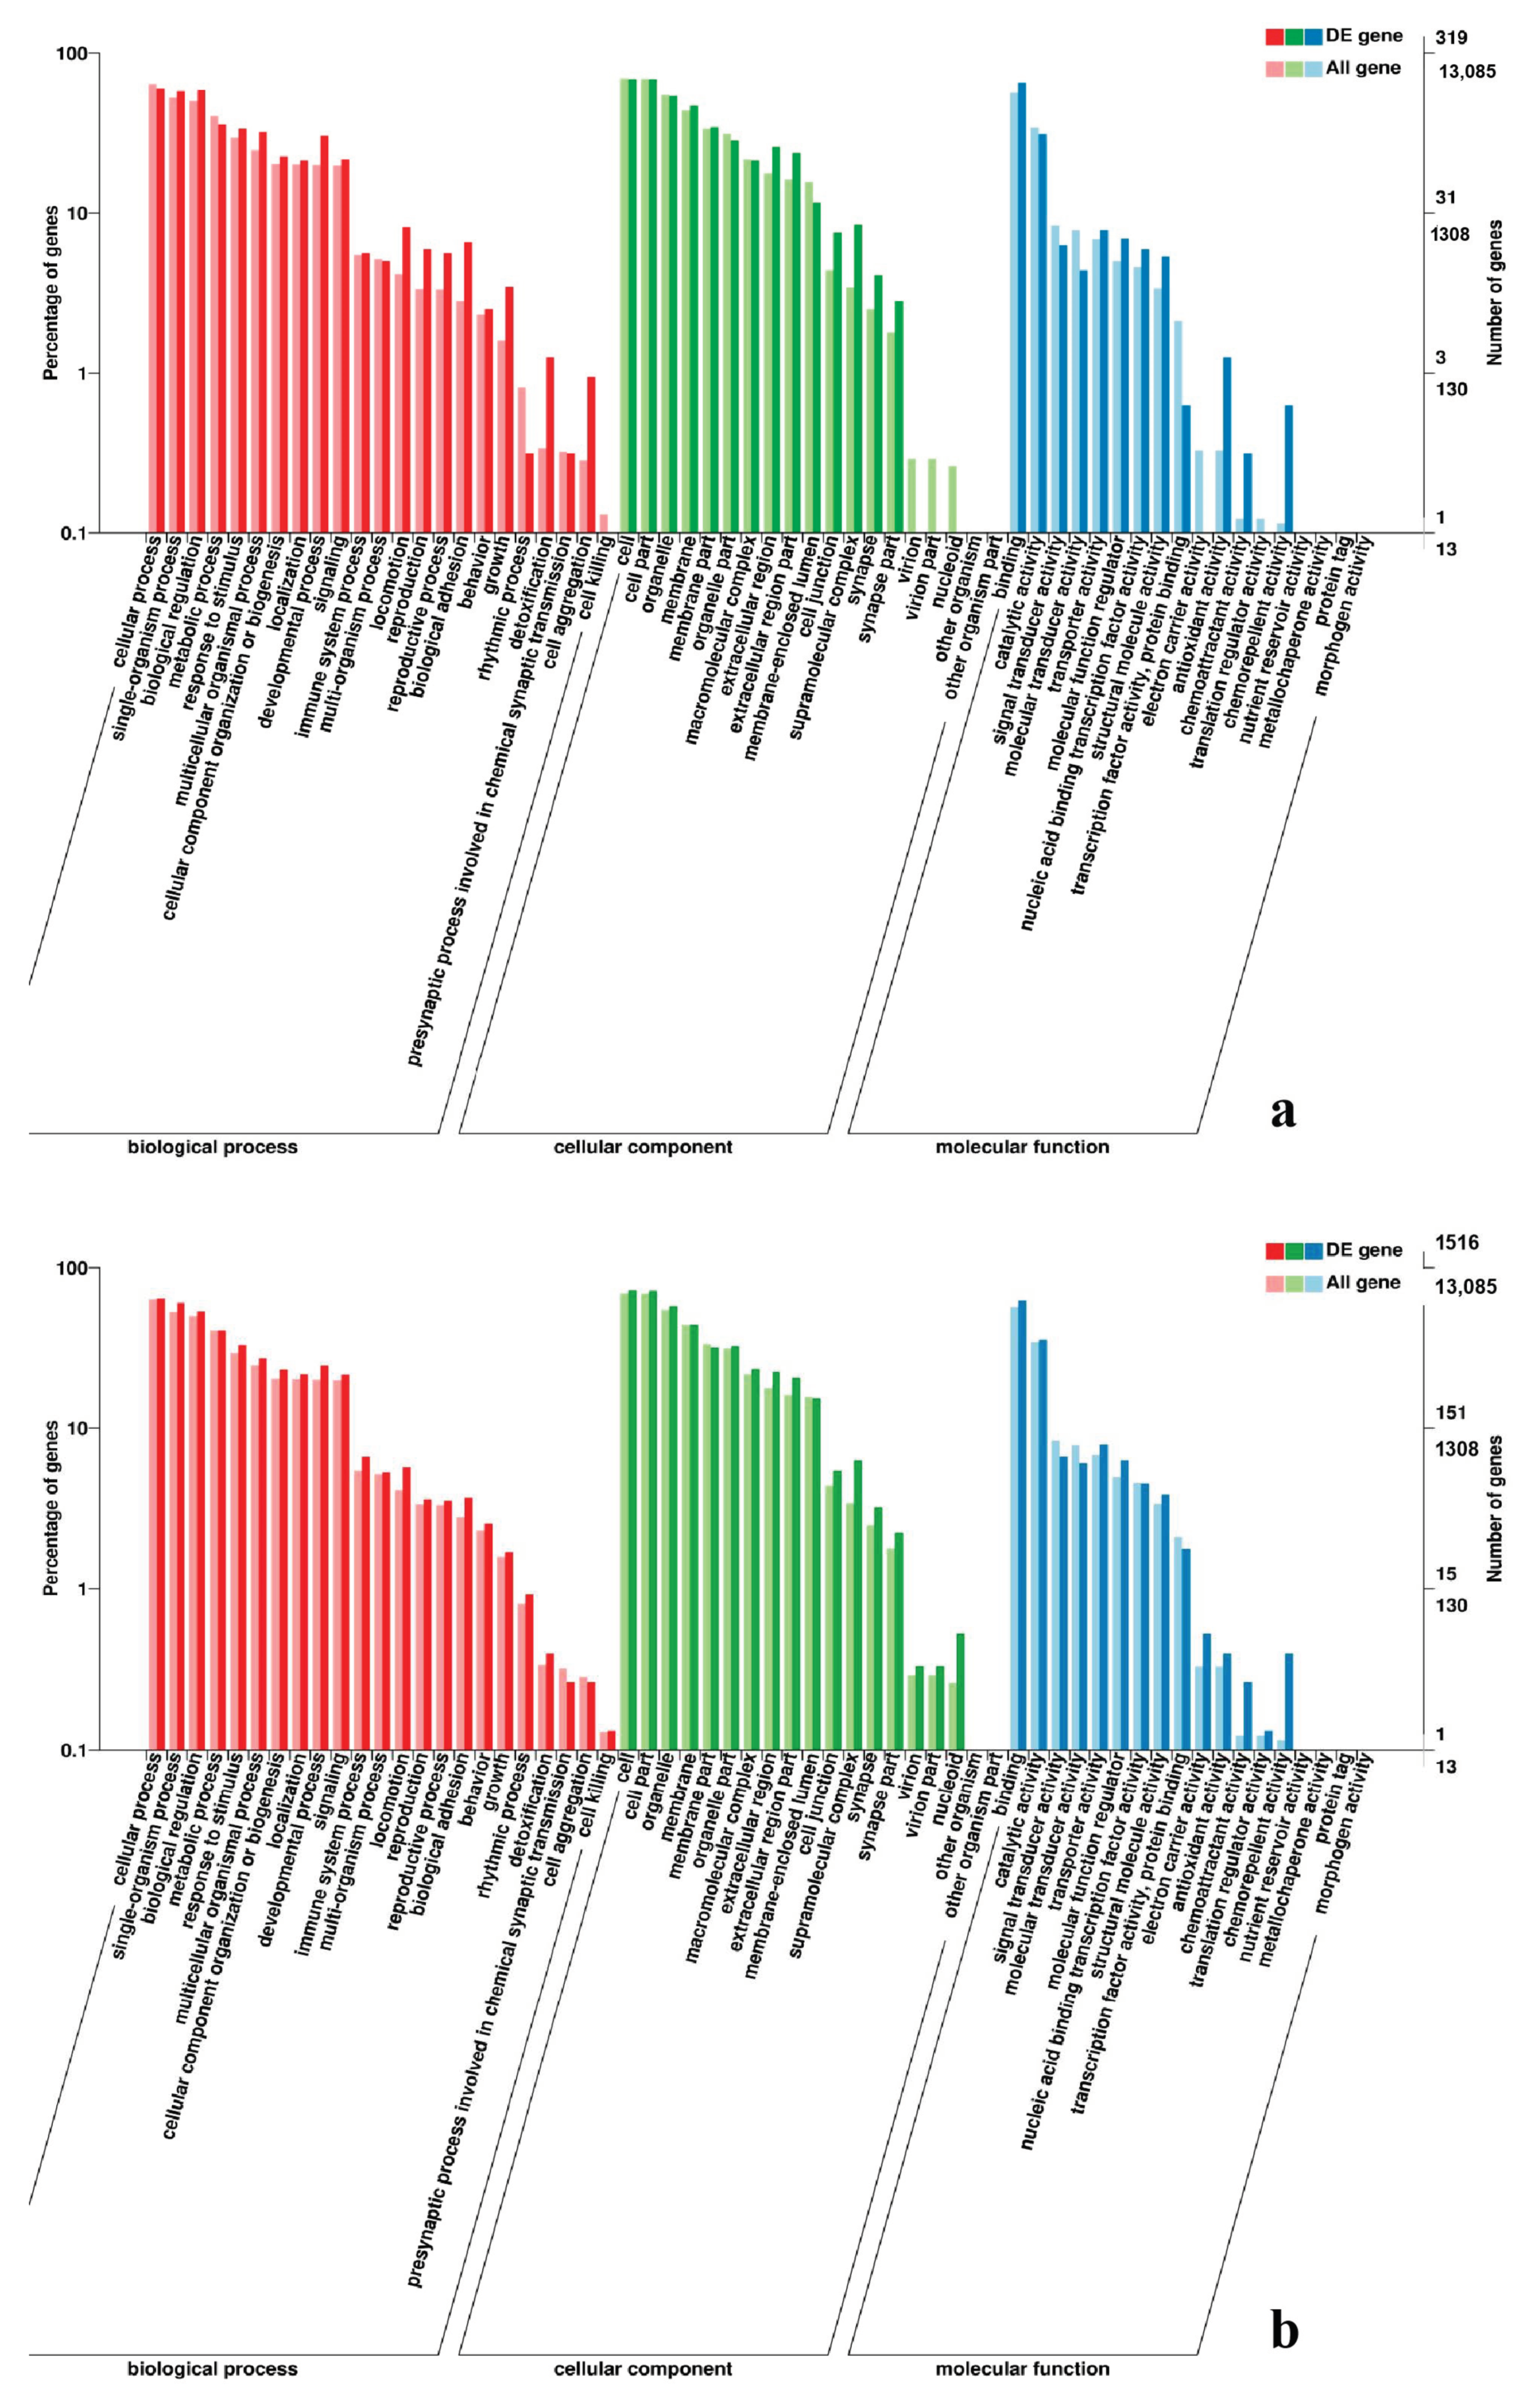
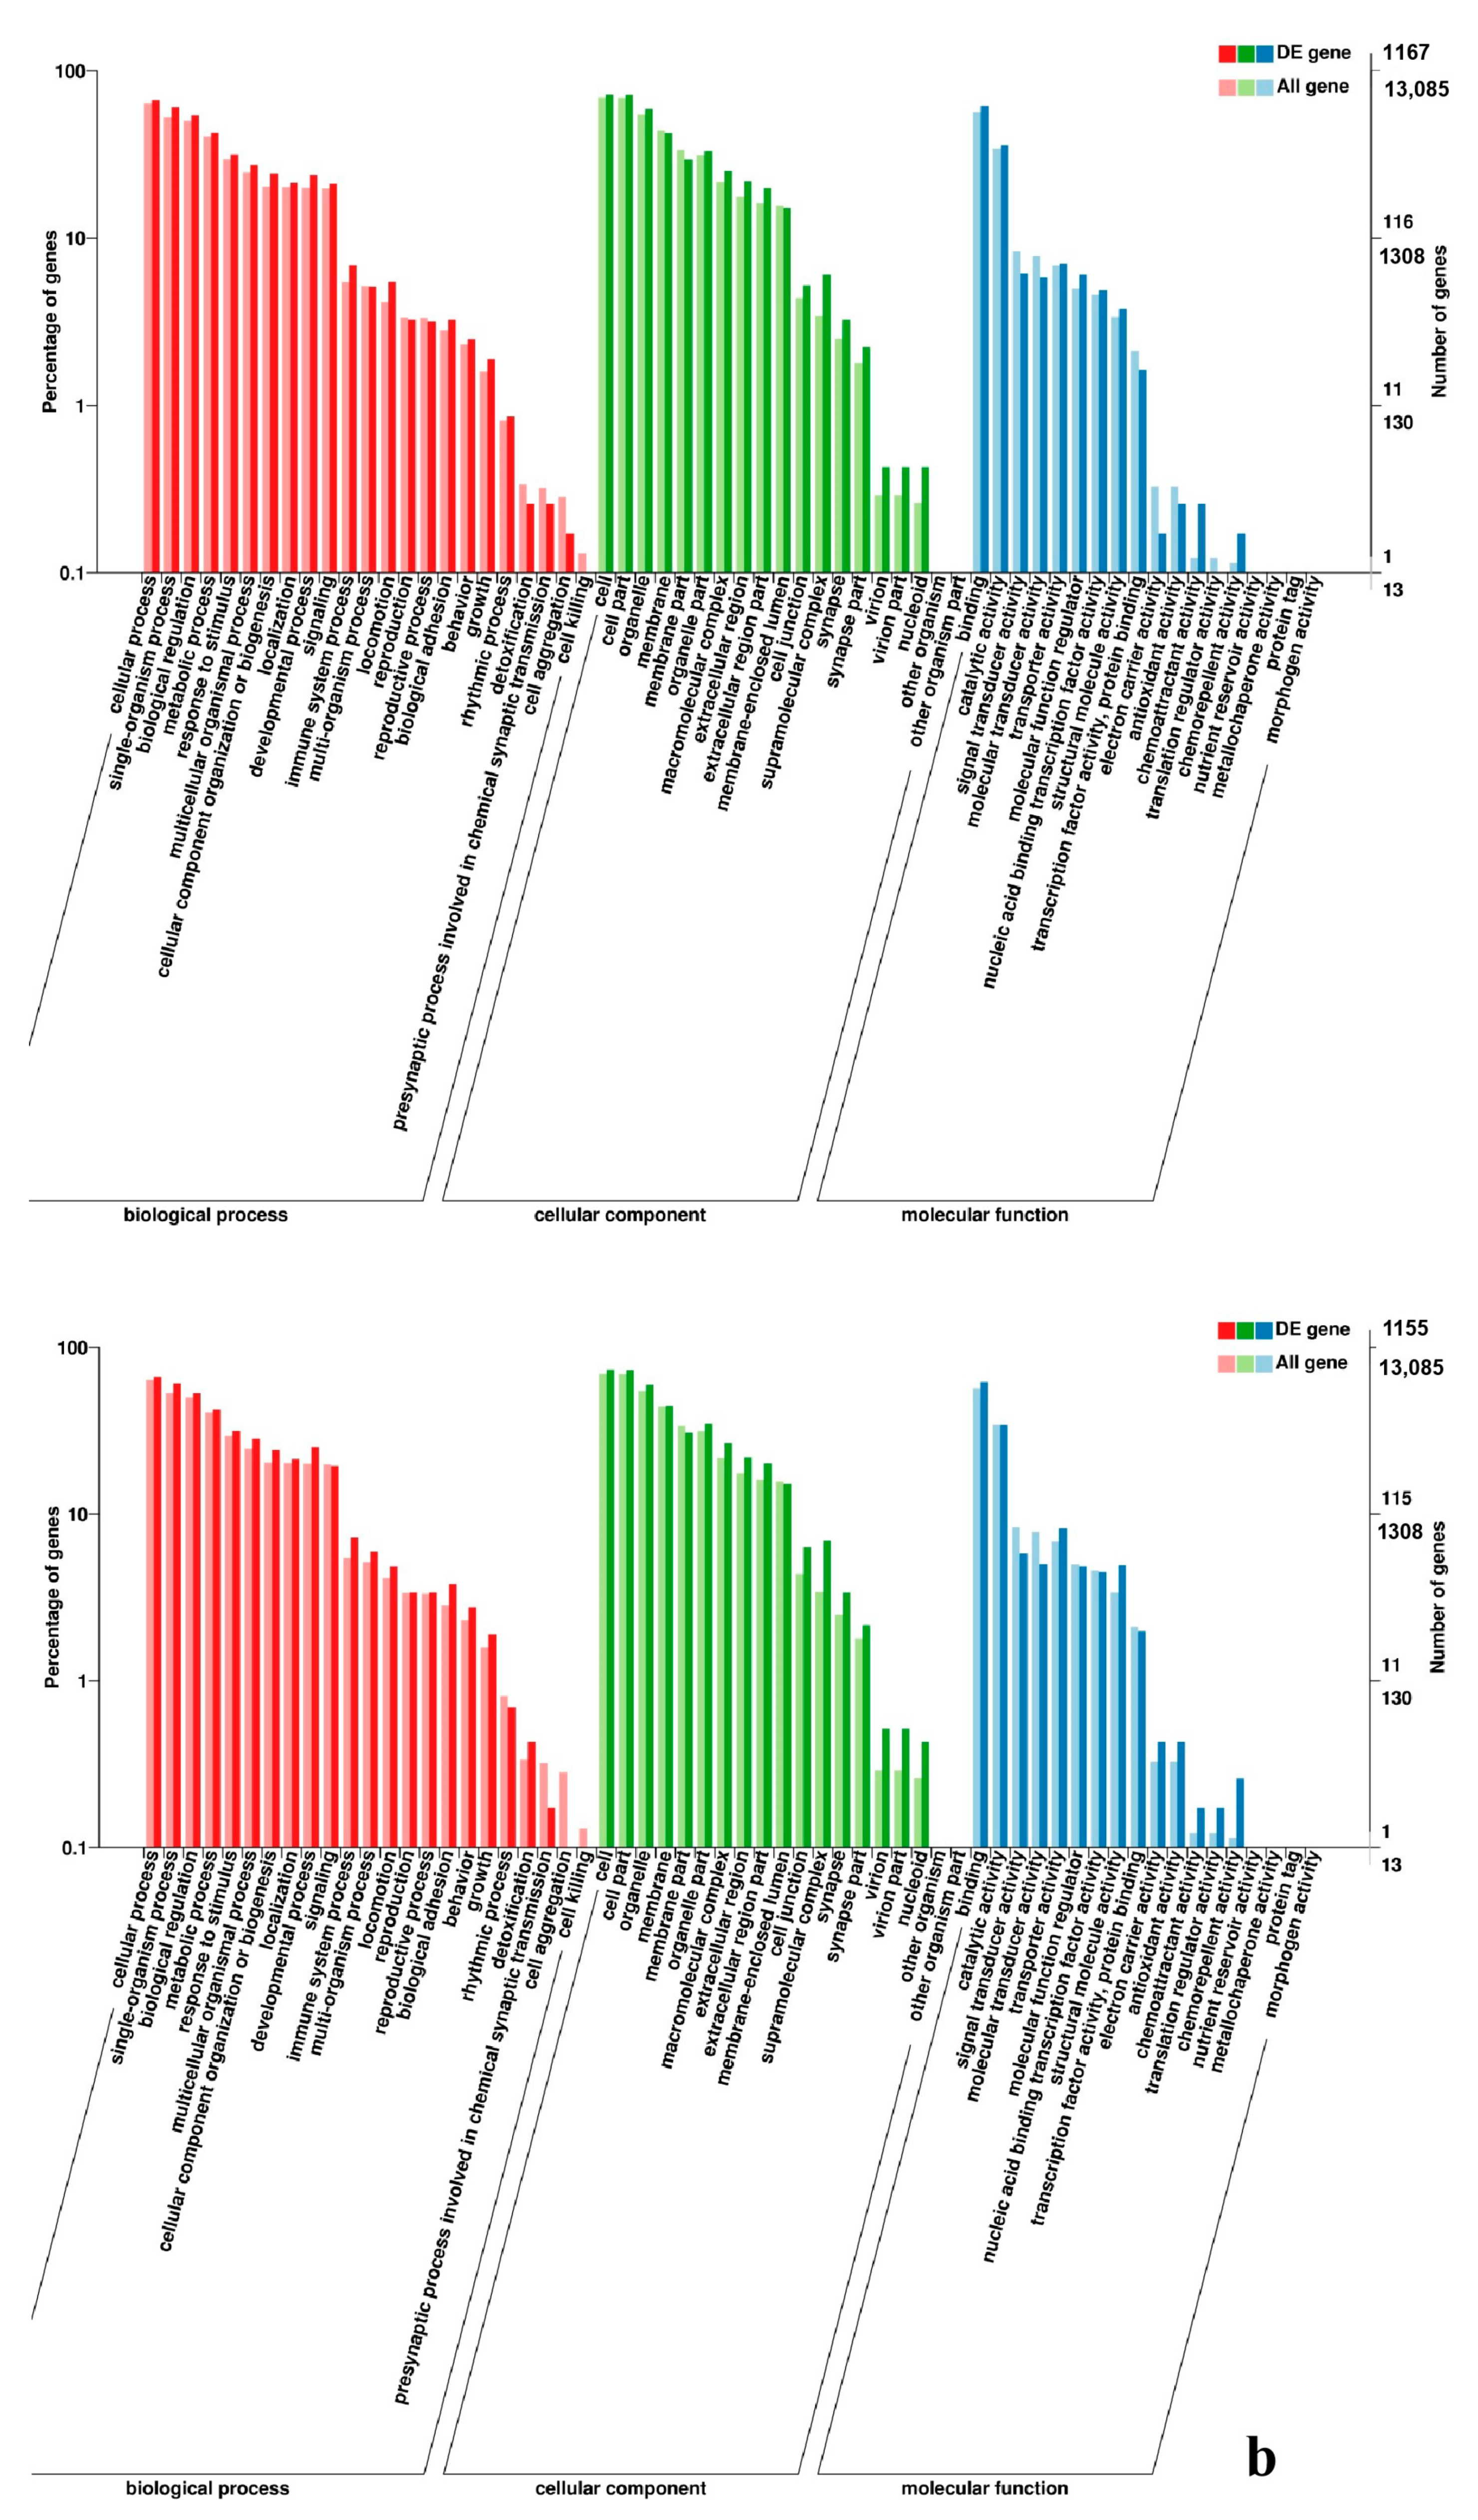
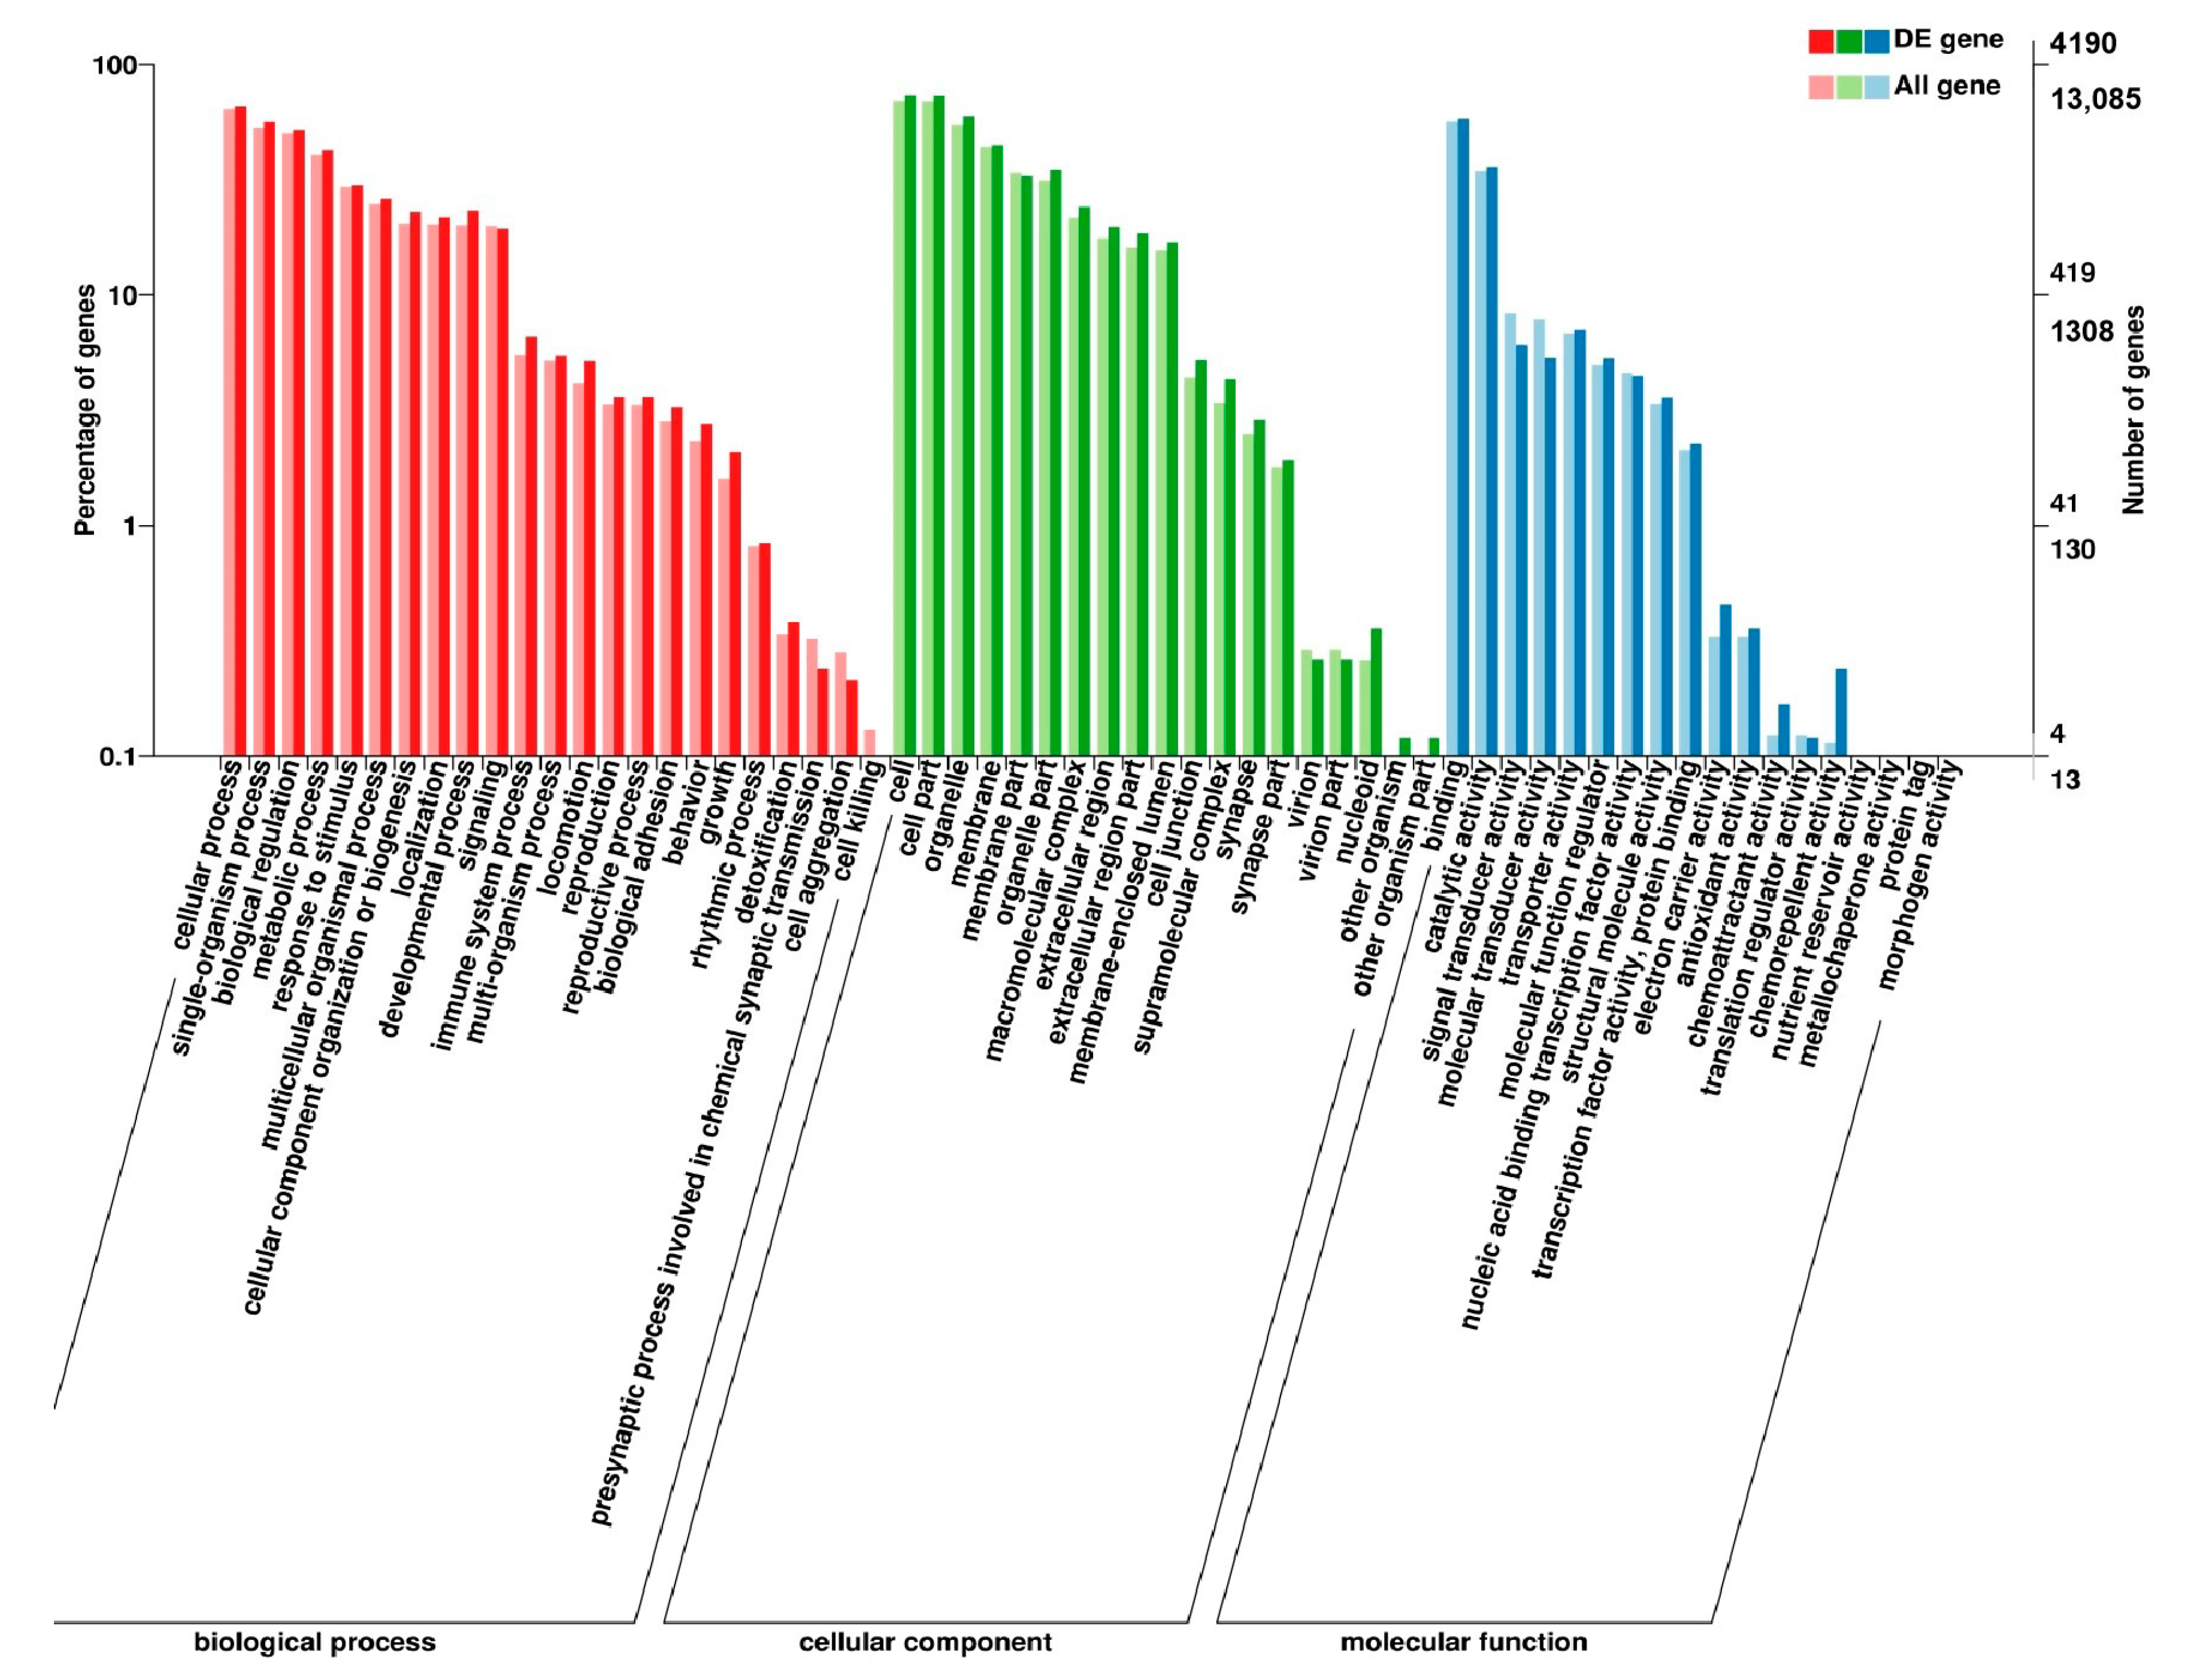
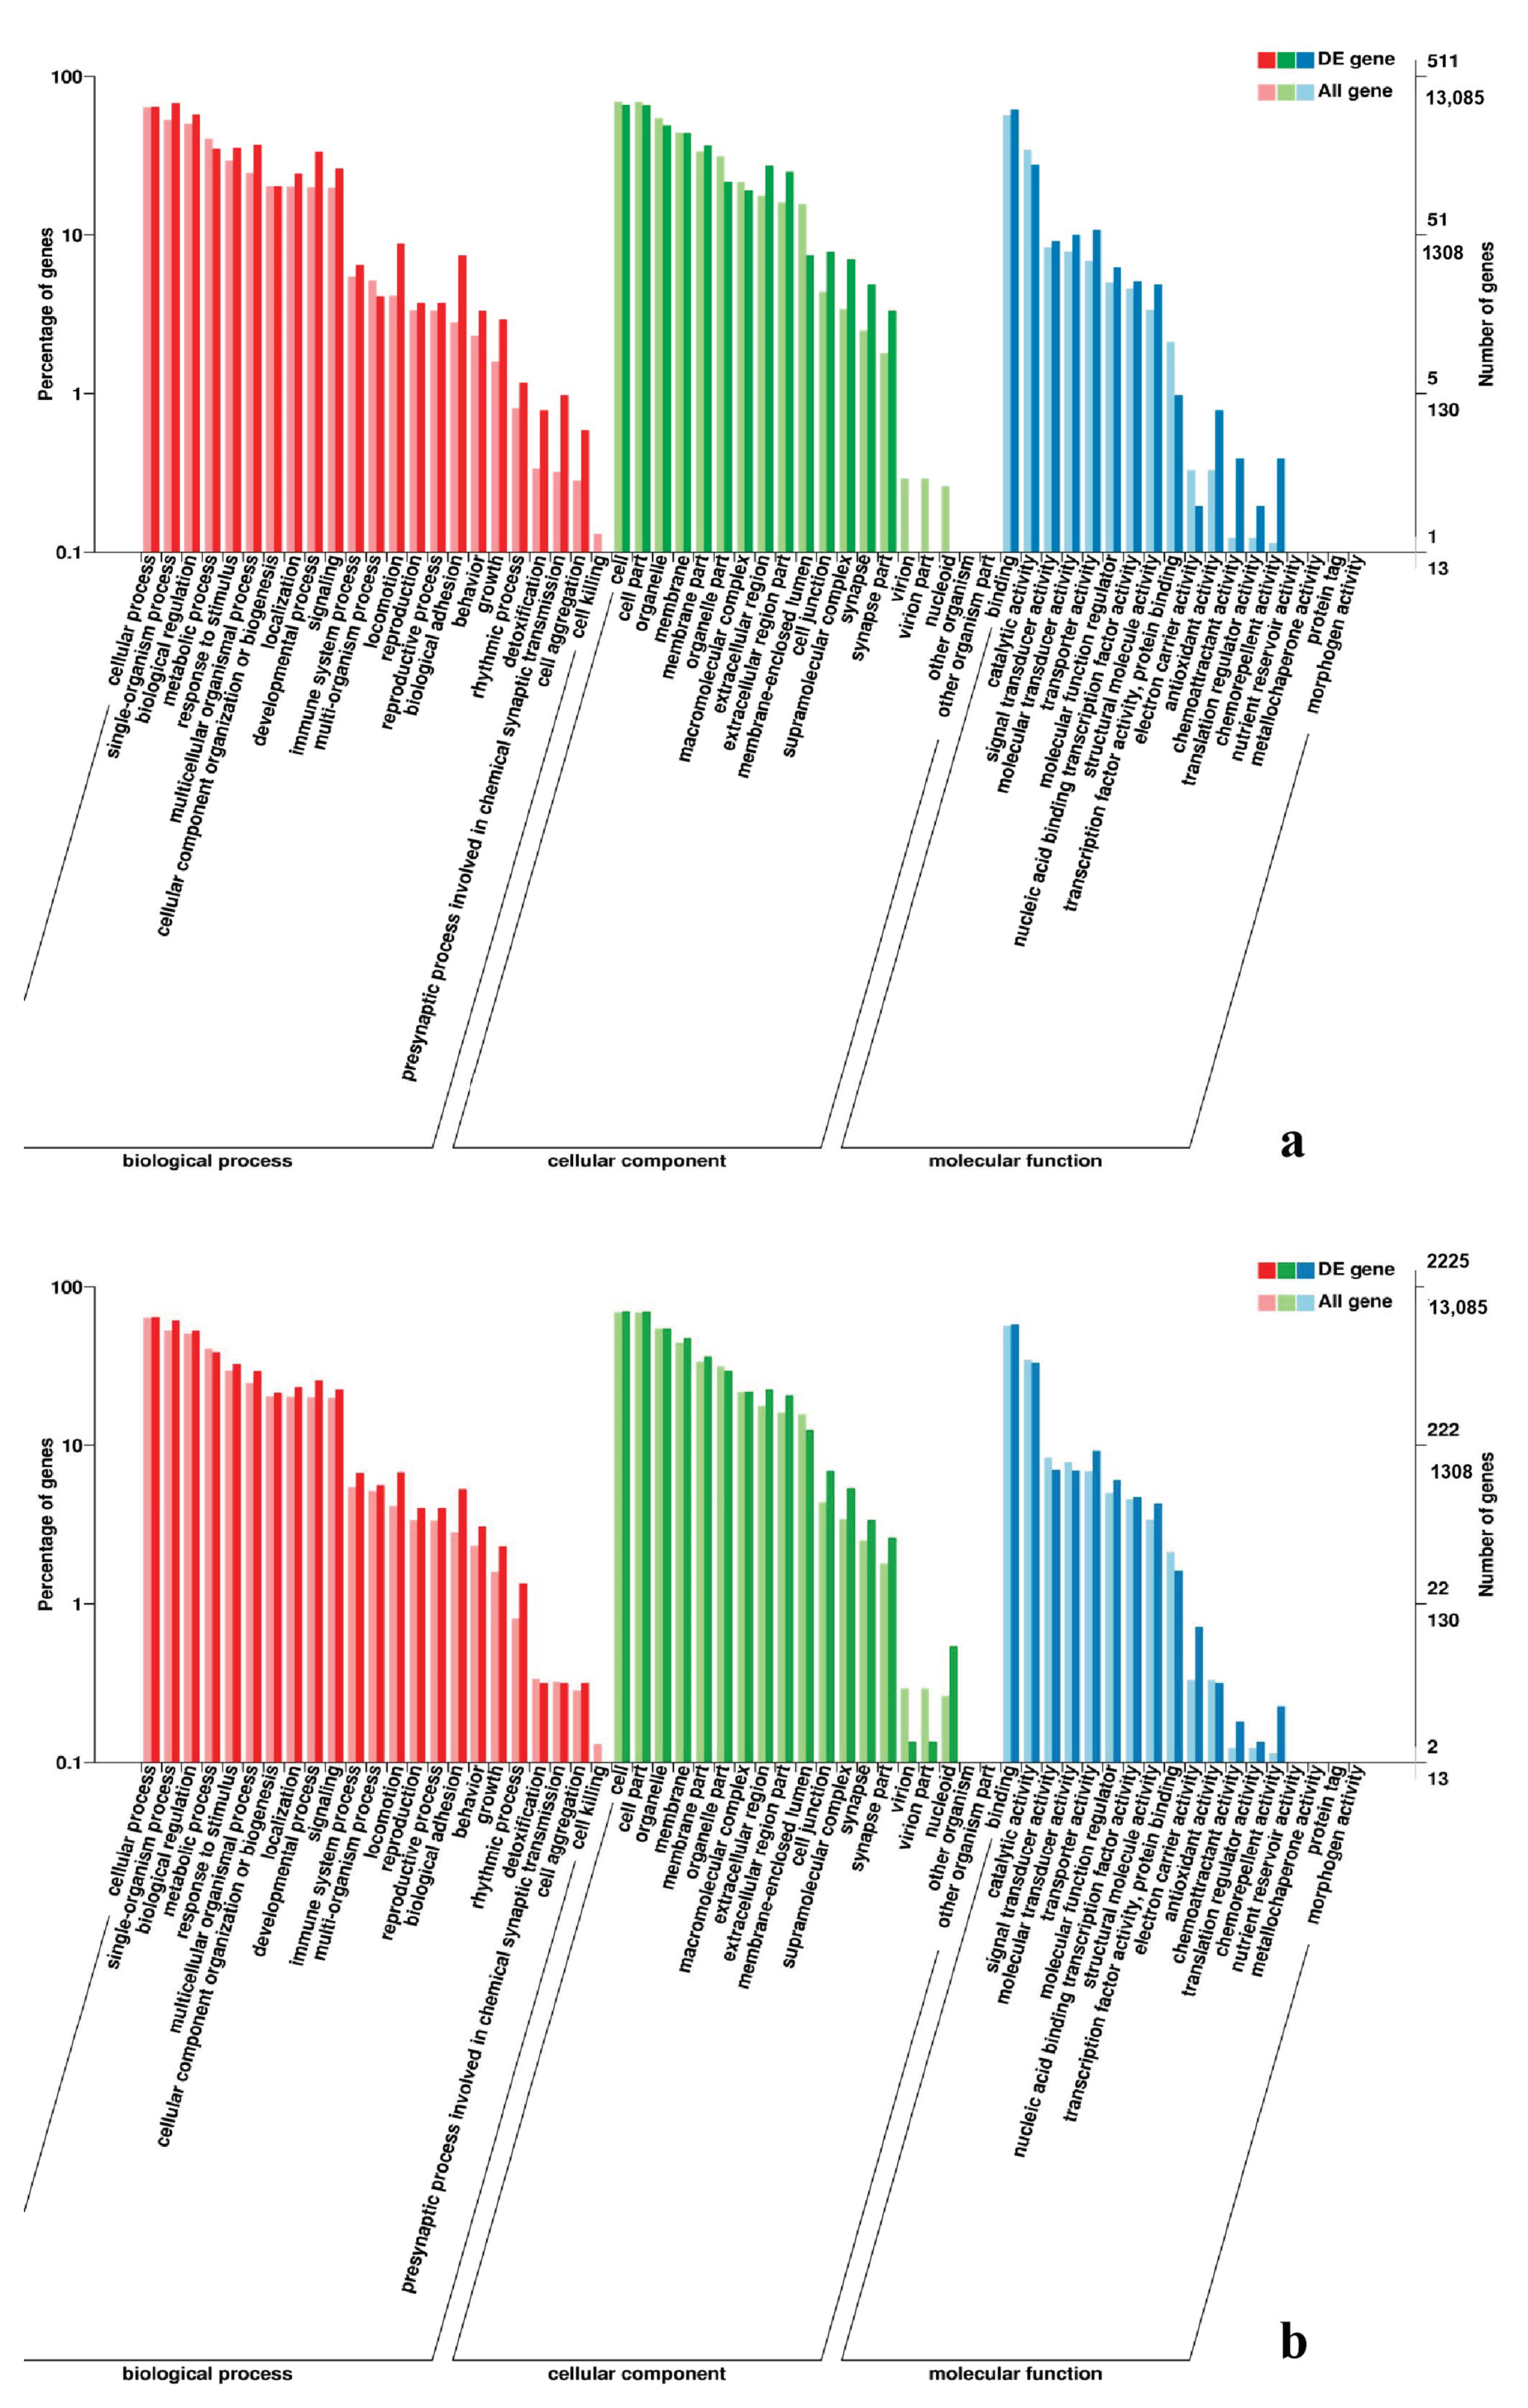
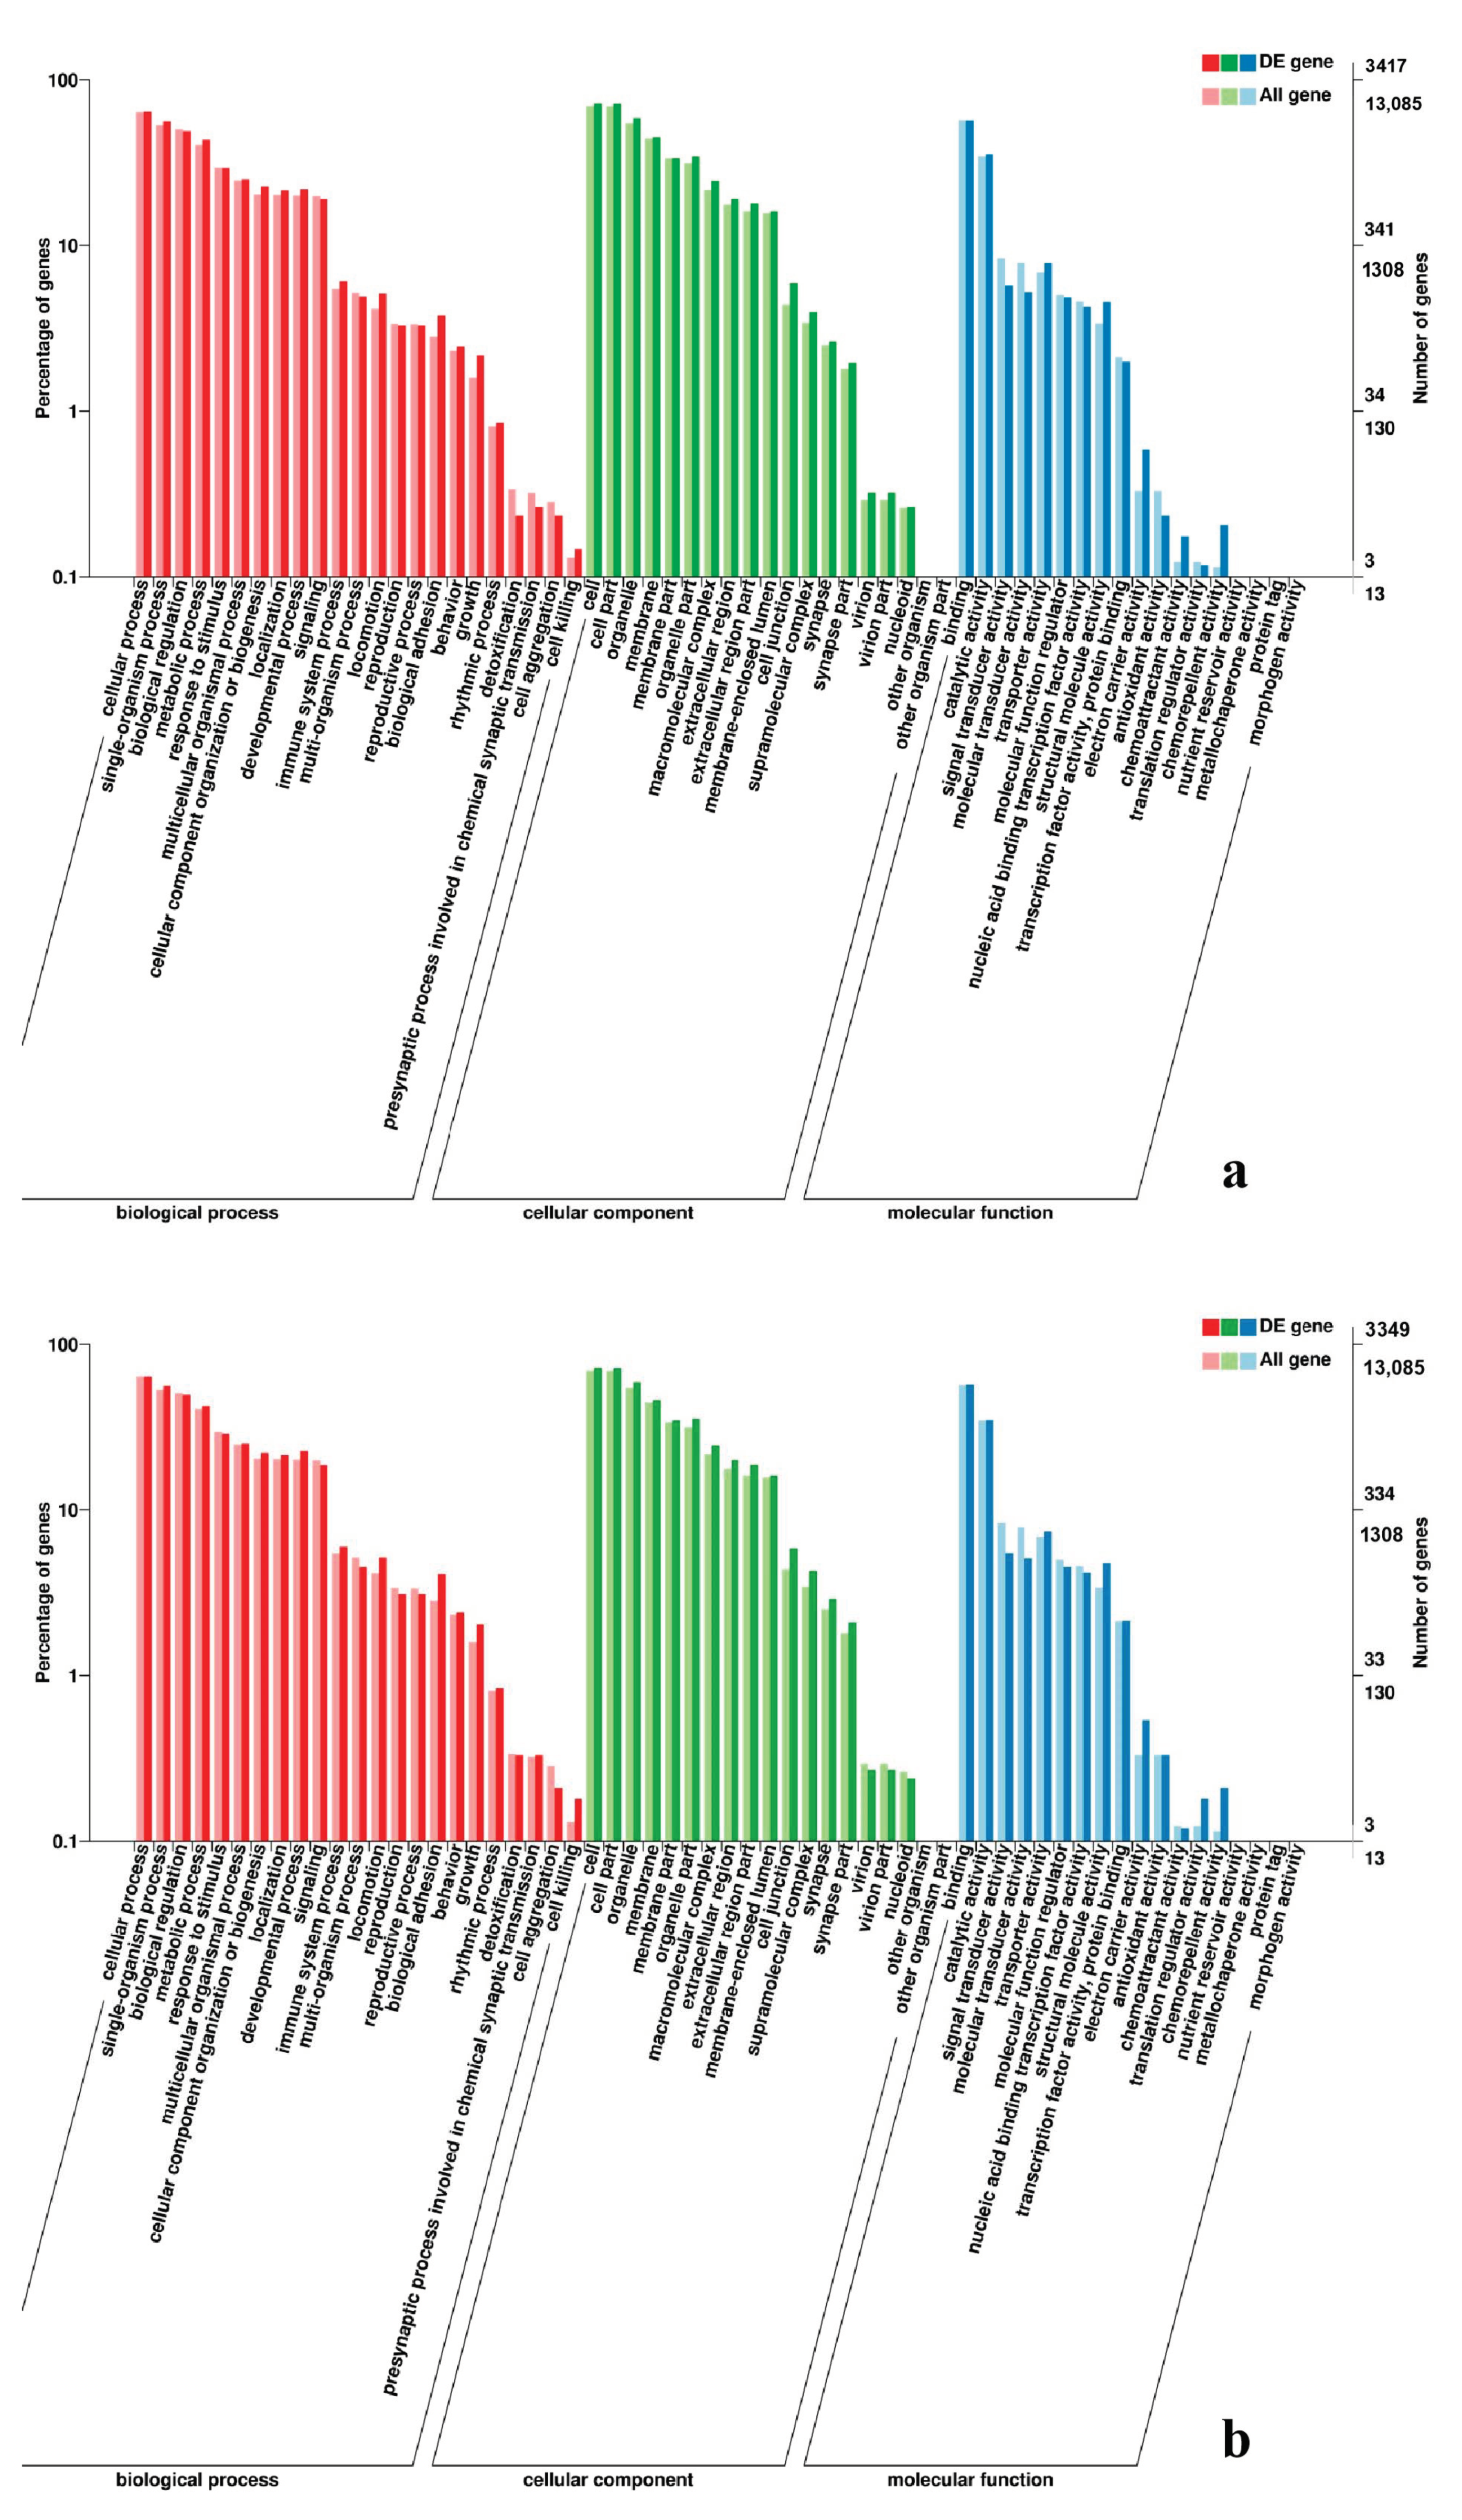
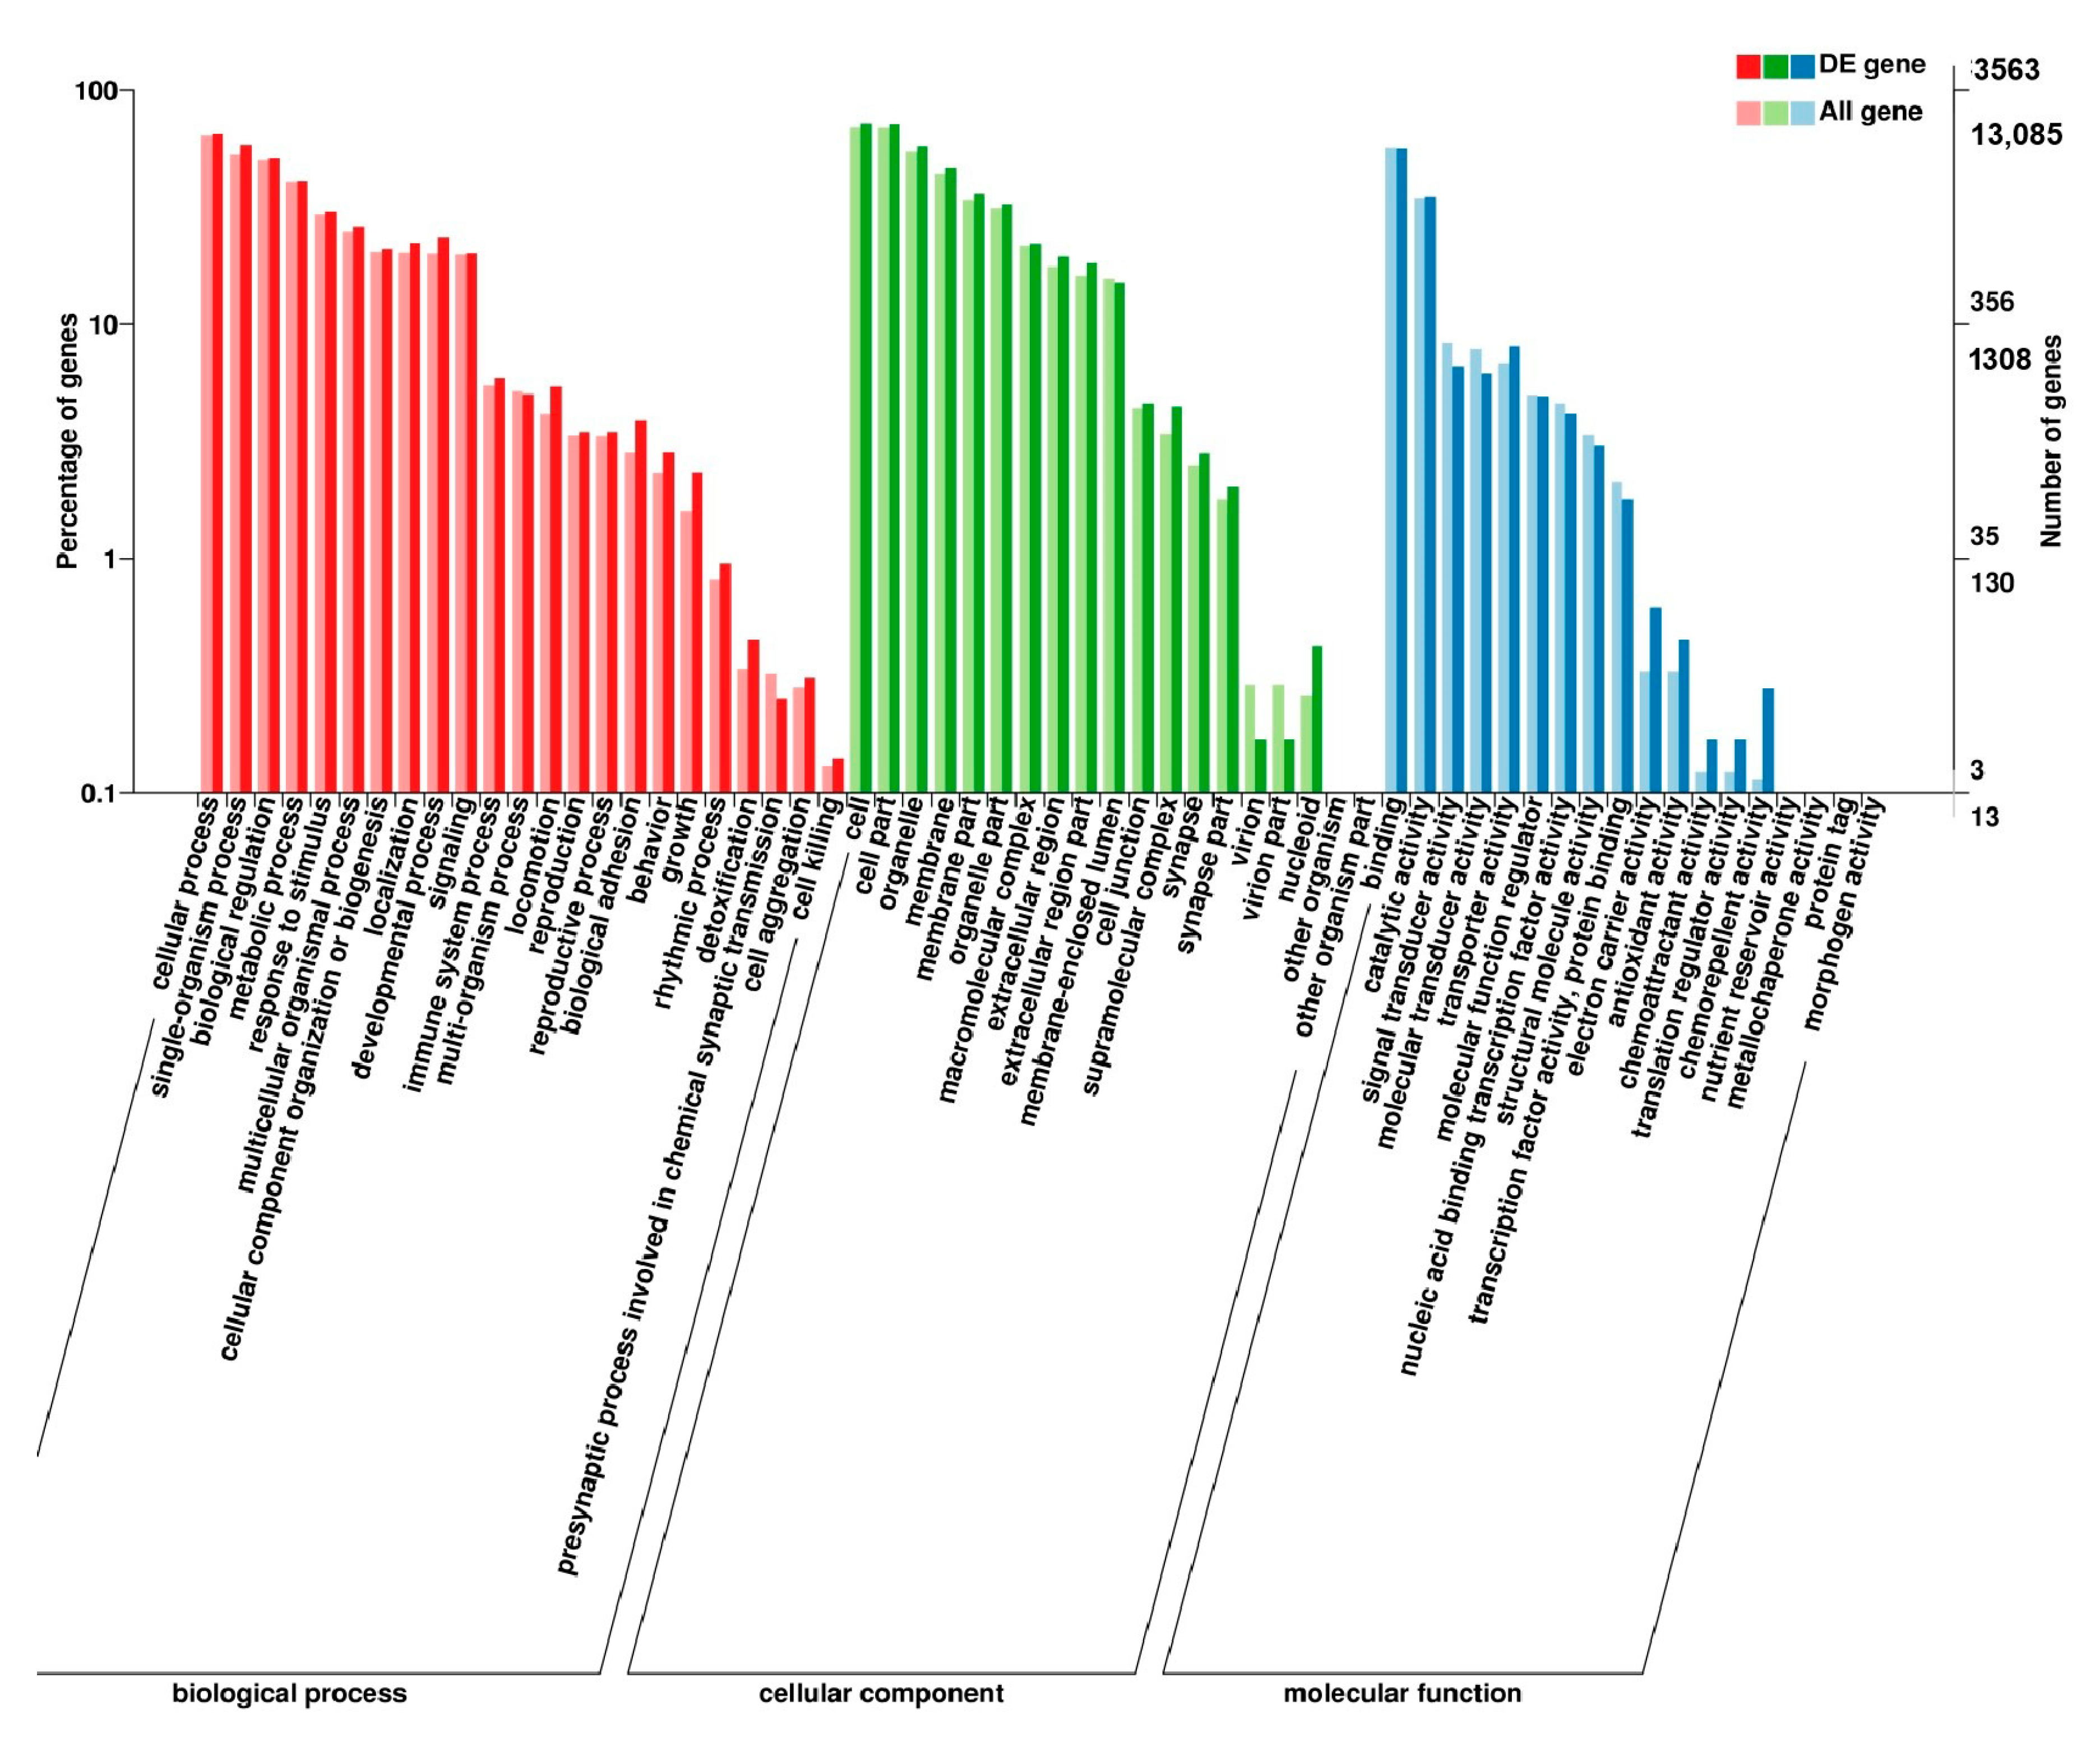
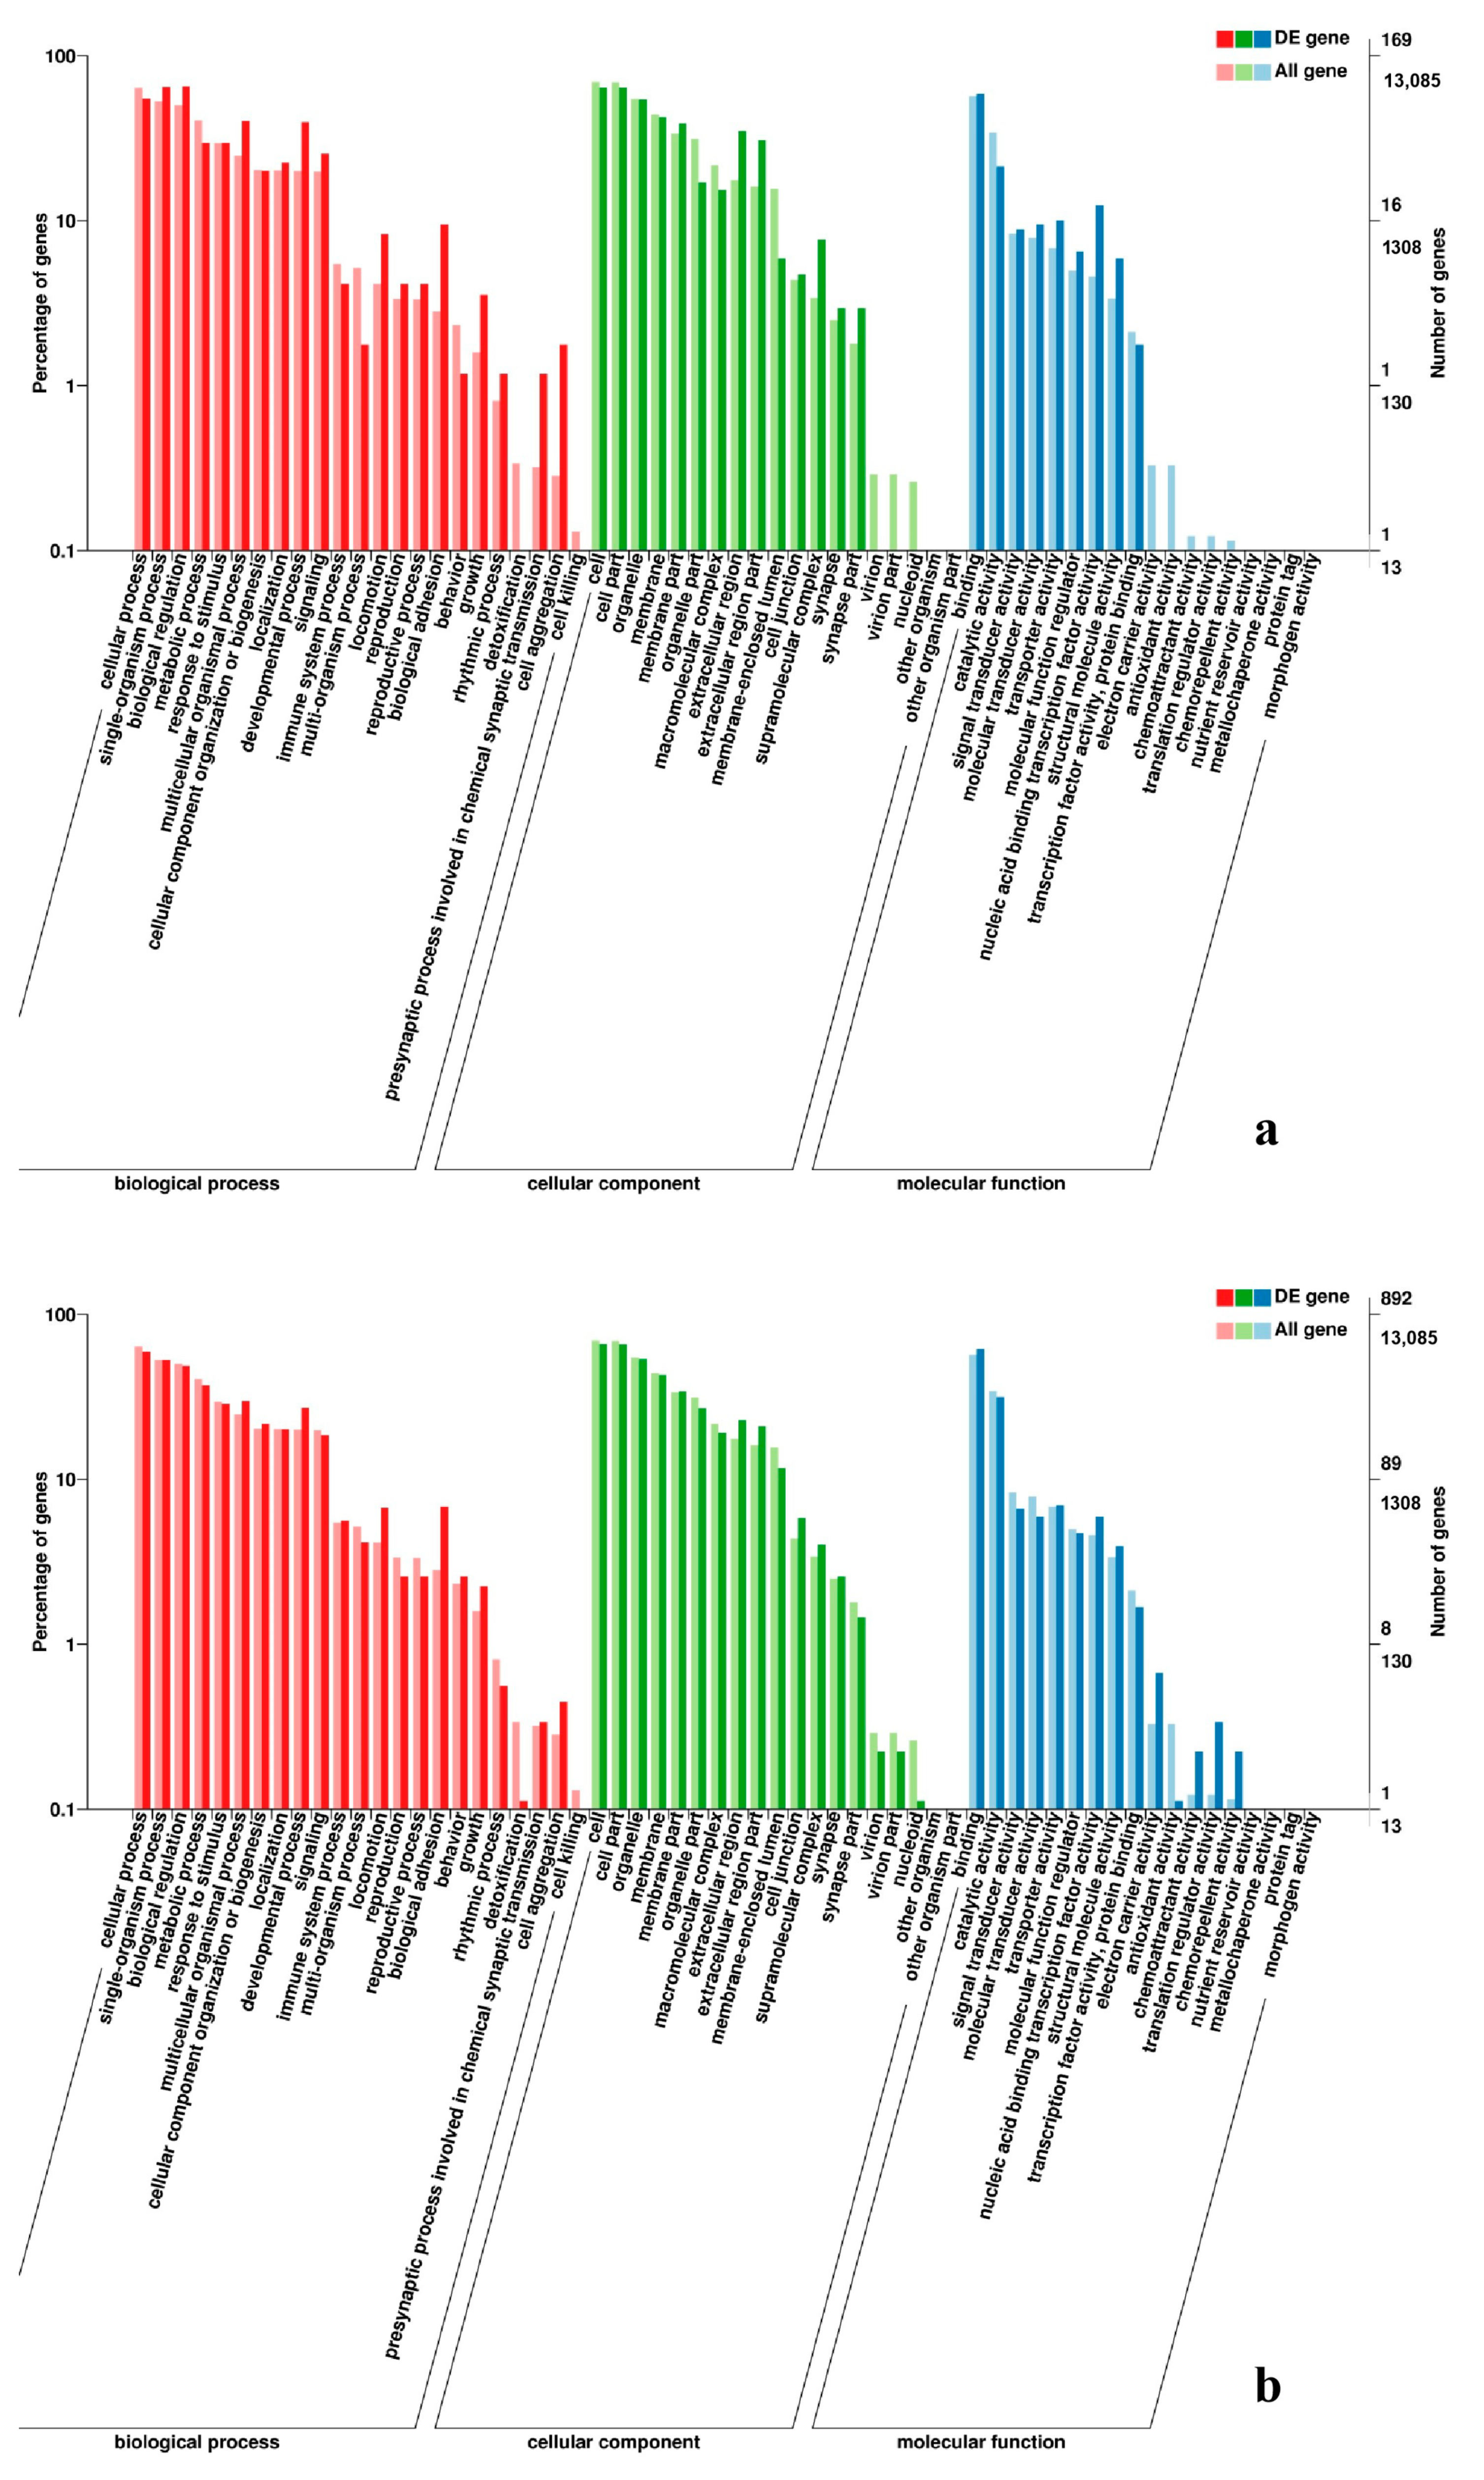
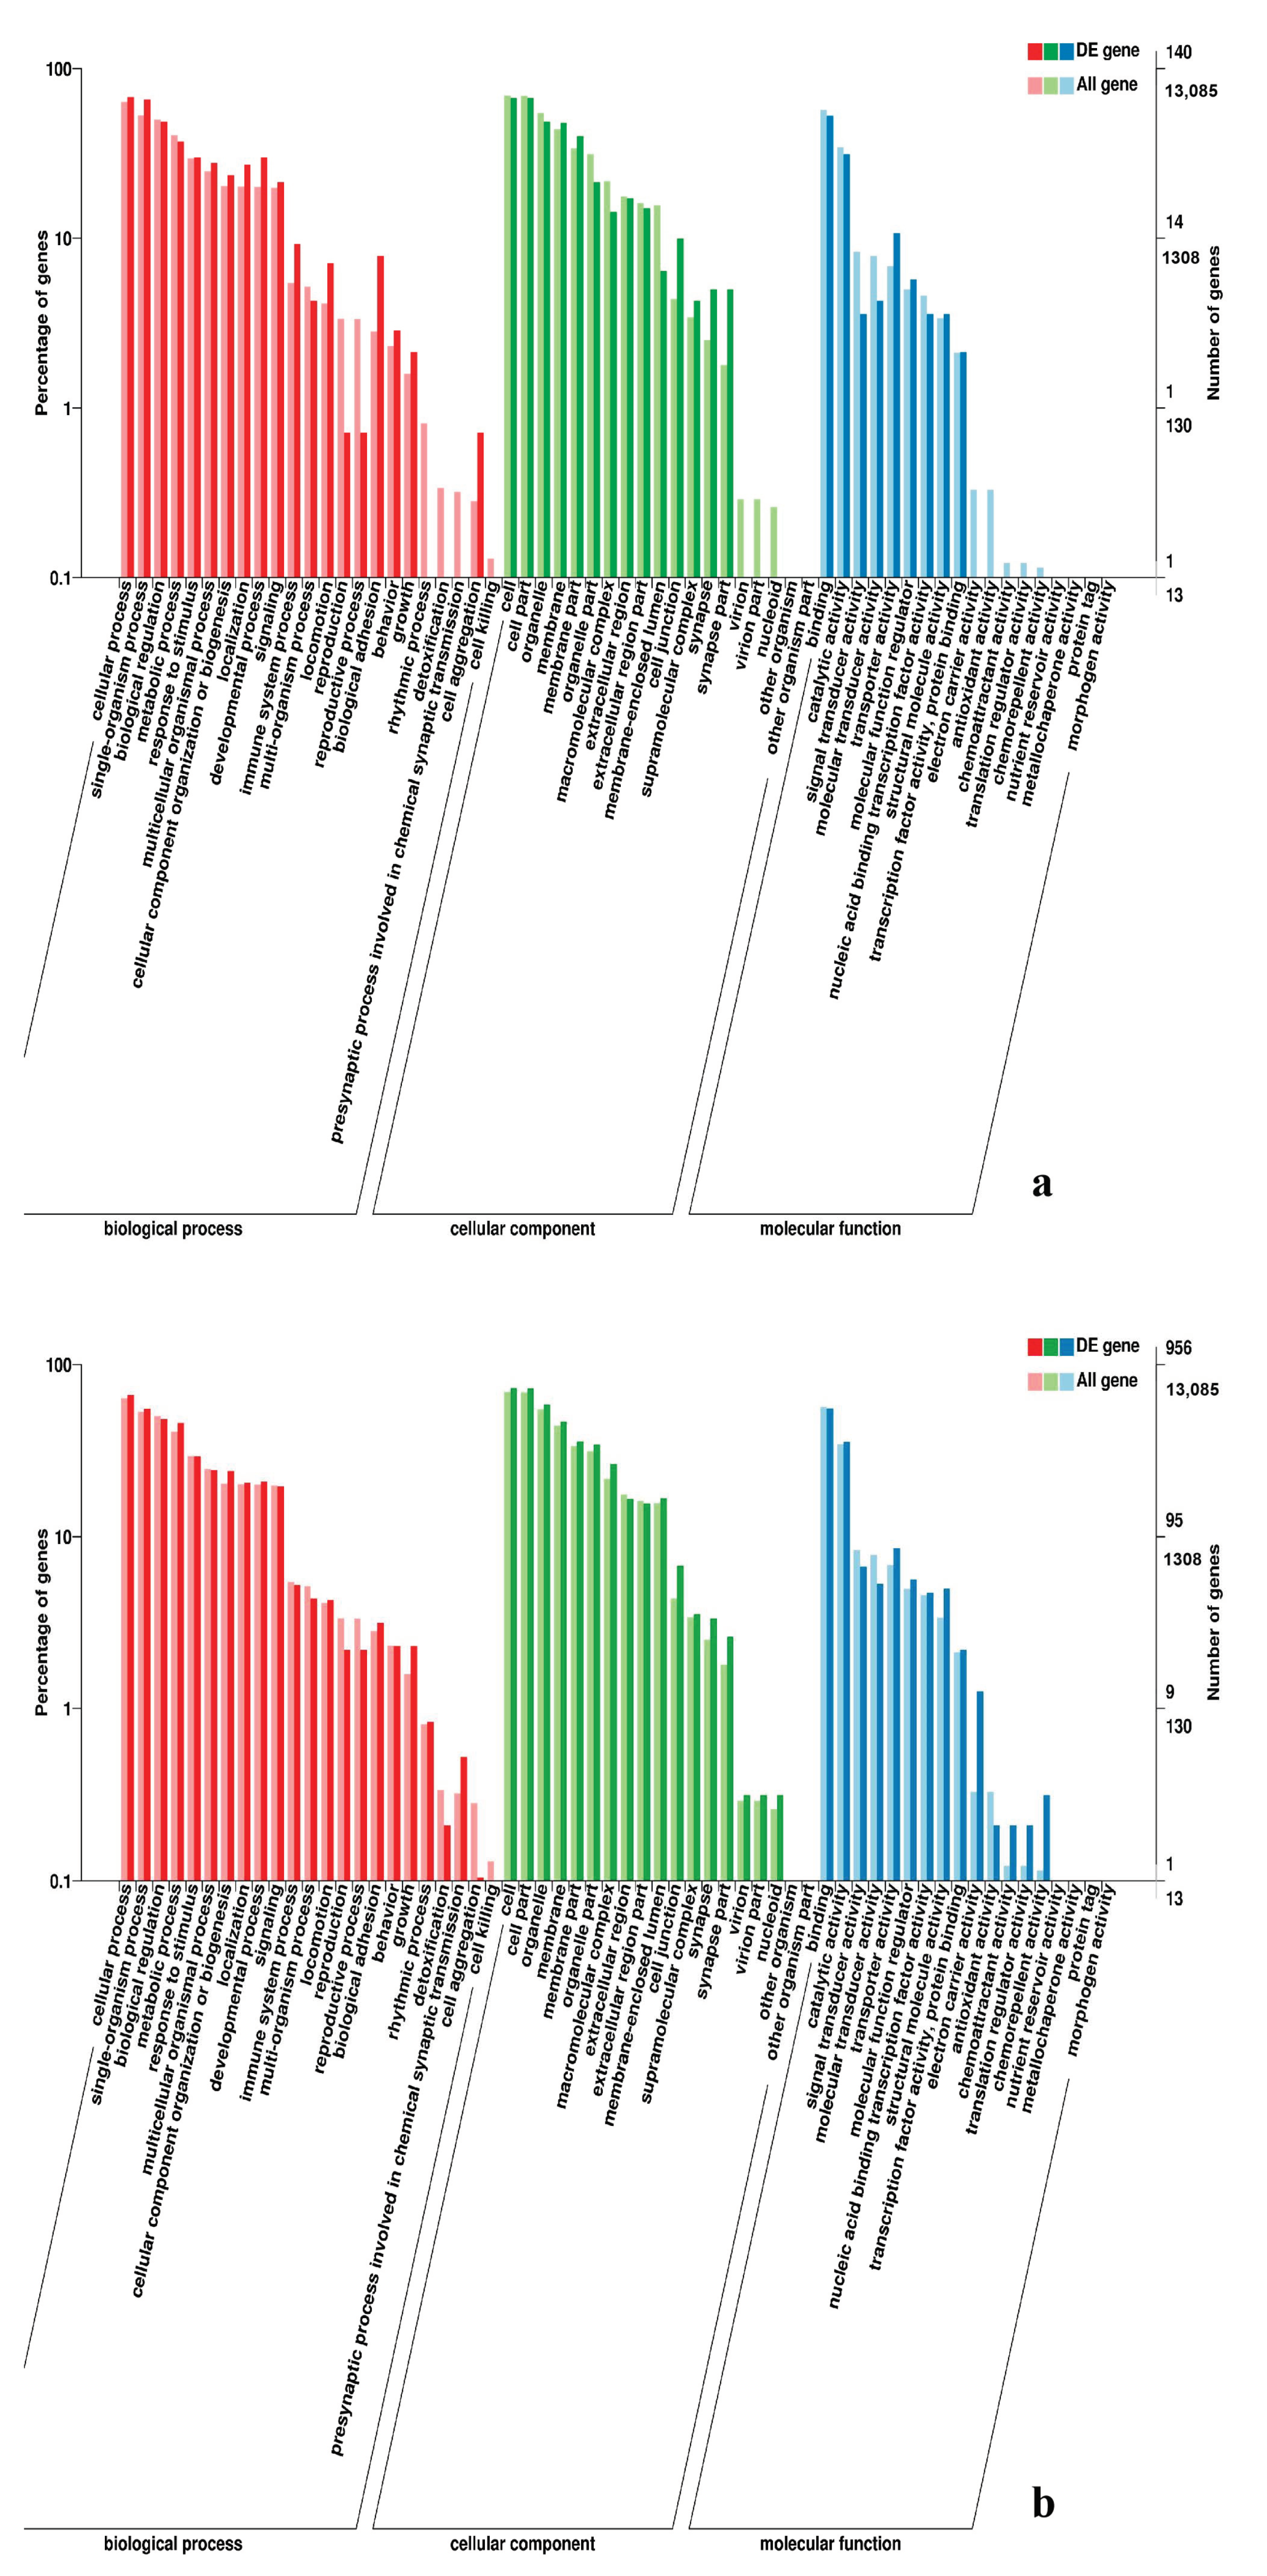
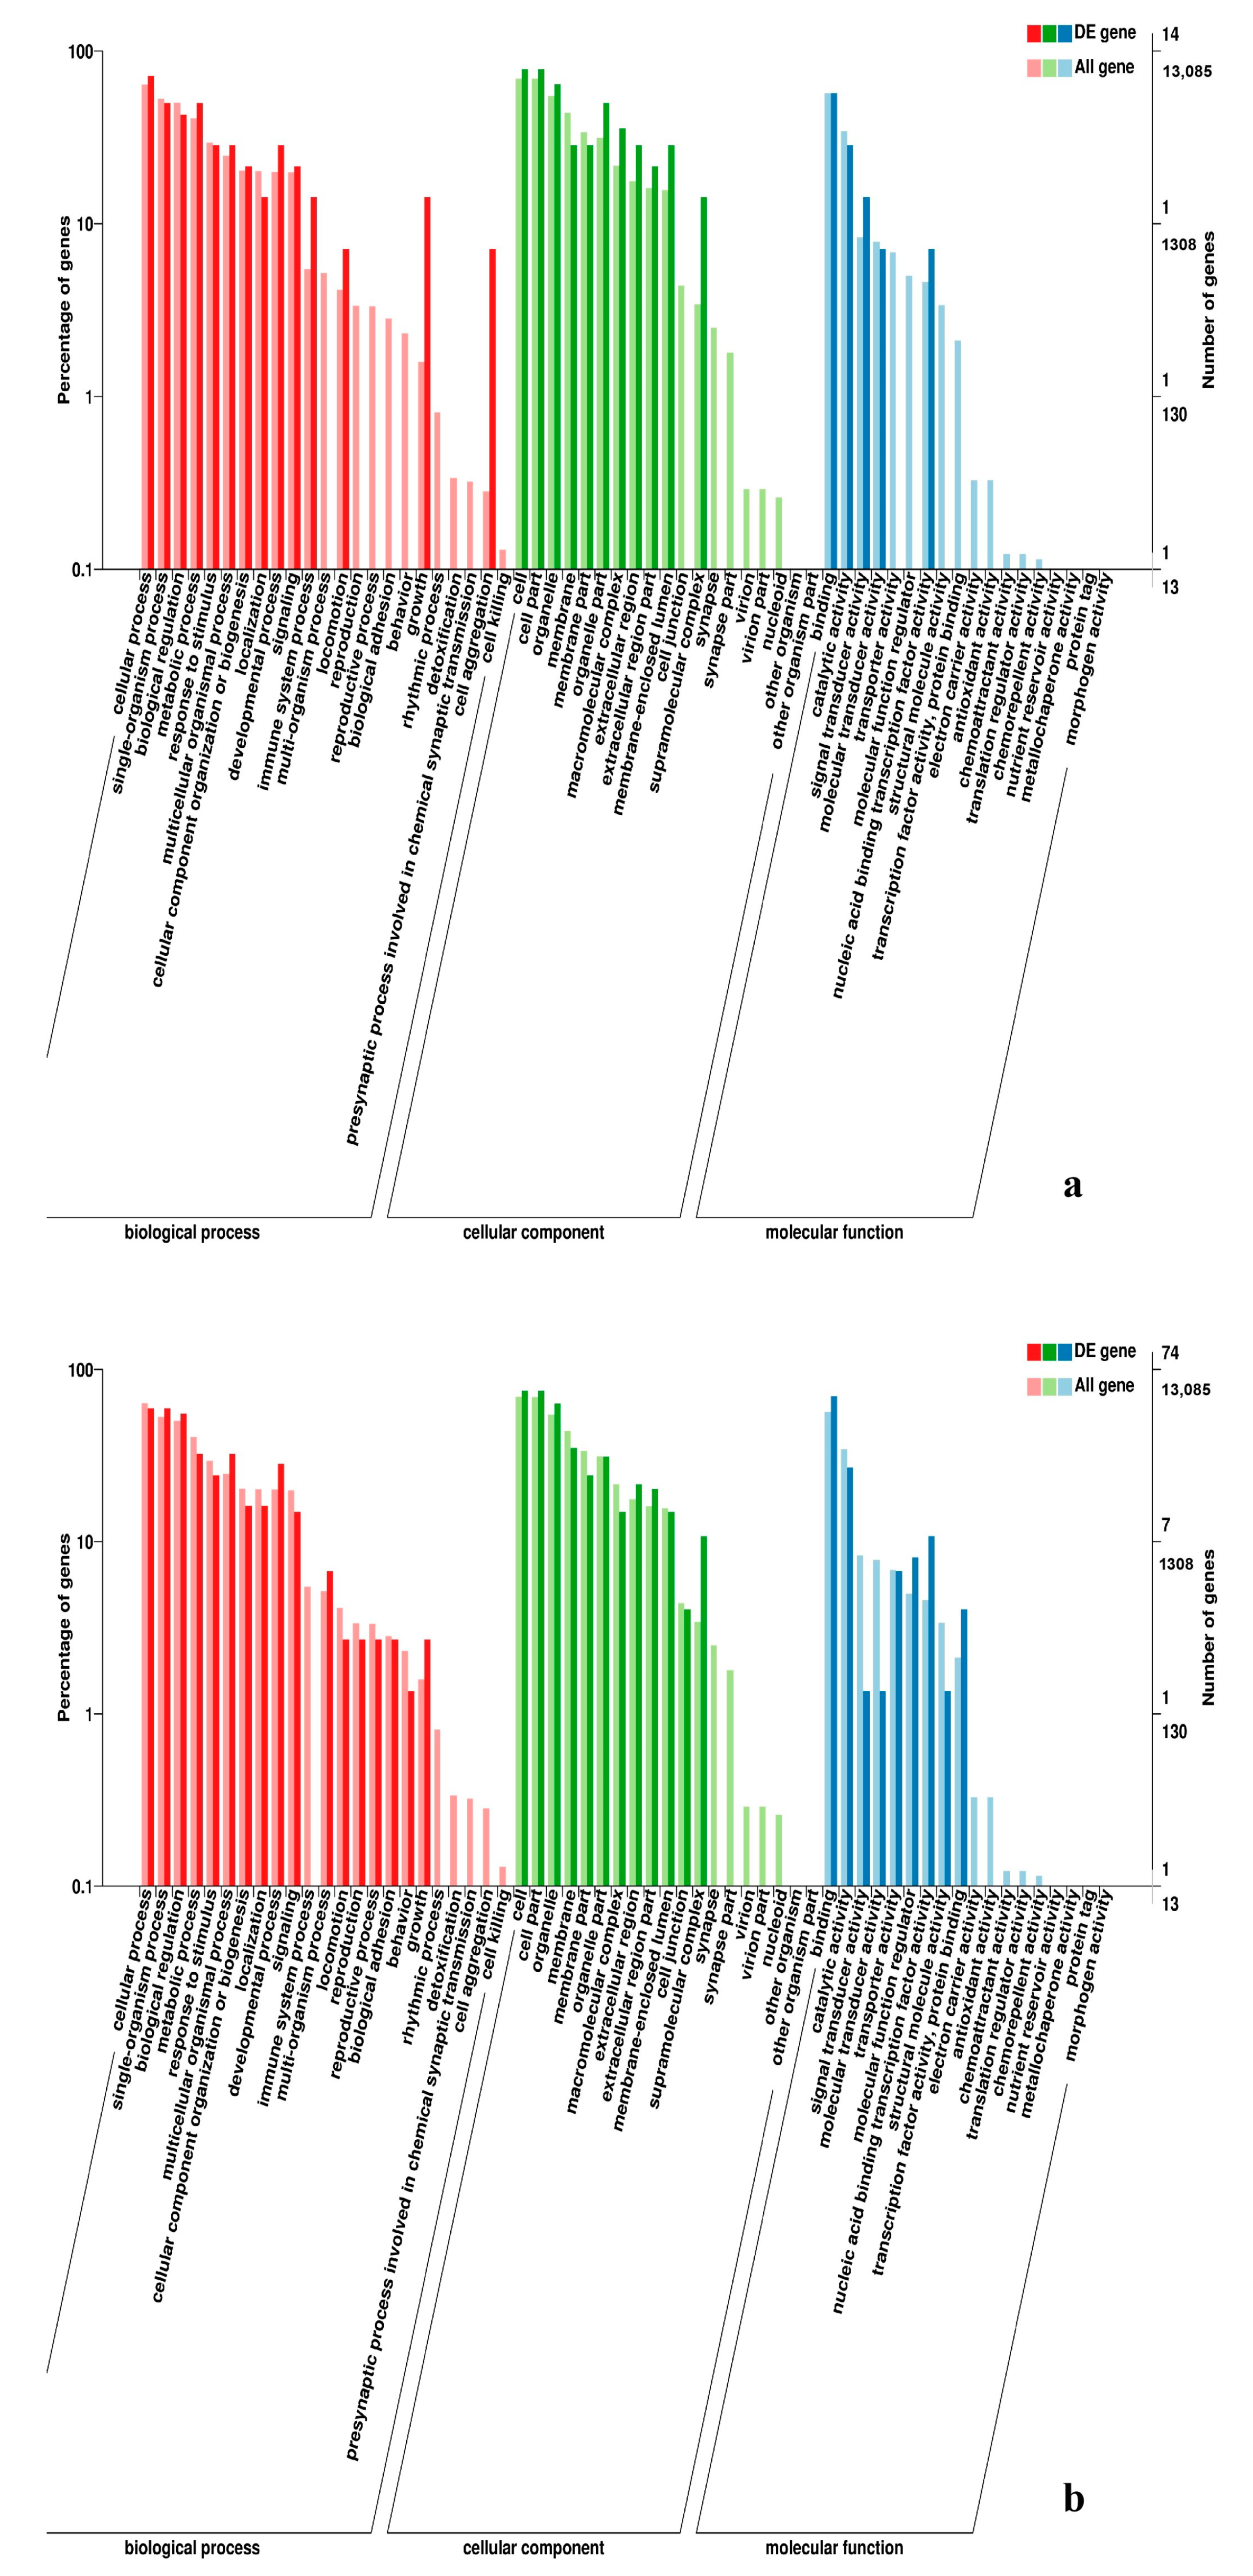
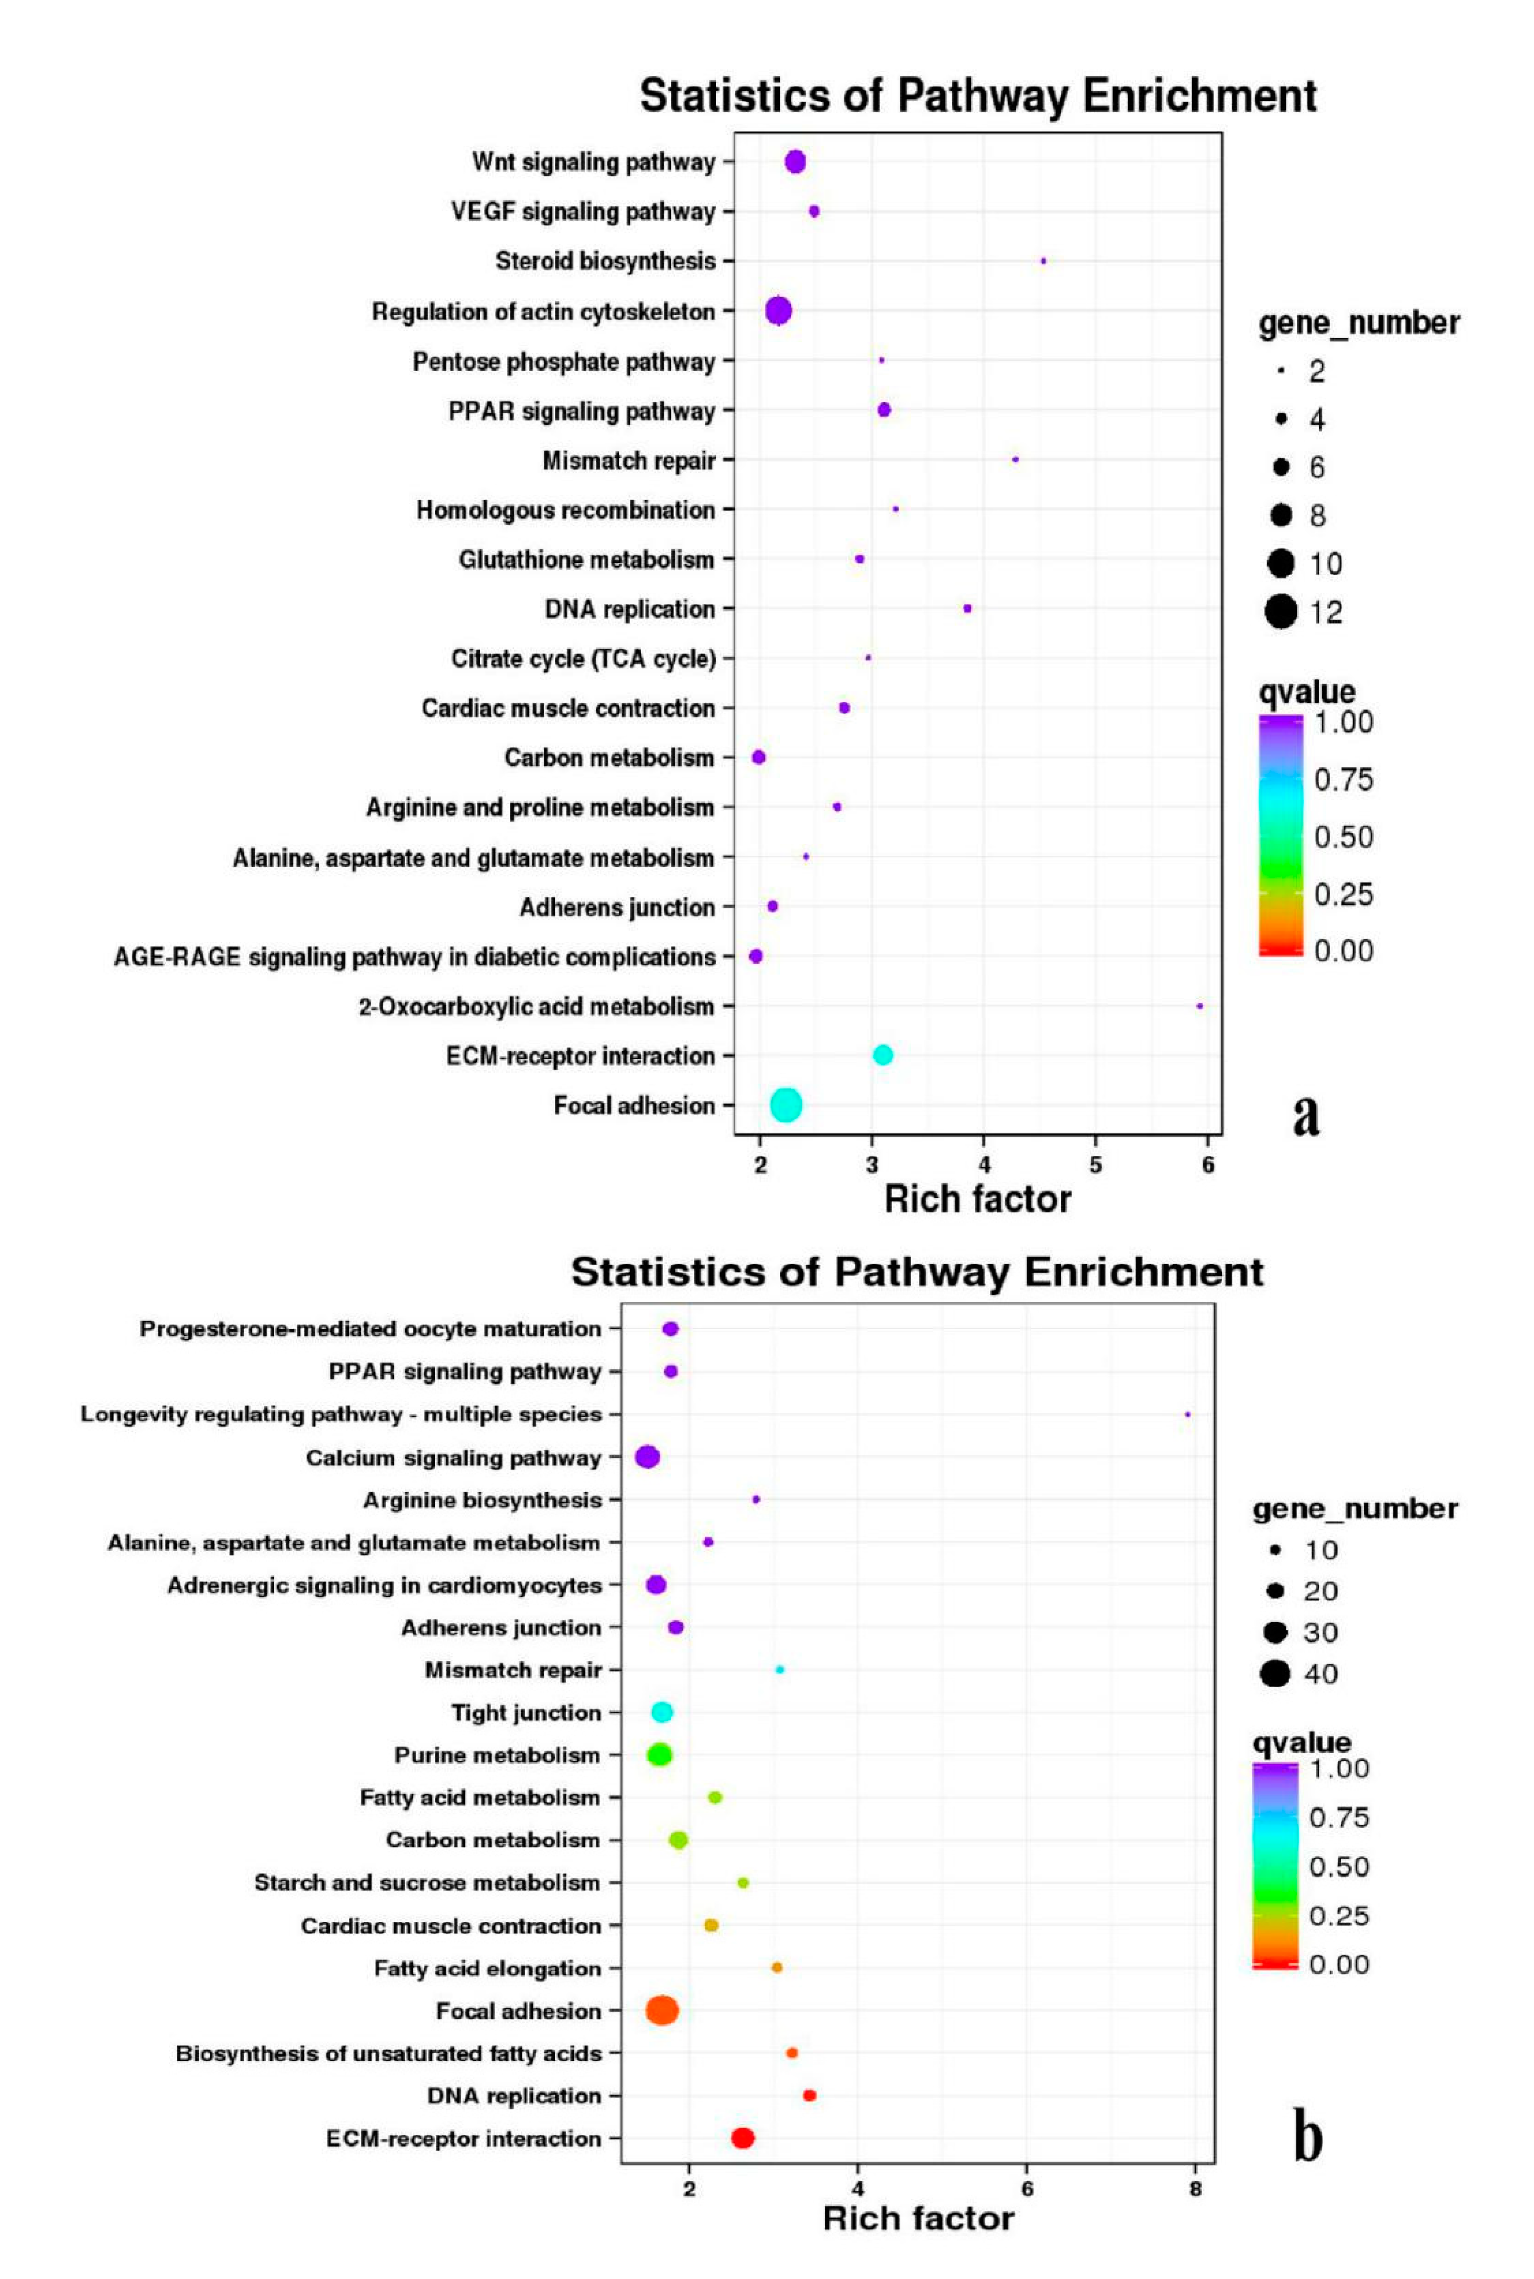
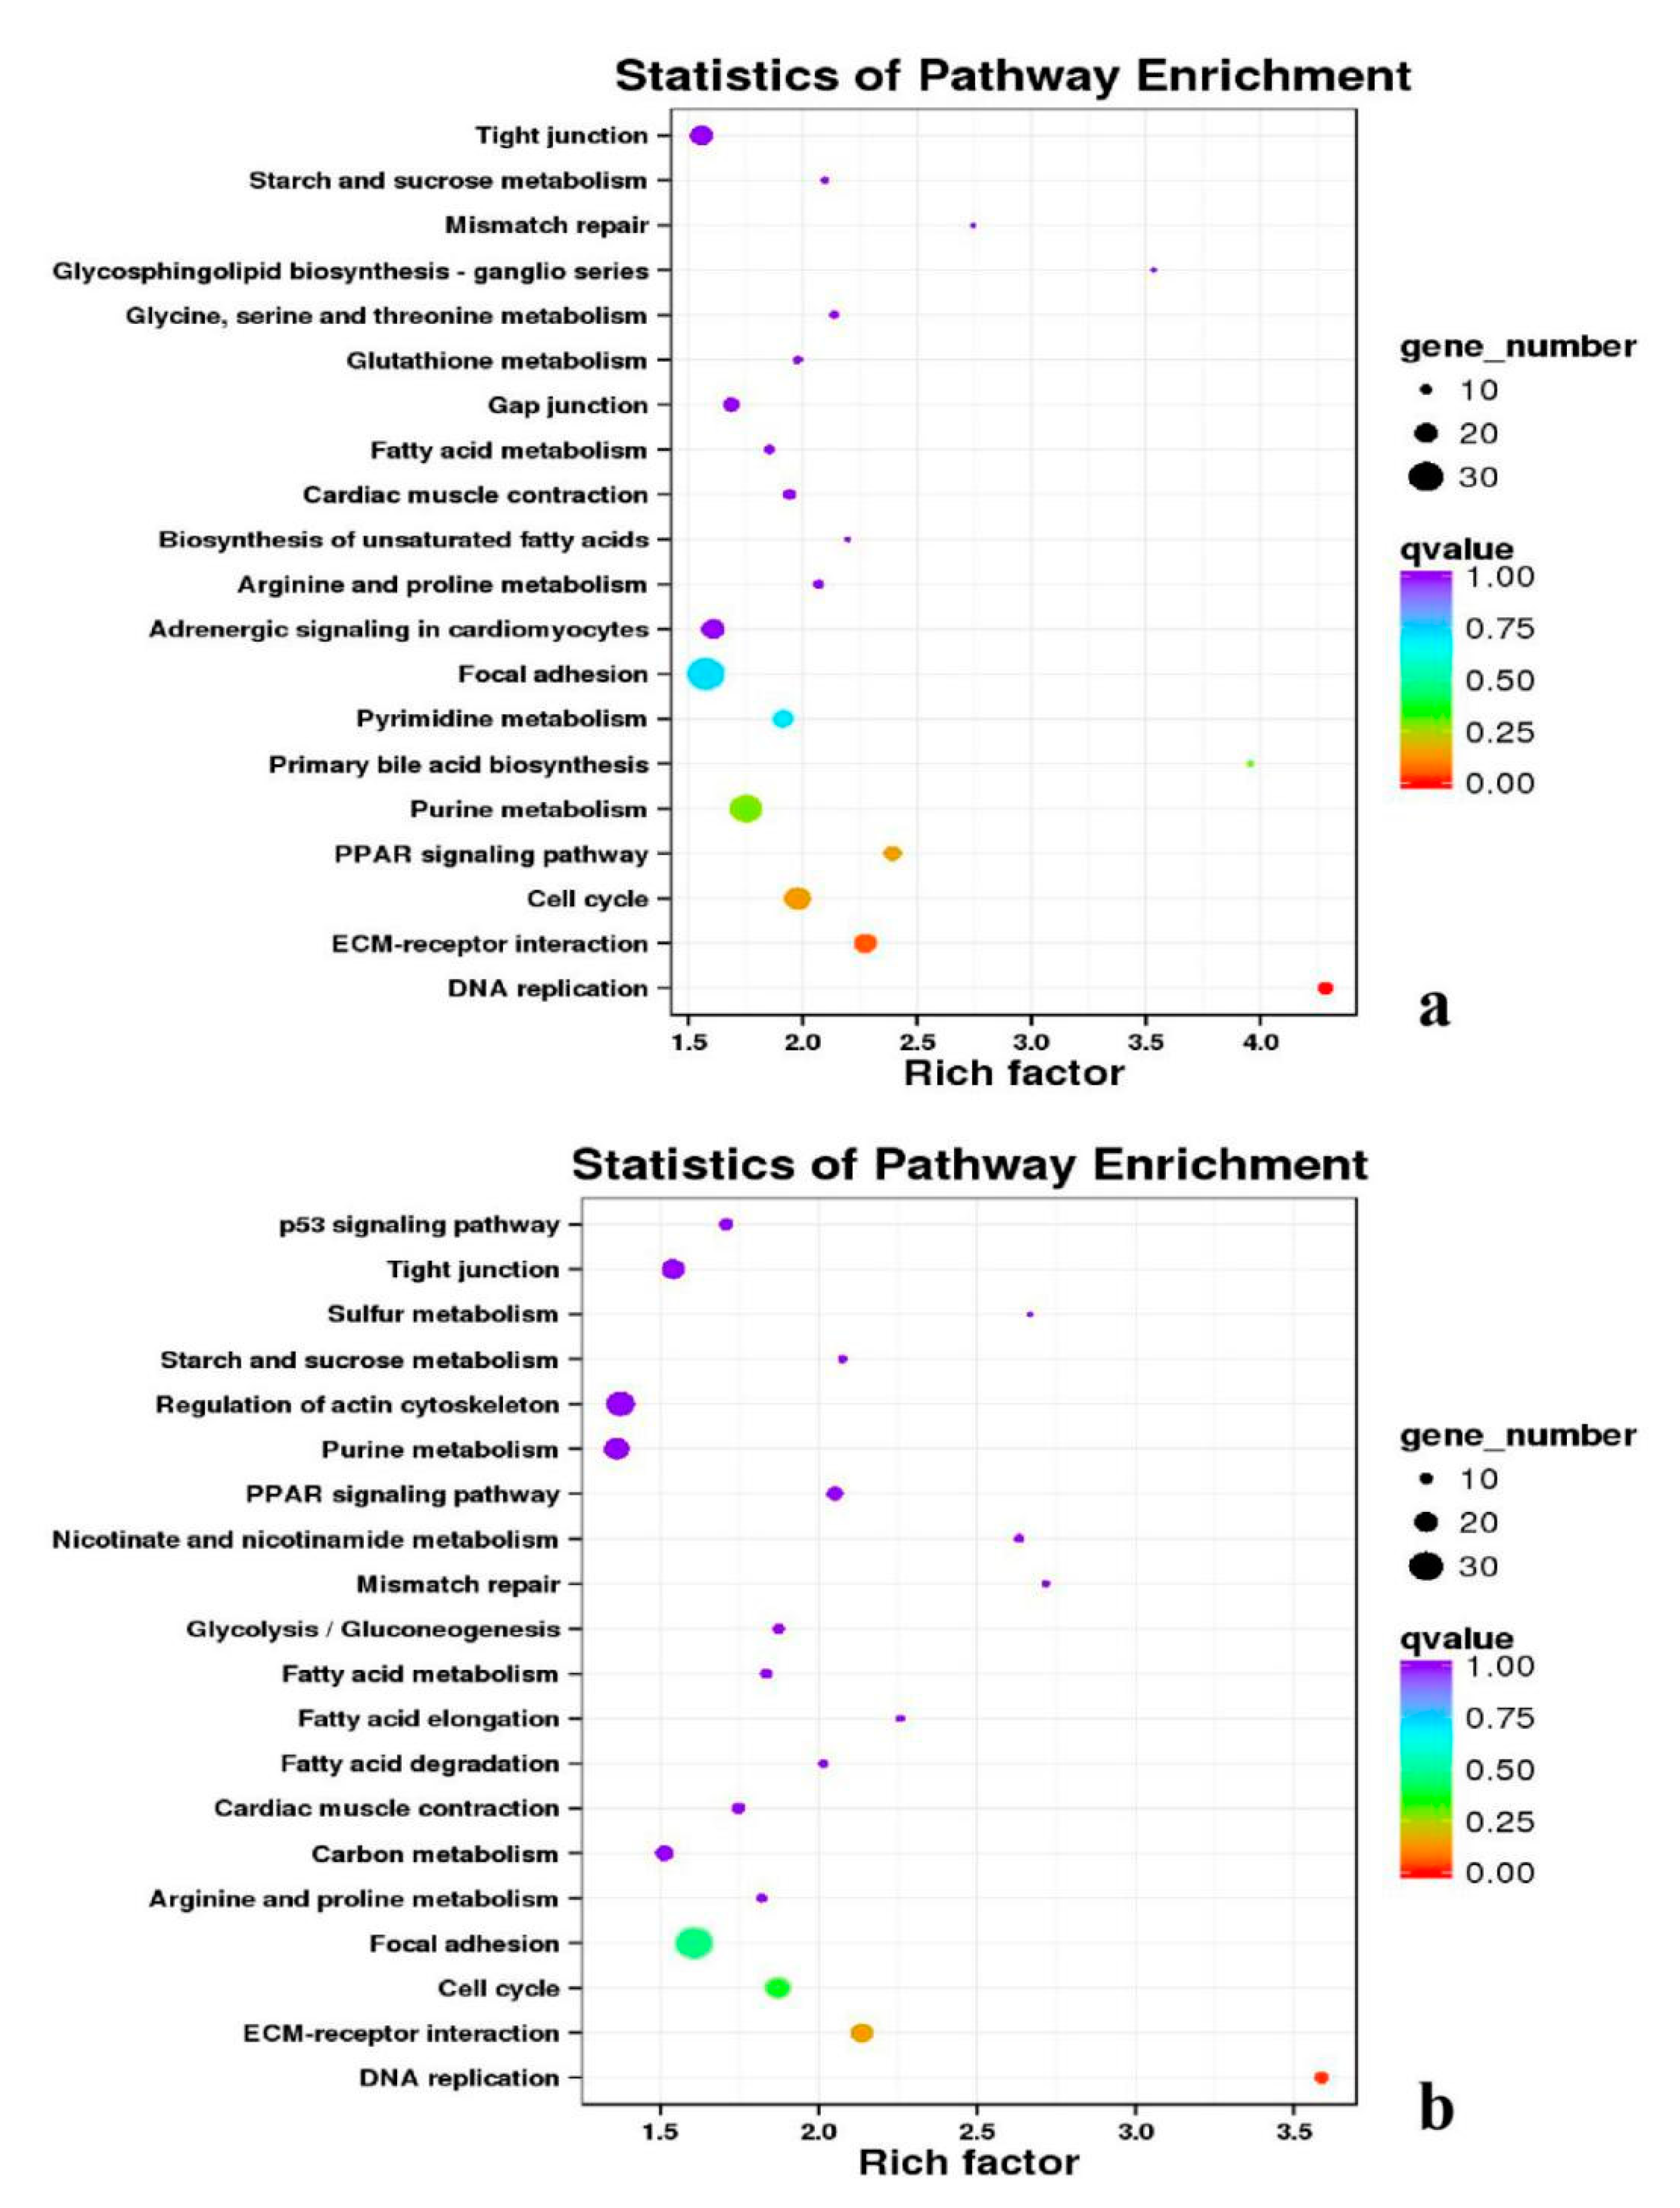
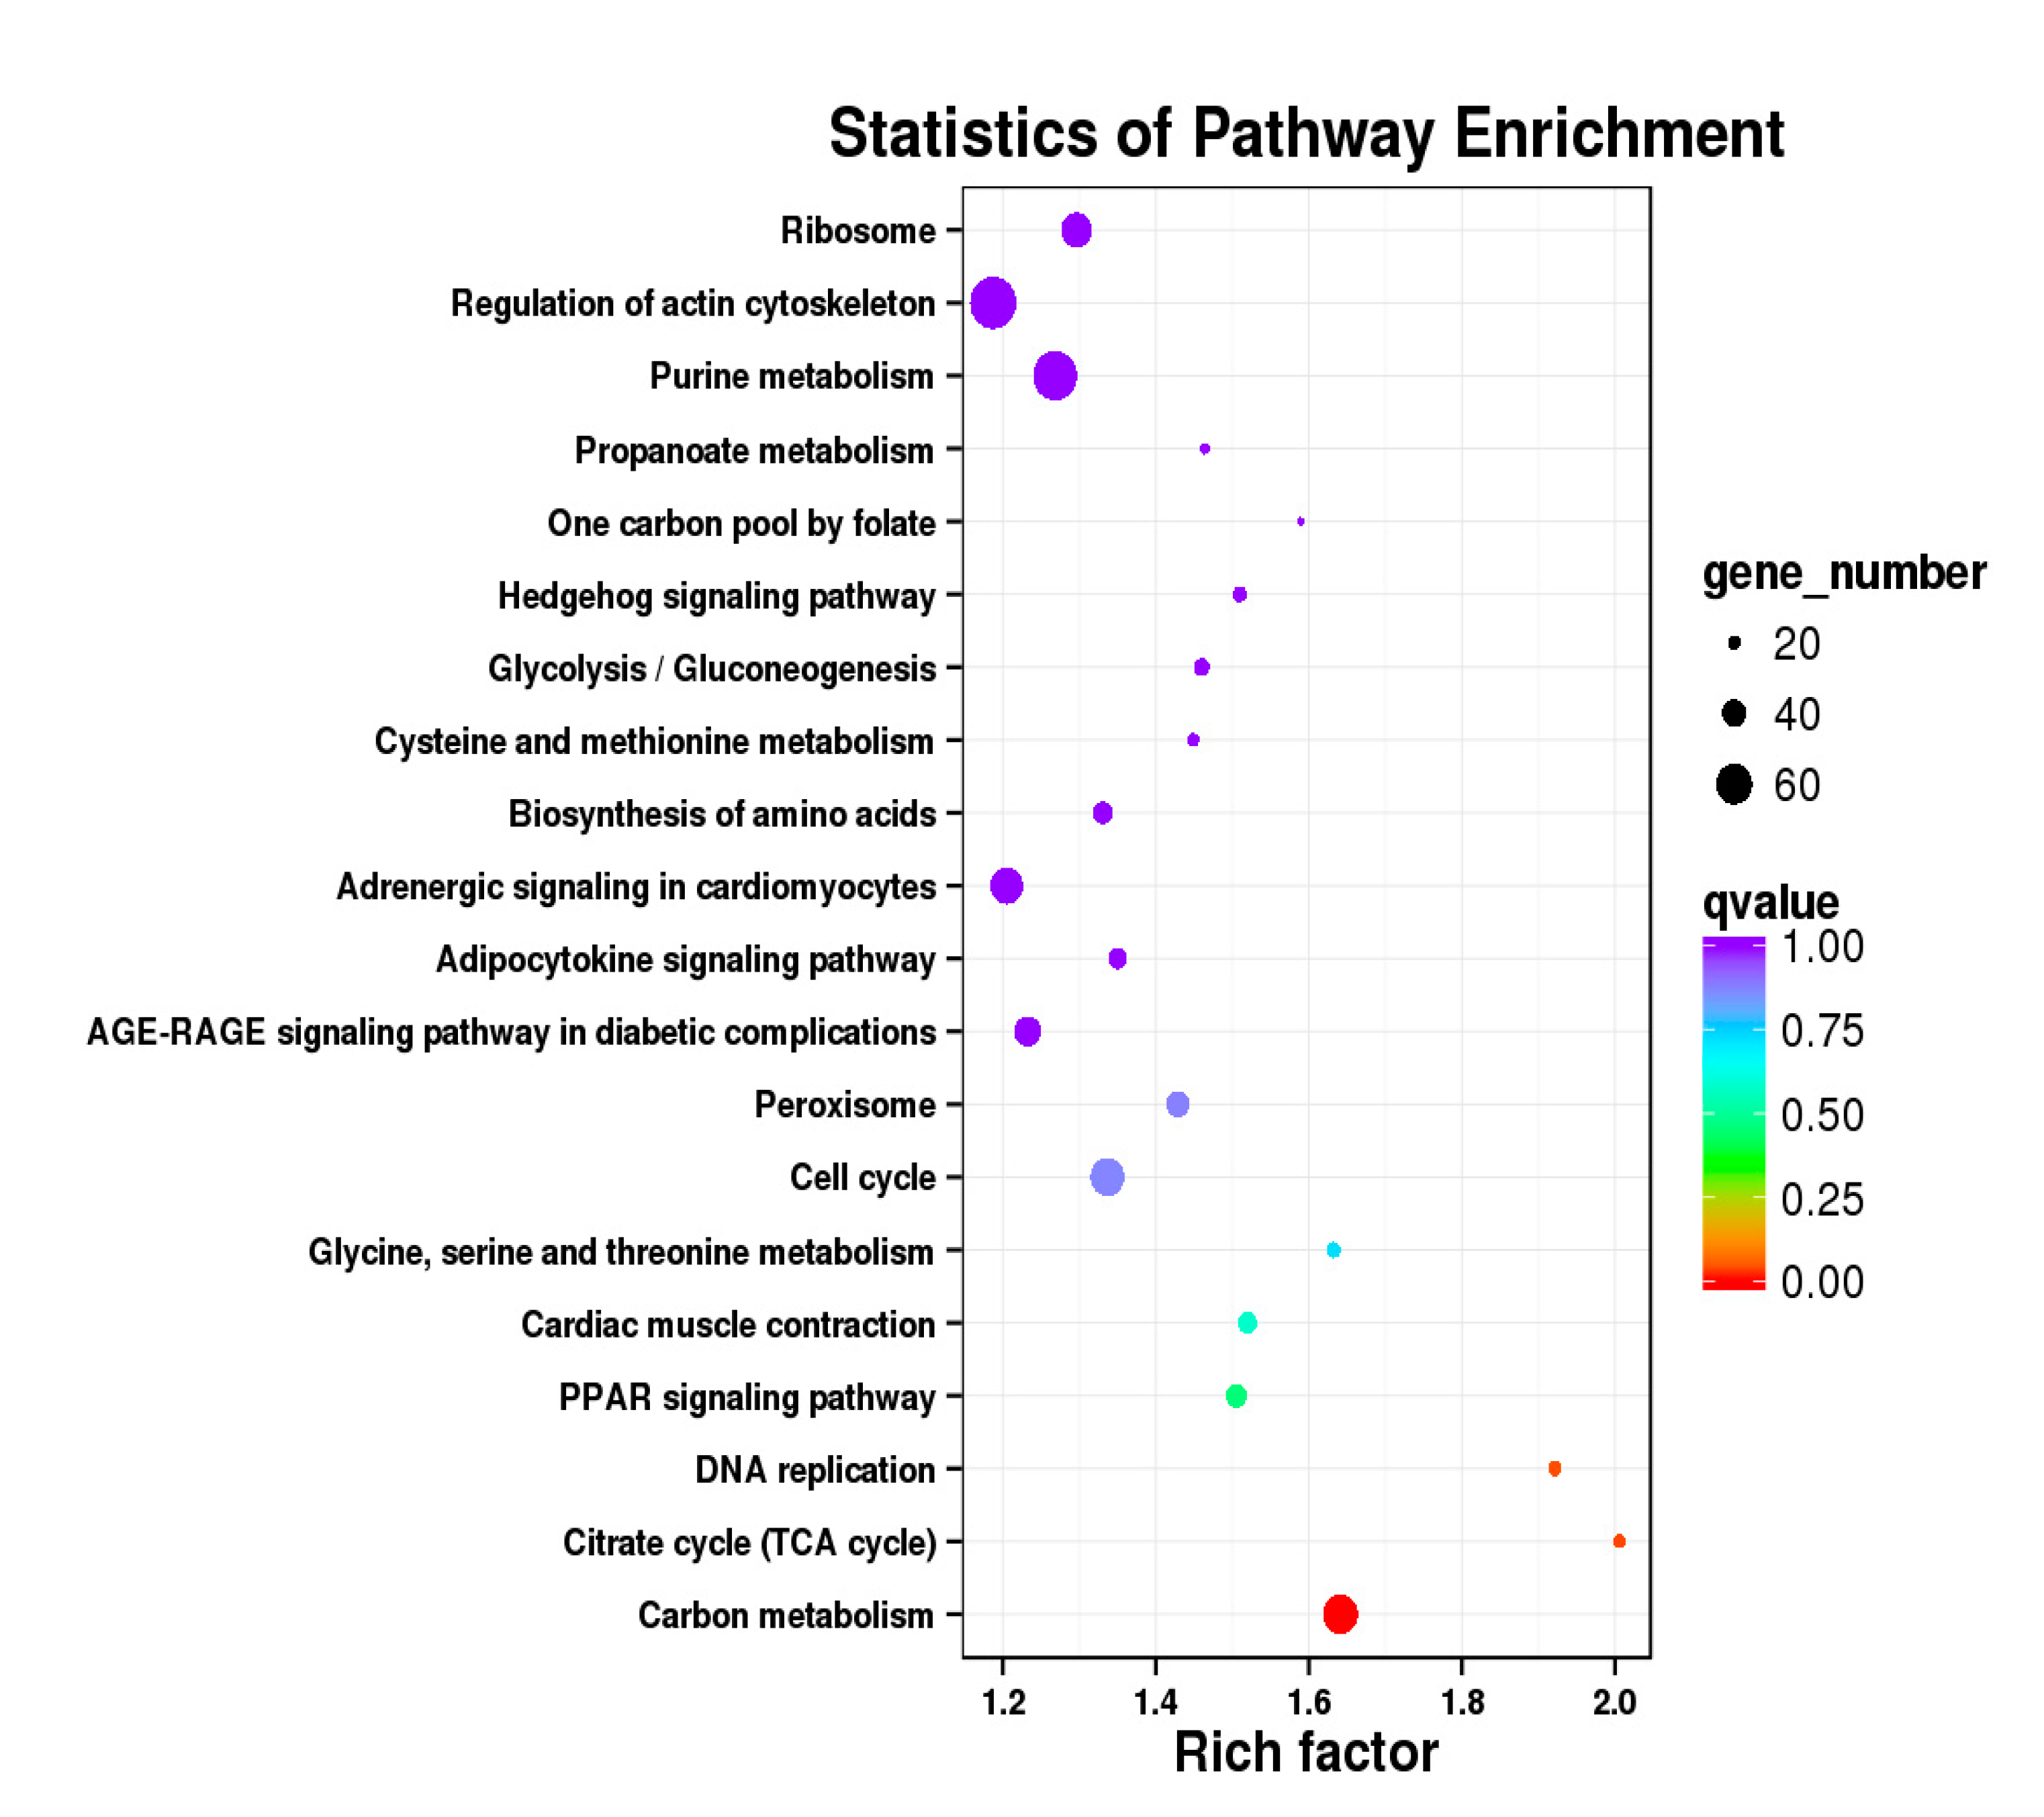
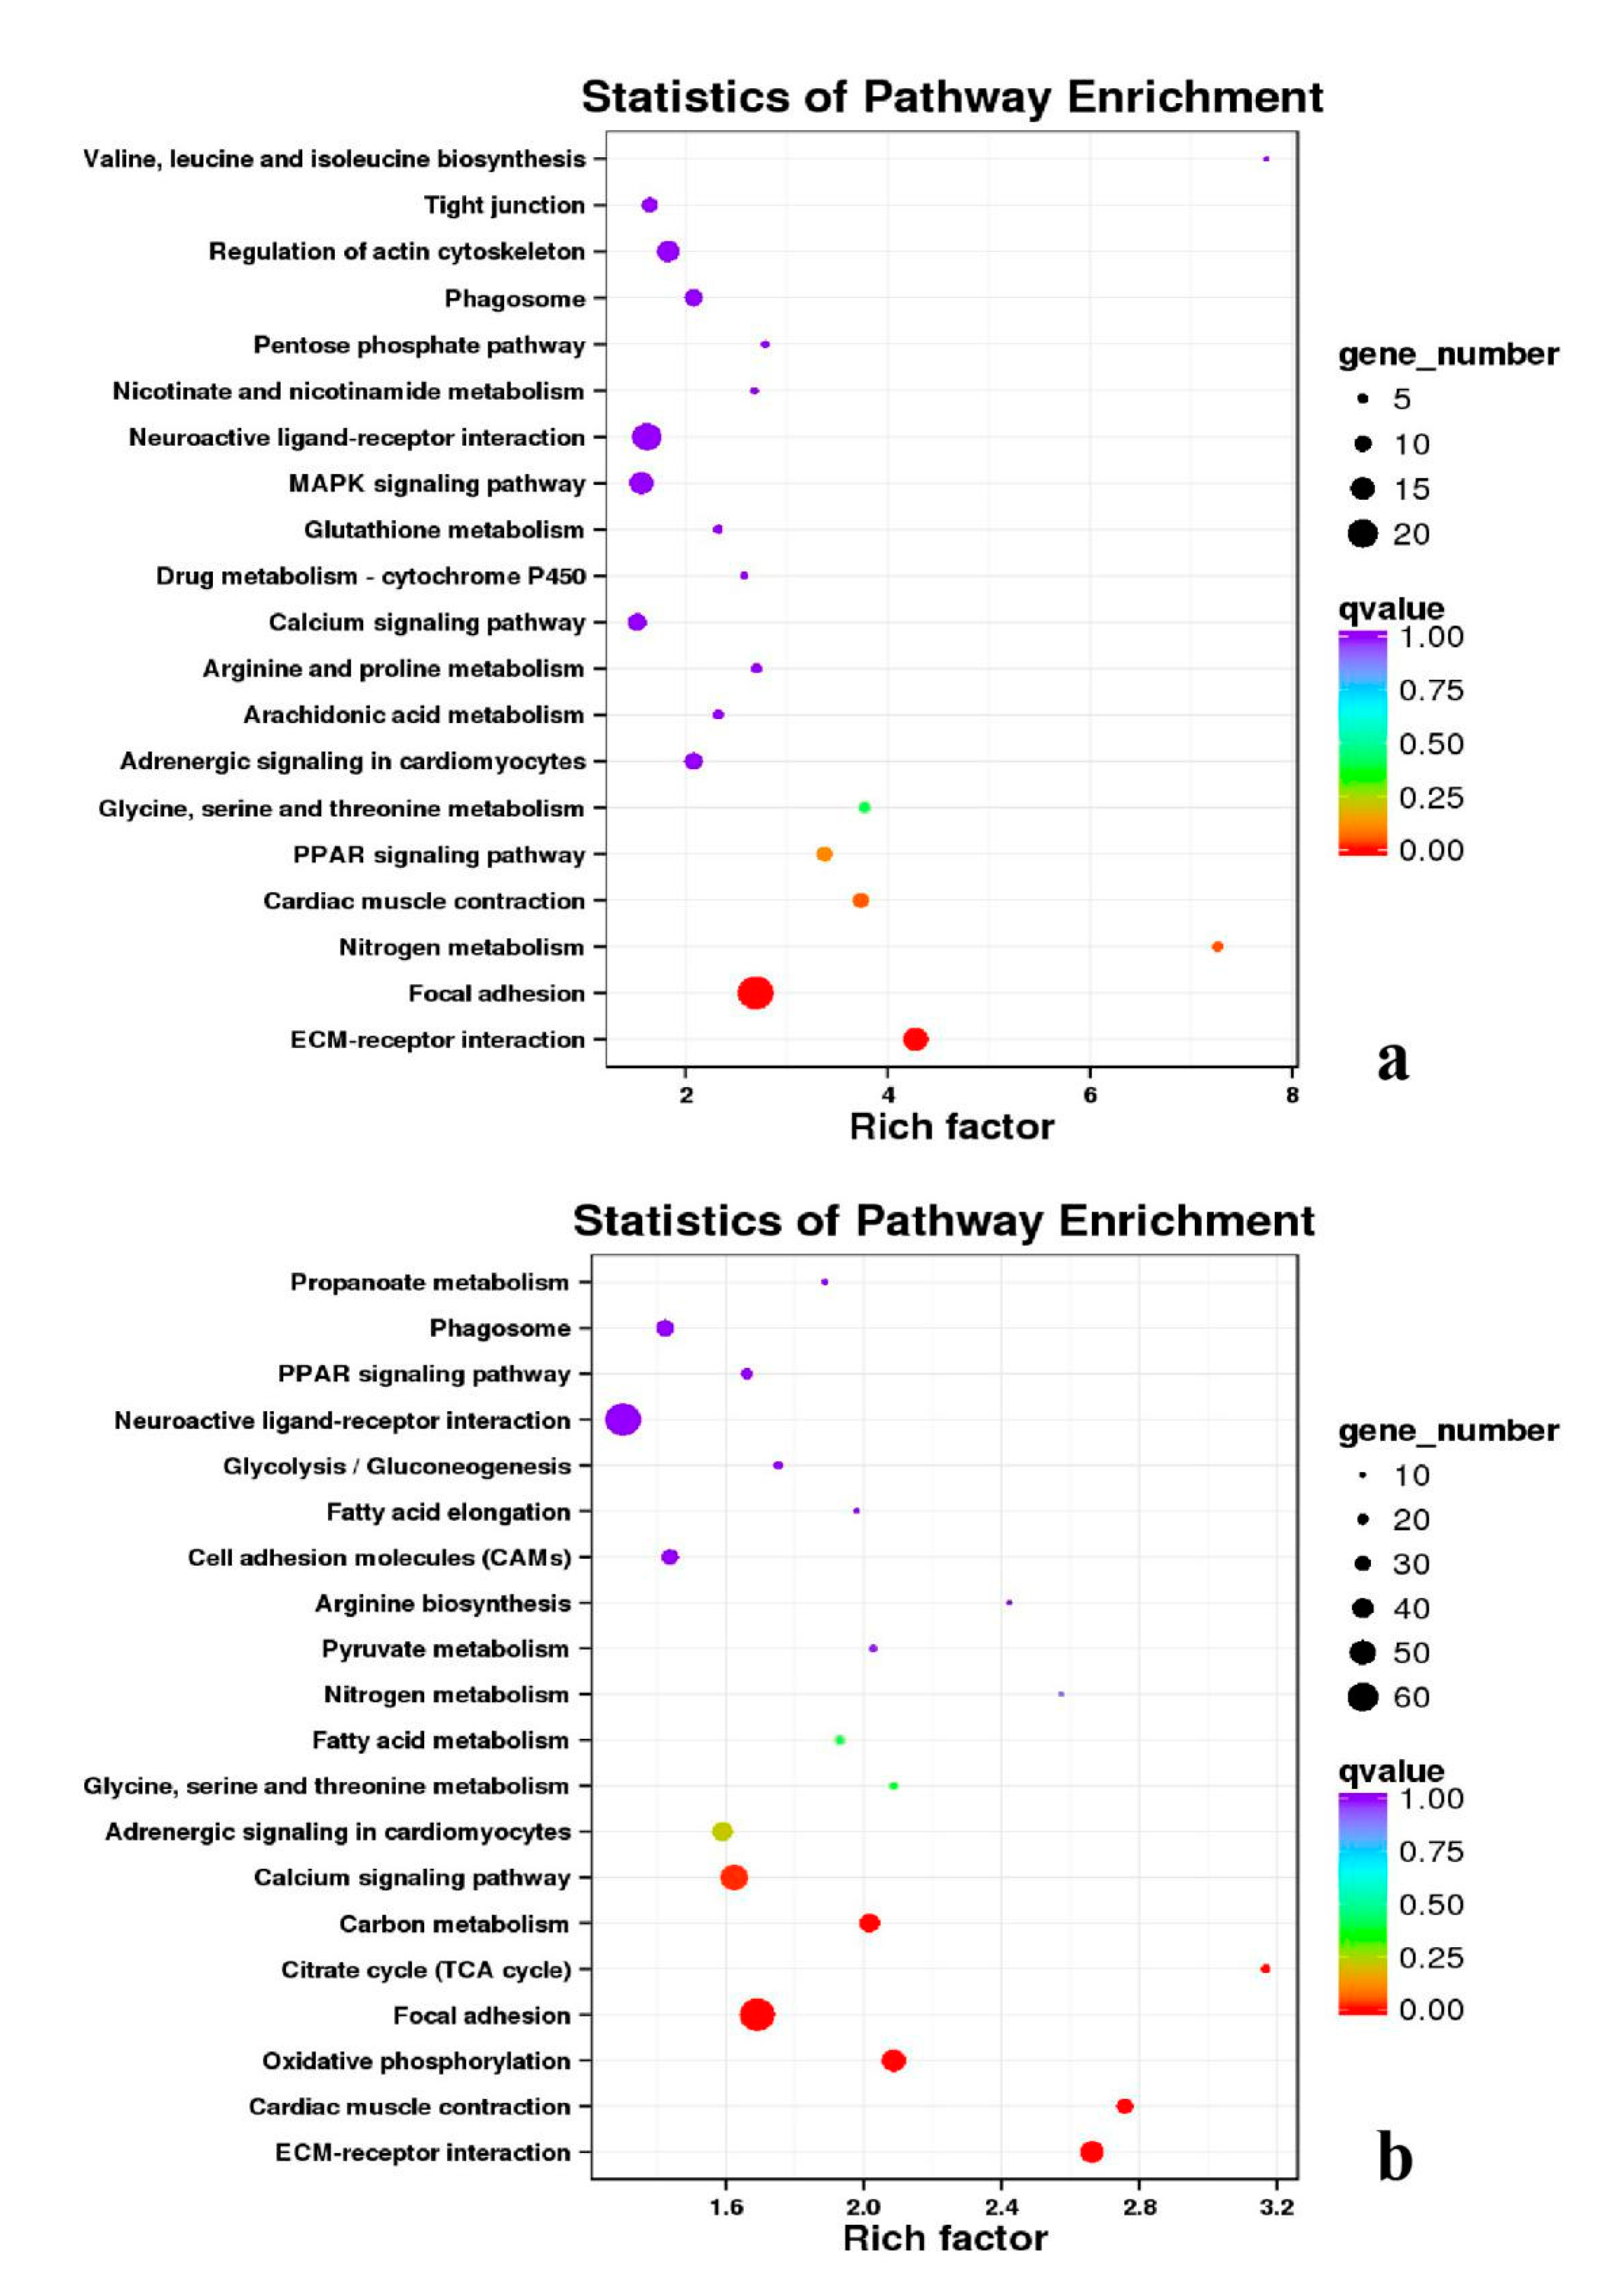
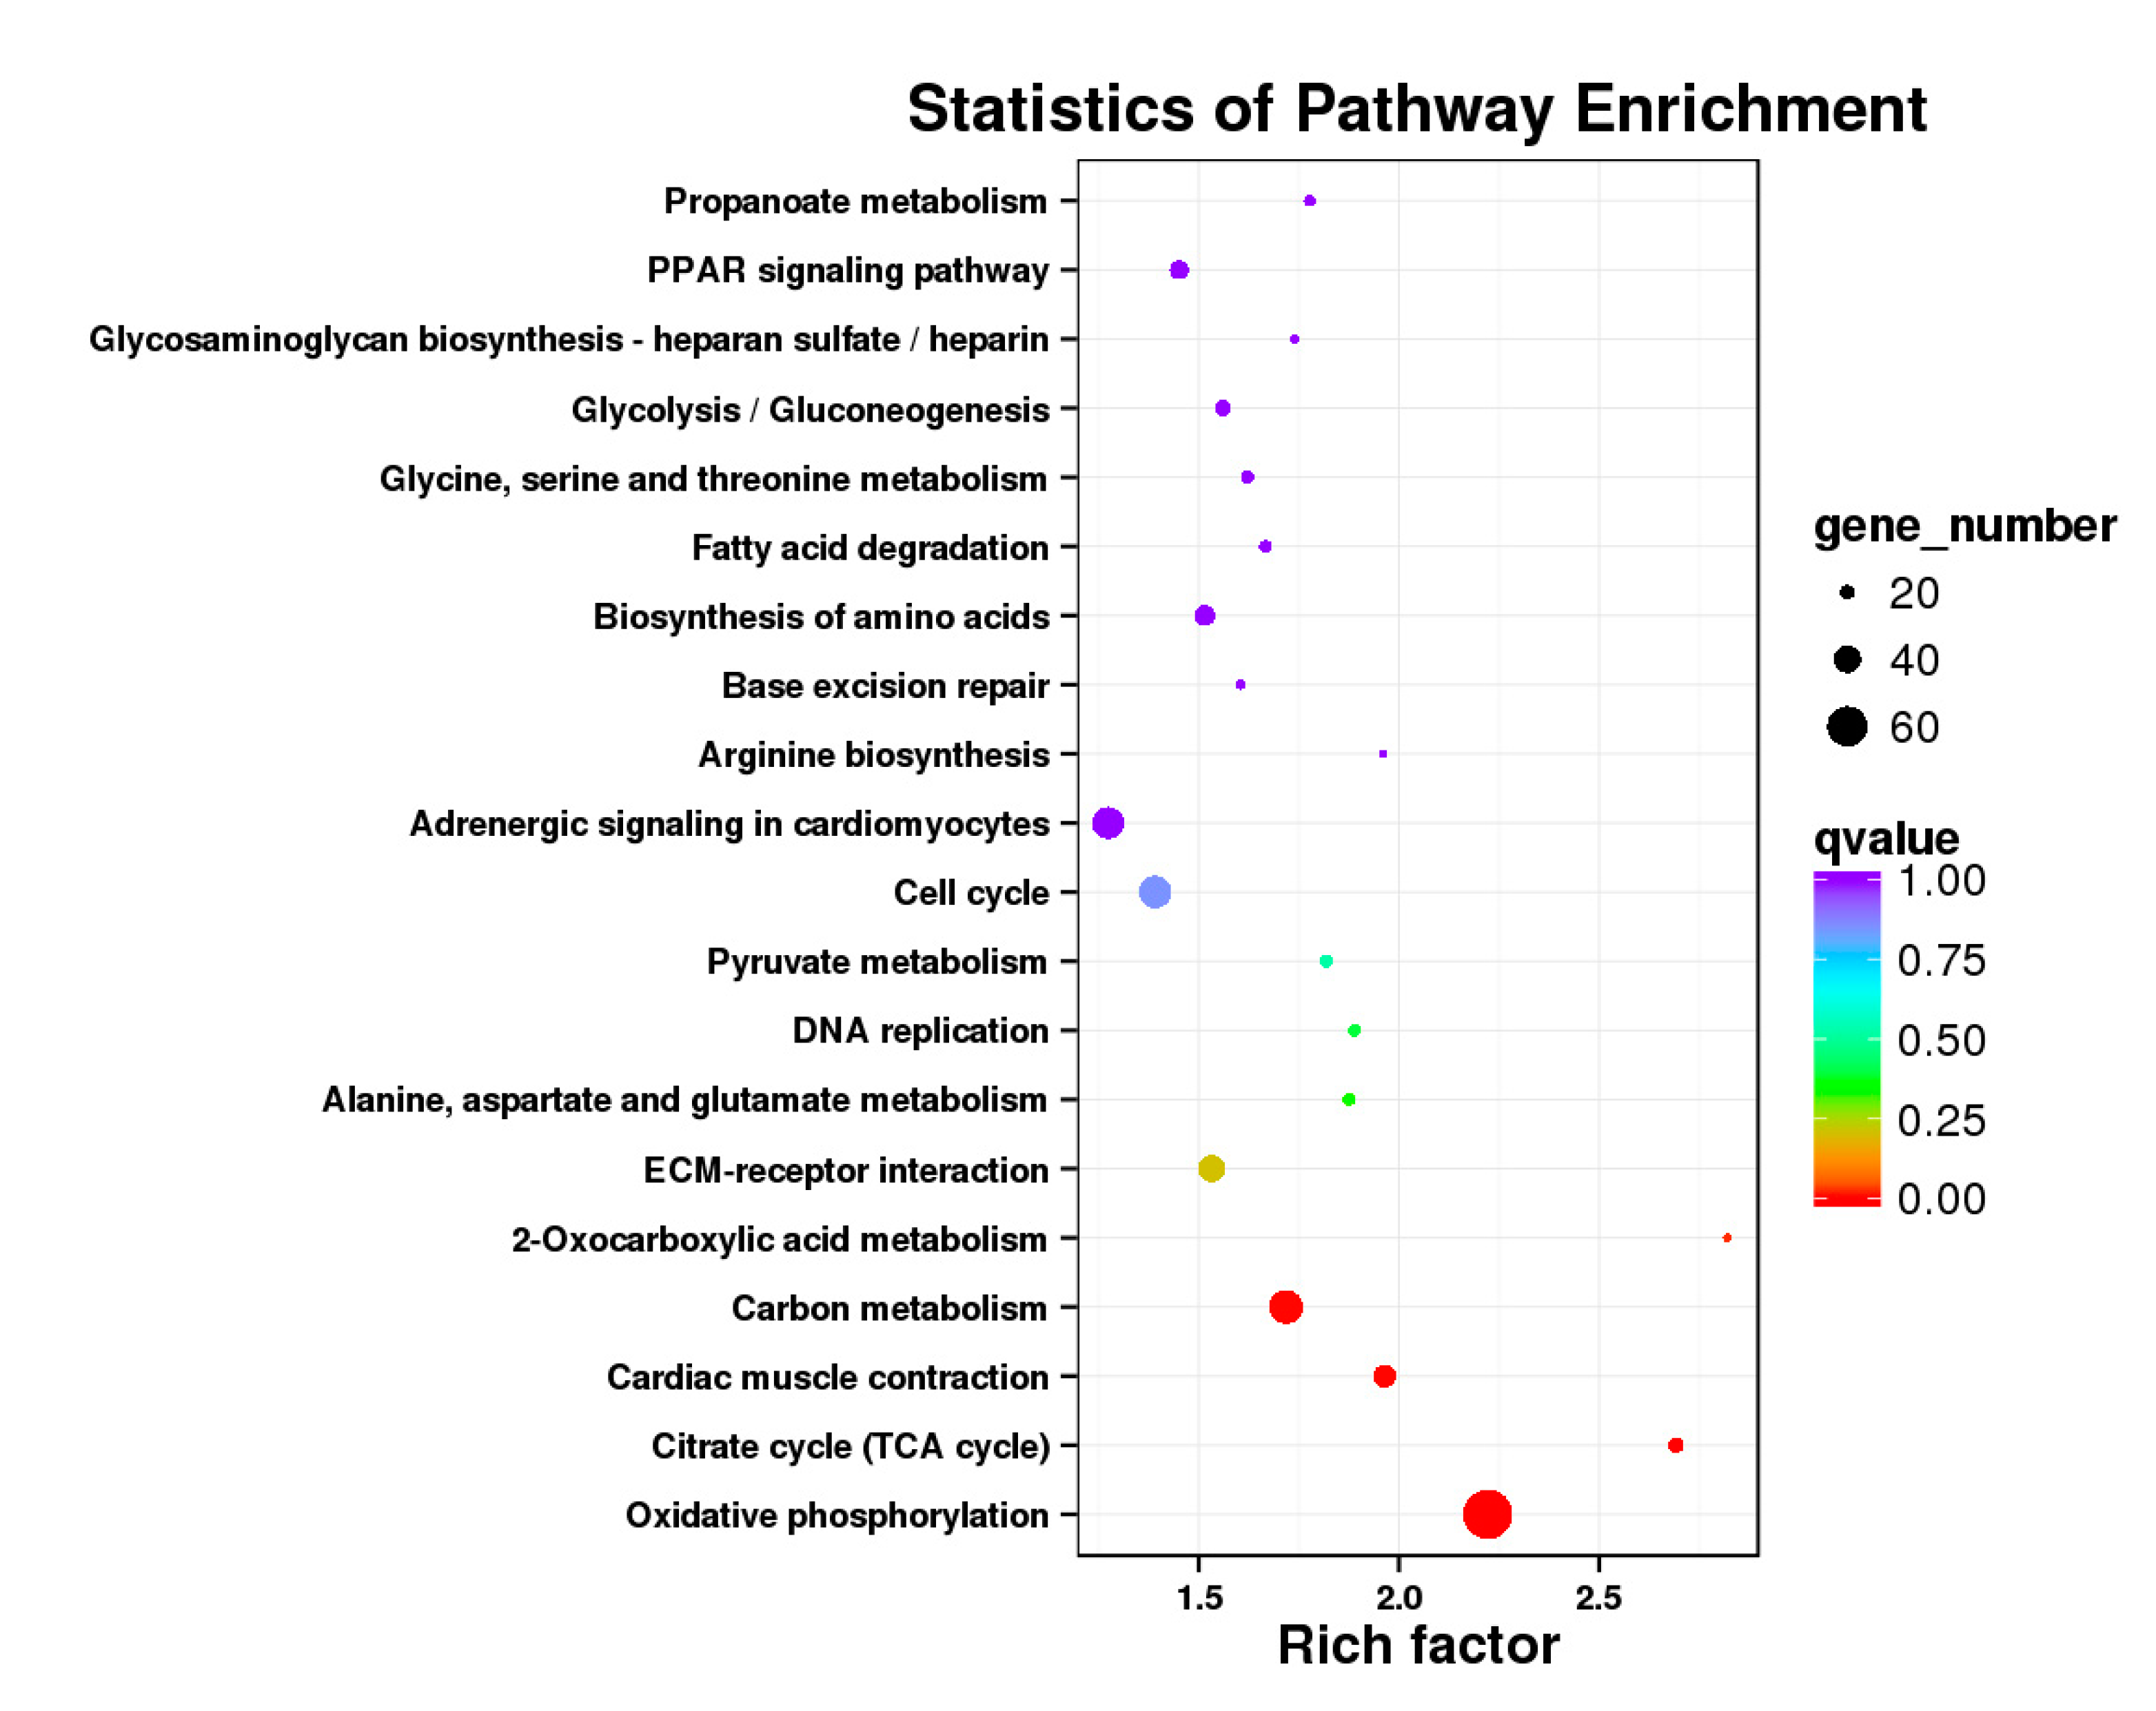
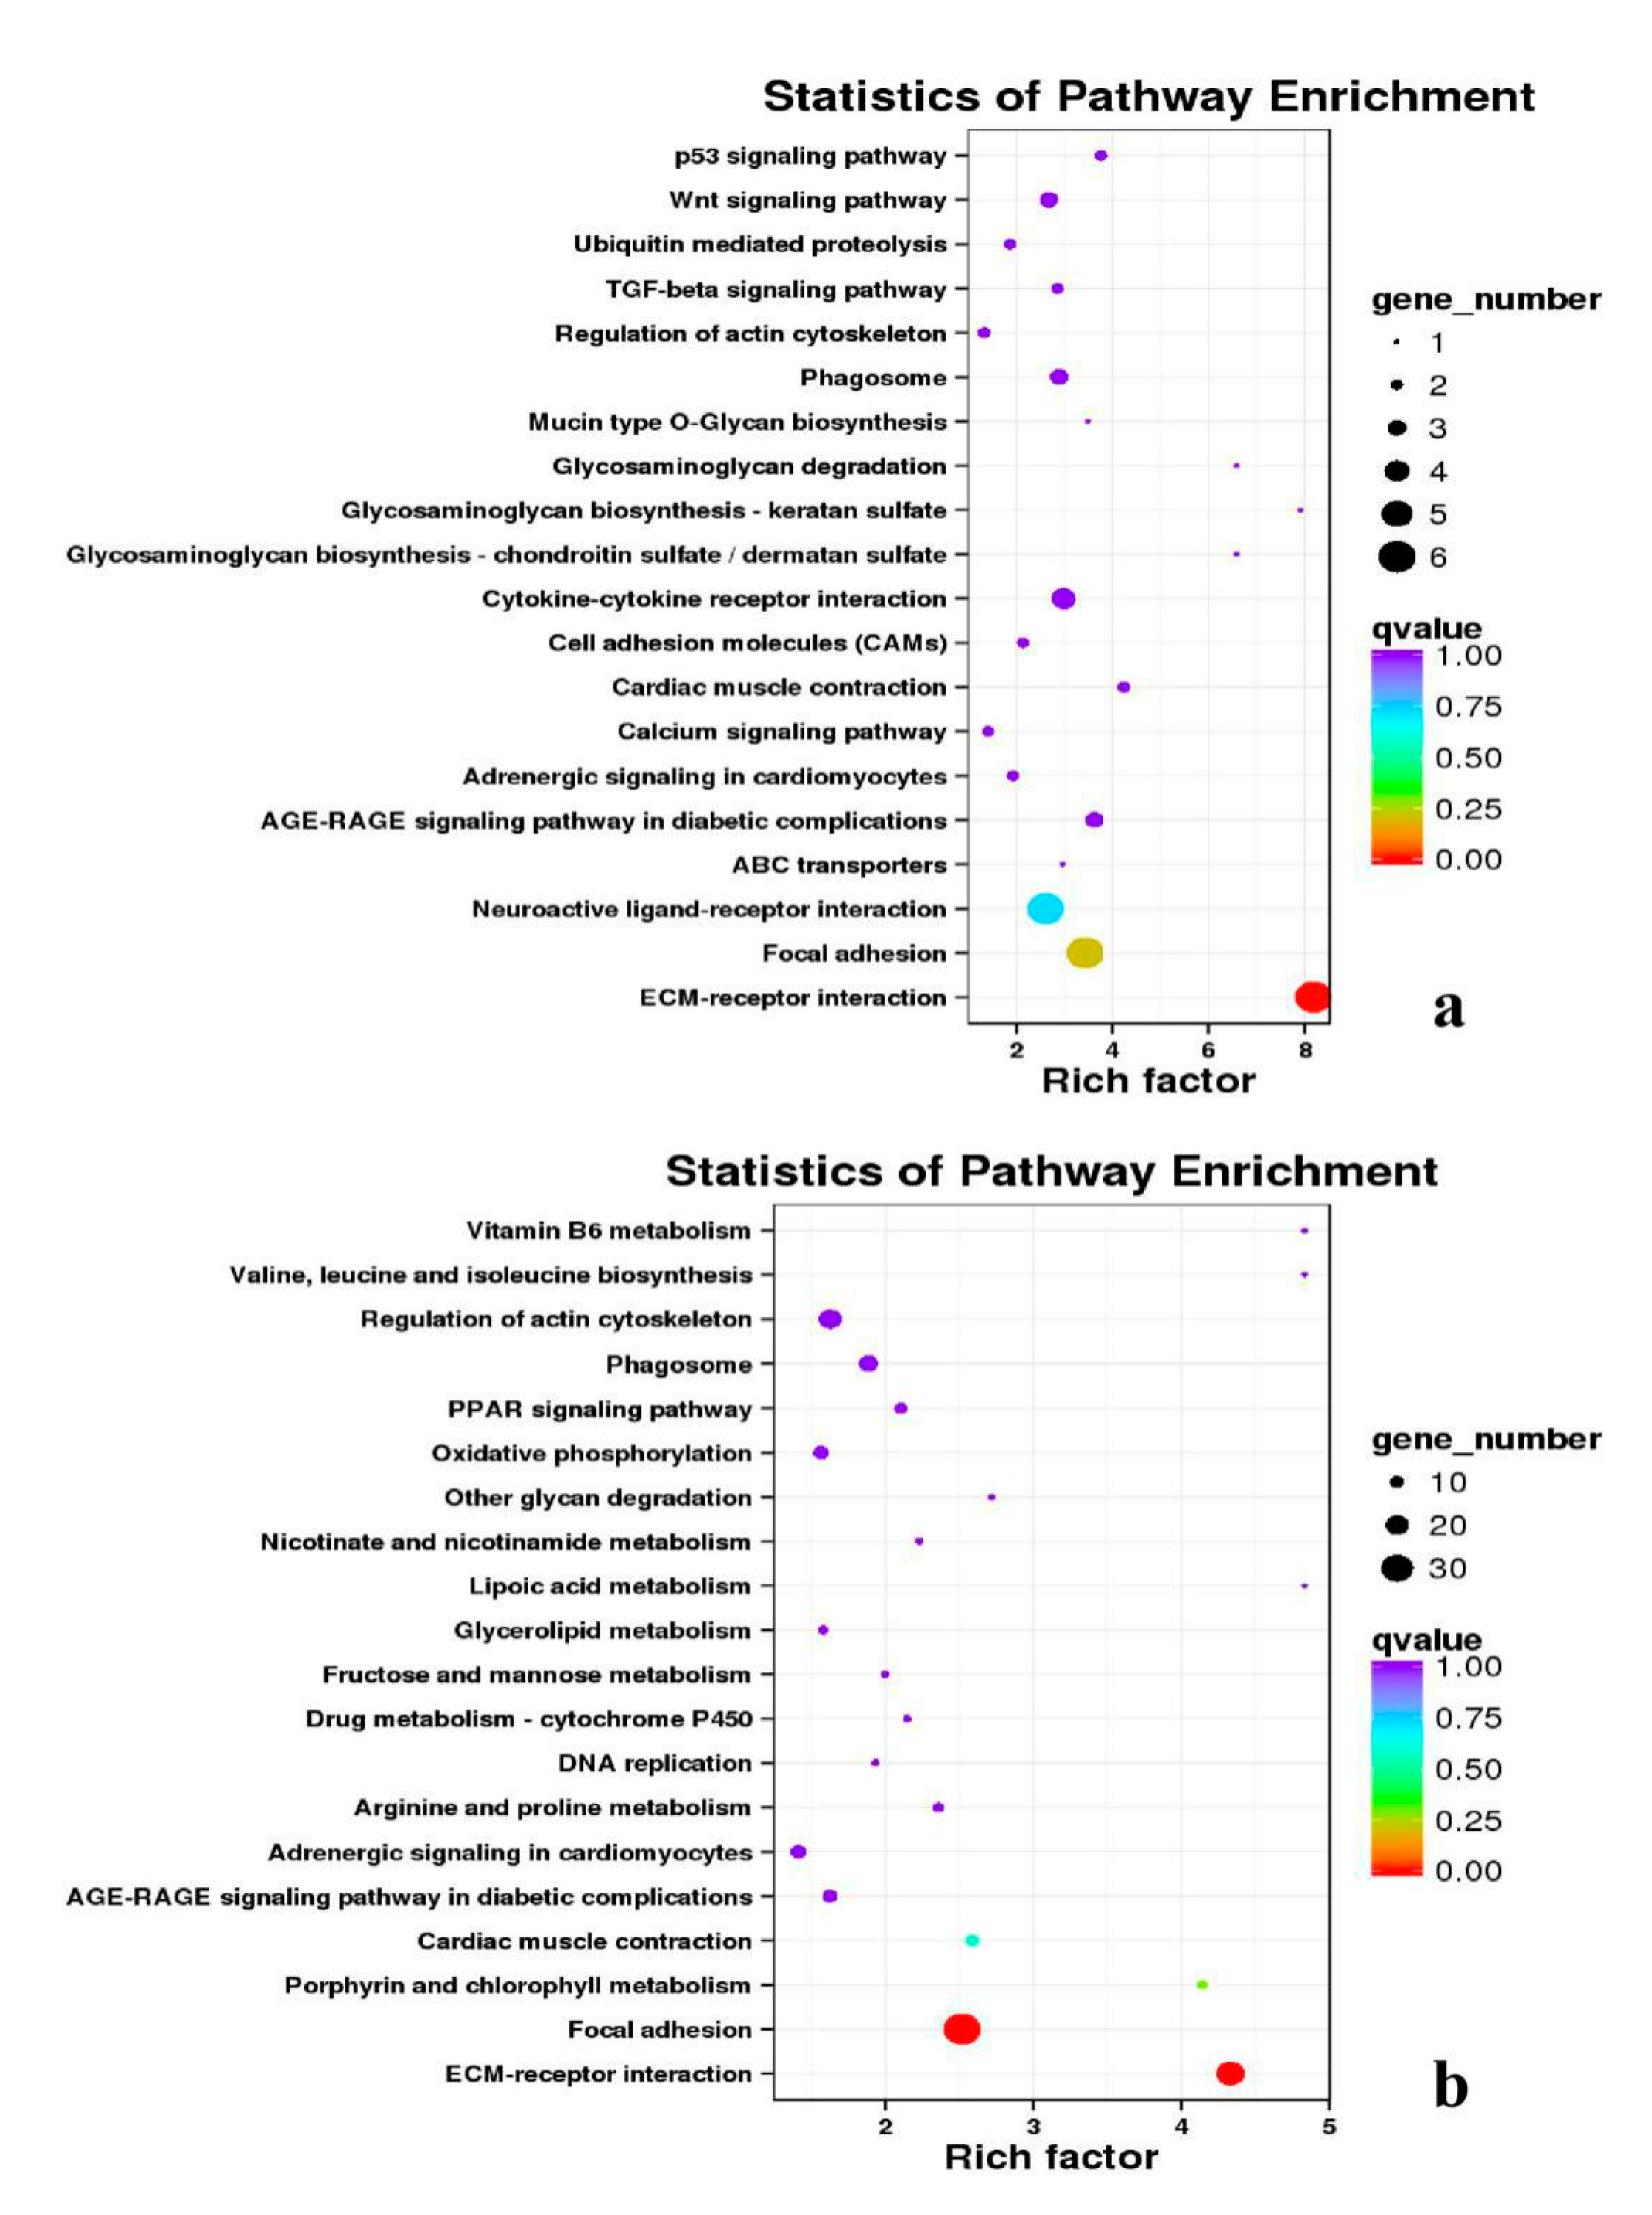
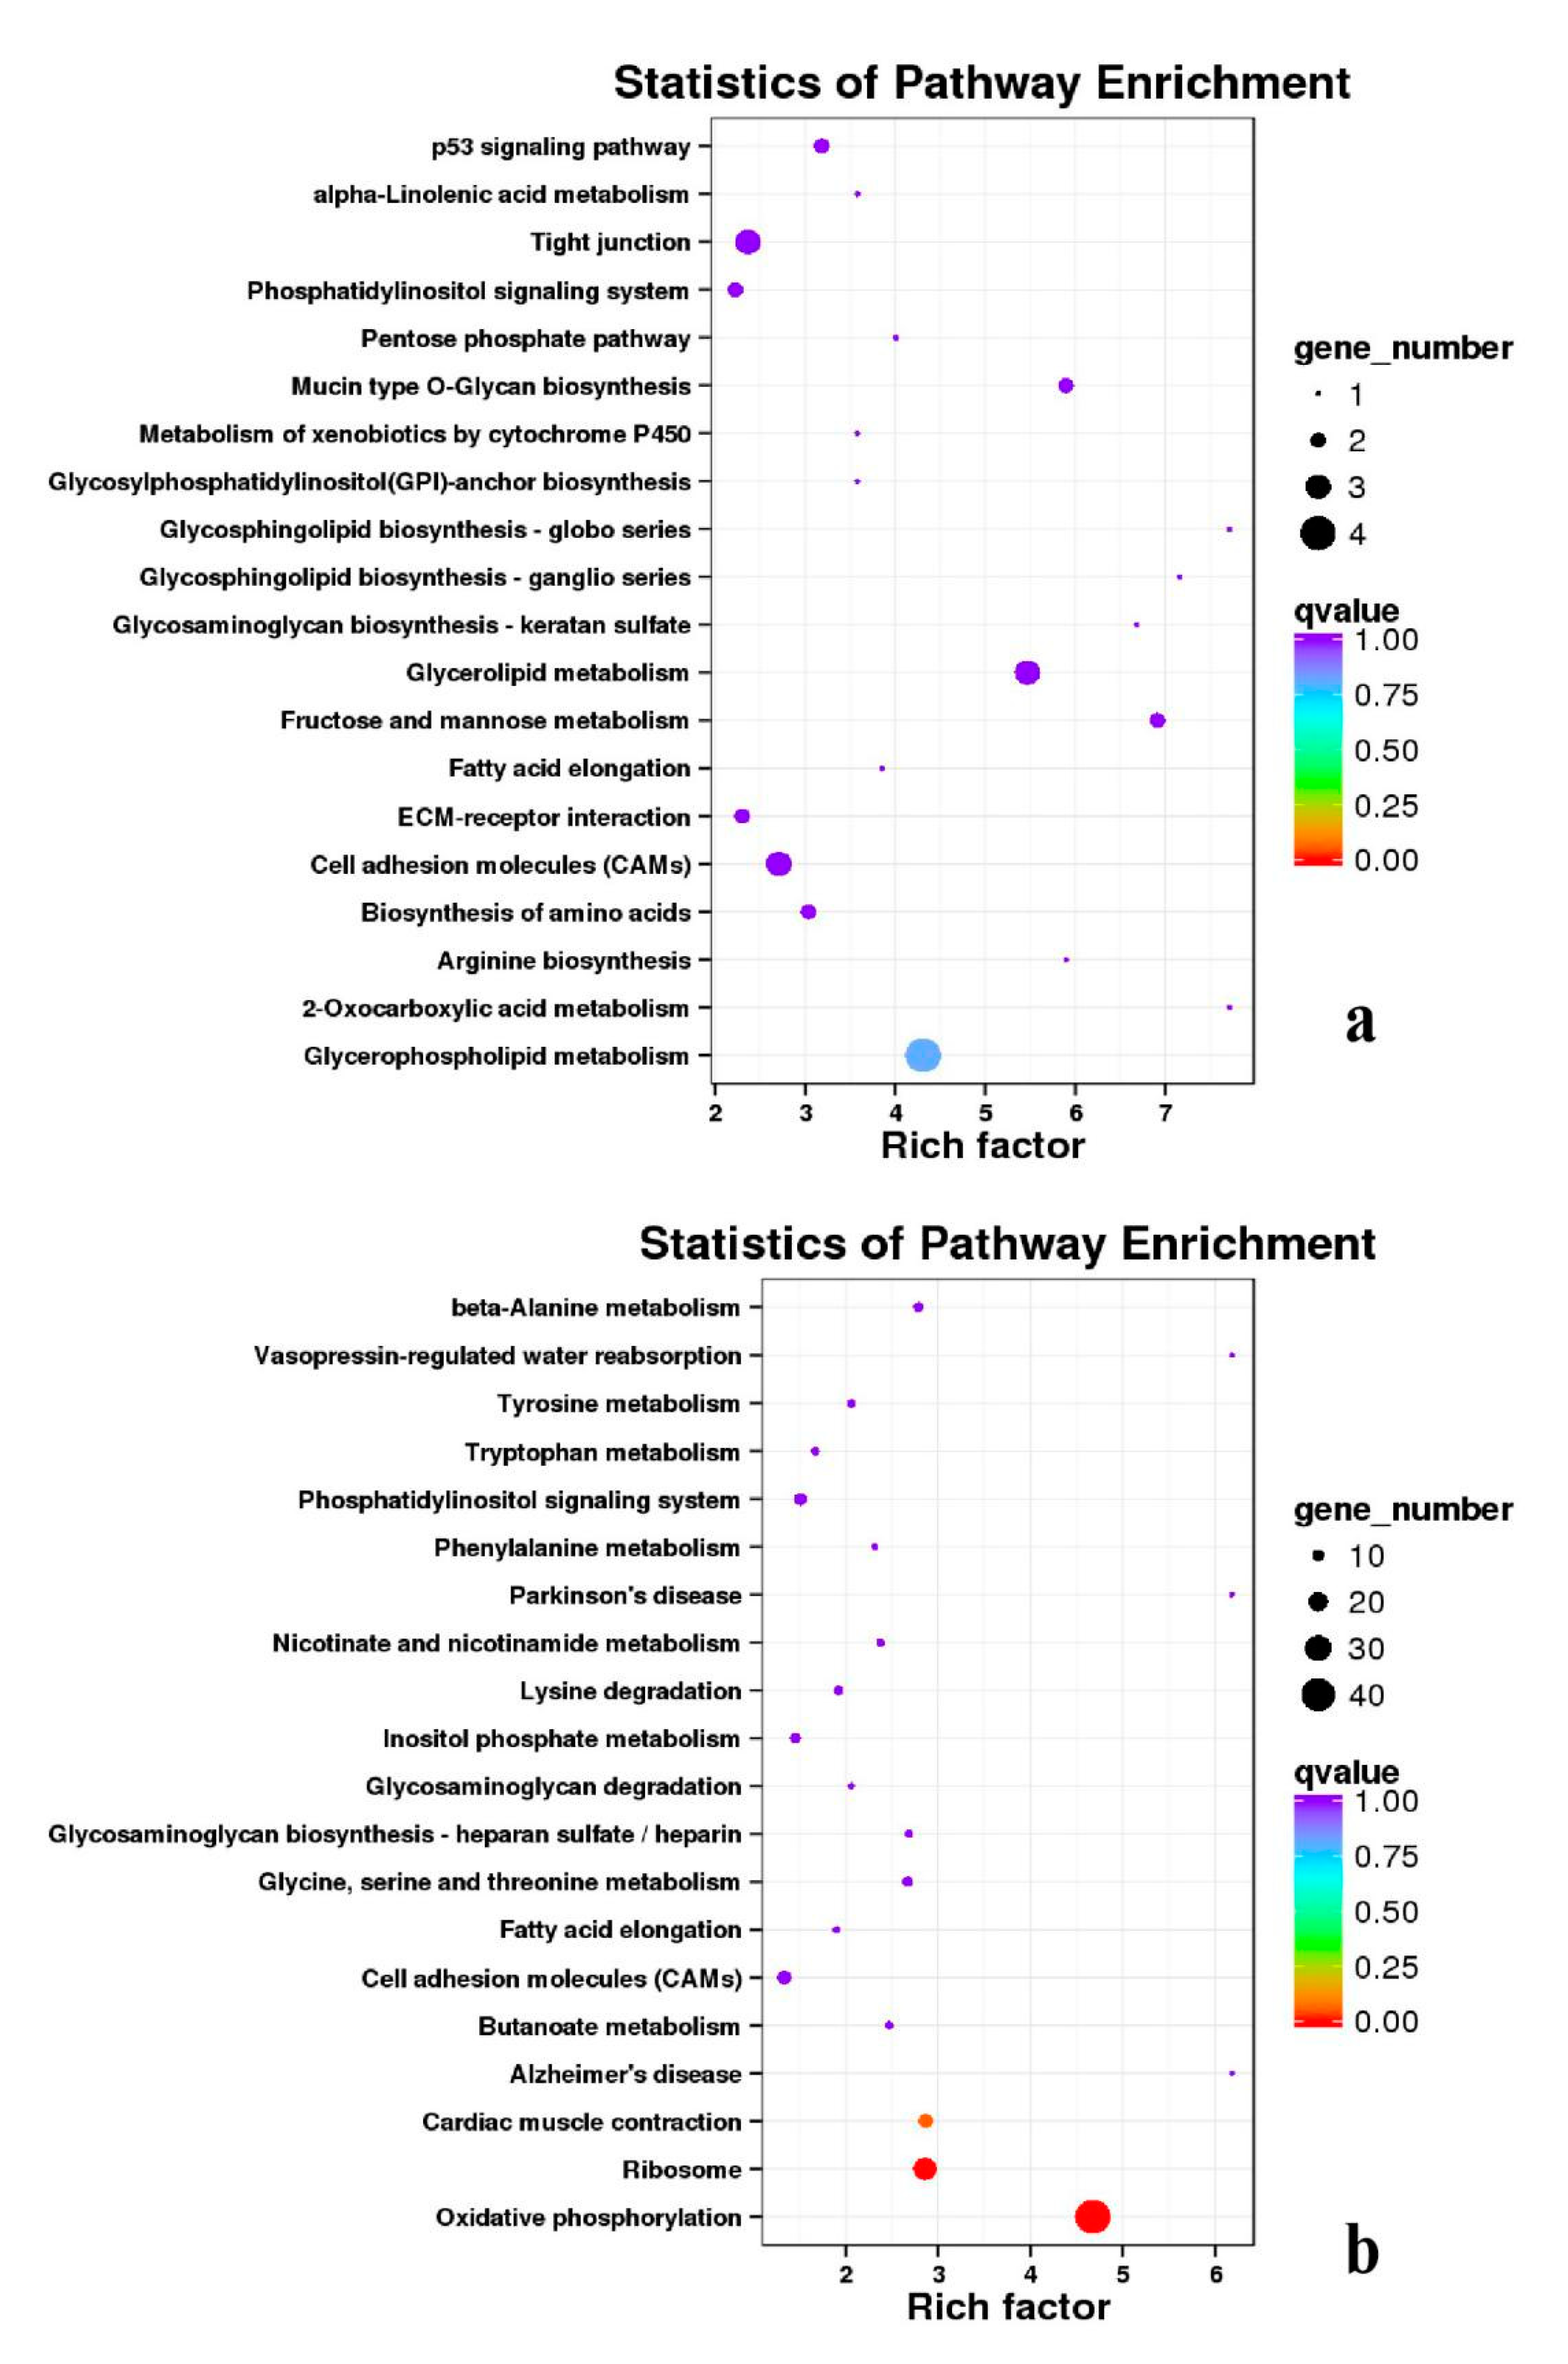
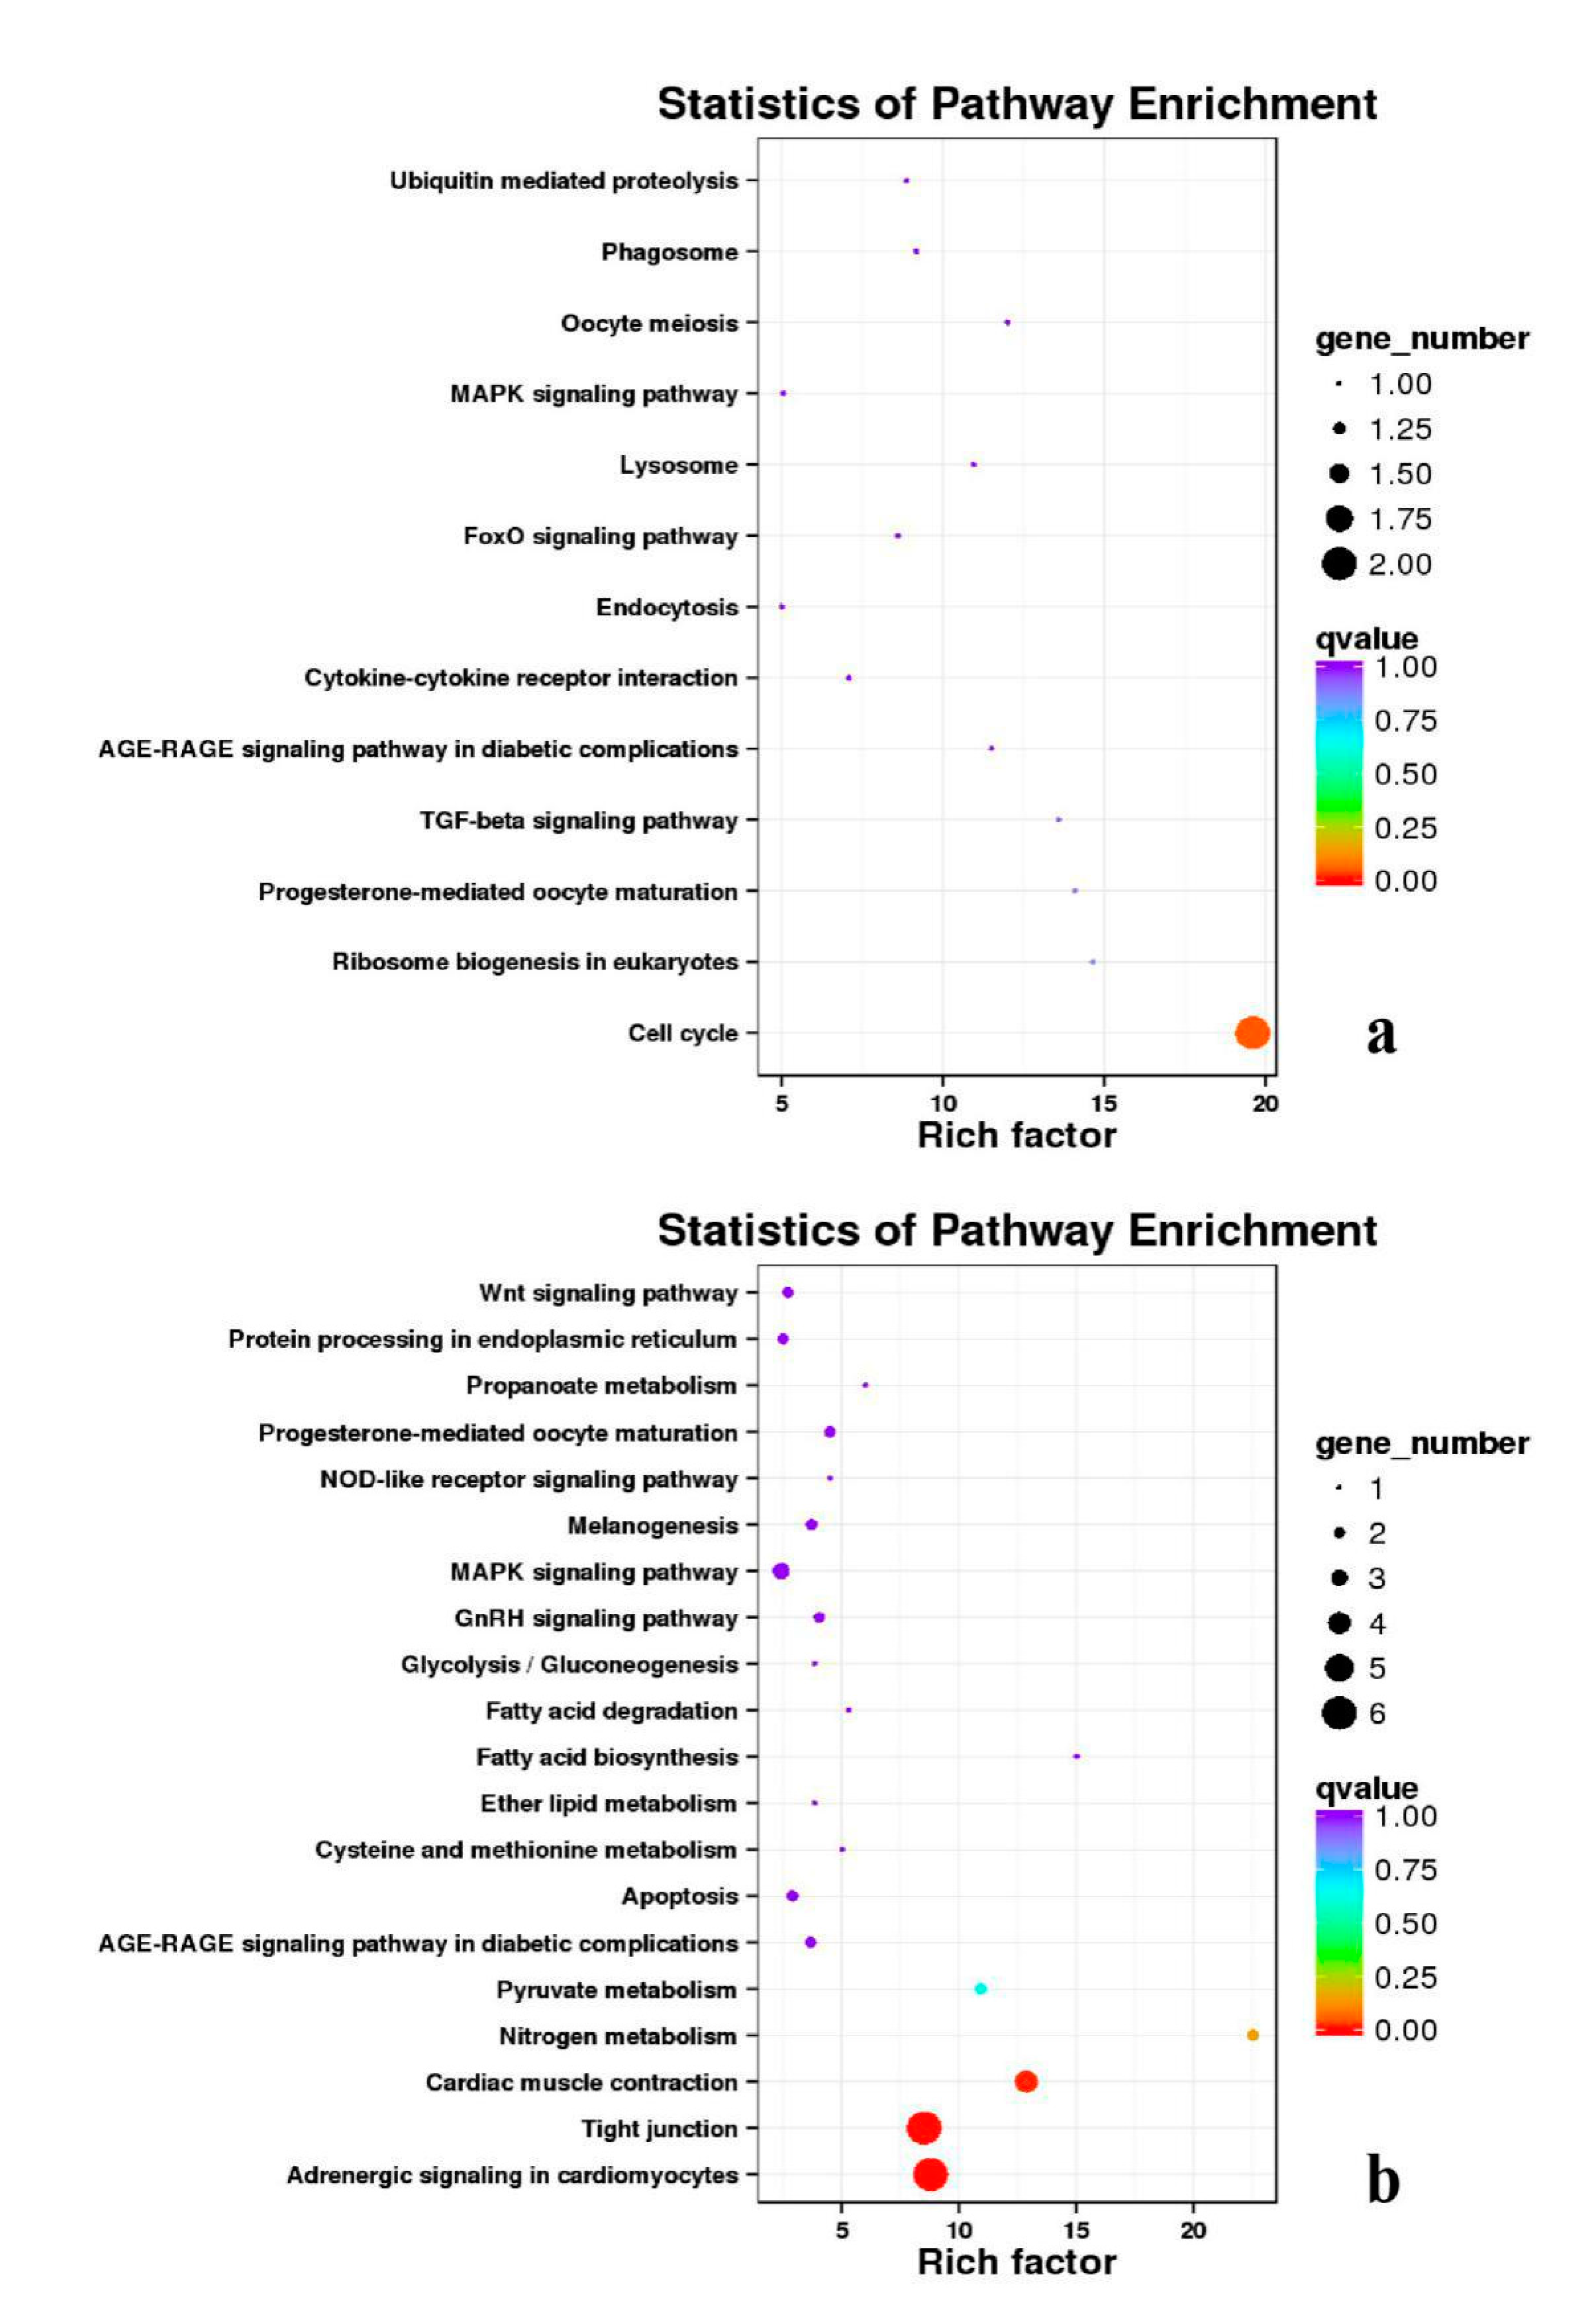
3.5. Analysis of GO Annotation and KEGG Pathway
3.6. qPCR Analysis
4. Discussion
4.1. SNP/InDel Analysis
4.2. Prediction of AS
4.3. DEGs Analyzed at All Time Points
4.4. GO and KEGG Pathway
5. Conclusions
Supplementary Materials
Author Contributions
Funding
Conflicts of Interest
Availability of Data and Materials
References
- Güller, I.; Russell, A.P. MicroRNAs in skeletal muscle: Their role and regulation in development, disease and function. J. Physiol. 2010, 588, 4075–4087. [Google Scholar] [CrossRef] [PubMed]
- Bi, P.; Ramirez-Martinez, A.; Li, H.; Cannavino, J.; McAnally, J.R.; Shelton, J.M.; Sánchez-Ortiz, E.; Bassel-Duby, R.; Olson, E.N. Control of muscle formation by the fusogenic micropeptide myomixer. Science 2017, 356, 323–327. [Google Scholar] [CrossRef] [PubMed]
- Mitchell, P.O.; Mills, S.T.; Pavlath, G.K. Calcineurin differentially regulates maintenance and growth of phenotypically distinct muscles. Am. J. Physiol. Physiol. 2002, 282, C984–C992. [Google Scholar] [CrossRef] [PubMed]
- Deries, M.; Thorsteinsdóttir, S. Axial and limb muscle development: Dialogue with the neighbourhood. Cell. Mol. Life Sci. 2016, 73, 4415–4431. [Google Scholar] [CrossRef]
- Scaal, M.; Marcelle, C. Chick muscle development. Int. J. Dev. Biol. 2018, 62, 127–136. [Google Scholar] [CrossRef]
- Buckingham, M.; Bajard, L.; Chang, T.; Daubas, P.; Hadchouel, J.; Meilhac, S.M.; Montarras, D.; Rocancourt, D.; Relaix, F. The formation of skeletal muscle: From somite to limb. J. Anat. 2003, 202, 59–68. [Google Scholar] [CrossRef]
- Guo, B.; Greenwood, P.L.; Cafe, L.M.; Zhou, G.; Zhang, W.; Dalrymple, B.P. Transcriptome analysis of cattle muscle identifies potential markers for skeletal muscle growth rate and major cell types. BMC Genom. 2015, 16, 177. [Google Scholar] [CrossRef]
- Hutton, K.C.; Vaughn, M.A.; Litta, G.; Turner, B.J.; Starkey, J.D. Effect of vitamin D status improvement with 25-hydroxycholecalciferol on skeletal muscle growth characteristics and satellite cell activity in broiler chickens1,2. J. Anim. Sci. 2014, 92, 3291–3299. [Google Scholar] [CrossRef]
- Costa, V.; Angelini, C.; De Feis, I.; Ciccodicola, A. Uncovering the Complexity of Transcriptomes with RNA-Seq. J. Biomed. Biotechnol. 2010, 2010, 1–19. [Google Scholar] [CrossRef]
- Waern, K.; Nagalakshmi, U.; Snyder, M. RNA sequencing. Methods Mol. Biol. 2011, 759, 125. [Google Scholar]
- Trapnell, C.; Roberts, A.; Goff, L.; Pertea, G.; Kim, D.; Kelley, D.R.; Pimentel, H.; Salzberg, S.L.; Rinn, J.L.; Pachter, L. Differential gene and transcript expression analysis of RNA-seq experiments with TopHat and Cufflinks. Nat. Protoc. 2012, 7, 562–578. [Google Scholar] [CrossRef] [PubMed]
- Kumar, D.; Bansal, G.; Narang, A.; Basak, T.; Abbas, T.; Dash, D. Integrating transcriptome and proteome profiling: Strategies and applications. Proteomics 2016, 16, 2533–2544. [Google Scholar] [CrossRef] [PubMed]
- Xue, Q.; Zhang, G.; Li, T.; Ling, J.; Zhang, X.; Wang, J. Transcriptomic profile of leg muscle during early growth in chicken. PLoS ONE 2017, 12, e0173824. [Google Scholar] [CrossRef] [PubMed]
- Zhang, Z.; Du, H.; Yang, C.; Li, Q.; Qiu, M.; Song, X.; Yu, C.; Jiang, X.; Liu, L.; Hu, C.; et al. Comparative transcriptome analysis reveals regulators mediating breast muscle growth and development in three chicken breeds. Anim. Biotechnol. 2019, 30, 233–241. [Google Scholar] [CrossRef]
- Xu, T.-S.; Gu, L.-H.; Huang, W.; Xia, W.-L.; Zhang, Y.-S.; Zhang, Y.-G.; Rong, G.; Schachtschneider, K.M.; Hou, S.-S. Gene expression profiling in Pekin duck embryonic breast muscle. PLoS ONE 2017, 12, e0174612. [Google Scholar] [CrossRef]
- Zhu, C.; Song, W.; Tao, Z.; Liu, H.; Xu, W.; Zhang, S.; Li, H. Deep RNA sequencing of pectoralis muscle transcriptomes during late-term embryonic to neonatal development in indigenous Chinese duck breeds. PLoS ONE 2017, 12, e0180403. [Google Scholar] [CrossRef]
- Liu, H.X.; Hu, Y.; Ji, G.G.; Li, H.F. Rapid-Sexing Poultries via a New Pair of Universal Primers. J. Agr. Biotechnol. 2014, 22, 1567–1574. (In Chinese) [Google Scholar]
- Mutz, K.-O.; Heilkenbrinker, A.; Lönne, M.; Walter, J.-G.; Stahl, F. Transcriptome analysis using next-generation sequencing. Curr. Opin. Biotechnol. 2013, 24, 22–30. [Google Scholar] [CrossRef]
- Adiconis, X.; Borges-Rivera, D.; Satija, R.; DeLuca, D.S.; Busby, M.A.; Berlin, A.M.; Sivachenko, A.; Thompson, D.A.; Wysoker, A.; Fennell, T.; et al. Comparative analysis of RNA sequencing methods for degraded or low-input samples. Nat. Methods 2013, 10, 623–629. [Google Scholar] [CrossRef]
- Bihan-Duval, E.L.; Millet, N.; Remignon, H. Broiler meat quality: Effect of selection for increased carcass quality and estimates of genetic parameters. Poult. Sci. 1999, 78, 822–826. [Google Scholar] [CrossRef]
- Sachidanandam, R.; Weissman, D.; Schmidt, S.C.; Kakol, J.M.; Stein, L.D.; Marth, G.; Sherry, S.; Mullikin, J.C.; Mortimore, B.J.; Willey, D.L.; et al. A map of human genome sequence variation containing 1.42 million single nucleotide polymorphisms. Nature 2001, 409, 928–933. [Google Scholar]
- Huang, Y.; Zou, Y.; He, H.; Dang, Y.-L.; Qi, X.-S.; Chen, H.; Lin, Q.; Zheng, L.; Zhang, Z.-J.; Lei, C.; et al. Effects of genetic variants of the bovine WNT8A gene on nine important growth traits in beef cattle. J. Genet. 2017, 96, 535–544. [Google Scholar] [CrossRef]
- Wu, S.; Wang, Y.; Ning, Y.; Guo, H.; Xiaoyu, W.; Zhang, L.; Khan, R.; Cheng, G.; Wang, H.; Zan, L.S. Genetic Variants in STAT3 Promoter Regions and Their Application in Molecular Breeding for Body Size Traits in Qinchuan Cattle. Int. J. Mol. Sci. 2018, 19, 1035. [Google Scholar] [CrossRef]
- Sun, Z.; Bhagwate, A.; Prodduturi, N.; Yang, P.; Kocher, J.-P.A. Indel detection from RNA-seq data: Tool evaluation and strategies for accurate detection of actionable mutations. Brief. Bioinform. 2017, 18, 973–983. [Google Scholar] [CrossRef]
- Yang, R.; Van Etten, J.L.; Dehm, S.M. Indel detection from DNA and RNA sequencing data with transIndel. BMC Genom. 2018, 19, 1–11. [Google Scholar] [CrossRef]
- Chen, L.; Tovar-Corona, J.M.; Urrutia, A.O. Alternative Splicing: A Potential Source of Functional Innovation in the Eukaryotic Genome. Int. J. Evol. Biol. 2012, 2012, 1–10. [Google Scholar] [CrossRef] [PubMed]
- Kornblihtt, A.R.; Schor, I.E.; Alló, M.; Dujardin, G.; Petrillo, E.; Muñoz, M.J. Alternative splicing: A pivotal step between eukaryotic transcription and translation. Nat. Rev. Mol. Cell Biol. 2013, 14, 153–165. [Google Scholar] [CrossRef] [PubMed]
- Traunmuller, L.; Gomez, A.M.; Nguyen, T.M.; Scheifele, P. Control of neuronal synapse specifcation by a highly dedicated alternative splicing program. Science 2016, 352, 982–986. [Google Scholar] [CrossRef]
- Schwerk, C.; Schulze-Osthoff, K. Regulation of Apoptosis by Alternative Pre-mRNA Splicing. Mol. Cell 2005, 19, 1–13. [Google Scholar] [CrossRef] [PubMed]
- Thorsteinsdóttir, S.; Roelen, B.A.J.; Goumans, M.-J.; Oostwaard, D.W.-V.; Gaspar, A.C.; Mummery, C. Expression of the α6A integrin splice variant in developing mouse embryonic stem cell aggregates and correlation with cardiac muscle differentiation. Differentiation 1999, 64, 173. [Google Scholar] [CrossRef]
- Schmucker, D.; Clemens, J.C.; Shu, H.; Worby, C.; Xiao, J.; Muda, M.; Dixon, J.E.; Zipursky, S. Drosophila Dscam Is an Axon Guidance Receptor Exhibiting Extraordinary Molecular Diversity. Cell 2000, 101, 671–684. [Google Scholar] [CrossRef]
- Gueroussov, S.; Gonatopoulos-Pournatzis, T.; Irimia, M.; Raj, B.; Lin, Z.-Y.; Gingras, A.; Blencowe, B.J. An alternative splicing event amplifies evolutionary differences between vertebrates. Science 2015, 349, 868–873. [Google Scholar] [CrossRef]
- Yin, Z.; Zhang, F.; Smith, J.; Kuo, R.; Hou, Z.-C. Full-length transcriptome sequencing from multiple tissues of duck, Anas platyrhynchos. Sci. Data 2019, 6, 1–9. [Google Scholar] [CrossRef]
- Park, M.Y.; Jang, H.D.; Lee, S.Y.; Lee, K.J.; Kim, E. Fas-associated factor-1 inhibits nuclear factor-kappaB (NF-kappaB) activity by interfering with nuclear translocation of the RelA (p65) subunit of NF-kappaB. J. Biol. Chem. 2004, 279, 2544–2549. [Google Scholar] [CrossRef]
- Park, M.Y.; Moon, J.H.; Lee, K.S.; Choi, H.I.; Chung, J.; Hong, H.J.; Kim, E. FAF1 suppresses IkappaB kinase (IKK) activation by disrupting the IKK complex assembly. J. Biol. Chem. 2007, 282, 27572–27577. [Google Scholar] [CrossRef] [PubMed]
- Menges, C.W.; Altomare, D.A.; Testa, J.R. FAS-associated factor 1 (FAF1): Diverse functions and implications for oncogenesis. Cell Cycle 2009, 8, 2528–2534. [Google Scholar] [CrossRef] [PubMed]
- Song, E.J.; Yim, S.-H.; Kim, E.; Kim, N.-S.; Lee, K.J. Human Fas-Associated Factor 1, Interacting with Ubiquitinated Proteins and Valosin-Containing Protein, Is Involved in the Ubiquitin-Proteasome Pathway. Mol. Cell. Biol. 2005, 25, 2511–2524. [Google Scholar] [CrossRef] [PubMed]
- Jang, M.-S.; Sul, J.-W.; Choi, B.-J.; Lee, S.-J.; Suh, J.-H.; Kim, N.-S.; Kim, W.H.; Lim, D.-S.; Lee, C.-W.; Kim, E.-H. Negative Feedback Regulation of Aurora-A via Phosphorylation of Fas-associated Factor-1. J. Biol. Chem. 2008, 283, 32344–32351. [Google Scholar] [CrossRef]
- Zhang, L.; Zhou, F.; Van Laar, T.; Zhang, J.; van Dam, H.; Dijke, P.T. Fas-associated factor 1 antagonizes Wnt signaling by promoting β-catenin degradation. Mol. Biol. Cell 2011, 22, 1617–1624. [Google Scholar] [CrossRef]
- Steinhart, Z.; Angers, S. Wnt signaling in development and tissue homeostasis. Development 2018, 145, dev146589. [Google Scholar] [CrossRef]
- Rudnicki, M.A.; Williams, B.O. Wnt signaling in bone and muscle. Bone 2015, 80, 60–66. [Google Scholar] [CrossRef] [PubMed]
- Adham, I.M.; Khulan, J.; Held, T.; Schmidt, B.; Meyer, B.I.; Meinhardt, A.; Engel, W. Fas-associated factor (FAF1) is required for the early cleavage-stages of mouse embryo. Mol. Hum. Reprod. 2008, 14, 207–213. [Google Scholar] [CrossRef]
- Ryu, S.-W.; Chae, S.-K.; Lee, K.J.; Kim, E. Identification and Characterization of Human Fas Associated Factor 1, hFAF1. Biochem. Biophys. Res. Commun. 1999, 262, 388–394. [Google Scholar] [CrossRef]
- Fröhlich, T.; Risau, W.; Flamme, I. Characterization of novel nuclear targeting and apoptosis-inducing domains in FAS associated factor 1. J. Cell Sci. 1998, 111, 2353–2363. [Google Scholar]
- Siderovski, D.P.; Willard, F.S. The GAPs, GEFs, and GDIs of heterotrimeric G-protein alpha subunits. Int. J. Biol. Sci. 2005, 1, 51–66. [Google Scholar] [CrossRef] [PubMed]
- Berman, D.M.; Kozasa, T.; Gilman, A.G. The GTPase-activating Protein RGS4 Stabilizes the Transition State for Nucleotide Hydrolysis. J. Biol. Chem. 1996, 271, 27209–27212. [Google Scholar] [CrossRef]
- Sjögren, B.; Blazer, L.L.; Neubig, R.R. Regulators of G Protein Signaling Proteins as Targets for Drug Discovery. Prog. Mol. Biol. Transl. Sci. 2010, 91, 81–119. [Google Scholar] [CrossRef]
- Benians, A.; Nobles, M.; Hosny, S.; Tinker, A. Regulators of G-protein Signaling Form a Quaternary Complex with the Agonist, Receptor, and G-protein. J. Biol. Chem. 2005, 280, 13383–13394. [Google Scholar] [CrossRef]
- Bansal, G.; Druey, K.M.; Xie, Z. R4 RGS proteins: Regulation of G-protein signaling and beyond. Pharmacol. Ther. 2007, 116, 473–495. [Google Scholar] [CrossRef] [PubMed]
- De Vries, L. RGS proteins: More than just GAPs for heterotrimeric G proteins. Trends Cell Biol. 1999, 9, 138–144. [Google Scholar] [CrossRef]
- Yu, Y.; Yoon, S.-O.; Poulogiannis, G.; Yang, Q.; Ma, X.M.; Villén, J.; Kubica, N.; Hoffman, G.R.; Cantley, L.C.; Gygi, S.P.; et al. Phosphoproteomic Analysis Identifies Grb10 as an mTORC1 Substrate That Negatively Regulates Insulin Signaling. Science 2011, 332, 1322–1326. [Google Scholar] [CrossRef] [PubMed]
- Liu, B.; Liu, F. Feedback regulation of mTORC1 by Grb10 in metabolism and beyond. Cell Cycle 2014, 13, 2643–2644. [Google Scholar] [CrossRef]
- Smith, F.M.; Holt, L.J.; Garfield, A.S.; Charalambous, M.; Koumanov, F.; Perry, M.; Bazzani, R.; Sheardown, S.A.; Hegarty, B.D.; Lyons, R.J.; et al. Mice with a Disruption of the Imprinted Grb10 Gene Exhibit Altered Body Composition, Glucose Homeostasis, and Insulin Signaling during Postnatal Life. Mol. Cell. Biol. 2007, 27, 5871–5886. [Google Scholar] [CrossRef] [PubMed]
- Deng, Y.; Zhang, M.; Riedel, H. Mitogenic roles of Gab1 and Grb10 as direct cellular partners in the regulation of MAP kinase signaling. J. Cell. Biochem. 2008, 105, 1172–1182. [Google Scholar] [CrossRef]
- Holt, L.J.; Siddle, K. Grb10 and Grb14: Enigmatic regulators of insulin action–and more? Biochem. J. 2005, 388, 393–406. [Google Scholar] [CrossRef]
- Desbuquois, B.; Carré, N.; Burnol, A.F. Regulation of insulin and type 1 insulin-like growth factor signaling and action by the Grb10/14 and SH2B1/B2 adaptor proteins. FEBS J. 2013, 280, 794–816. [Google Scholar] [CrossRef]
- Jahn, T.; Seipel, P.; Urschel, S.; Peschel, C.; Duyster, J. Role for the Adaptor Protein Grb10 in the Activation of Akt. Mol. Cell. Biol. 2002, 22, 979–991. [Google Scholar] [CrossRef]
- Langlais, P.; Dong, L.Q.; Ramos, F.J.; Hu, D.; Li, Y.; Quon, M.J.; Liu, F. Negative Regulation of Insulin-Stimulated Mitogen-Activated Protein Kinase Signaling By Grb10. Mol. Endocrinol. 2004, 18, 350–358. [Google Scholar] [CrossRef] [PubMed][Green Version]
- Monami, G.; Emiliozzi, V.; Morrione, A. Grb10/Nedd4-mediated multiubiquitination of the insulin-like growth factor receptor regulates receptor internalization. J. Cell Physiol. 2008, 216, 426–437. [Google Scholar] [CrossRef] [PubMed]
- Wang, L.; Balas, B.; Christ-Roberts, C.Y.; Kim, R.Y.; Ramos, F.J.; Kikani, C.K.; Li, C.; Deng, C.; Reyna, S.; Musi, N.; et al. Peripheral Disruption of the Grb10 Gene Enhances Insulin Signaling and Sensitivity In Vivo. Mol. Cell. Biol. 2007, 27, 6497–6505. [Google Scholar] [CrossRef]
- Verbrugge, S.A.J.; Schönfelder, M.; Becker, L.; Nezhad, F.Y.; De Angelis, M.H.; Wackerhage, H. Genes Whose Gain or Loss-Of-Function Increases Skeletal Muscle Mass in Mice: A Systematic Literature Review. Front. Physiol. 2018, 9, 553. [Google Scholar] [CrossRef] [PubMed]
- Du, S.J.; Tan, X.; Zhang, J. SMYD Proteins: Key Regulators in Skeletal and Cardiac Muscle Development and Function. Anat. Rec. Adv. Integr. Anat. Evol. Biol. 2014, 297, 1650–1662. [Google Scholar] [CrossRef] [PubMed]
- Kristin, L.; Mark, B. SET/MYND Lysine Methyltransferases Regulate Gene Transcription and Protein Activity. Genes 2011, 2, 210–218. [Google Scholar]
- Fujii, T.; Tsunesumi, S.I.; Yamaguchi, K.; Watanabe, S.; Furukawa, Y. Smyd3 Is Required for the Development of Cardiac and Skeletal Muscle in Zebrafish. PLoS ONE 2011, 6, e23491. [Google Scholar] [CrossRef]
- Tracy, C.M.; Warren, J.S.; Szulik, M.; Wang, L.; Garcia, J.; Makaju, A.; Russell, K.; Miller, M.; Franklin, S. The Smyd family of methyltransferases: Role in cardiac and skeletal muscle physiology and pathology. Curr. Opin. Physiol. 2018, 1, 140–152. [Google Scholar] [CrossRef]
- Proserpio, V.; Fittipaldi, R.; Ryall, J.G.; Sartorelli, V.; Caretti, G. The methyltransferase SMYD3 mediates the recruitment of transcriptional cofactors at the myostatin and c-Met genes and regulates skeletal muscle atrophy. Genes Dev. 2013, 27, 1299–1312. [Google Scholar] [CrossRef]
- Palstra, A.P.; Tudorache, C.; Rovira, M.; Brittijn, S.A.; Burgerhout, E.; Thillart, G.E.E.J.M.V.D.; Spaink, H.P.; Planas, J.V. Establishing Zebrafish as a Novel Exercise Model: Swimming Economy, Swimming-Enhanced Growth and Muscle Growth Marker Gene Expression. PLoS ONE 2010, 5, e14483. [Google Scholar] [CrossRef] [PubMed]
- Zhang, L.; Zhou, Y.; Wu, W.; Hou, L.; Chen, H.; Zuo, B.; Xiong, Y.; Yang, J. Skeletal Muscle-Specific Overexpression of PGC-1α Induces Fiber-Type Conversion through Enhanced Mitochondrial Respiration and Fatty Acid Oxidation in Mice and Pigs. Int. J. Biol. Sci. 2017, 13, 1152–1162. [Google Scholar] [CrossRef]
- Barton, P.J.R.; Townsend, P.J.; Brand, N.J.; Yacoub, M.H. Localization of the fast skeletal muscle troponin I gene (TNNI2) to 11p15.5: Genes for troponin I and T are organized in pairs. Ann. Hum. Genet. 1997, 61, 519–523. [Google Scholar] [CrossRef]
- Sheng, J.-J.; Jin, J.-P. TNNI1, TNNI2 and TNNI3: Evolution, regulation, and protein structure–function relationships. Gene 2016, 576, 385–394. [Google Scholar] [CrossRef] [PubMed]
- Zhu, X.; Wang, F.; Zhao, Y.; Yang, P.; Chen, J.; Sun, H.; Liu, L.; Li, W.; Pan, L.; Guo, Y.; et al. A Gain-of-Function Mutation in Tnni2 Impeded Bone Development through Increasing Hif3a Expression in DA2B Mice. PLoS Genet. 2014, 10, e1004589. [Google Scholar] [CrossRef] [PubMed]
- Farah, C.S.; Miyamoto, C.; Ramos, C.H.; Da Silva, A.C.; Quaggio, R.B.; Fujimori, K.; Smillie, L.B.; Reinach, F.C. Structural and regulatory functions of the NH2- and COOH-terminal regions of skeletal muscle troponin I. J. Biol. Chem. 1994, 269, 5230–5240. [Google Scholar]
- Yoshimoto, Y.; Ikemoto-Uezumi, M.; Hitachi, K.; Fukada, S.-I.; Uezumi, A. Methods for Accurate Assessment of Myofiber Maturity During Skeletal Muscle Regeneration. Front. Cell Dev. Biol. 2020, 8, 267. [Google Scholar] [CrossRef]
- Vigoreaux, J.O. Genetics of theDrosophila flight muscle myofibril: A window into the biology of complex systems. BioEssays 2001, 23, 1047–1063. [Google Scholar] [CrossRef] [PubMed]
- Zhu, L.; Lyons, G.E.; Juhasz, O.; Joya, J.E.; Hardeman, E.C.; Wade, R. Developmental Regulation of Troponin I Isoform Genes in Striated Muscles of Transgenic Mice. Dev. Biol. 1995, 169, 487–503. [Google Scholar] [CrossRef]
- Duperret, E.K.; Ridky, T.W. Focal adhesion complex proteins in epidermis and squamous cell carcinoma. Cell Cycle 2013, 12, 3272–3285. [Google Scholar] [CrossRef]
- Graham, Z.A.; Gallagher, P.M.; Cardozo, C.P. Focal adhesion kinase and its role in skeletal muscle. J. Muscle Res. Cell Motil. 2015, 36, 305–315. [Google Scholar] [CrossRef]
- Wagner, E.F.; Nebreda, Á.R. Signal integration by JNK and p38 MAPK pathways in cancer development. Nat. Rev. Cancer 2009, 9, 537–549. [Google Scholar] [CrossRef] [PubMed]
- Ito, N.; Ruegg, U.T.; Takeda, S. ATP-Induced Increase in Intracellular Calcium Levels and Subsequent Activation of mTOR as Regulators of Skeletal Muscle Hypertrophy. Int. J. Mol. Sci. 2018, 19, 2804. [Google Scholar] [CrossRef]
- Desmarais, V.; Ghosh, M.; Eddy, R.; Condeelis, J.S. Cofilin takes the lead. J. Cell Sci. 2004, 118, 19–26. [Google Scholar] [CrossRef] [PubMed]
- Le Clainche, C.; Carlier, M.-F. Regulation of Actin Assembly Associated With Protrusion and Adhesion in Cell Migration. Physiol. Rev. 2008, 88, 489–513. [Google Scholar] [CrossRef] [PubMed]
- Tang, D.D.; Gerlach, B.D. The roles and regulation of the actin cytoskeleton, intermediate filaments and microtubules in smooth muscle cell migration. Respir. Res. 2017, 18, 1–12. [Google Scholar] [CrossRef] [PubMed]


| Groups | Primer Name | Primer Sequence (5′-3′) | Amplicon Size | Regulated |
|---|---|---|---|---|
| gCHD | F: TGCAGAAGCAATATTACAAGT | Male: 467 bp Female: 467 bp, 326 bp | ||
| R: AATTCATTATCATCTGGTGG | ||||
| BE17B_vs_BE21B | HOXC6 | F:CCAAAACAGGAACACTTCGCA | 167 bp | Down |
| R:AAAAGTCGCTCAGCCTGTTCT | ||||
| KIF1A | F:AAAGGGCTACCTGCACTTCC | 188 bp | Down | |
| R:CTGCACCCACCTTCAGCAT | ||||
| BE17B_vs_BE27B | SOX7 | F:AGATGGACCGCAACGAAT | 150 bp | Up |
| R:CAGCAAGGACGGAGATGA | ||||
| GPR37 | F:CGCCAGTCCTCCTTTTCTGT | 175 bp | Down | |
| R:ATTTCACGACGGATGGTGCT | ||||
| BE17B_vs_BE31B | FUT9 | F:GACGTACTTGGTCTGGGTCA | 158 bp | Up |
| R:GCACCCCACCTTACAACCTC | ||||
| POLA1 | F:CCGCTCAGAAAGGAGGTGATT | 172 bp | Up | |
| R:CTCCCTTTTCAGCCCATCACT | ||||
| BE17B_vs_BE34B | ANLN | F:TTCCAGGACAAGGTTCCTGTT R:AGTTTATCCGGCCCAAAGGAT | 229 bp | Down |
| BE17B_vs_BM6B | FGF19 | F: TGTCTTTGCTTGGCGCTACT R:CAGTGTACGGTGTGGTTGAGT | 214 bp | Down |
| SPIN1 | F:TCGGATTAGTGATGCCCACC R:CTGGCCTACTTACTGGAATCGG | 240 bp | Down | |
| BE17L_vs_BE21L | SSU72 | F:CAAGCCACGACCAGAGAGAT R:GGGTTGCCTCCTCATGGTTA | 176 bp | Up |
| DLX5 | F:ACCCTGCTGTGCGTAAGA R:GGAAAGGAGCCTGGAAGT | 232 bp | Down | |
| BE17L_vs_BE27L | PTPN6 | F:TCTCCTATCCCGTGAGCCAA R:ATTTTCTGCCCACCCCTAGC | 131 bp | Down |
| BE17L_vs_BE31L | LMAN2 | F:GGGAGTTTTCCTTGCCCCAG R:GTTGGTTCACTTTGTTCTGCCC | 196 bp | Down |
| GALNT1 | F:AGGGGAAGGTCGGGAAAGTT R:ACAGGCAGTCCTCCTACTCAA | 201 bp | Down | |
| BE17L_vs_BE34L | DCAF7 | F:GTACAGCAGGTAGGTGTGGAA R:TGCCATCCAATAAGCAGGCAT | 226 bp | Down |
| BE17L_vs_BM6L | TACR2 | F:CATCGCAGTGATCGTGTTGA R:CGTGCAAGCTCTGTGTTGGA | 229 bp | Up |
| TULP3 | F:GGCCACTGGTAATGACATGCT R:GTAGCTCGCTCCAAAGACAGT | 109 bp | Down | |
| BE17B_vs_BE17L | LMO1 | F:GCGATTCTGTGTGGGAGACA R:TTGAACCTGGGACTCGAAGC | 106 bp | Up |
| BE21B_vs_BE21L | CYGB | F:GAGGCGGAGAAGAAGGTGATT R:CGTGTCGTCCATGTGCTTGA | 147 bp | Up |
| TMEM171 | F:CTGATGTGAACCTCCAGGGC R:TGGTGGTGGAGGTGGGAATA | 218 bp | Down | |
| BE27B_vs_BE27L | ABI3BP | F:CGAAACCATCTGCTACCCCA R:TGACTGACACCGGAATGGC | 213 bp | Up |
| MTSS1 | F:TACAGCACCCAGACGACAAC R:AAACTCTTGCTGCTCTGCCT | 114 bp | Down | |
| BE31B_vs_BE31L | USP7 | F:GTCTGTCCGGGTAGAGTCGT R:GAATACACACCCATGTTGCAGG | 242 bp | Down |
| BE34B_vs_BE34L | FNBP4 | F:ACGAAAATGCCGTCTCTGGT R:CGAAGTTGGCGTTCCTCTCT | 172 bp | Up |
| BM6B_vs_BM6L | POSTN | F:GCAGGGAGCTGGAACTGAG R:TGTTGCTCCTCCTTGTGTCC | 148 bp | Up |
| PITX1 | F:AGCACTCCAGTTTCGGCTAC R:CTCACTTGCTCGGGTTTTGC | 226 bp | Down | |
| β-actin | F: CCCTGTATGCCTCTGGTCG R: CTCGGCTGTGGTGGTGAAG | 194 bp |
| Ingredient | Content (%) | Nutrient | Content (%) |
|---|---|---|---|
| Corn | 56.00 | Crude protein | 15.700 |
| Soybean meal | 23.80 | Calcium | 0.900 |
| Corn gluten meal | 10.00 | Total phosphorus | 0.680 |
| Limestone | 7.00 | Available phosphorus | 0.450 |
| CaHPO4 | 1.50 | Salt | 0.370 |
| Premix | 1.00 | Lysine | 0.760 |
| NaCl | 0.30 | Methionine | 0.387 |
| Lys·HCl | 0.30 | Methionine + Cystine | 0.654 |
| DL-Met | 0.10 | Isoleucine | 0.534 |
| Total | 100.00 | Threonine | 0.579 |
| Tryptophan | 0.194 | ||
| Crude fiber | 4.100 | ||
| Crude fat | 3.400 | ||
| Crude ash | 5.200 | ||
| Avian metabolizable energy | 2875 Mcal·kg−1 |
| Samples | Clean Reads | Clean Bases | GC Content | ≥Q30 (%) |
|---|---|---|---|---|
| BE17B1 | 26,764,472 | 7,980,103,934 | 50.51% | 93.57% |
| BE17B2 | 32,024,936 | 9,563,668,162 | 50.63% | 93.35% |
| BE17B3 | 23,594,320 | 7,046,658,352 | 50.99% | 92.86% |
| BE17L1 | 26,550,573 | 7,917,527,738 | 50.81% | 93.07% |
| BE17L2 | 33,105,790 | 9,881,964,696 | 51.01% | 92.80% |
| BE17L3 | 22,233,811 | 6,608,083,230 | 50.44% | 93.75% |
| BE21B1 | 21,356,816 | 6,372,442,332 | 50.93% | 93.10% |
| BE21B2 | 23,023,064 | 6,874,209,792 | 50.50% | 92.30% |
| BE21B3 | 22,232,157 | 6,643,515,660 | 50.10% | 91.93% |
| BE21L1 | 27,233,943 | 8,132,501,326 | 50.35% | 92.25% |
| BE21L2 | 23,821,161 | 7,114,195,066 | 50.77% | 92.71% |
| BE21L3 | 25,252,424 | 7,545,013,174 | 51.35% | 92.99% |
| BE27B1 | 26,005,019 | 7,766,530,628 | 51.05% | 92.74% |
| BE27B2 | 26,902,913 | 8,034,045,734 | 50.82% | 92.73% |
| BE27B3 | 24,226,391 | 7,227,540,800 | 51.53% | 92.75% |
| BE27L1 | 23,634,707 | 7,060,587,498 | 51.47% | 92.59% |
| BE27L2 | 25,561,499 | 7,630,071,354 | 51.34% | 93.31% |
| BE27L3 | 29,341,501 | 8,760,492,104 | 51.16% | 93.13% |
| BE31B1 | 21,708,384 | 6,481,320,616 | 50.43% | 93.32% |
| BE31B2 | 21,045,091 | 6,284,463,090 | 50.48% | 92.65% |
| BE31B3 | 23,666,137 | 7,071,687,724 | 50.01% | 93.80% |
| BE31L1 | 21,773,785 | 6,504,542,434 | 50.79% | 92.41% |
| BE31L2 | 19,700,766 | 5,883,221,398 | 50.94% | 92.35% |
| BE31L3 | 25,067,398 | 7,480,770,550 | 50.95% | 92.68% |
| BE34B1 | 19,970,569 | 5,959,632,696 | 51.20% | 91.89% |
| BE34B2 | 21,641,494 | 6,468,354,774 | 50.57% | 92.51% |
| BE34B3 | 24,247,593 | 7,240,167,310 | 50.04% | 91.36% |
| BE34L1 | 19,825,346 | 5,925,722,250 | 49.19% | 92.01% |
| BE34L2 | 20,622,571 | 6,154,061,186 | 50.82% | 91.72% |
| BE34L3 | 21,504,291 | 6,418,738,234 | 50.92% | 91.70% |
| BM6B1 | 27,888,927 | 8,312,322,988 | 52.05% | 93.09% |
| BM6B2 | 26,315,704 | 7,841,240,550 | 51.31% | 93.29% |
| BM6B3 | 32,141,926 | 9,592,590,862 | 52.51% | 92.91% |
| BM6L1 | 22,567,829 | 6,744,703,784 | 56.80% | 92.26% |
| BM6L2 | 25,330,860 | 7,561,056,178 | 53.01% | 92.95% |
| BM6L3 | 26,270,786 | 7,826,518,320 | 50.75% | 93.01% |
| Samples | SNP Number | Genic SNP | Intergenic SNP | Transition | Transversion | Heterozygosity |
|---|---|---|---|---|---|---|
| BE17B1 | 483,071 | 442,220 | 40,851 | 71.88% | 28.12% | 5.15% |
| BE17B2 | 533,462 | 479,697 | 53,765 | 71.91% | 28.09% | 5.18% |
| BE17B3 | 459,298 | 410,856 | 48,442 | 71.94% | 28.06% | 5.03% |
| BE17L1 | 444,914 | 405,784 | 39,130 | 72.19% | 27.81% | 5.32% |
| BE17L2 | 530,400 | 482,360 | 48,040 | 71.78% | 28.22% | 5.49% |
| BE17L3 | 458,580 | 416,890 | 41,690 | 72.03% | 27.97% | 5.09% |
| BE21B1 | 431,604 | 387,058 | 44,546 | 72.05% | 27.95% | 4.92% |
| BE21B2 | 468,195 | 420,675 | 47,520 | 71.82% | 28.18% | 4.96% |
| BE21B3 | 440,935 | 395,737 | 45,198 | 71.80% | 28.20% | 4.73% |
| BE21L1 | 437,821 | 400,429 | 37,392 | 72.14% | 27.86% | 5.25% |
| BE21L2 | 389,009 | 356,065 | 32,944 | 72.51% | 27.49% | 5.24% |
| BE21L3 | 347,547 | 315,990 | 31,557 | 72.68% | 27.32% | 5.79% |
| BE27B1 | 536,317 | 492,673 | 43,644 | 71.70% | 28.30% | 5.22% |
| BE27B2 | 634,028 | 574,484 | 59,544 | 71.12% | 28.88% | 4.74% |
| BE27B3 | 542,335 | 494,968 | 47,367 | 71.56% | 28.44% | 4.88% |
| BE27L1 | 406,931 | 374,739 | 32,192 | 72.26% | 27.74% | 4.27% |
| BE27L2 | 412,229 | 379,360 | 32,869 | 72.25% | 27.75% | 5.59% |
| BE27L3 | 446,540 | 410,485 | 36,055 | 71.98% | 28.02% | 5.50% |
| BE31B1 | 463,381 | 425,359 | 38,022 | 71.92% | 28.08% | 5.23% |
| BE31B2 | 475,408 | 426,377 | 49,031 | 71.77% | 28.23% | 5.28% |
| BE31B3 | 437,040 | 398,822 | 38,218 | 71.91% | 28.09% | 5.40% |
| BE31L1 | 293,728 | 264,407 | 29,321 | 72.66% | 27.34% | 5.07% |
| BE31L2 | 290,393 | 261,387 | 29,006 | 72.68% | 27.32% | 4.31% |
| BE31L3 | 356,589 | 317,875 | 38,714 | 72.17% | 27.83% | 5.23% |
| BE34B1 | 353,066 | 320,045 | 33,021 | 72.24% | 27.76% | 5.03% |
| BE34B2 | 66,777 | 60,706 | 6071 | 74.87% | 25.13% | 47.28% |
| BE34B3 | 466,221 | 416,752 | 49,469 | 71.79% | 28.21% | 4.87% |
| BE34L1 | 401,531 | 359,502 | 42,029 | 71.91% | 28.09% | 5.05% |
| BE34L2 | 347,704 | 312,392 | 35,312 | 72.09% | 27.91% | 5.00% |
| BE34L3 | 326,042 | 295,401 | 30,641 | 72.38% | 27.62% | 5.59% |
| BM6B1 | 76,822 | 69,735 | 7087 | 74.74% | 25.26% | 42.54% |
| BM6B2 | 76,472 | 70,083 | 6389 | 74.82% | 25.18% | 40.16% |
| BM6B3 | 114,505 | 104,733 | 9772 | 73.88% | 26.12% | 38.46% |
| BM6L1 | 23,381 | 20,572 | 2809 | 76.34% | 23.66% | 48.09% |
| BM6L2 | 66,117 | 60,659 | 5458 | 75.23% | 24.77% | 44.45% |
| BM6L3 | 85,270 | 77,902 | 7368 | 74.24% | 25.76% | 40.48% |
| DEGs | DEGnumber (newGene) | Up-Regulated (newGene) | Down-Regulated (newGene) |
|---|---|---|---|
| BE17B_vs_BE21B | 410 (24) | 218 (22) | 192 (2) |
| BE17B_vs_BE27B | 1958 (148) | 1162 (138) | 796 (10) |
| BE17B_vs_BE31B | 1517 (108) | 925 (101) | 592 (7) |
| BE17B_vs_BE34B | 1460 (79) | 852 (73) | 608 (6) |
| BE17B_vs_BM6B | 5377 (339) | 2580 (187) | 2797 (152) |
| BE17L_vs_BE21L | 655 (24) | 371 (16) | 284 (8) |
| BE17L_vs_BE27L | 2866 (185) | 1606 (148) | 1260 (37) |
| BE17L_vs_BE31L | 4413 (344) | 2440 (295) | 1973 (49) |
| BE17L_vs_BE34L | 4326 (342) | 2374 (299) | 1952 (43) |
| BE17L_vs_BM6L | 4560 (303) | 2303 (168) | 2257 (135) |
| BE17B_vs_BE17L | 214 (13) | 162 (6) | 52 (7) |
| BE21B_vs_BE21L | 1256 (194) | 523 (20) | 733 (174) |
| BE27B_vs_BE27L | 195 (27) | 51 (2) | 144 (25) |
| BE31B_vs_BE31L | 1226 (96) | 606 (63) | 620 (33) |
| BE34B_vs_BE34L | 19 (3) | 5 (1) | 14 (2) |
| BM6B_vs_BM6L | 104 (13) | 58 (6) | 46 (7) |
| DEGs | The Most Enriched GO Terms | ||||
|---|---|---|---|---|---|
| BE17B_vs_BE21B | regulation of calcium ion import | regulation of muscle filament sliding speed | regulation of euchromatin binding | dorsal root ganglion development | negative regulation of fibroblast growth factor receptor signaling pathway |
| BE17B_vs_BE27B | actin binding | motor activity | positive regulation of myoblast proliferation | cell division | positive regulation of cell proliferation |
| BE17B_vs_BE31B | striated muscle contraction | regulation of muscle filament sliding | skeletal muscle fiber development | muscle contraction | positive regulation of myoblast differentiation |
| BE17B_vs_BE34B | chordate embryonic development | regulation of cell cycle | positive regulation of fibroblast proliferation | muscle contraction | positive regulation of substrate-dependent cell migration |
| BE17B_vs_BM6B | translation | immune response | regulation of cell size | regulation of cell growth | regulation of G2/M transition mitotic cell cycle |
| BE17L_vs_BE21L | cell proliferation | muscle contraction | skeletal muscle fiber development | skeletal muscle tissus development | regulation of muscle filament sliding |
| BE17L_vs_BE27L | egulation of transcription involved in cell fate commitment | calcium-mediated signaling | glucose transport | signal transduction | Wnt signaling pathway, calcium modulating pathway |
| BE17L_vs_BE31L | cell maturation | embryonic limb morphogenesis | muscle contraction | chordate embryonic development | immune response |
| BE17L_vs_BE34L | embryonic hindlimb morphogenesis | positive regulation of protein process | regulation of actin cytoskeleton organization | positive regulation of cell proliferation | L-glutamate transmembrane transport |
| BE17L_vs_BM6L | Wnt receptor catabolic process | embryonic hindlimb morphogenesis | glucose transport | protein folding | immune response |
| BE17B_vs_BE17L | myoblast migration involved in skeletal muscle regeneration | positive regulation of glucocorticoid receptor signaling pathways | regulation of multicellular organism growth | cell adhesion | skeletal system development |
| BE21B_vs_BE21L | positive regulation of cellular process | metabolic process | fibroblast migration | RNA-dependent DNA biosynthetic process | positive regulation of cellular process |
| BE27B_vs_BE27L | positive regulation of MHC class I biosynthetic process | immune response | metabotic process | ubiquitin-dependent protein catabolic process | transmembrane transport |
| BE31B_vs_BE31L | regulation of cell shape | embryonic organ development | translation | muscle structure morphogenesis | DNA-dependent DNA replication |
| BE34B_vs_BE34L | skeletal muscle cell differentiation | skeletal muscle fiber adaptation | myotube differentiation involved in skeletal muscle regeneration | positive regulation of skeletal muscle tissue regeneration | protein phosphorylation |
| BM6B_vs_BM6L | muscle structure development | regulation of biological quality | myoblast fate commitment | embryonic skeletal joint morphogenesis | negative regulation of skeletal muscle tissue development |
| DEGs | KEGG Enrichment | ||||
|---|---|---|---|---|---|
| BE17B_vs_BE21B | Focal adhesion | Regulation of actin cytoskeleton | MAPK signaling pathway | Wnt signaling pathway | ECM–receptor interaction |
| BE17B_vs_BE27B | Focal adhesion | Neuroactive ligand-receptor interaction | Purine metabolism | MAPK signaling pathway | Calcium signaling pathway |
| BE17B_vs_BE31B | Focal adhesion | MAPK signaling pathway | Purine metabolism | Cell cycle | Calcium signaling pathway |
| BE17B_vs_BE34B | Focal adhesion | MAPK signaling pathway | Neuroactive ligand–receptor interaction | Regulation of actin cytoskeleton | Endocytosis |
| BE17B_vs_BM6B | Leukocyte transendothelial migration | Thiamine metabolism | ErbB signaling pathway | Glucagon signaling pathway | RIG–I–like receptor signaling pathway |
| BE17L_vs_BE21L | Focal adhesion | Neuroactive ligand–receptor interaction | ECM–receptor interaction | MAPK signaling pathway | Regulation of actin cytoskeleton |
| BE17L_vs_BE27L | Neuroactive ligand–receptor interaction | Focal adhesion, | Calcium signaling pathway | MAPK signaling pathway | Oxidative phosphorylation |
| BE17L_vs_BE31L | Ribosome | Focal adhesion | Oxidative phosphorylation | MAPK signaling pathway | Regulation of actin cytoskeleton |
| BE17L_vs_BE34L | Focal adhesion | Neuroactive ligand–receptor interaction | Regulation of actin cytoskeleton | Oxidative phosphorylation | MAPK signaling pathway |
| BE17L_vs_BM6L | Neuroactive ligand–receptor interaction | MAPK signaling pathway | Oxidative phosphorylation | Focal adhesion | Calcium signaling pathway |
| BE17B_vs_BE17L | Focal adhesion | Neuroactive ligand–receptor interaction | ECM-receptor interaction | Cytokine–cytokine receptor interaction | Phagosome |
| BE21B_vs_BE21L | Focal adhesion | ECM–receptor interaction | Regulation of actin cytoskeleton | Phagosome | Neuroactive ligand–receptor interaction |
| BE27B_vs_BE27L | Glycerophospholipid metabolism | Glycerolipid metabolism | Tight junction | Cell adhesion molecules (CAMs) | Biosynthesis of amino acids |
| BE31B_vs_BE31L | Oxidative phosphorylation | Ribosome | Regulation of actin cytoskeleton | Calcium signaling pathway | MAPK signaling pathway |
| BE34B_vs_BE34L | Cell cycle | Endocytosis | MAPK signaling pathway | Cytokine–cytokine receptor interaction | Ubiquitin mediated proteolysis |
| BM6B_vs_BM6L | Adrenergic signaling in cardiomyocytes | Tight junction | Cardiac muscle contraction | MAPK signaling pathway | Apoptosis |
Publisher’s Note: MDPI stays neutral with regard to jurisdictional claims in published maps and institutional affiliations. |
© 2020 by the authors. Licensee MDPI, Basel, Switzerland. This article is an open access article distributed under the terms and conditions of the Creative Commons Attribution (CC BY) license (http://creativecommons.org/licenses/by/4.0/).
Share and Cite
Hu, Z.; Cao, J.; Liu, G.; Zhang, H.; Liu, X. Comparative Transcriptome Profiling of Skeletal Muscle from Black Muscovy Duck at Different Growth Stages Using RNA-seq. Genes 2020, 11, 1228. https://doi.org/10.3390/genes11101228
Hu Z, Cao J, Liu G, Zhang H, Liu X. Comparative Transcriptome Profiling of Skeletal Muscle from Black Muscovy Duck at Different Growth Stages Using RNA-seq. Genes. 2020; 11(10):1228. https://doi.org/10.3390/genes11101228
Chicago/Turabian StyleHu, Zhigang, Junting Cao, Guangyu Liu, Huilin Zhang, and Xiaolin Liu. 2020. "Comparative Transcriptome Profiling of Skeletal Muscle from Black Muscovy Duck at Different Growth Stages Using RNA-seq" Genes 11, no. 10: 1228. https://doi.org/10.3390/genes11101228
APA StyleHu, Z., Cao, J., Liu, G., Zhang, H., & Liu, X. (2020). Comparative Transcriptome Profiling of Skeletal Muscle from Black Muscovy Duck at Different Growth Stages Using RNA-seq. Genes, 11(10), 1228. https://doi.org/10.3390/genes11101228