Article

Systematic Identification and Evolution Analysis of Sox Genes in Coturnix japonica Based on Comparative Genomics

1
The Institute of Bioinformatics, College of Life Sciences, Anhui Normal University, Wuhu, 241000, China
2
State Key Laboratory of Genetic Resources and Evolution, Kunming Institute of Zoology, Chinese Academy of Sciences, Kunming, 650000, China
3
The Provincial Key Laboratory of the Conservation and Exploitation Research of Biological Resources in Anhui, Wuhu, 241000, China
*
Authors to whom correspondence should be addressed.
Genes 2019, 10(4), 314; https://doi.org/10.3390/genes10040314
Submission received: 15 February 2019 / Revised: 16 April 2019 / Accepted: 20 April 2019 / Published: 22 April 2019
(This article belongs to the Section Animal Genetics and Genomics)

Abstract

:
Coturnix japonica (Japanese quail) has been extensively used as a model animal for biological studies. The Sox gene family, which was systematically characterized by a high-mobility group (HMG-box) in many animal species, encodes transcription factors that play central roles during multiple developmental processes. However, genome-wide investigations on the Sox gene family in birds are scarce. In the current study, we first performed a genome-wide study to explore the Sox gene family in galliform birds. Based on available genomic sequences retrieved from the NCBI database, we focused on the global identification of the Sox gene family in C. japonica and other species in Galliformes, and the evolutionary relationships of Sox genes. In our result, a total of 35 Sox genes in seven groups were identified in the C. japonica genome. Our results also revealed that dispersed gene duplications contributed the most to the expansion of the Sox gene family in Galliform birds. Evolutionary analyses indicated that Sox genes are an ancient gene family, and strong purifying selections played key roles in the evolution of CjSox genes of C. japonica. More interestingly, we observed that most Sox genes exhibited highly embryo-specific expression in both gonads. Our findings provided new insights into the molecular function and phylogeny of Sox gene family in birds.

1. Introduction

The Sox gene family is defined as a sex-determining region Y (SRY)-related high-mobility group (HMG) box of genes [1]. According to the similarity of HMG domain sequences and structural characteristics, the Sox subfamily is clustered into at least 11 groups (SoxA–K) [2]. The amino acid identity of the same Sox group is usually at least 70% [3]. Groups B–F are found in all vertebrate as core groups [4]. The SoxB gene is the one that duplicated the most recently into SoxB1 and SoxB2, and Sox15 (SoxG) descended from Sox19 (SoxB1) during vertebrate evolution [5]. Interestingly, these core groups probably underwent two duplication and divergence events, often resulting in three closely related Sox genes [3,6]. Non-core groups are lineage-specific, including SoxA in mammals [7], SoxI and SoxJ in Caenorhabditis elegans [1], and SoxK in medaka [8]. Notably, SoxH genes, although previously described as mammalian-specific, have been identified in invertebrates [4]. These non-core groups were considered to have originated from core Sox genes by tandem duplication events and gene losses, e.g., the SRY gene (group A) from Sox3 (group B1), and Sox30 (SoxH) from SoxD [4,5]. Furthermore, subfunctionalization and neofunctionalization are the main reasons for keeping duplicated genes under the selective pressure of evolution [3]. The presence of Sox genes in distantly related species indicates a strong selective pressure on their functional activity.
To date, about 10 Sox genes have been identified in invertebrates, and about 40 Sox genes have been found in vertebrates [9]. Nine Sox genes were detected in Bombyx mori, belonging to five groups of B–F [10]. In humans and mice, there are 20 members, belonging to nine groups (Sox A, B1, B2, C–H) [10]. Sox genes also exist in some other animals, including 20 presented in catfish [11], 13 in sea gooseberry [12], eight in fruit fly [13], and five in nematode [13]. With the identification and further annotation of the Sox gene family, researchers have found that Sox genes play important roles in diverse growth and development processes, such as chondrogenesis, neurogenesis, early embryonic development, and sex determination and differentiation [14]. For example, Sox9 plays an essential role for the survival and proper proliferation of medaka germ cells [15]. Sox7 and Sox18 have been verified to contain redundant roles in arteriovenous specific cation and vascular development in zebrafish [16].
Over the last decade, along with the rapid development of sequencing technologies, the genomic and genetic resources for birds are expanding massively [17,18,19,20,21,22,23]. Now, 12 genome sequences from galliform birds are available from the NCBI database, and eight of which were used in this study, including bamboo partridge [24], chicken [25,26], turkey [27], greater prairie chicken (unpublished), helmeted guineafowl (unpublished), Japanese quail [28], northern bobwhite [29], and scaled quail [30]. Genomic information would be instrumental in helping to understand the Sox gene family in birds. In comparison to mammals, birds have a different sex-determining system (ZZ for males and ZW for females) [31]. This provides a good opportunity to analyze the Sox gene family from a new perspective. Some members of the Sox gene family have been found in birds from the earlier reports. For example, Sox9 cDNAs were isolated from duck and quail (five days and seven days in the gonads) [32]. In several neural crest-derived cell types, the expression of Sox9, Sox10, and Sox5 could activate that of Col2a1 [33]. Sox9 in chicken was observed in seven-day testes with high level expression, while Sox3, Sox4, Sox8, and Sox11 had similar expression levels in both gonads [12]. However, genome-wide investigations of the whole Sox gene family in birds are still largely unknown.
Coturnix japonica (Japanese quail), which belongs to the Galliformes order [34], is a tiny species of Old World quail found in East Asia [35]. It is widely used for meat and egg productions [36]. Moreover, similar to chicken, goose, duck, and pigeon, quail is also easy to rear and has been used extensively as a model animal for biological studies [37,38,39,40]. Due to its economic value, the genome and transcriptome of C. japonica were recently sequenced, laying a solid foundation for the comprehensive analysis of the Sox gene family in C. japonica. The aim of this study was to identify the members of the Sox family in C. japonica and compare them with other Galliformes species to explore the evolutionary relationship of Sox genes among different species.
In the current study, we performed a genome-wide study to explore the Sox gene family in galliform birds. We carried out a phylogenetic analysis of the Sox gene family that included performing structural characterization, studying protein–protein interaction (PPI) and conserved microsynteny, and documenting their large-scale duplication and the influence of strong purifying selection. Furthermore, we also assessed the expression patterns of CjSox genes in gonads. Our findings provided new insights into the molecular function and phylogeny of the Sox gene family in birds.

2. Materials and Methods

2.1. Ethics Statement

The animal experiments in the current study were authorized by the Ethics Committee of Anhui Normal University (Anhui, China) (No. 2018016). All the birds used were sacrificed following a procedure minimizing their suffering as much as possible.

2.2. Incubation Conditions

C. japonica was reared at the animal room environment of Anhui Normal University (Wuhu, China). All the fertilized eggs used in this study were incubated at 38 °C, with 55–65% relative humidity in the fully automatic egg incubator (WQ03 mini egg, by Tongda device manufactory, Dezhou, China) for 15 days. All the quails in the whole experiment were housed in laying cages (90-cm wide, 40-cm deep, 33-cm high, 30 quails per cage), and fed with basal diets. The gonads of incubation period (day 14) and post-hatch period (day 14) quails were chosen for Q-PCR analysis. Here, the incubation period refers the time from the start of uninterrupted incubation to the emergence of the young, and the post-hatch period means the time after quails hatch out of the shell [41].

2.3. Retrieval of Genome Sequences

The genomic sequences of C. japonica and the seven other available Galliformes species were employed for comparative analyses in this study. All the data was downloaded from NCBI (https://www.ncbi.nlm.nih.gov/genome). Three strategies were applied to identify Sox genes from the above genome sequences. First, the released SOX protein sequences of G. gallus were used to query putative SOX homologous proteins using BLASTp program [42] with e-value cutoff 1e-5. Subsequently, the conserved HMG-box domain (InterPro ID: IPR009071) of 79 amino acids was searched against the local database by the local BLASTp program, with an e-value threshold of 1e-4. Irrelevant sequences were deleted manually. Finally, the Pfam and SMART databases were utilized to check the candidate sequences that contained HMG-box domains (InterPro ID: IPR009071).
The data of chromosome locations, CDS (coding sequence) lengths, and number of amino acids were derived from NCBI. The theoretical molecular weight (kDa) and pI (isoelectric points) of each SOX protein were calculated by the pI/MW tool (http://www.expasy.org/tools/). GRAVY (grand average of hydropathy) values were evaluated using the PROTPARAM tool (http://web.expasy.org/protparam/). MCScanX v1.0 was employed to detect the duplicated type and collinear blocks according to a previous report [43].
The DNA and cDNA sequences, corresponding to each predicted gene from the genomes, were downloaded from NCBI. MEME (Multiple Em for Motif Elicitation) version 5.0.2 [44] was used for predicting the conserved motif structures encoded by quail and chicken Sox genes. The GFF (general feature format) files were obtained from the NCBI database, and the R software was used to parse GFF3 files and map Sox genes onto chromosomes [45].

2.4. Phylogenetic Analysis

To study the evolutionary origin of the Sox genes in galliform birds, two data sets were executed as follows. (1) The tree of the eight Galliform species was downloaded by obtaining data from NCBI Common Tree. (2) All the sequences of predicted HMG-box domains from eight galliform species and lizard were aligned by ClustalW in MEGA X with default parameters [46], using the maximum likelihood (ML) method with 1000 bootstrap replicates by RaxML v8.2 (ML) [47], set MmTCF1 as an outgroup [48]. The constructed tree files were visualized using Figtree v1.4.4 (http://tree.bio.ed.ac.uk/software/figtree/) and iTOL v4.2.3 [49].

2.5. Microsynteny, Selection, and Functional Analysis

The microsynteny analysis was used to classify and identify the expansion pattern of the Sox gene family. Three files, including the gene identifier file, gene list file, and CDS file, were generated to carry out the microsynteny analysis. Firstly, all the CjSox genes were located in the C. japonica genome as an anchor point. Then, we analyzed the protein-coding sequences within 20 genes downstream and upstream of each anchor point using the BLASTp program [42]. In the present study, we defined a syntenic block as a region where at least two conserved gene pairs were located within 20 genes downstream and upstream between genomes, and this syntenic block was considered to have originated from a large-scale duplication event [50]. The ratio of non-synonymous (Ka) to synonymous (Ks) substitution rates (Ka/Ks) was calculated for coding sequences with DnaSP v6 [51]. Then, FEL (Fixed Effects Likelihood) was used to select individual codons by DataMonkey [52]. PPI (protein–protein interaction) data was obtained from the online database STRING [53]. GO enrichment analysis was performed by clusterprofiler [54].

2.6. RNA Extraction, Q-PCR, and RNA-Seq Expression Analysis

Total RNAs were isolated from the ovaries and testes using TRIzol reagent (Sangon Biotech Co. Ltd., Shanghai, China). The first-strand cDNA was synthesized from the RNA using a PrimeScript RT reagent Kit with gDNA eraser (TaKaRa, Otsu, Japan) according to the manufacturer’s instructions. Gene-specific primers were designed using Primer-BLAST (https://www.ncbi.nlm.nih.gov/tools/primer-blast/) (the details are shown in Table 1). For the Q-PCR reaction, 1 µL of cDNA was mixed with 10 μL of 2× SuperReal PreMix Plus, 1.6 µL of gene-specific primers (1.0 µM), and 7.4 µL of ddH2O in a PCR reaction mix (SuperReal PreMix Plus (SYBR Green), Qiagen, Tecnolab). Each treatment was carried out in triplicate with a reaction volume of 20 µL, and independently repeated three times. We conducted Q-PCR on the Bio-Rad CFX96 (Bio-Rad Laboratories, Inc., Hercules, CA, USA) with two-step methods, under the following conditions: 95 °C for 15 min, 40 cycles of 95 °C for 10 s, 60 °C for 32 s. We calculated the gene expression by the 2−ΔΔCT method [55]. Three biological replicates were conducted for each sample. The RNA-seq raw data of two developmental stages (incubation and post-hatch periods at 14 days, respectively) were used in quails (unpublished data from our group), and the concrete methods were shown in the previous report [45,56].

3. Results and Discussion

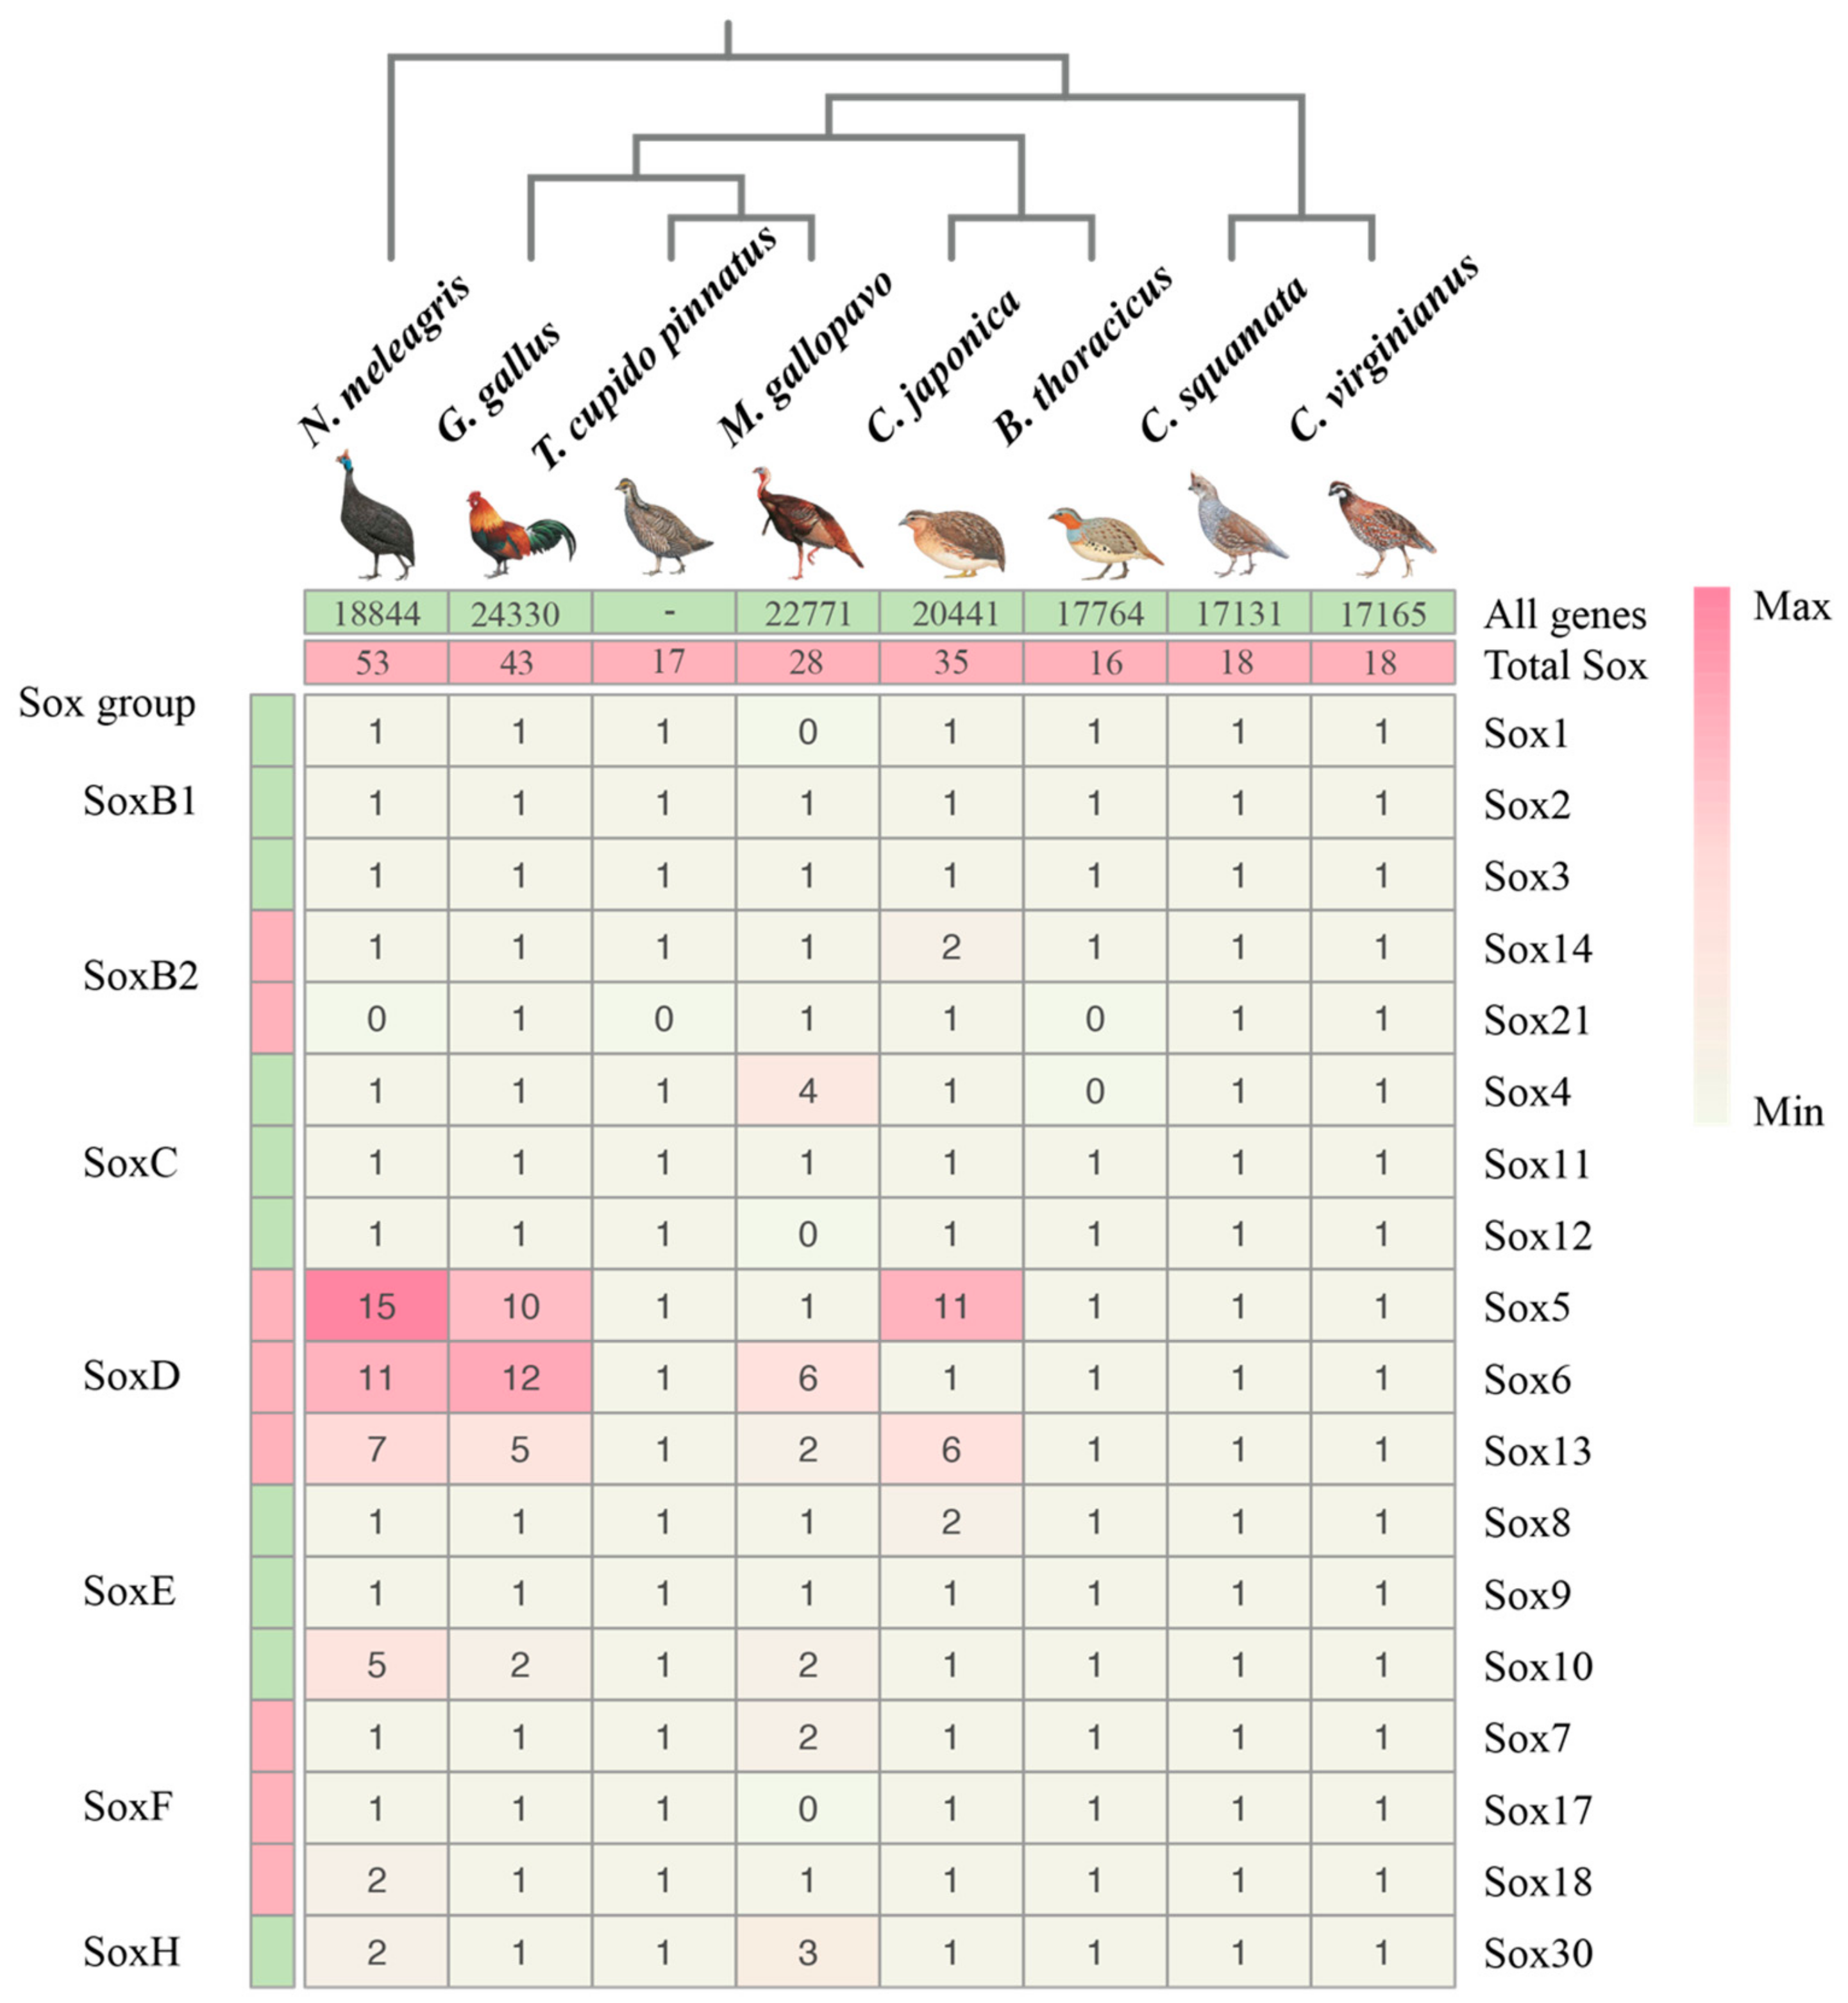
3.1. Genome-Wide Analysis of Galliformes Sox Genes

In recent years, studies on the Sox genes family have been reported in many different animals [57]. However, the genome-wide identification and analyses of Sox genes from avian genomes has not been characterized in detail to our knowledge. In our study, a total of 35 Sox genes (Figure 1) were identified in the C. japonica genome, which had 20,441 genes in this genome. Among eight galliform genomes, three species (Gallus gallus, C. japonica, and Numida meleagris) had over 10 variants in Sox5, and there were over five variants in Sox13. These two genes (Sox5 and Sox13) belong to the SoxD group. More noticeably, four species (G. gallus, C. japonica, Colinus virginianus, and Callipepla squamata) had 18 different Sox gene members, while the remaining species had less (Figure 1 and Table S1). For instance, Sox1, Sox12, and Sox17 were missing for Meleagris gallopavo, Sox4 and Sox21 were missing for Bambusicola thoracicus, and Sox21 were missing for N. meleagris and Tympanuchus cupido pinnatus. The total number of Sox genes of C. japonica (35) was less than those of G. gallus (43) and N. meleagris (53), and more than the other species (Figure 1). Based on their conserved domain structures, the identified Sox gene members of C. japonica were categorized into seven groups as follows: Sox1, Sox2, and Sox3 in the SoxB1 subgroup; Sox14 and Sox21 in the SoxB2 subgroup; Sox4, Sox11, and Sox12 in the SoxC group; Sox5, Sox6, and Sox13 in the SoxD group; Sox8, Sox9, and Sox10 in the SoxE group; Sox7, Sox17, and Sox18 in the SoxF group; and Sox30 in the SoxH group. Notably, four Sox groups (SoxA, SoxG, SoxI, and SoxJ) that are present in mammals [58] were missing in C. japonica and other galliform birds. The category and abundance of Sox gene members in different galliform birds are compared in Figure 1.
Gene duplications have contributed exclusively to the expansion of gene families [59]. We examined five types of gene duplications: singleton, dispersed, proximal, tandem, and WGD (whole-genome duplication) or segmental duplication by the MCScanX program (Table 2). Most Sox genes belonged to the dispersed duplication. Comparatively, the percentage of the dispersed duplication was 100% in C. squamata and B. thoracicus, 92.9% in C. virginianus, 72.2% in C. japonica, 69.2% in M. gallopavo, 66.7% in G. gallus, and 60% in N. meleagris. Our results revealed that dispersed gene duplications contributed the most to the expansion of the Sox gene family in Galliform birds.
Noticeably, we found that genomic data from assemblies at the chromosome level (G. gallus, C. japonica, M. gallopavo, and N. meleagris) show a significantly higher number of Sox genes (43, 35, 28, 53 versus 16, 18, 18, and 17 from those at the scaffold level). Similarly, tandem and WGD/segmental duplications have also observed exclusively on the genomes assembled at the chromosome level. Bias between genomic data from different assembled level might be present, and might have affected the results. To avoid the bias, more high-quality bird genomic data (assemblies at the chromosome level) will be needed in the future studies on the avian Sox family.
The physicochemical properties of Sox genes in Japanese quails were calculated with ExPASy. The length, putative molecular weights, and theoretical isoelectric points (pI) of SOX proteins in Japanese quail are summarized in Table 3. The length of SOX proteins ranged from 240 to 816 amino acids in quail, with putative molecular weights ranging from 26.7 to 90.6 kDa, and theoretical isoelectric points (pI) ranging from 4.92 to 9.96. Sox genes in the SoxD group contained a higher number of amino acid residues than other groups. All the members of the SoxB1 subgroup had a relatively low molecular mass. Ten SOX proteins had relatively low pIs (<7), including different members in SoxD, SoxE, SoxF, and SoxH, respectively. The other SOX proteins, particularly those in the SoxB group, had a pI >7. Compared with other galliform birds (taking B. thoracicus and G. gallus as examples) (Table S2) and channel catfish [11], the length in quail was higher than channel catfish (range from 242 to 805) and B. thoracicus (range from 240 to 797), and slightly lower than chicken (range from 240 to 817). By examining the properties of Sox genes for chicken (Table S2), we found that the length/pI/GRAVY/molecular weight of Sox genes was likely less varied in galliform birds. The grand average of hydropathy (GRAVY) score was calculated as the sum of the hydropathy values for all of the amino acids, divided by the protein length [60]. Unfortunately, all of the C. japonica Sox genes were hydrophilic, with GRAVY values <0. Our results indicated that most proteins in the same subfamily had similar parameters of physicochemical properties. This finding is congruent with the study carried out by Zhang et al. [11].
Furthermore, we determined the genomic positions of Sox genes in Japanese quail. These results indicated that the members of the CjSox gene family were randomly distributed across 11 of the 39 quail chromosomes (Figure 2). For example, there is only one Sox member located in chromosomes (chrs) 4, 5, 13, 14, 18, and 26, two Sox members located in chrs 2, 3, 6, and 20, and four Sox members (CjSox1, 5, 10, and 21) located in chr1 (Figure 2). In contrast, no Sox members are present in the remaining chromosomes. This might be considered the result of interchromosome segmental duplication [11].

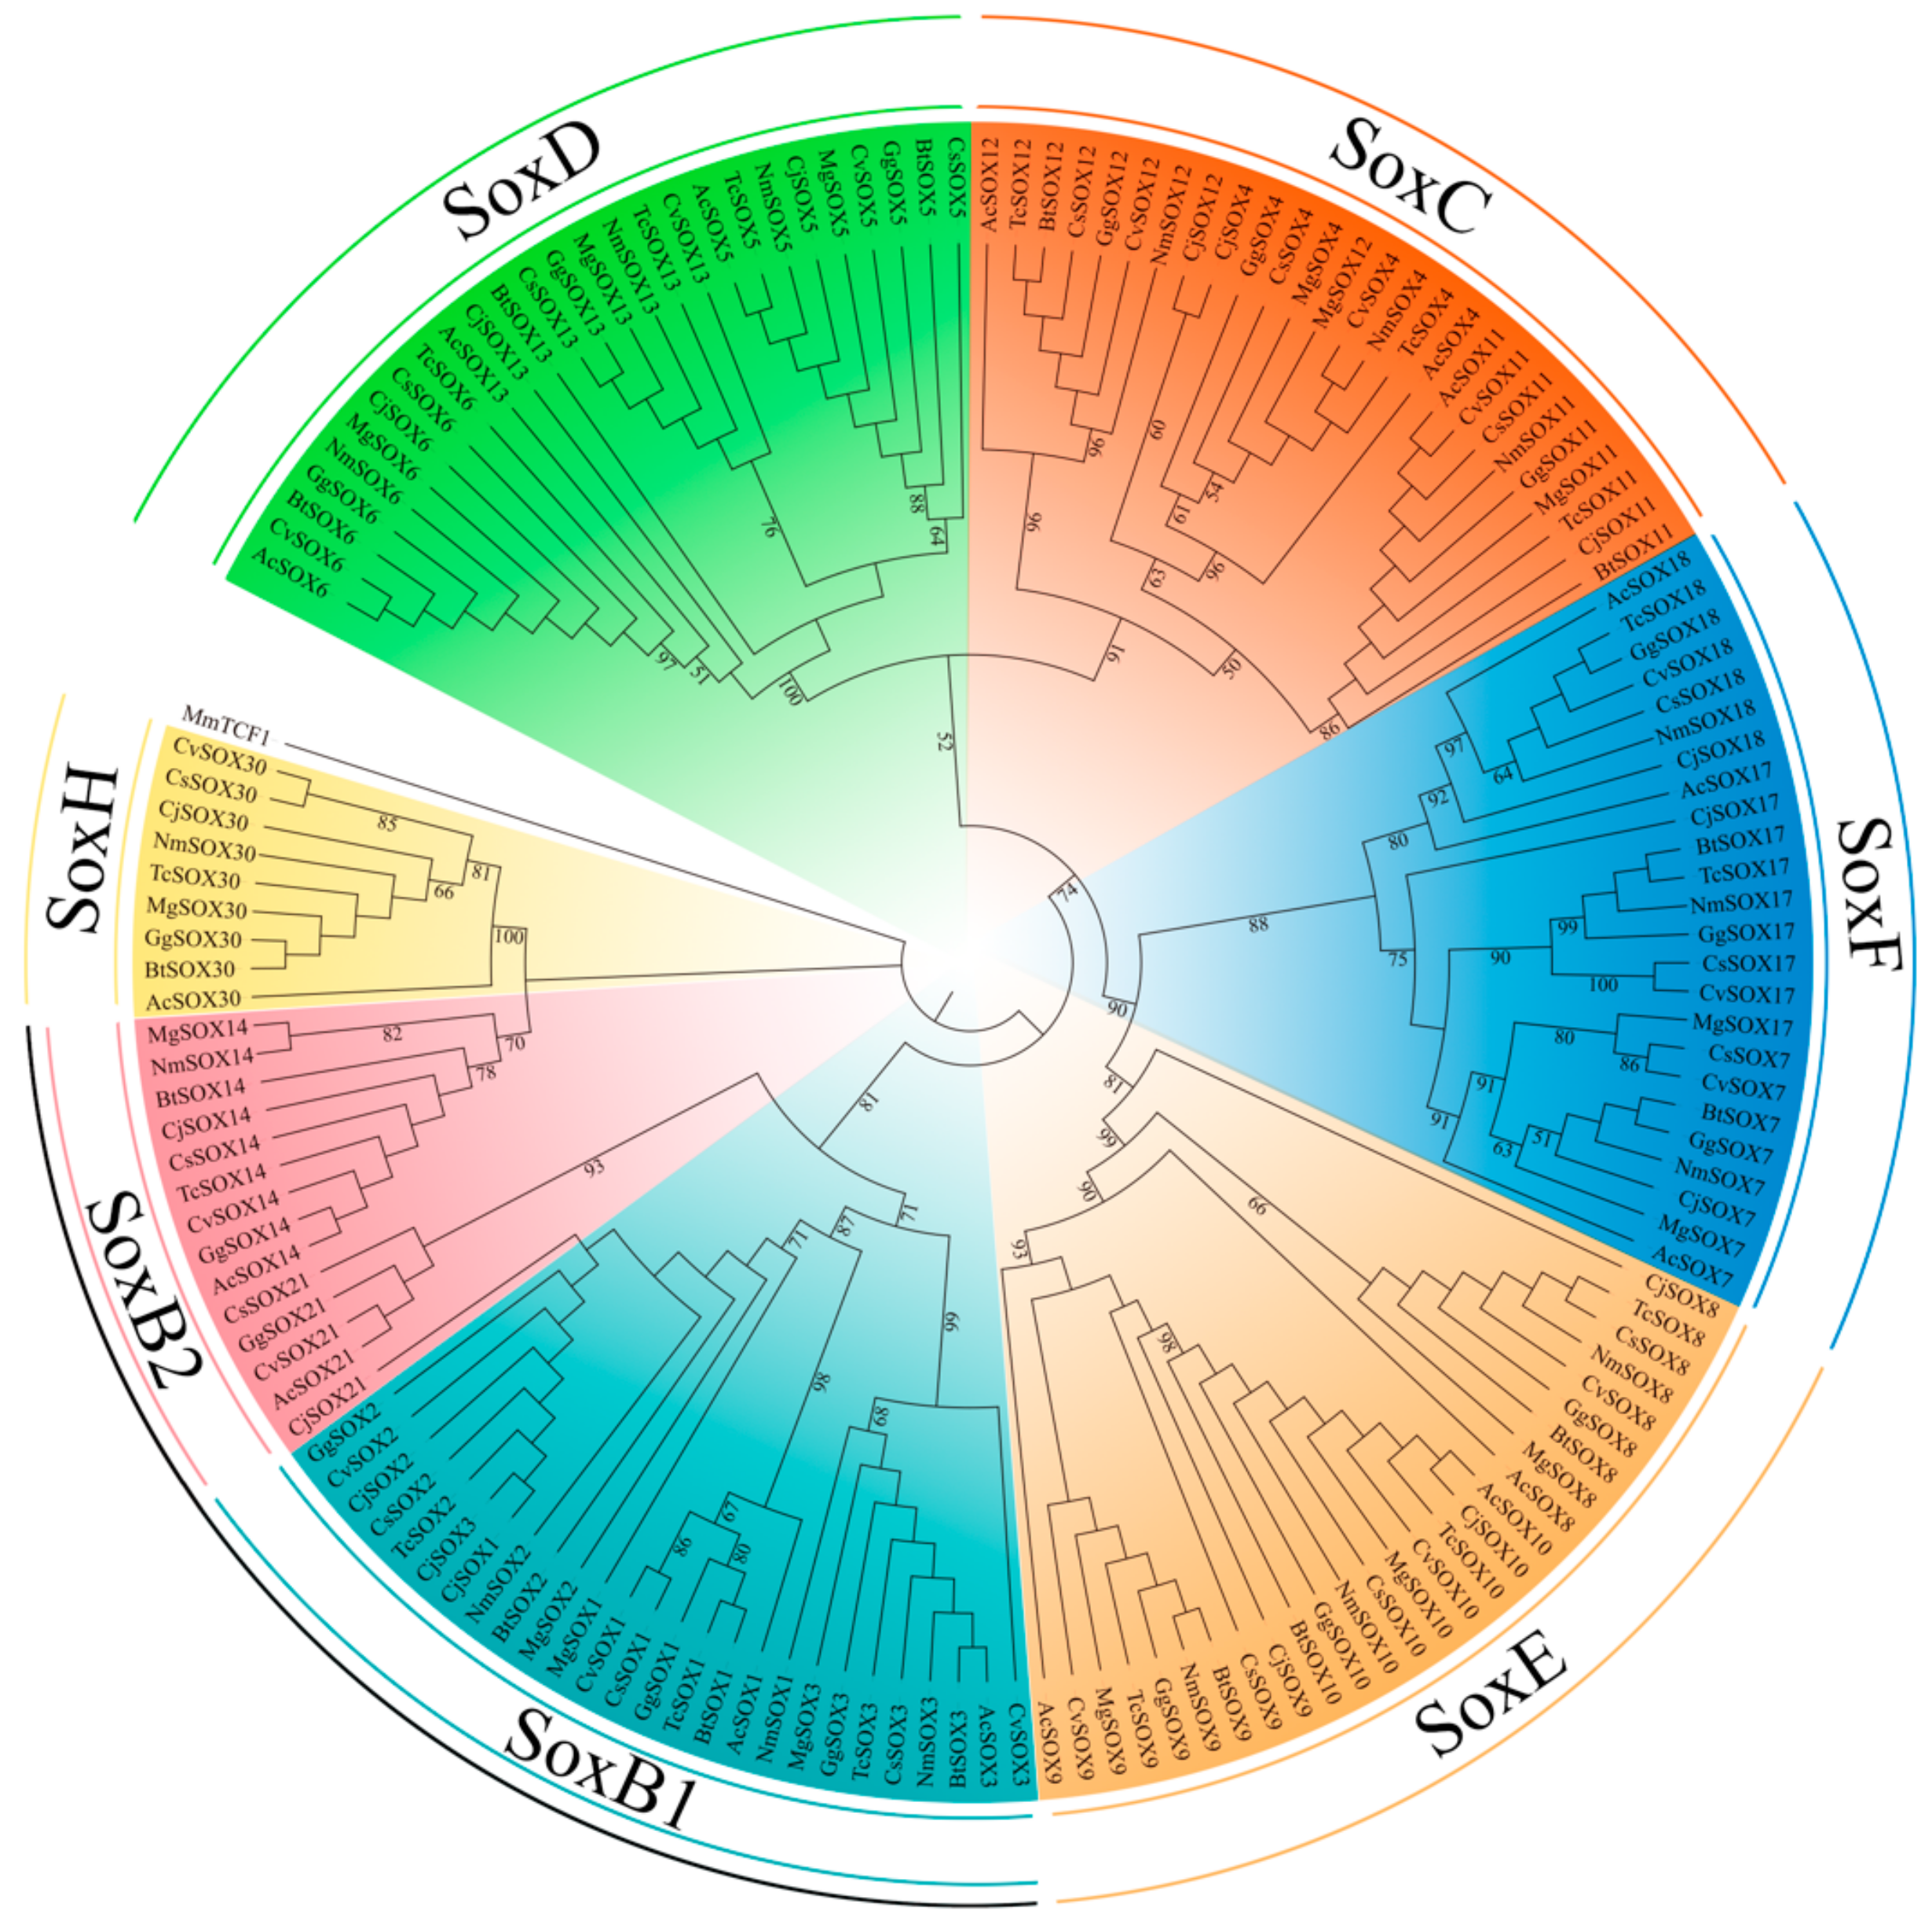
3.2. Phylogenetic and Classification of the Sox Gene Family

In order to gain insight into the relationships among species in Galliformes, we reconstructed a phylogenetic tree of the eight Galliform species. As shown in Figure 1, the common tree can be subdivided into three clades: C. virginianus and C. squamata belong to Odontophoridae; G. gallus, C. japonica, M. gallopavo, B thoracicus, and T. cupido pinnatus belong to Phasianidae; and N. meleagris belongs to Numididae. Interestingly, there was no positive correlation between the Sox genes from Galliformes genomes and the total number of genes contained in the corresponding genome. For instance, we found that there was no significant difference in the genome size of C. japonica (20,441) and N. meleagris (18,844); however, the Sox gene family numbers obviously changed. In contrast, the Sox genes in C. virginianus (17,165) and C. squamata (17,131) contain a positive correlation with the total number of genes contained in the corresponding genome.
Then, we systematically identified the Sox genes by searching the local genome database of C. japonica and seven other representative species. After filtering, a total of 136 Sox genes were identified among Galliformes species (Figure 3). We further used the HMG-boxes from SOX amino acid sequences to construct an ML tree among the C. japonica and other species, including Anolis carolinensis, C. virginianus, C. squamata, M. gallopavo, B thoracicus, G. gallus, T. cupido pinnatus, and N. meleagris. According to the phylogenetic topology, we observed a relatively robust signal for a partition into five groups: SoxC (Sox4, Sox11, and Sox12, bootstrap value 91%), SoxD (Sox5, Sox6, and Sox13, bootstrap value 100%), SoxE (Sox8, Sox9, and Sox10, bootstrap value 81%), SoxF (Sox7, Sox17, and Sox18, bootstrap value 88%), and SoxH (Sox30, bootstrap value 100%). Remarkably, we also detected the closer evolutionary relationships between group D and group C, and group E and group F, indicating that they might have a common evolutionary origin during evolution.
Furthermore, as we know, SoxB genes have been identified from many bilaterian species [61]. It seems likely that SoxB genes are involved in neuroectoderm formation [61,62,63]. Interestingly, further studies in vertebrates revealed that SoxB1 and SoxB2 have opposite activities [9,61,64,65]. For instance, SoxB1 can be recognized by transcriptional activators, whereas SoxB2 act as repressors in the chicken [66]. Unfortunately, the reconstructed ML tree in this analysis also failed to recover two monophyletic SoxB groups (SoxB1 and SoxB2) (Figure 3), as did many previous reports [63,67,68,69].

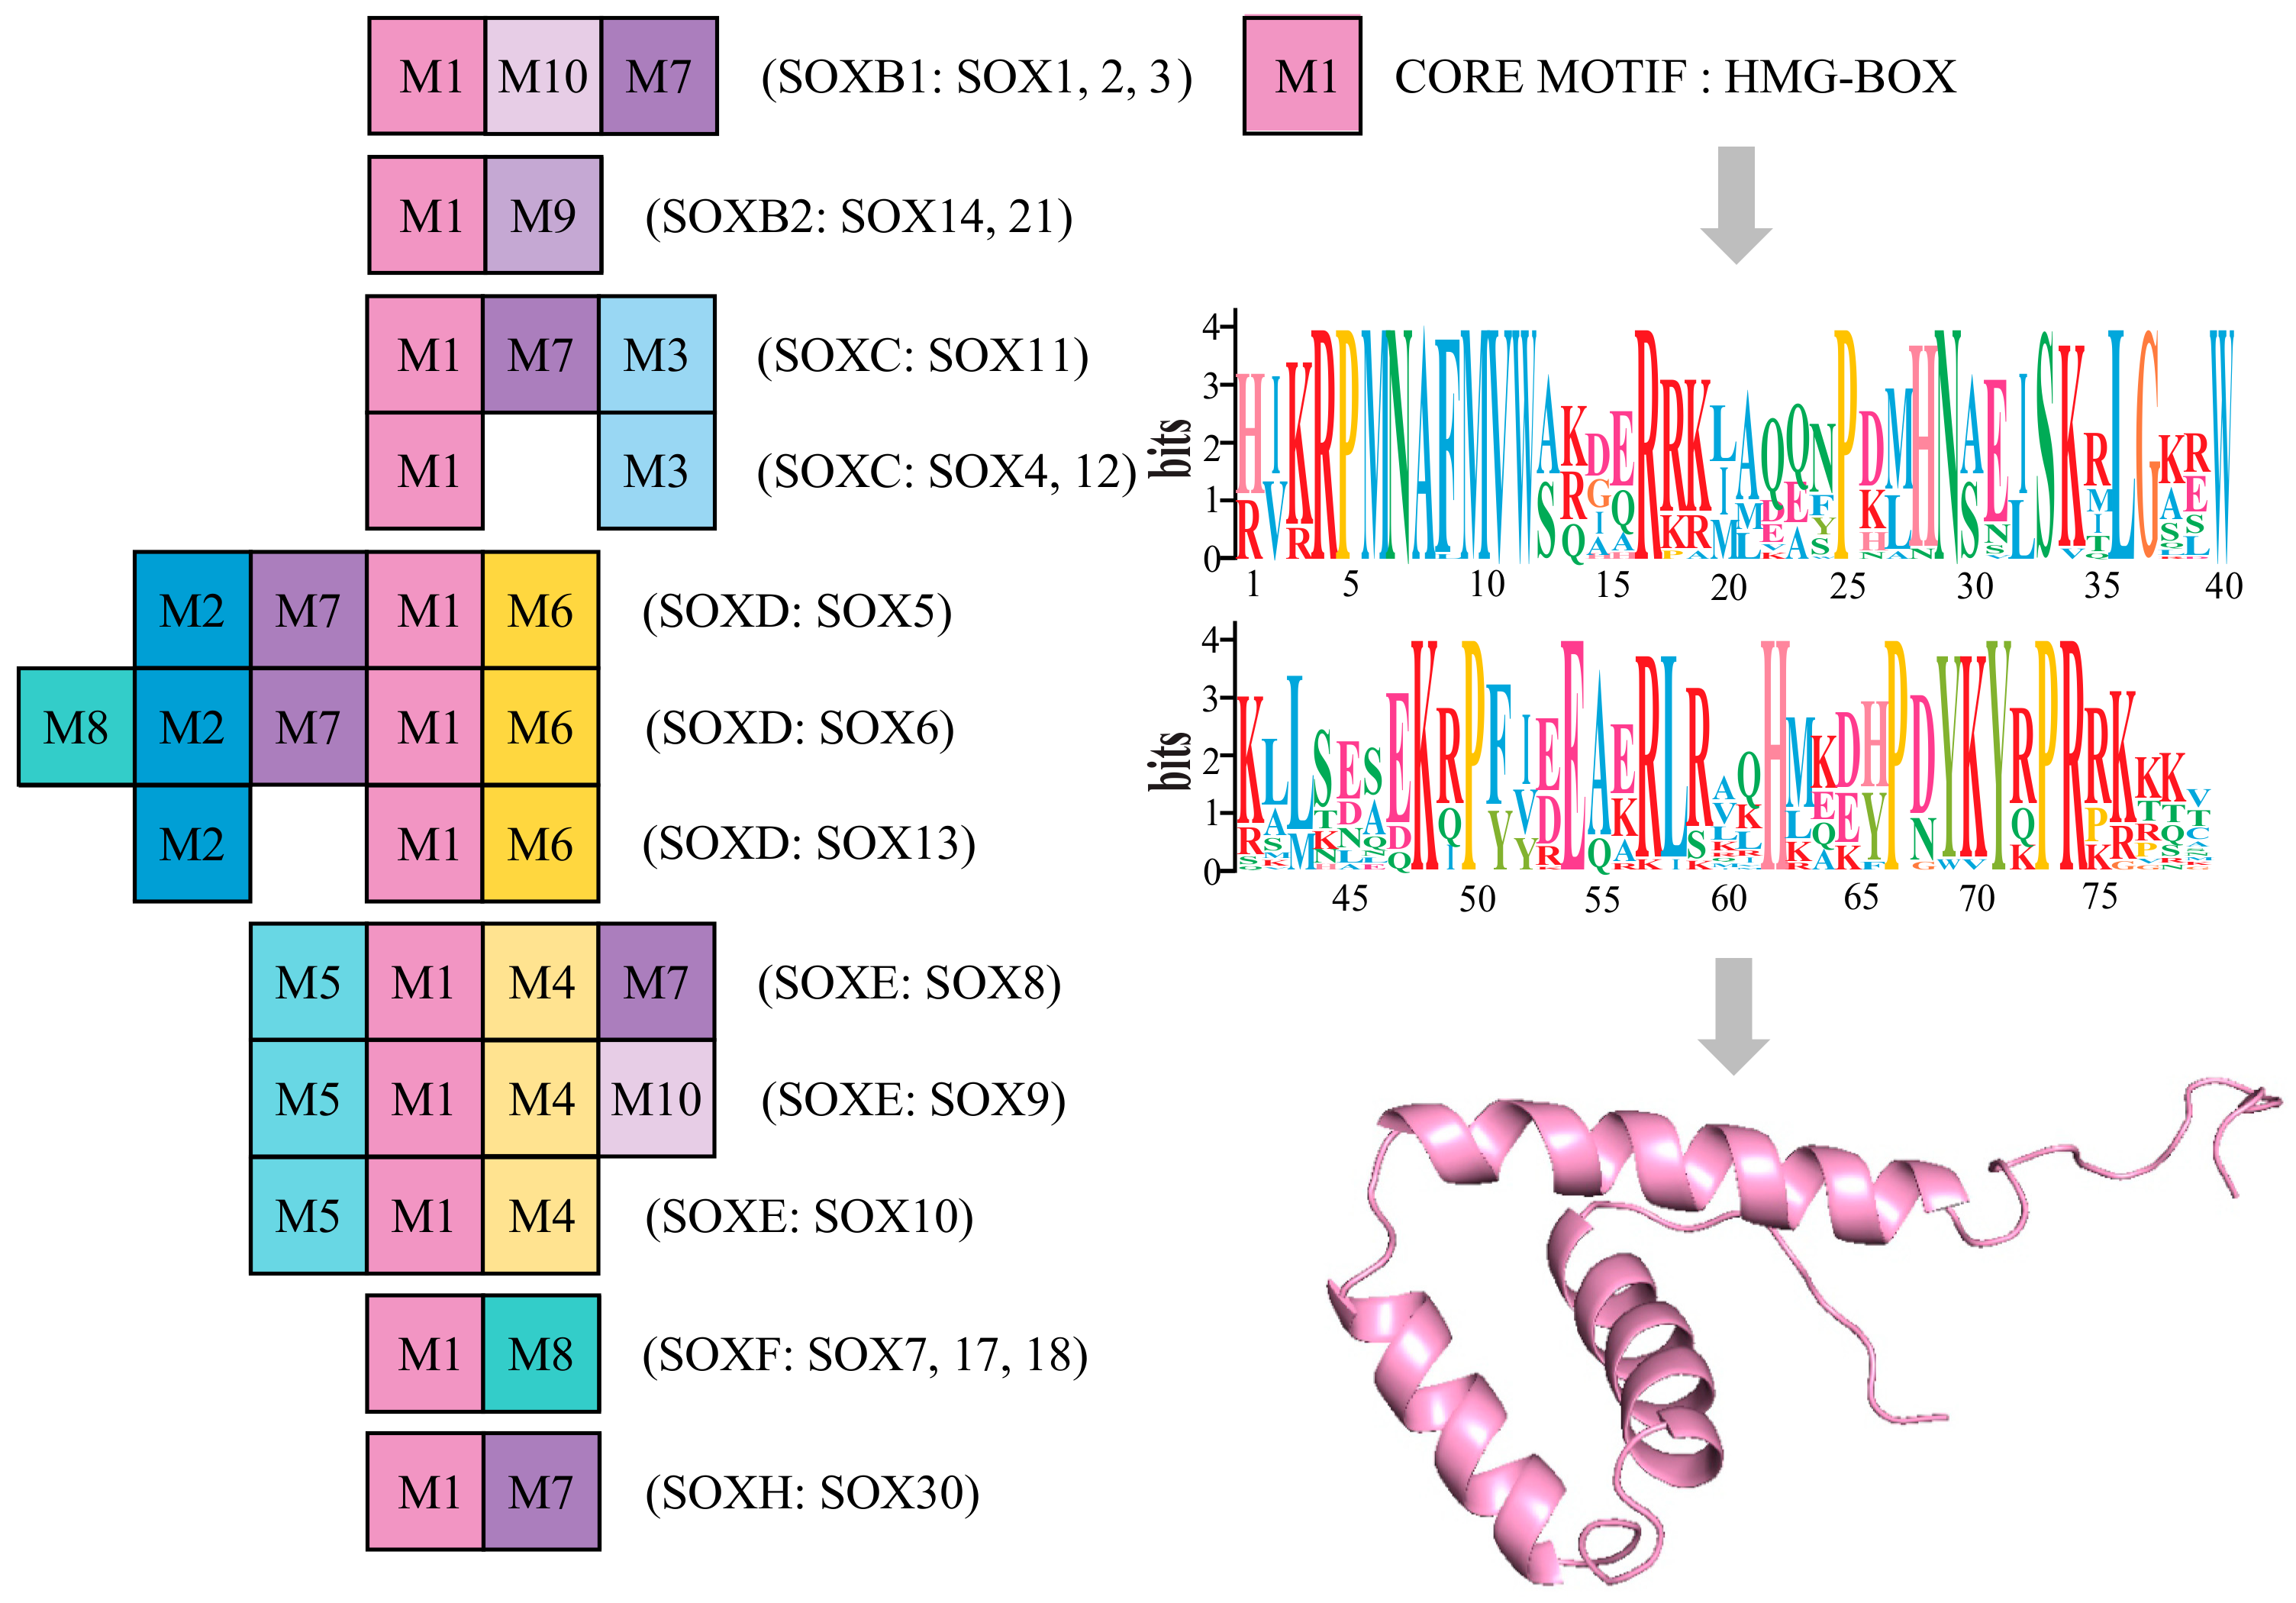
3.3. Conserved Motif Analysis of Sox Genes

Molecular studies have revealed that all the members of the Sox gene family encode transcription factors containing a highly conserved 79-amino acid motif (HMG-box) [48,70,71]. To further explore the origin and evolutionary pattern of Sox genes in C. japonica, conserved motif analysis was performed using the MEME program. The result of the current analysis indicated that 10 conserved motifs are presented in C. japonica (Figure 4). Noteworthily, we detected that conserved motif 1 (M1) exists in all the members of Sox gene family, while the other nine motifs are present in different Sox groups. As shown in Figure 4, three motifs (M1, M10, and M7) existed in the SoxB1 group, two (M1 and M9) existed in the SoxB2 group, and three (M1, M7, and M3) existed in the Sox11 group. SoxC contained M1 and M3; SoxD contained M1, M2, and M6; SoxE included M1, M4, and M5; SoxF contained M1 and M8; and SoxH contained M1 and M7. M1 is the core motif HMG-box, with 79 amino acids residues. The HMG-box is a type of DNA-binding domain that is found in a large number of eukaryotic proteins. The three-dimensional (3D) structure of M1 of C. japonica has a characteristic L-shaped fold, which is formed by three α-helices (Figure 4). We found the specific preservation and expansion of motifs in different Sox genes in C. japonica.

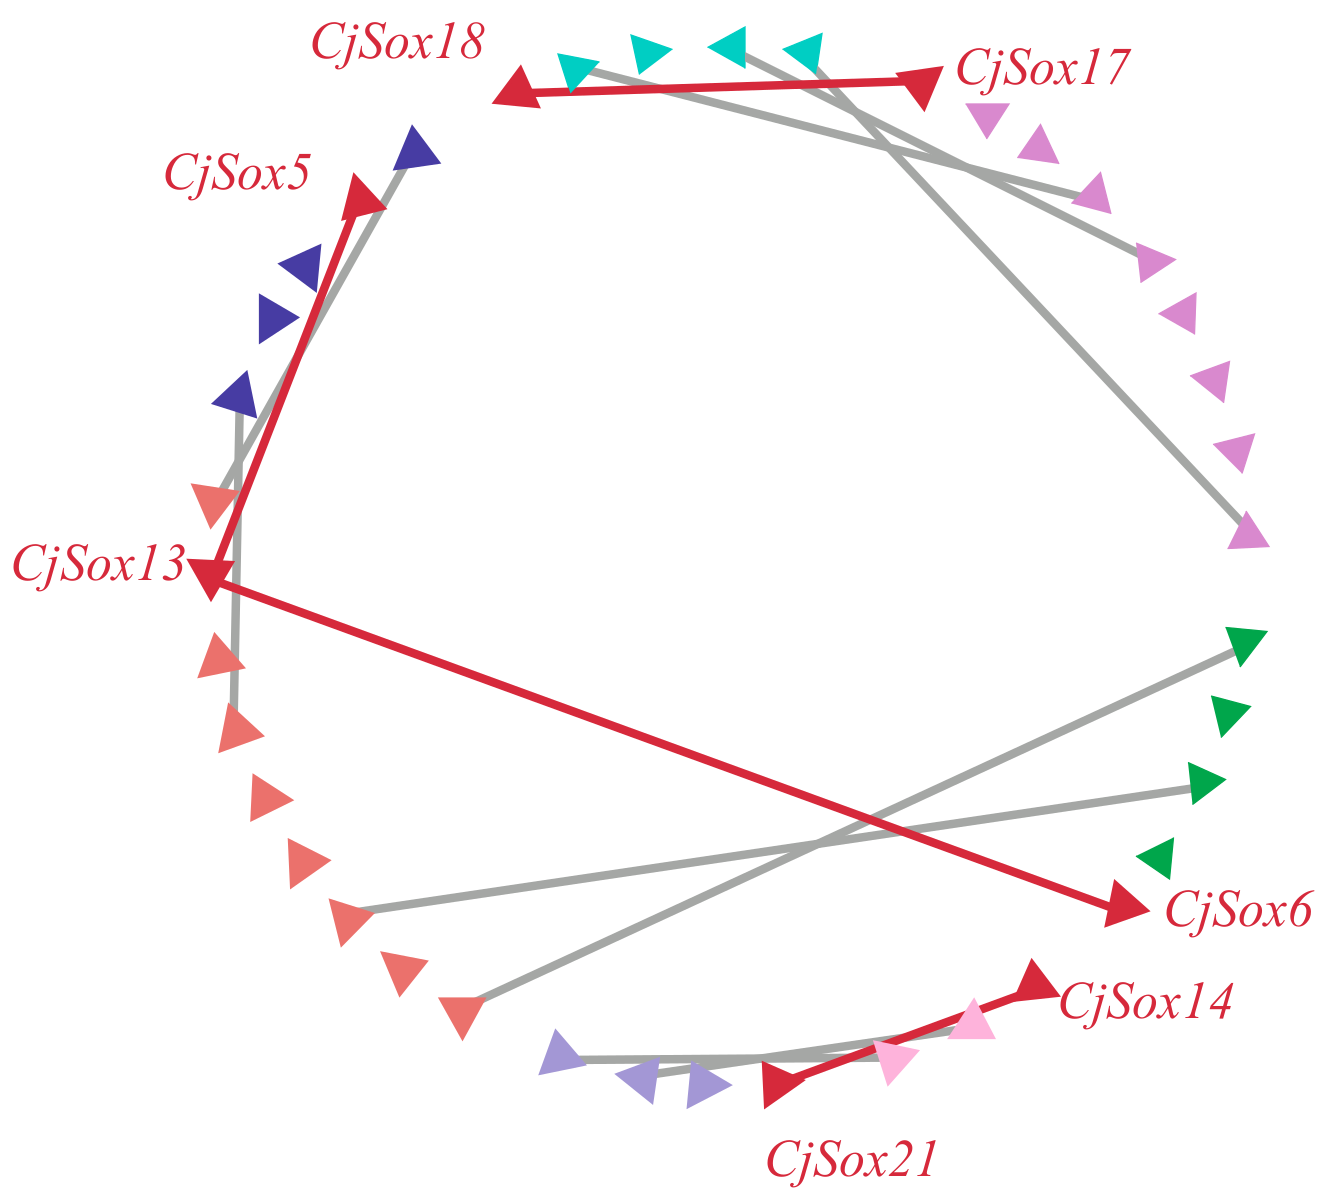
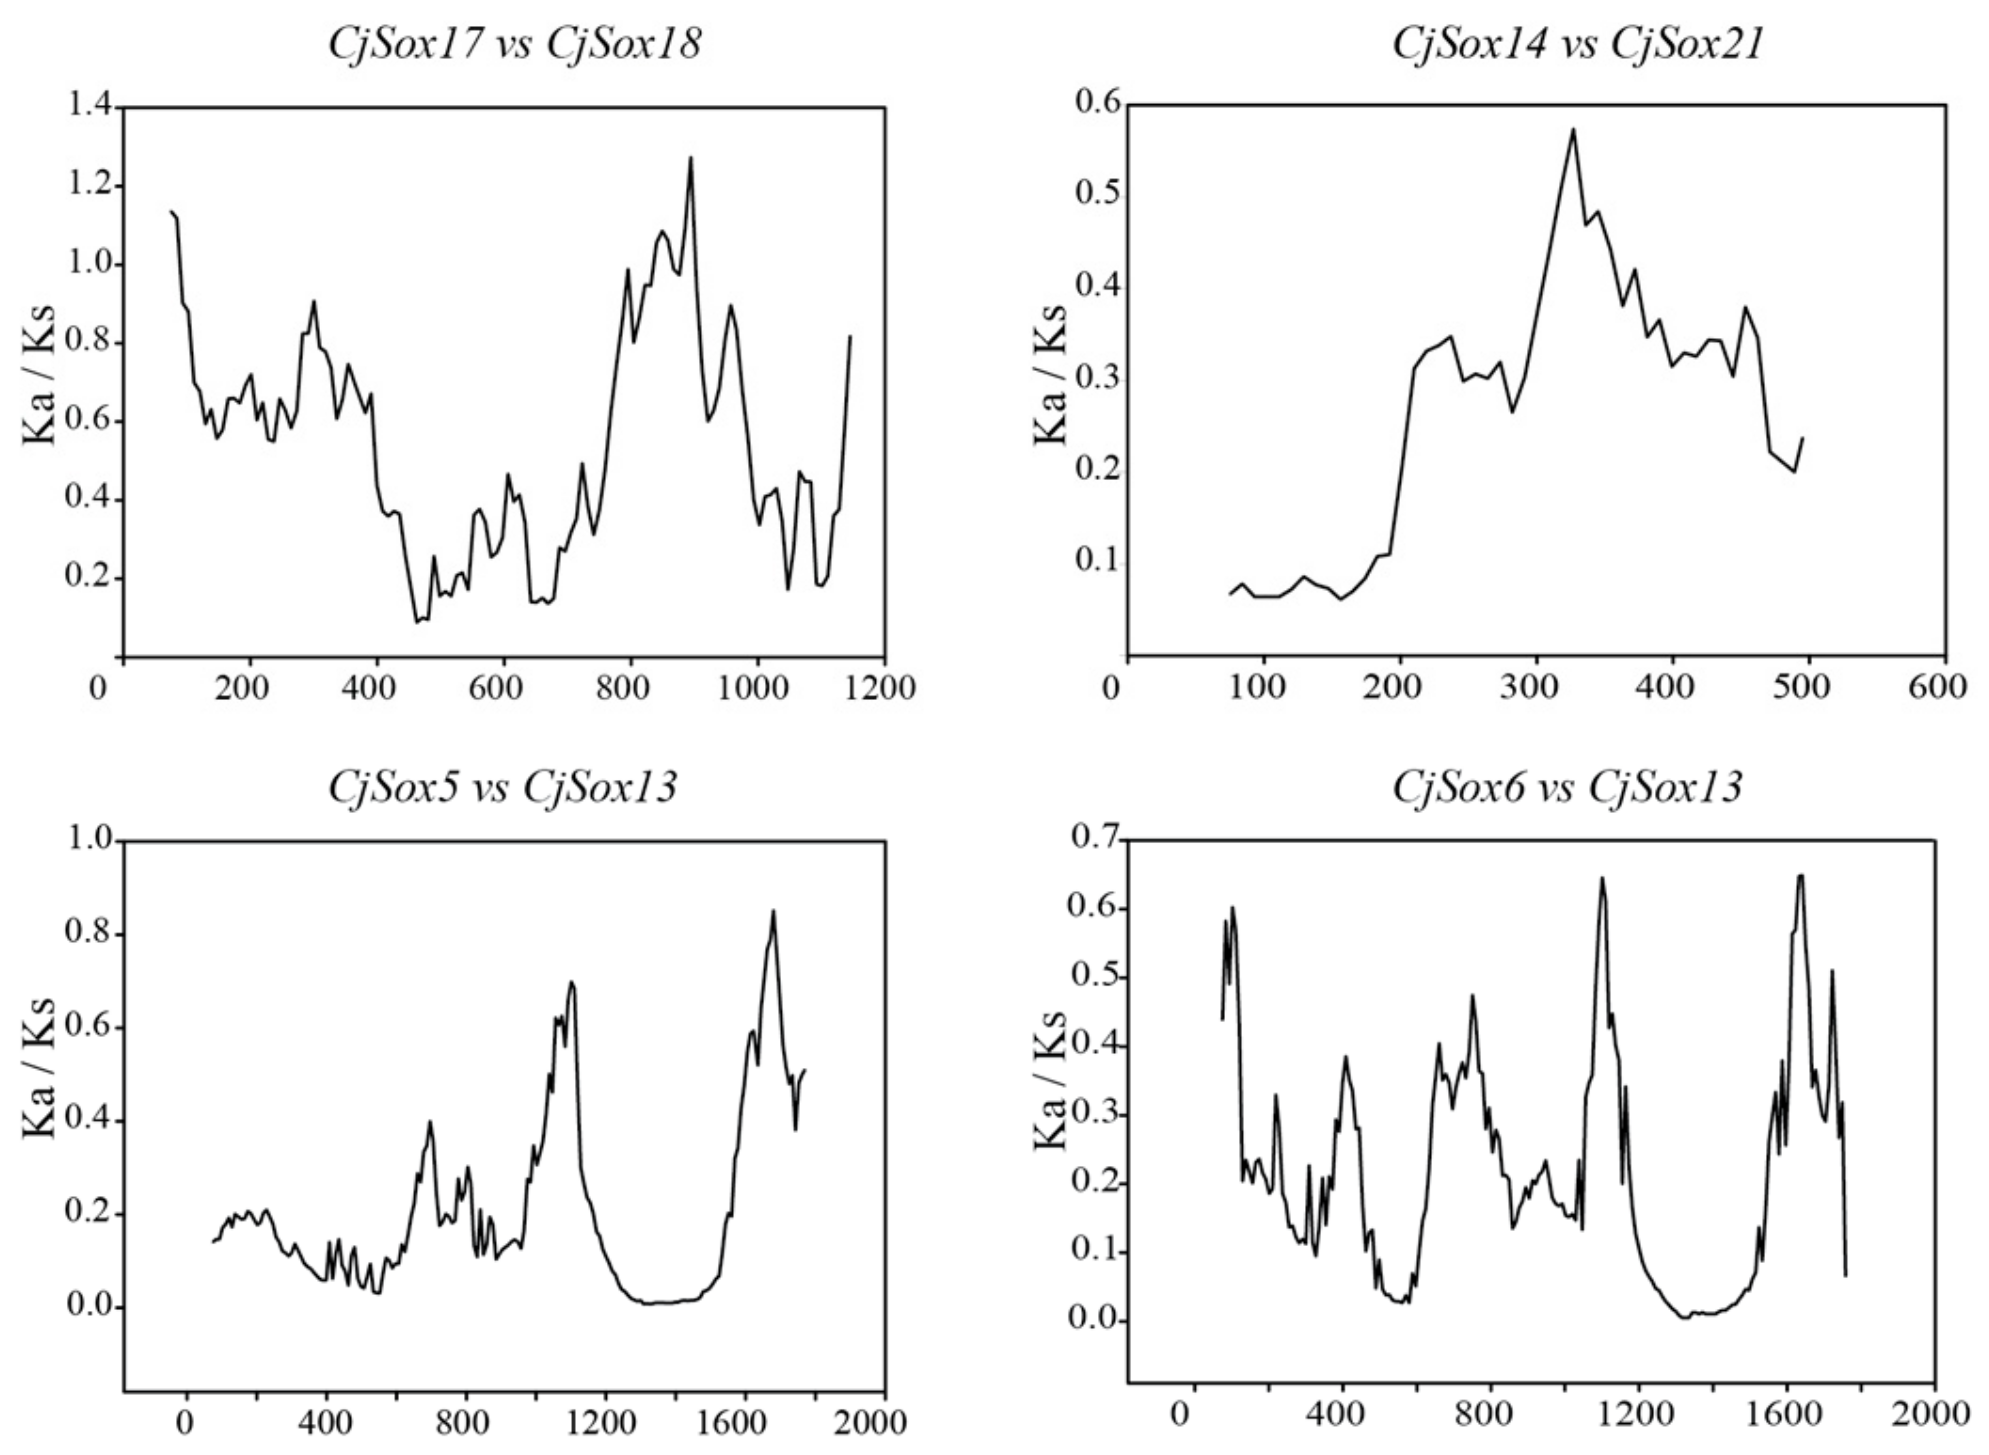
3.4. Gene Duplication of Sox Genes

Normally, gene duplication is considered a contributor and an important source of biological evolution [50,72]. Two regions were generally considered to have evolved from duplication events when two or more protein-coding gene pairs flanking the anchor point had the best non-self hit (e-value < 1 × 10⁻⁵) [73,74]. To further understand how the Sox gene family evolved, we investigated gene duplication events of the Sox genes in C. japonica. The results of the analysis showed that 11 Sox genes were not present in any microsynteny, such as CjSox1, CjSox2, and CjSox3. This implied that these genes might be derived from duplication events. Additionally, we found significant microsynteny in the quail Sox gene regions. As shown in Figure 5, three conserved genes flanking in the CjSox17/CjSox18 pair, and two conserved genes flanking in the CjSox5/CjSox13, CjSox6/CjSox13, and CjSox14/CjSox21 pairs were identified, respectively. Our findings clearly indicate that four gene pairs were involved in the large-scale duplication during evolution of the Sox family in C. japonica (Figure 5), which is consistent with the published article by Voldoire et al. (2017) in teleost fish [75].
Ka/Ks < 1 suggests a functional constraint; a Ka/Ks ratio greater than one indicates a positive selection; a Ka/Ks ratio of one is neutral [76]. In the present study, we found that the Ka/Ks ratios of all the CjSox gene pairs were less than 0.6 (Table S3), suggesting that these gene pairs have evolved under strong purifying selection.
It is worth noting that several codon sites could be masked by overall strong purifying selection during positive selection [77,78,79]. As a result, proteins with Ka/Ks values less than one may still contain sites under positive selection. Therefore, to better understand potential selection pressures in C. japonica, we carried out a sliding-window analysis of Ka/Ks between each pair of CjSox genes (Figure 6). As expected, except for several peaks (Ka/Ks > 1), the majority of Ka/Ks ratios across coding regions were far below one (valleys). The result demonstrated that strong purifying selections played a key role in the evolution of CjSox genes of C. japonica. Since the sliding-window analysis showed sites with Ka/Ks > 1, we then performed a thorough analysis to detect the signatures of positive selection in specific codons using the FEL analysis by the Datamonkey website [52]. The Sox genes of quail might have undergone positive selection during evolution for a few sites. We detected multiple positive sites relevant to the different Sox groups in quail for functional differentiation; the formation of multiple subgroups, where positive selection occurred are summarized in Table S4.

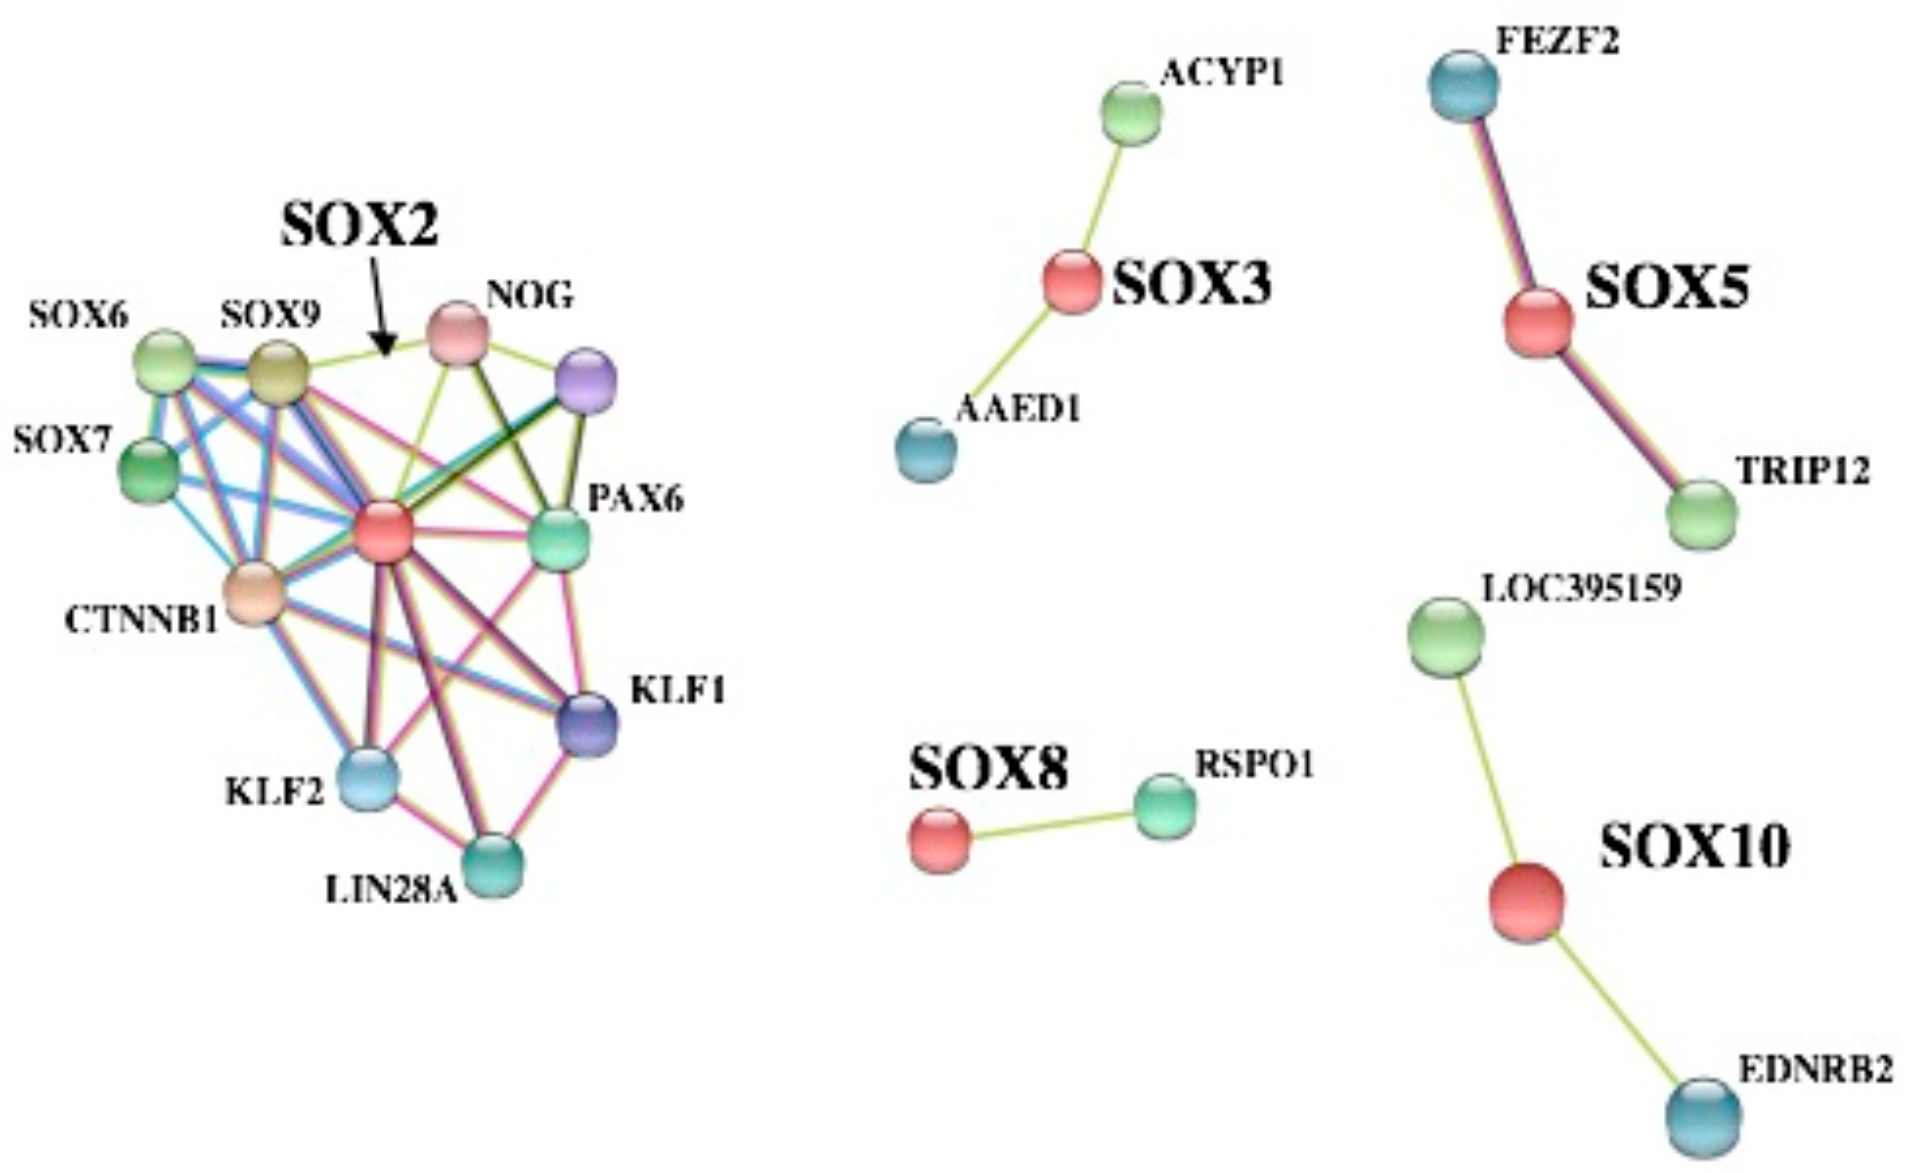
3.5. PPI Network Analyses of SOX Proteins and GO Enrichment Analysis

SOX proteins are involved in the differentiation of chicken germline stem cells, as they are in mammals [80]. We attempted to further analyze the PPI network of SOX proteins in C. japonica using the STRING database (version 10.5) (https://string-db.org/), and understand some potential functions by Gene Ontology (GO) enrichment analysis. The results exhibited five PPI network clusters by different colors (Figure 7). CTNNB1 (β-catenin) was reported as a crucial part in the epithelial cells of the chicken oviduct [81]. Our results clearly indicated that CTNNB1 is part of a complex network of interactions with SOX2, SOX6, SOX7, and SOX9. This finding indicates that these putative protein–protein associations might participate in embryogenesis and tumorigenesis in C. japonica. Additionally, ACYP1 was found to be involved in gastrointestinal stromal tumor cells [82], and AAED1 was a potential target for gastric cancer [83]. SOX3 might also be related to tumorigenesis in either a negative or positive manner [84]. In C. japonica, the network analyses also predicted that SOX3 was related to AAED1 and ACYP1; these interactions seem to be essential for treating gastric cancer. Moreover, we also found three other PPI networks of SOX proteins in C. japonica (Figure 7). For instance, SOX5 was integrated with FEZF2 and TRIP12, which might be essential for embryogenesis [85,86].
In order to further analyze the functions of the Sox gene family, we performed GO enrichment analysis (Table S5). The GO terms in this study included three categories: cellular component (CC, 3%), molecular function (MF, 20%), and biological process (BP, 77%). GO enrichment confirmed that part of these 18 CjSox genes are enriched in the nuclear transcription factor complex (GO:0044798), transcription factor complex (GO: 0005667), and nuclear part (GO:0044428) of the CC category. DNA-binding transcription factor activity (GO:0003700) and transcription regulator activity (GO: 0140110) were the most abundant functions in the MF category. The most enriched function was the regulation of transcription by RNA polymerase II (GO: 0006357). CjSox9 exists in all 105 GO enrichment terms, suggesting that CjSox9 plays important roles in the testis development, which is consistent with the findings of a previous study [32,87].

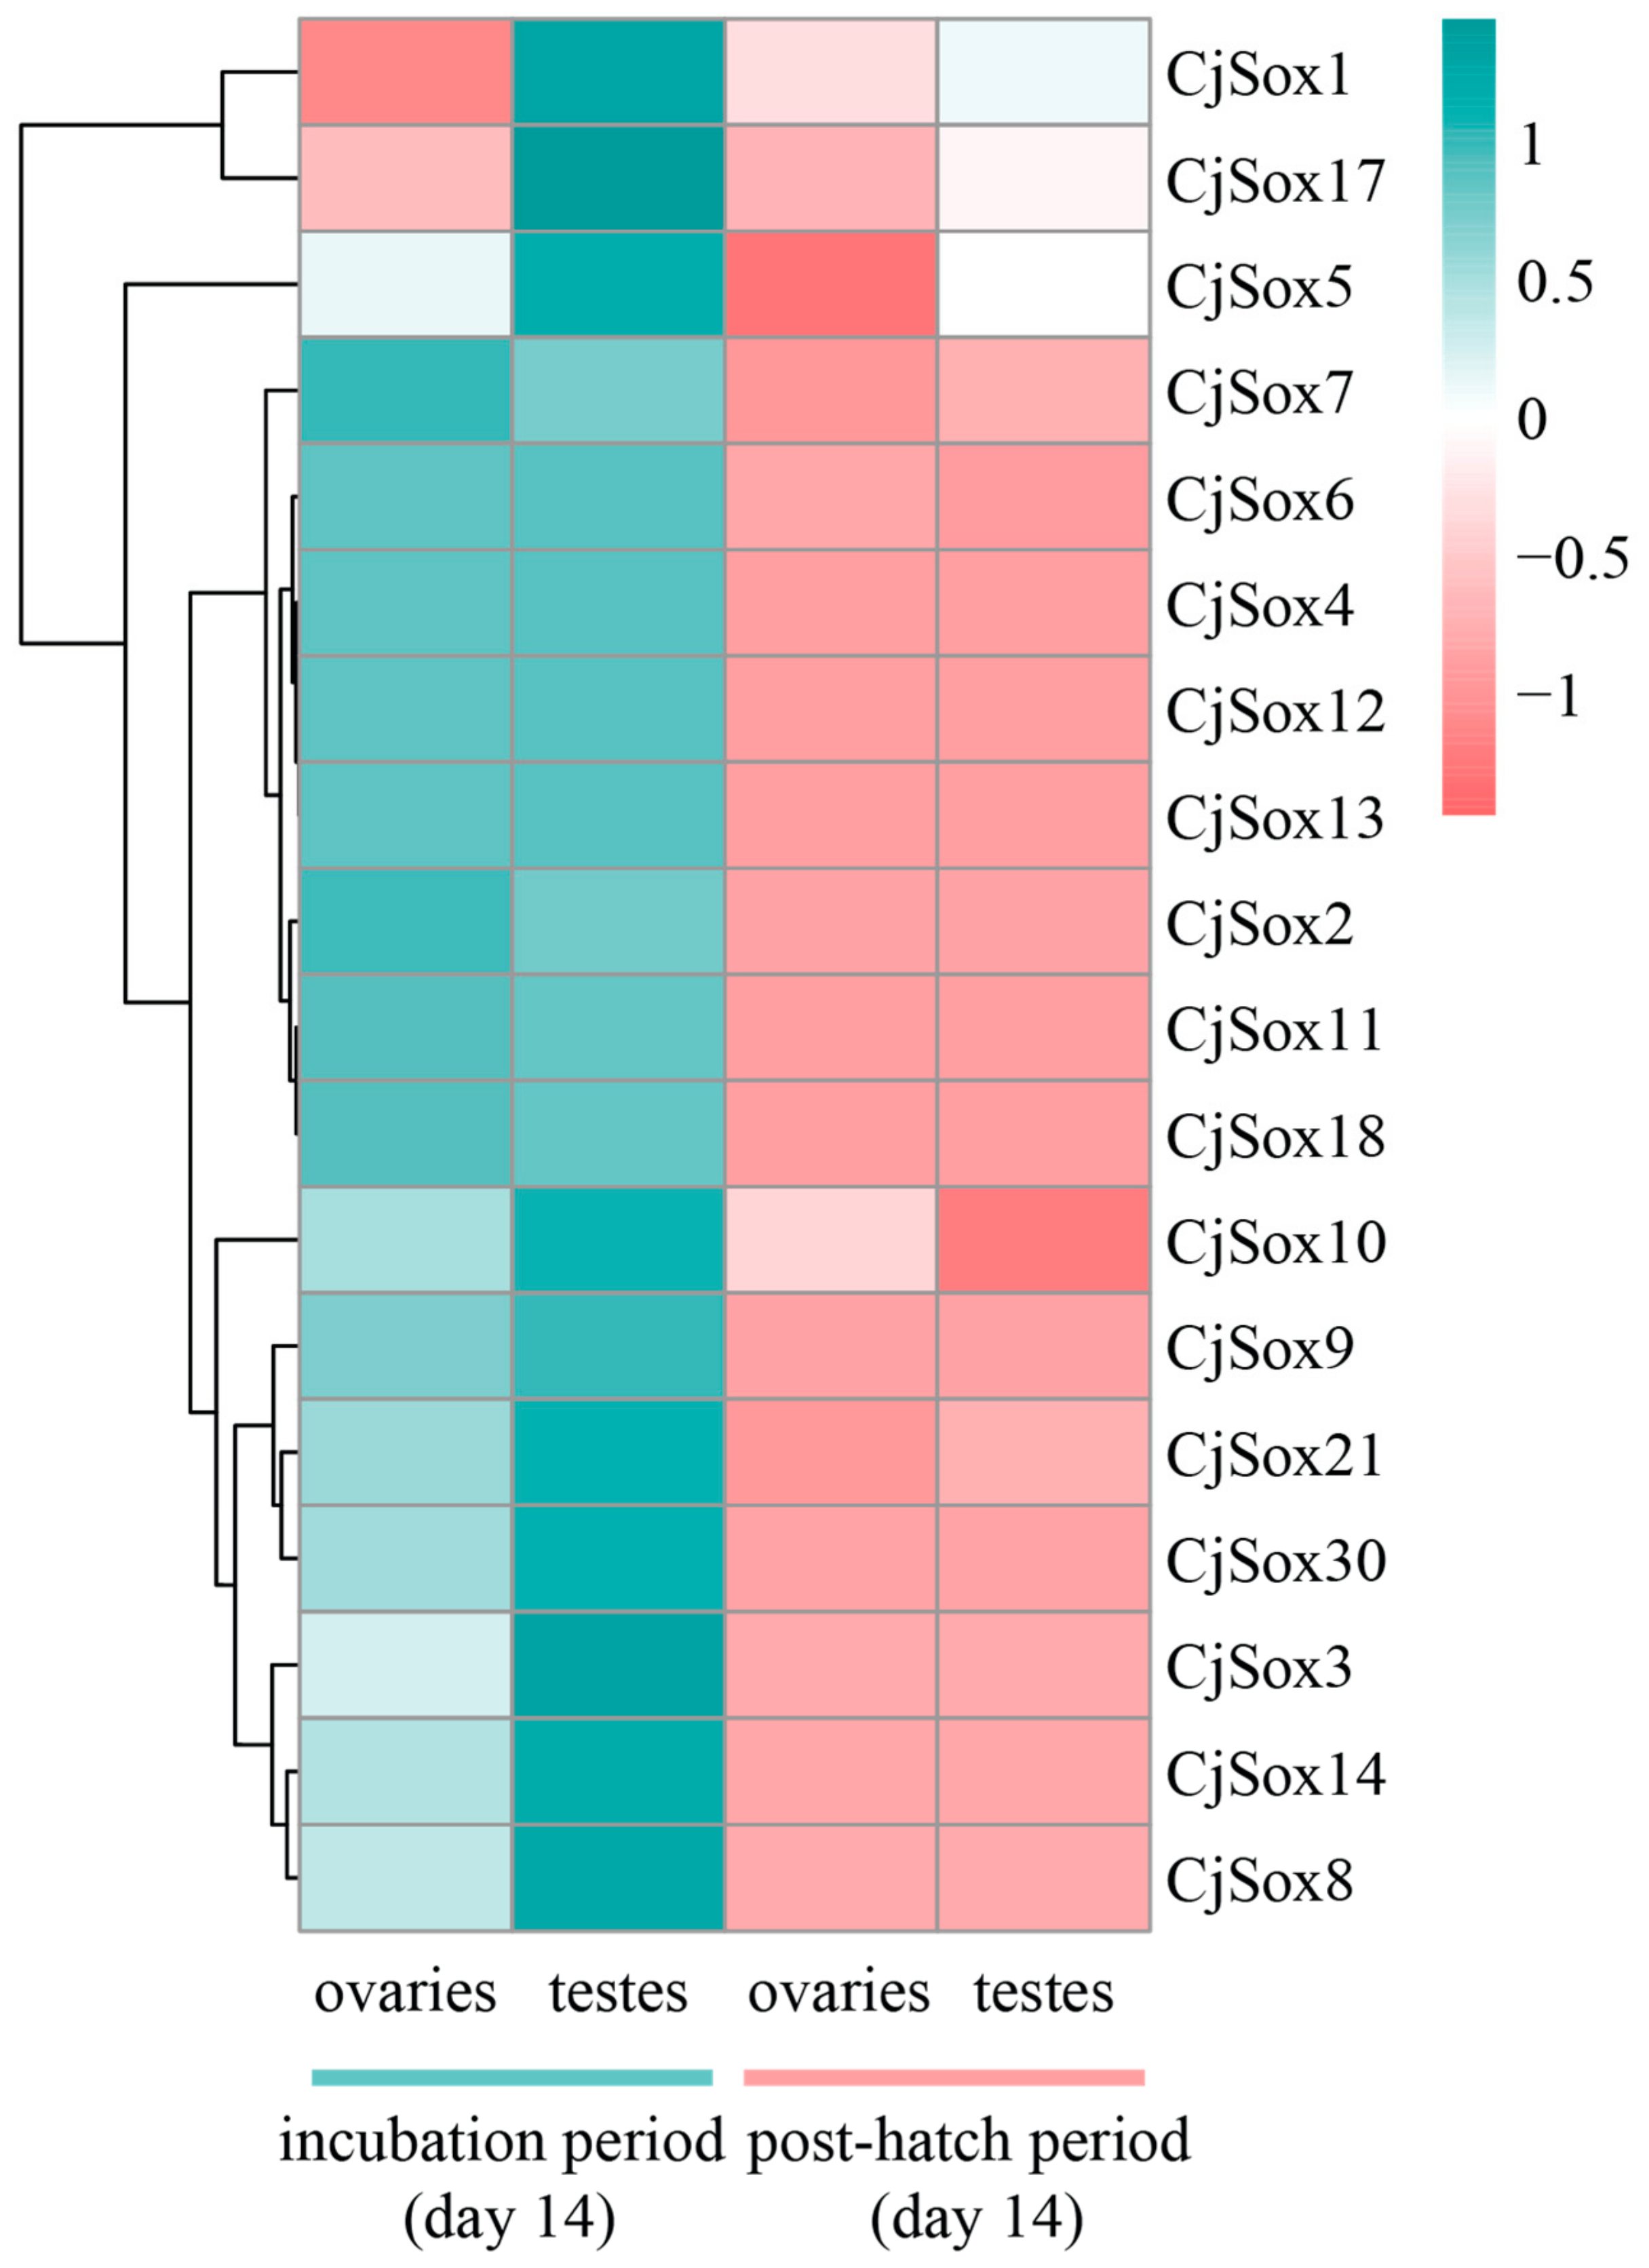
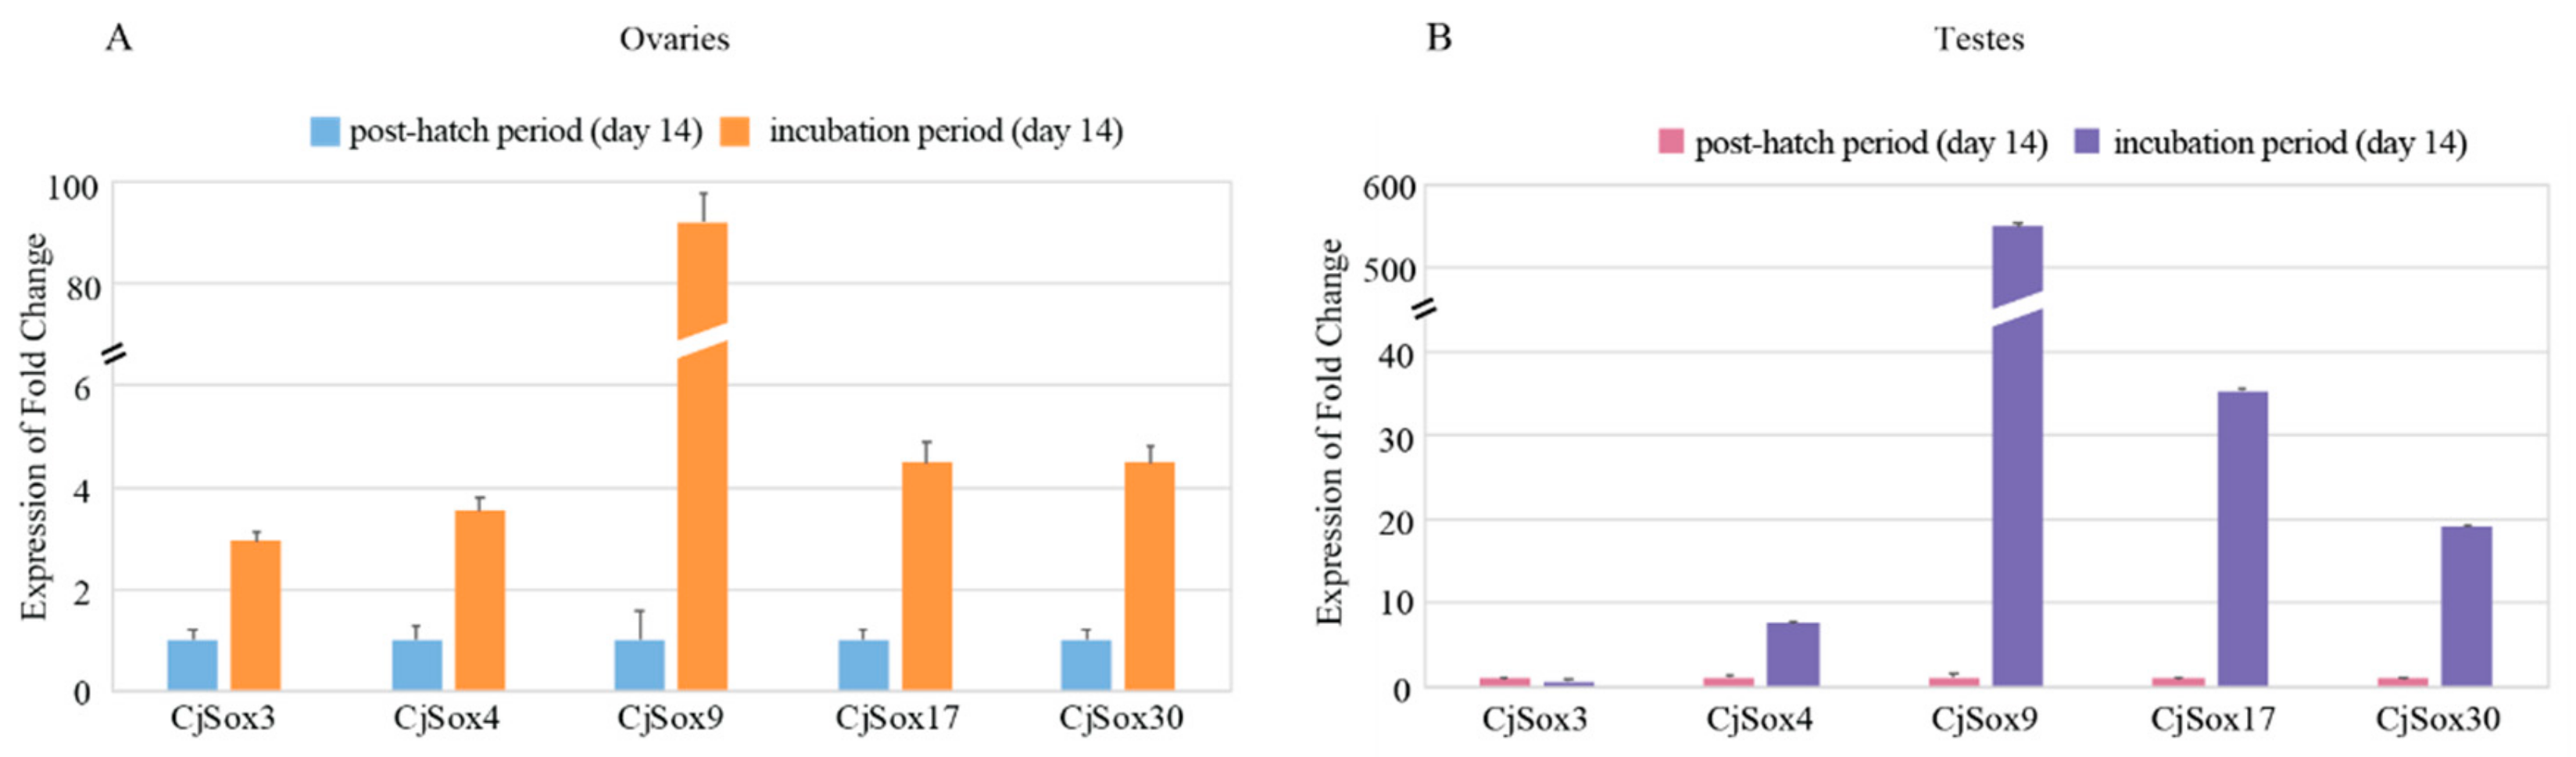
3.6. Gene Expression Analysis of C. Japonica Sox Genes in Gonads

As reported in previous studies, multiple Sox genes were strongly expressed in the gonads and the central nervous system of mice [88,89,90,91], and widely expressed in different stages of embryogenesis [92]. However, so far, Sox genes expression in the gonads development of Japanese quail remains understudied. Thus, we further extracted the expression profiles (unpublished data from our group) for 18 CjSox genes between two developmental stages (incubation and post-hatch periods at 14 days, respectively) from quails with three biological replicates (Figure 8). Genome-wide gene expression analysis can potentially reveal period-specific expression manners for the Sox gene family in quail. SRY is associated with the development of testis, and the inhibition of SRY expression causes defects in testis development [93]. SRY is also directly targeted by Sox9 [94], and previous studies have suggested that Sox9 plays a key role in male gonad development in many vertebrates [95]. Sox9 is down-regulated in the differentiating gonad just before ovary formation in chicken [96]. Notably, our result showed that one gene (CjSox9) was significantly more highly expressed in the incubation period (day 14) than in the post-hatch period (day 14) from both gonads (Figure 8, Figure 9 and Figure S1), implying that Sox9 played a conserved role in the gonadal development of quails. Similarly, during the incubation period (day 14), three genes (Sox5, Sox8, and Sox9) were significantly more highly expressed in testes than in ovaries (q-value < 0.05). Furthermore, this investigation of the post-hatch periods in both gonads revealed that seven genes (CjSox1, CjSox5, CjSox6, CjSox7, CjSox10, CjSox17, and CjSox21) were weakly expressed, whereas the remaining 11 genes were negligibly expressed (Figure S1). We observed that most Sox genes exhibited highly embryo-specific expression in both gonads (Figure 8).
To further confirm the expression profiles, we carried out the qPCR experiment for five randomly selected Sox genes, including Sox3, Sox4, Sox9, Sox17, and Sox30 (Figure 9). Our data suggested that these five CjSox genes presented similar expression patterns as RNA-Seq data. For example, four CjSox genes existed in both gonads, with similarly low expression levels for Sox4, Sox9, Sox17, and Sox30 in the post-hatch period (day 14) of ovaries and testes as in the incubation period (day 14).
The Sox gene family was first considered to include the testes-determining genes, which were connected with gonadal development and the differentiation of gender [97,98]. Our findings in the current study suggested that most Sox genes are involved in gonadal development in C. japonica.

4. Conclusions

The Sox gene family plays an important role in developmental processes. Global identification and expression characterization of the Sox gene family were performed in C. japonica and compared with other species of Galliformes in this study. Here, we detected 35 Sox genes representing seven Sox gene subfamilies (SoxB1–B2, SoxC–F, SoxH) in quails. Based on homolog annotations and phylogenetic analyses, we named these Sox genes. The systematical analyses, including gene structure, conserved the HMG-box phylogenetic relationship, and microsynteny analysis suggested that these Sox genes were suitable for studying the evolution of the Sox gene family. The transcript analysis of Sox genes between the incubation period and the post-hatch period in the quail gonads showed that each CjSox gene had a unique expression pattern during sexual development. Expression profiling, PPI protein analyses, and GO analysis of these CjSox genes could provide the function characteristics of this gene family in Japanese quail growth and development.

Supplementary Materials

The following are available online at https://www.mdpi.com/2073-4425/10/4/314/s1, Figure S1: Heatmaps demonstrate Sox mRNAs between the incubation period and post-hatch period in the quail gonads. The color scale indicates the Sox mRNAs expression level, Table S1: Species of Galliformes genomes examined in this study as classified according to Clements et al. (2018), Table S2: Protein properties for Sox genes identified from B. thoracicus and G. gallus, Table S3: Ka/Ks analysis of between Sox gene pairs in quail, Table S4: Predicted numbers and locations of codons under positive selection within different CjSox genes, Table S5: GO enrichment analysis of Sox genes in quail.

Author Contributions

Data curation, L.J., H.D. and X.K.; Formal analysis, L.J. and X.K.; Investigation, D.B. and X.W.; Software, L.J., R.Z. and X.K.; Validation, J.Z.; Writing—original draft, L.J.; Writing—review & editing, L.J., X.Y. and X.K. All authors reviewed and approved the final submission.

Funding

This study was supported by the Major Program of Natural Science Foundation of the Anhui Higher Education Institutions of China under Grant No. KJ2016SD22; the Higher Education Revitalization Program of Anhui Province under Grant No. 2015zdjy035; the Graduate Innovation Foundation of Anhui Normal University (No. 2018kycx055; No. 2018kycx058); and the Opening Foundation of State Key Laboratory of Genetic Resources and Evolution (No. GREKF18-09).

Acknowledgments

We kindly acknowledge two anonymous reviewers for their fruitful and critical comments.

Conflicts of Interest

The authors declare no conflict of interest. The funders had no role in the design of the study; in the collection, analyses, or interpretation of data; in the writing of the manuscript, or in the decision to publish the results.

References

  1. Bowles, J.; Schepers, G.; Koopman, P. Phylogeny of the SOX family of developmental transcription factors based on sequence and structural indicators. Dev. Biol. 2000, 227, 239–255. [Google Scholar] [CrossRef] [PubMed]
  2. Shinzato, C.; Iguchi, A.; Hayward, D.C.; Technau, U.; Ball, E.E.; Miller, D.J. Sox genes in the coral Acropora millepora: Divergent expression patterns reflect differences in developmental mechanisms within the Anthozoa. BMC Evol. Biol. 2008, 8, 311. [Google Scholar]
  3. Guth, S.; Wegner, M. Having it both ways: Sox protein function between conservation and innovation. Cell. Mol. Life Sci. 2008, 65, 3000–3018. [Google Scholar]
  4. Heenan, P.; Zondag, L.; Wilson, M.J. Evolution of the Sox gene family within the chordate phylum. Gene 2016, 575, 385–392. [Google Scholar] [CrossRef] [PubMed]
  5. Kamachi, Y.; Kondoh, H. Sox proteins: Regulators of cell fate specification and differentiation. Development 2013, 140, 4129–4144. [Google Scholar] [CrossRef] [PubMed]
  6. Hokamp, K.; McLysaght, A.; Wolfe, K.H. The 2R hypothesis and the human genome sequence. J. Struct. Funct. Genomics 2003, 3, 95–110. [Google Scholar] [CrossRef]
  7. Sinclair, A.H.; Berta, P.; Palmer, M.S.; Hawkins, J.R.; Griffiths, B.L.; Smith, M.J.; Foster, J.W.; Frischauf, A.-M.; Lovell-Badge, R.; Goodfellow, P.N. A gene from the human sex-determining region encodes a protein with homology to a conserved DNA-binding motif. Nature 1990, 346, 240. [Google Scholar] [CrossRef] [PubMed]
  8. Cui, J.; Shen, X.; Zhao, H.; Nagahama, Y. Genome-wide analysis of Sox genes in Medaka (Oryzias latipes) and their expression pattern in embryonic development. Cytogenet. Genome Res. 2011, 134, 283–294. [Google Scholar] [PubMed]
  9. Schepers, G.E.; Teasdale, R.D.; Koopman, P. Twenty pairs of sox: Extent, homology, and nomenclature of the mouse and human sox transcription factor gene families. Dev. Cell 2002, 3, 167–170. [Google Scholar] [CrossRef]
  10. Wei, L.; Cheng, D.; Li, D.; Meng, M.; Peng, L.; Tang, L.; Pan, M.; Xiang, Z.; Xia, Q.; Lu, C. Identification and characterization of Sox genes in the silkworm, Bombyx mori. Mol. Biol. Rep. 2011, 38, 3573–3584. [Google Scholar] [CrossRef] [PubMed]
  11. Zhang, S.; Chen, X.; Wang, M.; Zhang, W.; Pan, J.; Qin, Q.; Zhong, L.; Shao, J.; Sun, M.; Jiang, H.; et al. Genome-wide identification, phylogeny and expressional profile of the Sox gene family in channel catfish (Ictalurus punctatus). Comp. Biochem. Physiol. Part D Genomics Proteomics 2018, 28, 17–26. [Google Scholar] [CrossRef] [PubMed]
  12. Jager, M.; Queinnec, E.; Houliston, E.; Manuel, M. Expansion of the SOX gene family predated the emergence of the Bilateria. Mol. Phylogenet. Evol. 2006, 39, 468–477. [Google Scholar] [CrossRef] [PubMed]
  13. Cremazy, F.; Berta, P.; Girard, F. Genome-wide analysis of Sox genes in Drosophila melanogaster. Mech. Dev. 2001, 109, 371–375. [Google Scholar] [CrossRef]
  14. Jiang, T.; Hou, C.-C.; She, Z.-Y.; Yang, W.-X. The SOX gene family: Function and regulation in testis determination and male fertility maintenance. Mol. Biol. Rep. 2013, 40, 2187–2194. [Google Scholar] [CrossRef]
  15. Ng, L.-J.; Wheatley, S.; Muscat, G.E.; Conway-Campbell, J.; Bowles, J.; Wright, E.; Bell, D.M.; Tam, P.P.; Cheah, K.S.; Koopman, P. SOX9 binds DNA, activates transcription, and coexpresses with type II collagen during chondrogenesis in the mouse. Dev. Biol. 1997, 183, 108–121. [Google Scholar] [CrossRef] [PubMed]
  16. Herpers, R.; van de Kamp, E.; Duckers, H.J.; Schulte-Merker, S. Redundant roles for sox7 and sox18 in arteriovenous specification in zebrafish. Circ. Res. 2008, 102, 12–15. [Google Scholar] [CrossRef] [PubMed]
  17. Zhang, L.; Wang, L.; Gowda, V.; Wang, M.; Li, X.; Kan, X. The mitochondrial genome of the Cinnamon Bittern, Ixobrychus cinnamomeus (Pelecaniformes: Ardeidae): Sequence, structure and phylogenetic analysis. Mol. Biol. Rep. 2012, 39, 8315–8326. [Google Scholar] [CrossRef]
  18. Zhang, G.; Li, C.; Li, Q.; Li, B.; Larkin, D.M.; Lee, C.; Storz, J.F.; Antunes, A.; Greenwold, M.J.; Meredith, R.W. Comparative genomics reveals insights into avian genome evolution and adaptation. Science 2014, 346, 1311–1320. [Google Scholar] [CrossRef] [Green Version]
  19. Wang, Q.; Lu, W.; Yang, J.; Jiang, L.; Zhang, Q.; Kan, X.; Yang, X. Comparative transcriptomics in three Passerida species provides insights into the evolution of avian mitochondrial complex I. Comp. Biochem. Physiol. Part D Genomics Proteomics 2018, 28, 27–36. [Google Scholar] [CrossRef]
  20. Ren, Q.; Qian, C.; Yuan, J.; Li, X.; Yang, J.; Wang, P.; Jiang, L.; Zhang, Q.; Wang, Y.; Kan, X. Complete mitochondrial genome of the Black-capped Bulbul, Pycnonotus melanicterus (Passeriformes: Pycnonotidae). Mitochondrial DNA Part A 2016, 27, 1378–1380. [Google Scholar] [CrossRef]
  21. Jiang, L.; Wang, Q.; Yu, J.; Gowda, V.; Johnson, G.; Yang, J.; Kan, X.; Yang, X. miRNAome expression profiles in the gonads of adult Melopsittacus undulatus. PeerJ 2018, 6, e4615. [Google Scholar] [CrossRef]
  22. Jiang, L.; Chen, J.; Wang, P.; Ren, Q.; Yuan, J.; Qian, C.; Hua, X.; Guo, Z.; Zhang, L.; Yang, J. The Mitochondrial Genomes of Aquila fasciata and Buteo lagopus (Aves, Accipitriformes): Sequence, structure and phylogenetic analyses. PLoS ONE 2015, 10, e0136297. [Google Scholar] [CrossRef]
  23. Jarvis, E.D.; Mirarab, S.; Aberer, A.J.; Li, B.; Houde, P.; Li, C.; Ho, S.Y.; Faircloth, B.C.; Nabholz, B.; Howard, J.T. Whole-genome analyses resolve early branches in the tree of life of modern birds. Science 2014, 346, 1320–1331. [Google Scholar] [CrossRef] [Green Version]
  24. Tiley, G.; Kimball, R.; Braun, E.; Burleigh, J. Comparison of the Chinese bamboo partridge and red Junglefowl genome sequences highlights the importance of demography in genome evolution. BMC Genomics 2018, 19, 336. [Google Scholar] [CrossRef]
  25. Wallis, J.W.; Aerts, J.; Groenen, M.A.; Crooijmans, R.P.; Layman, D.; Graves, T.A.; Scheer, D.E.; Kremitzki, C.; Fedele, M.J.; Mudd, N.K. A physical map of the chicken genome. Nature 2004, 432, 761–764. [Google Scholar] [CrossRef] [PubMed] [Green Version]
  26. Consortium, I.C.G.S. Sequence and comparative analysis of the chicken genome provide unique perspectives on vertebrate evolution. Nature 2004, 432, 695–716. [Google Scholar] [Green Version]
  27. Dalloul, R.A.; Long, J.A.; Zimin, A.V.; Aslam, L.; Beal, K.; Blomberg, L.A.; Bouffard, P.; Burt, D.W.; Crasta, O.; Crooijmans, R.P. Multi-platform next-generation sequencing of the domestic turkey (Meleagris gallopavo): Genome assembly and analysis. PLoS Biol. 2010, 8, e1000475. [Google Scholar] [CrossRef]
  28. Kawahara-Miki, R.; Sano, S.; Nunome, M.; Shimmura, T.; Kuwayama, T.; Takahashi, S.; Kawashima, T.; Matsuda, Y.; Yoshimura, T.; Kono, T. Next-generation sequencing reveals genomic features in the Japanese quail. Genomics 2013, 101, 345–353. [Google Scholar] [CrossRef] [Green Version]
  29. Halley, Y.A.; Dowd, S.E.; Decker, J.E.; Seabury, P.M.; Bhattarai, E.; Johnson, C.D.; Rollins, D.; Tizard, I.R.; Brightsmith, D.J.; Peterson, M.J. A draft de novo genome assembly for the northern bobwhite (Colinus virginianus) reveals evidence for a rapid decline in effective population size beginning in the Late Pleistocene. PLoS ONE 2014, 9, e90240. [Google Scholar] [CrossRef]
  30. Oldeschulte, D.L.; Halley, Y.A.; Wilson, M.L.; Bhattarai, E.K.; Brashear, W.; Hill, J.; Metz, R.P.; Johnson, C.D.; Rollins, D.; Peterson, M.J. Annotated draft genome assemblies for the Northern Bobwhite (Colinus virginianus) and the Scaled Quail (Callipepla squamata) reveal disparate estimates of modern genome diversity and historic effective population size. G3: Genes, Genomes, Genetics 2017, 7, 3047–3058. [Google Scholar] [CrossRef]
  31. Pokorná, M.; Giovannotti, M.; Kratochvíl, L.; Kasai, F.; Trifonov, V.A.; O’Brien, P.C.; Caputo, V.; Olmo, E.; Ferguson-Smith, M.A.; Rens, W. Strong conservation of the bird Z chromosome in reptilian genomes is revealed by comparative painting despite 275 million years divergence. Chromosoma 2011, 120, 455–468. [Google Scholar] [CrossRef]
  32. Takada, S.; Ota, J.; Kansaku, N.; Yamashita, H.; Izumi, T.; Ishikawa, M.; Wada, T.; Kaneda, R.; Choi, Y.L.; Koinuma, K.; et al. Nucleotide sequence and embryonic expression of quail and duck Sox9 genes. Gen. Comp. Endocrinol. 2006, 145, 208–213. [Google Scholar] [CrossRef]
  33. Suzuki, T.; Sakai, D.; Osumi, N.; Wada, H.; Wakamatsu, Y. Sox genes regulate type 2 collagen expression in avian neural crest cells. Dev. Growth Differ. 2006, 48, 477–486. [Google Scholar] [CrossRef] [PubMed]
  34. Clements, J.F.; Schulenberg, T.S.; Iliff, M.J.; Roberson, D.; Fredericks, T.A.; Sullivan, B.L.; Wood, C.L. The eBird/Clements Checklist of Birds of the World: v2018. Available online: https://www.birdforum.net/showthread.php?t=365123 (accessed on 14 August 2018).
  35. McGowan, P.J.K.; Christie, G.M. Japanese Quail (Coturnix japonica). In Handbook of the Birds of the World Alive; Del Hoyo, J., Elliott, A., Sargatal, J., Christie, D.A., de Juana, E., Eds.; Lynx Edicions: Barcelona, Spain, 2018. [Google Scholar]
  36. Gecgel, U.; Yilmaz, I.; Gurcan, E.K.; Karasu, S.; Dulger, G.C. Comparison of fatty acid composition between female and male Japanese quail meats. J. Chem. 2015, 2015, 569746. [Google Scholar] [CrossRef]
  37. Poynter, G.; Huss, D.; Lansford, R. Japanese quail: An efficient animal model for the production of transgenic avians. Cold Spring Harb. Protoc. 2009, 4, pdb.emo112. [Google Scholar] [CrossRef]
  38. Minvielle, F. The future of Japanese quail for research and production. Worlds Poult. Sci. J. 2004, 60, 500–507. [Google Scholar] [CrossRef]
  39. Huss, D.; Poynter, G.; Lansford, R. Japanese quail (Coturnix japonica) as a laboratory animal model. Lab Anim. 2008, 37, 513–519. [Google Scholar] [CrossRef] [PubMed]
  40. Huss, D.; Lansford, R. Fluorescent Quail: A Transgenic Model System for the Dynamic Study of Avian Development. In Avian and Reptilian Developmental Biology; Springer Humana Press: New York, NY, USA, 2017; pp. 125–147. [Google Scholar]
  41. Karcher, D.; Fleming-Waddell, J.; Applegate, T. Developmental changes in insulin-like growth factor (IGF)-I and-II mRNA abundance in extra-embryonic membranes and small intestine of avian embryos. Growth Horm. IGF Res. 2009, 19, 31–42. [Google Scholar] [CrossRef] [PubMed]
  42. McGinnis, S.; Madden, T.L. BLAST: At the core of a powerful and diverse set of sequence analysis tools. Nucleic Acids Res. 2004, 32, W20–W25. [Google Scholar] [CrossRef] [PubMed]
  43. Wang, Y.; Tang, H.; Debarry, J.D.; Tan, X.; Li, J.; Wang, X.; Lee, T.H.; Jin, H.; Marler, B.; Guo, H.; et al. MCScanX: A toolkit for detection and evolutionary analysis of gene synteny and collinearity. Nucleic Acids Res. 2012, 40, e49. [Google Scholar] [CrossRef]
  44. Bailey, T.L.; Boden, M.; Buske, F.A.; Frith, M.; Grant, C.E.; Clementi, L.; Ren, J.; Li, W.W.; Noble, W.S. MEME SUITE: Tools for motif discovery and searching. Nucleic Acids Res. 2009, 37, W202–W208. [Google Scholar] [CrossRef]
  45. Cao, Y.; Han, Y.; Meng, D.; Li, D.; Jin, Q.; Lin, Y.; Cai, Y. Structural, evolutionary, and functional analysis of the class III peroxidase gene family in Chinese Pear (Pyrus bretschneideri). Front. Plant Sci. 2016, 7, 1874. [Google Scholar] [CrossRef]
  46. Kumar, S.; Stecher, G.; Li, M.; Knyaz, C.; Tamura, K. MEGA X: Molecular Evolutionary Genetics Analysis across Computing Platforms. Mol. Biol. Evol. 2018, 35, 1547–1549. [Google Scholar] [CrossRef]
  47. Stamatakis, A. RAxML version 8: A tool for phylogenetic analysis and post-analysis of large phylogenies. Bioinformatics 2014, 30, 1312–1313. [Google Scholar] [CrossRef]
  48. Laudet, V.; Stehelin, D.; Clevers, H. Ancestry and diversity of the HMG box superfamily. Nucleic Acids Res. 1993, 21, 2493–2501. [Google Scholar] [CrossRef] [Green Version]
  49. Letunic, I.; Bork, P. Interactive Tree of Life (iTOL): An online tool for phylogenetic tree display and annotation. Bioinformatics 2006, 23, 127–128. [Google Scholar] [CrossRef]
  50. Cao, Y.; Han, Y.; Jin, Q.; Lin, Y.; Cai, Y. Comparative genomic analysis of the GRF genes in Chinese pear (Pyrus bretschneideri Rehd), poplar (Populous), grape (Vitis vinifera), Arabidopsis and rice (Oryza sativa). Front. Plant Sci. 2016, 7, 1750. [Google Scholar] [CrossRef]
  51. Rozas, J.; Ferrer-Mata, A.; Sánchez-DelBarrio, J.C.; Guirao-Rico, S.; Librado, P.; Ramos-Onsins, S.E.; Sánchez-Gracia, A. DnaSP 6: DNA sequence polymorphism analysis of large data sets. Mol. Biol. Evol. 2017, 34, 3299–3302. [Google Scholar] [CrossRef]
  52. Weaver, S.; Shank, S.D.; Spielman, S.J.; Li, M.; Muse, S.V.; Kosakovsky Pond, S.L. Datamonkey 2.0: A modern web application for characterizing selective and other evolutionary processes. Mol. Biol. Evol. 2018, 35, 773–777. [Google Scholar] [CrossRef]
  53. Wu, J.; Vallenius, T.; Ovaska, K.; Westermarck, J.; Mäkelä, T.P.; Hautaniemi, S. Integrated network analysis platform for protein-protein interactions. Nat. Methods 2008, 6, 75. [Google Scholar] [CrossRef]
  54. Yu, G.; Wang, L.-G.; Han, Y.; He, Q.-Y. clusterProfiler: An R package for comparing biological themes among gene clusters. Omics 2012, 16, 284–287. [Google Scholar] [CrossRef]
  55. Livak, K.J.; Schmittgen, T.D. Analysis of Relative Gene Expression Data Using Real-Time Quantitative PCR and the 2−ΔΔCT Method. Methods 2001, 25, 402–408. [Google Scholar] [CrossRef]
  56. Mandal, A.; Mishra, A.K.; Dulani, P.; Muthamilarasan, M.; Shweta, S.; Prasad, M. Identification, characterization, expression profiling, and virus-induced gene silencing of armadillo repeat-containing proteins in tomato suggest their involvement in tomato leaf curl New Delhi virus resistance. Funct. Integr. Genomics 2018, 18, 101–111. [Google Scholar] [CrossRef]
  57. Wei, L.; Yang, C.; Tao, W.; Wang, D. Genome-Wide Identification and Transcriptome-Based Expression Profiling of the Sox Gene Family in the Nile Tilapia (Oreochromis niloticus). Int. J. Mol. Sci. 2016, 17, 270. [Google Scholar] [CrossRef]
  58. Janssen, R.; Andersson, E.; Betnér, E.; Bijl, S.; Fowler, W.; Höök, L.; Leyhr, J.; Mannelqvist, A.; Panara, V.; Smith, K. Embryonic expression patterns and phylogenetic analysis of panarthropod sox genes: Insight into nervous system development, segmentation and gonadogenesis. BMC Evol. Biol. 2018, 18, 88. [Google Scholar] [CrossRef]
  59. Ohno, S. Gene duplication and the uniqueness of vertebrate genomes circa 1970–1999. Semin. Cell Dev. Biol. 1999, 10, 517–522. [Google Scholar] [CrossRef]
  60. Kyte, J.; Doolittle, R.F. A simple method for displaying the hydropathic character of a protein. J. Mol. Biol. 1982, 157, 105–132. [Google Scholar] [CrossRef] [Green Version]
  61. Kerner, P.; Simionato, E.; Le Gouar, M.; Vervoort, M. Orthologs of key vertebrate neural genes are expressed during neurogenesis in the annelid Platynereis dumerilii. Evol. Dev. 2009, 11, 513–524. [Google Scholar] [CrossRef] [PubMed]
  62. Pioro, H.L.; Stollewerk, A.J.D.g. The expression pattern of genes involved in early neurogenesis suggests distinct and conserved functions in the diplopod Glomeris marginata. Dev. Genes Evol. 2006, 216, 417–430. [Google Scholar] [CrossRef]
  63. Le Gouar, M.; Guillou, A.; Vervoort, M. Expression of a SoxB and a Wnt2/13 gene during the development of the mollusc Patella vulgata. Dev. Genes Evol. 2004, 214, 250–256. [Google Scholar] [CrossRef]
  64. Wegner, M.; Stolt, C.C. From stem cells to neurons and glia: A Soxist’s view of neural development. Trends Neurosci. 2005, 28, 583–588. [Google Scholar] [CrossRef]
  65. Pevny, L.H.; Sockanathan, S.; Placzek, M.; Lovell-Badge, R. A role for SOX1 in neural determination. Development 1998, 125, 1967–1978. [Google Scholar]
  66. Uchikawa, M.; Kamachi, Y.; Kondoh, H. Two distinct subgroups of Group B Sox genes for transcriptional activators and repressors: Their expression during embryonic organogenesis of the chicken. Mech. Dev. 1999, 84, 103–120. [Google Scholar] [CrossRef]
  67. Magie, C.R.; Pang, K.; Martindale, M.Q. Genomic inventory and expression of Sox and Fox genes in the cnidarian Nematostella vectensis. Dev. Genes Evol. 2005, 215, 618–630. [Google Scholar] [CrossRef]
  68. Kenny, N.J.; Shimeld, S.M. Additive multiple k-mer transcriptome of the keelworm Pomatoceros lamarckii (Annelida; Serpulidae) reveals annelid trochophore transcription factor cassette. Dev. Genes Evol. 2012, 222, 325–339. [Google Scholar] [CrossRef] [PubMed]
  69. Jager, M.; Quéinnec, E.; Chiori, R.; Le Guyader, H.; Manuel, M. Insights into the early evolution of SOX genes from expression analyses in a ctenophore. J. Exp. Zool. B Mol. Dev. Evol. 2008, 310, 650–667. [Google Scholar] [CrossRef]
  70. Štros, M.; Launholt, D.; Grasser, K.D. The HMG-box: A versatile protein domain occurring in a wide variety of DNA-binding proteins. Cell. Mol. Life Sci. 2007, 64, 2590–2606. [Google Scholar] [CrossRef]
  71. Soullier, S.; Jay, P.; Poulat, F.; Vanacker, J.-M.; Berta, P.; Laudet, V. Diversification pattern of the HMG and SOX family members during evolution. J. Mol. Evol. 1999, 48, 517–527. [Google Scholar] [CrossRef]
  72. Cao, Y.; Han, Y.; Li, D.; Lin, Y.; Cai, Y. MYB transcription factors in chinese pear (Pyrus bretschneideri Rehd.): Genome-wide identification, classification, and expression profiling during fruit development. Front. Plant Sci. 2016, 7, 577. [Google Scholar] [CrossRef]
  73. Sato, S.; Nakamura, Y.; Kaneko, T.; Asamizu, E.; Kato, T.; Nakao, M.; Sasamoto, S.; Watanabe, A.; Ono, A.; Kawashima, K. Genome structure of the legume, Lotus japonicus. DNA Res. 2008, 15, 227–239. [Google Scholar] [CrossRef]
  74. Lin, Y.; Cheng, Y.; Jin, J.; Jin, X.; Jiang, H.; Yan, H.; Cheng, B. Genome duplication and gene loss affect the evolution of heat shock transcription factor genes in legumes. PLoS ONE 2014, 9, e102825. [Google Scholar] [CrossRef] [PubMed]
  75. Voldoire, E.; Brunet, F.; Naville, M.; Volff, J.-N.; Galiana, D. Expansion by whole genome duplication and evolution of the sox gene family in teleost fish. PLoS ONE 2017, 12, e0180936. [Google Scholar] [CrossRef]
  76. Yang, Z. PAML 4: Phylogenetic analysis by maximum likelihood. Mol. Biol. Evol. 2007, 24, 1586–1591. [Google Scholar] [CrossRef]
  77. Wang, Y.; Feng, L.; Zhu, Y.; Li, Y.; Yan, H.; Xiang, Y. Comparative genomic analysis of the WRKY III gene family in populus, grape, arabidopsis and rice. Biol. Direct 2015, 10, 48. [Google Scholar] [CrossRef] [Green Version]
  78. Song, H.; Guo, Z.; Chen, T.; Sun, J.; Yang, G. Genome-wide identification of LRR-containing sequences and the response of these sequences to nematode infection in Arachis duranensis. BMC Plant Biol. 2018, 18, 279. [Google Scholar] [CrossRef]
  79. Consortium, M.G.S. Initial sequencing and comparative analysis of the mouse genome. Nature 2002, 420, 520–562. [Google Scholar] [CrossRef]
  80. He, Y.; Zuo, Q.; Edwards, J.; Zhao, K.; Lei, J.; Cai, W.; Nie, Q.; Li, B.; Song, J. DNA Methylation and Regulatory Elements during Chicken Germline Stem Cell Differentiation. Stem Cell Rep. 2018, 10, 1793–1806. [Google Scholar] [CrossRef] [PubMed]
  81. Bae, S.M.; Lim, W.; Jeong, W.; Lee, J.Y.; Kim, J.; Han, J.Y.; Bazer, F.W.; Song, G. Hormonal regulation of β-catenin during development of the avian oviduct and its expression in epithelial cell-derived ovarian carcinogenesis. Mol. Cell. Endocrinol. 2014, 382, 46–54. [Google Scholar] [CrossRef] [PubMed]
  82. Cao, J.; Wei, J.; Yang, P.; Zhang, T.; Chen, Z.; He, F.; Wei, F.; Chen, H.; Hu, H.; Zhong, J. Genome-scale CRISPR-Cas9 knockout screening in gastrointestinal stromal tumor with Imatinib resistance. Mol. Cancer 2018, 17, 121. [Google Scholar] [CrossRef] [PubMed]
  83. Zhang, B.; Wu, J.; Cai, Y.; Luo, M.; Wang, B.; Gu, Y. AAED1 modulates proliferation and glycolysis in gastric cancer. Oncol. Rep. 2018, 40, 1156–1164. [Google Scholar] [CrossRef]
  84. Li, X.; Eishi, Y.; Bai, Y.; Sakai, H.; Akiyama, Y.; Tani, M.; Takizawa, T.; Koike, M.; Yuasa, Y. Expression of the SRY-related HMG box protein SOX2 in human gastric carcinoma. Int. J. Oncol. 2004, 24, 257–263. [Google Scholar] [CrossRef] [PubMed]
  85. Shimizu, T.; Nakazawa, M.; Kani, S.; Bae, Y.-K.; Shimizu, T.; Kageyama, R.; Hibi, M. Zinc finger genes Fezf1 and Fezf2 control neuronal differentiation by repressing Hes5 expression in the forebrain. Developmental 2010, 137, 1875–1885. [Google Scholar] [CrossRef] [PubMed] [Green Version]
  86. Kajiro, M.; Tsuchiya, M.; Kawabe, Y.-I.; Furumai, R.; Iwasaki, N.; Hayashi, Y.; Katano, M.; Nakajima, Y.; Goto, N.; Watanabe, T. The E3 ubiquitin ligase activity of Trip12 is essential for mouse embryogenesis. PLoS ONE 2011, 6, e25871. [Google Scholar] [CrossRef] [PubMed]
  87. Barrionuevo, F.; Scherer, G. SOX E genes: SOX9 and SOX8 in mammalian testis development. Int. J. Biochem. Cell Biol. 2010, 42, 433–436. [Google Scholar] [CrossRef] [PubMed]
  88. Zhao, L.; Arsenault, M.; Ng, E.T.; Longmuss, E.; Chau, T.C.-Y.; Hartwig, S.; Koopman, P. SOX4 regulates gonad morphogenesis and promotes male germ cell differentiation in mice. Dev. Biol. 2017, 423, 46–56. [Google Scholar] [CrossRef] [Green Version]
  89. Jeng, S.; Wu, G.; Yueh, W.; Kuo, S.; Dufour, S.; Chang, C. Gonadal development and expression of sex-specific genes during sex differentiation in the Japanese eel. Gen. Comp. Endocrinol. 2018, 257, 74–85. [Google Scholar] [CrossRef] [PubMed]
  90. Irie, N.; Weinberger, L.; Tang, W.W.; Kobayashi, T.; Viukov, S.; Manor, Y.S.; Dietmann, S.; Hanna, J.H.; Surani, M.A. SOX17 is a critical specifier of human primordial germ cell fate. Cell 2015, 160, 253–268. [Google Scholar] [CrossRef]
  91. Han, F.; Dong, Y.; Liu, W.; Ma, X.; Shi, R.; Chen, H.; Cui, Z.; Ao, L.; Zhang, H.; Cao, J. Epigenetic regulation of sox30 is associated with testis development in mice. PLoS ONE 2014, 9, e97203. [Google Scholar] [CrossRef]
  92. Kamachi, Y.; Uchikawa, M.; Kondoh, H. Pairing SOX off: With partners in the regulation of embryonic development. Trends Genet. 2000, 16, 182–187. [Google Scholar] [CrossRef]
  93. Larney, C.; Bailey, T.L.; Koopman, P. Switching on sex: Transcriptional regulation of the testis-determining gene Sry. Development 2014, 141, 2195–2205. [Google Scholar] [CrossRef] [PubMed]
  94. Sekido, R.; Lovell-Badge, R. Sex determination involves synergistic action of SRY and SF1 on a specific Sox9 enhancer. Nature 2008, 453, 930. [Google Scholar] [CrossRef] [PubMed]
  95. Sun, F.; Liu, S.; Gao, X.; Jiang, Y.; Perera, D.; Wang, X.; Li, C.; Sun, L.; Zhang, J.; Kaltenboeck, L. Male-biased genes in catfish as revealed by RNA-Seq analysis of the testis transcriptome. PLoS ONE 2013, 8, e68452. [Google Scholar] [CrossRef] [PubMed]
  96. Da Silva, S.M.; Hacker, A.; Harley, V.; Goodfellow, P.; Swain, A.; Lovell-Badge, R. Sox9 expression during gonadal development implies a conserved role for the gene in testis differentiation in mammals and birds. Nat. Genet. 1996, 14, 62. [Google Scholar] [CrossRef] [PubMed]
  97. Smith, C.A.; Smith, M.J.; Sinclair, A.H. Gene expression during gonadogenesis in the chicken embryo. Gene 1999, 234, 395–402. [Google Scholar] [CrossRef]
  98. Nagai, K. Molecular evolution of Sry and Sox gene. Gene 2001, 270, 161–169. [Google Scholar] [CrossRef]
Figure 1. The phylogenetical analyses, categories, and abundance of Sox gene members in galliform birds. Note: The total gene number of T. cupido pinnatus genome is not available in NCBI.
Genes 10 00314 g001
Figure 2. Distribution of the Sox gene family on quail chromosomes.
Genes 10 00314 g002
Figure 3. Phylogenetic tree of the Galliformes Sox family proteins. The tree was constructed using RaxML with the maximum likelihood (ML) method.
Genes 10 00314 g003
Figure 4. Motifs of the quail Sox family genes. Boxes with different numbers represent different motifs. M1 represents the core motif HMG-box (79 amino acids residues and the 3D structure are presented on the right).
Genes 10 00314 g004
Figure 5. Microsynteny related to Sox genes in C. japonica. Triangles represented Sox genes and the flanking genes in the Sox gene family. The gene’s orientation is also represented by the triangle. The homologous genes on two fragments are connected by lines.
Genes 10 00314 g005
Figure 6. Sliding-window plots of representative duplicated Sox gene family members in C. japonica. The step size was 9 bp, and the window size was 150 bp.
Genes 10 00314 g006
Figure 7. Predicted protein–protein interaction (PPI) network analyses of SOX proteins.
Genes 10 00314 g007
Figure 8. Heatmap of expression profiles for the Sox mRNAs in the quails. The color scale represents relative expression levels. The red or green color represented the higher or lower relative abundance of each transcript in each sample. Each column represents one sample, and each row indicates one Sox transcript.
Genes 10 00314 g008
Figure 9. qPCR expression profile of the five quail Sox genes between the incubation period and the post-hatch period in the quail ovaries (A) and testes (B), respectively.
Genes 10 00314 g009
Table 1. Primers used in the qPCR analysis.
Gene NamePrimer Sequence (5′–3′)Primer Length (bp)
Sox4-FCATCAAGCGACCGATGAACG20
Sox4-RCTTCTCGCTGTCCTTCAGCA20
Sox3-FCCGAGATCAAGACTCCGCAA20
Sox3-RGTTCTCCTGGGCCATCTTCC20
Sox9-FGGAGAACACCCGACCTCAAG20
Sox9-RCGTGGGGTTTGTTCTTGCTG20
Sox17-FTAAATCGTGGAAGGCGCTGT20
Sox17-RGCCGCTTCACCTGCTTCTTC20
Sox30-FCTAGGATTCACCGACCTGCC20
Sox30-RTGGTCGTGGCTGATAAACCC20
β-action-FTGTAACCCAACAAGTGTCTT20
β-action-RCCACATACTGGCACTTTACT20
Table 2. The identification of the duplicated type for Sox genes and all the genes in C. japonica and other representative species. WGD: whole-genome duplication.
SpeciesC. japonicaG. gallusC. virginianusC. squamataN. meleagrisB. thoracicusM. gallopavo
SingletonGenome3158244345624491425960435847
Sox0000000
DispersedGenome4526435312332122664197115886459
Sox131213149139
ProximalGenome201540181831322580911214
Sox0110100
TandemGenome289743784367104318304119539
Sox4300504
WGD or segmentalGenome416560221393750263
Sox1200000
TotalGenome39089451991716617132432411776333322
Sox18181414151313
Table 3. Sox family genes in C. japonica genome and their sequence characteristics. GRAVY: grand average of hydropathy.
GroupGeneIntron NumberLength (aa)Molecular Weight (KDa)pIGRAVY
B1Sox1037337.918579.70−0.505
Sox2040444.219289.96−0.641
Sox3031634.029459.68−0.715
B2Sox14024026.665559.68−0.630
Sox21028028.767979.74−0.218
CSox4042743.105597.10−0.658
Sox11039643.183914.92−0.770
Sox12028531.265467.65−0.805
DSox52177385.079676.15−0.746
Sox61581690.574726.66−0.817
Sox131561268.315256.13−0.810
ESox8247050.903916.37−0.820
Sox9249555.035466.16−1.080
Sox10356560.968687.47−0.788
FSox17138740.387436.68−0.580
Sox18141846.224706.40−0.791
Sox7137741.159156.62−0.759
HSox30463868.850696.07−0.490

