Article

DNA Barcode Reveals the Bycatch of Endangered Batoids Species in the Southwest Atlantic: Implications for Sustainable Fisheries Management and Conservation Efforts

1
Laboratório de Genética e Conservação, Universidade Santa Cecília (UNISANTA), Santos 11045-907, Brazil
2
Laboratório de Genética Pesqueira e Conservação (GenPesC), Instituto do Mar, Universidade Federal de São Paulo (UNIFESP), Santos 11070-102, Brazil
3
Acervo Zoológico, Universidade Santa Cecília (UNISANTA), Oswaldo Cruz St. 266, Santos 11045-907, Brazil
4
Laboratório de Biologia e Genética de Peixes (LBGP), Instituto de Biociências de Botucatu (IBB), Universidade Estadual Paulista “Júlio de Mesquita Filho” (UNESP), Botucatu 18618-689, Brazil
*
Author to whom correspondence should be addressed.
Genes 2019, 10(4), 304; https://doi.org/10.3390/genes10040304
Submission received: 26 February 2019 / Revised: 1 April 2019 / Accepted: 1 April 2019 / Published: 18 April 2019

Abstract

:
Today, elasmobranchs are one the most threatened vertebrate groups worldwide. In fact, at least 90% of elasmobranch species are listed in the International Union for Conservation of Nature (IUCN) Red List, while more than 40% are data-deficient. Although these vertebrates are mainly affected by unsustainable fishery activities, bycatch is also one of the major threats to sharks and batoids worldwide, and represents a challenge for both sustainable fishery management and for biodiversity and conservational efforts. Thus, in this study, DNA barcode methodology was used to identify the bycatch composition of batoid species from small-scale industrial fisheries in the southwest Atlantic and artisanal fisheries from southeast Brazil. A total of 228 individuals belonging to four Chondrichthyes orders, seven families, and at least 17 distinct batoid species were sequenced; among these individuals, 131 belonged to species protected in Brazil, 101 to globally threatened species, and some to species with trade restrictions provided by Appendix II of the Convention on International Trade in Endangered Species (CITES). These results highlight the impacts on marine biodiversity of bycatch by small-scale industrial and unmanaged artisanal fisheries from the southwest Atlantic, and support the implementation of DNA-based methodologies for species-specific identification in data-poor fisheries as a powerful tool for improving the quality of fisheries’ catch statistics and for keeping precise bycatch records.

1. Introduction

Batoidea is a superorder of cartilaginous fish commonly known as rays, stingrays, or skates (hereafter “batoids”). They are currently the largest subgroup of the Chondrichthyes class and include 26 families with 633 valid species, and at least 50 unrecognized or undescribed species [1,2]. Batoids are caught as bycatch in different fishing equipment worldwide [3]. As a consequence of the high exposure to fishing activity on the continental shelf, some batoid species are on the brink of extinction. In fact, five of the seven most endangered Chondrichthyes families worldwide are from the Batoidea superorder [4]. In 2018, the International Union for Conservation of Nature (IUCN) assessed a total of 573 batoids, of which ~21% are in the threatened categories, and 41.7% are data deficient [5].
According to the Food and Agriculture Organization (FAO) of the United Nations (UN), the reported global production of sharks and batoids in 2016 was more than 767,000 tons, and batoids accounted for ~36% of catches [6]. However, this does not reflect real catches because these reports neither include discard numbers nor illegal, unreported, and unregulated (IUU) fisheries, which has led to underestimation of the actual magnitude of the reported catches [7]. Most batoid captures consist of unreported bycatch from trawlers and gillnet fisheries [4]. According to the most popular definition, bycatch is the non-target marine animals caught unintentionally during fishing activities [8]. Bycatch is commonly consists of (a) non-target species that are kept and eaten/sold, and (b) discards, which are those organisms that are thrown back (alive or dead) into the sea. The discards are the common focus of studies on bycatch, as they are a subset that represents a waste of fishery resources and thus attracts significant public awareness, and usually includes endangered, threatened, or protected species [9].
Discards consist of those specimens that lack market demand, are physically damaged, have low trade value, exceed allowed quotas, or represent illegal retention onboard [10,11]. However, discards that have commercial value are usually unmanaged, because fisheries management focuses mostly on target species [12]. The poor management of non-target catches compromises sustainability efforts and can result in substantial undocumented biomass removal [13]. Trawlers and gillnets use non-selective gear and catch many non-target species. Indeed, these fishing techniques present high discard rates and are considered to be the most wasteful form of fishing, which affects elasmobranch as well [14,15]. The lack of available information on coastal trawling fisheries is of great concern given the number of elasmobranch bycatch [16], and thus the impact of fisheries emphasizes the need to assess not only the conservation status of target species, but also that of bycatch and discarded species. Thus, the collection of species-specific data on these fishing methods is of the utmost importance and should therefore be implemented [3].
Only a small percentage of batoids are properly reported at the lowest taxonomic level [12]. The lack of species-specific identification is a severe problem for fishing activity, hindering the efforts of fisheries management, as well as making it extremely hard to implement the supervision of protected and endangered species [17]. The inadequate identification of elasmobranch species, as well as their poor commercial labeling, are major concerns worldwide, as they undermine biodiversity conservation objectives designed to promote sustainability [18]. Nowadays, traditional morphological methods for species identification are coupled with DNA-based approaches (e.g., DNA barcoding) [19]. These techniques have undergone rapid progress, becoming widely applied mainly due to cost reductions combined with the need to address critical conservation issues and fisheries management problems [20]. Solutions based on scientific data have made molecular techniques applicable to several current biological issues, such as species identification, population structure, and the evaluation of fishery genetic stocks, as well as the evolutionary relationships among species [21].
Genetic approaches have a long and successful history when it comes to shark identification, as documented in many studies conducted worldwide for trade surveillance and biodiversity conservation purposes [22,23,24,25,26,27]. However, overall, batoids received less attention in research studies compared to sharks [28,29,30]. Within this context, our main objective was to identify bycatch batoid specimens caught by trawlers and gillnets from small-scale industrial and artisanal fisheries by applying DNA barcoding, in order to improve bycatch species-specific statistics and gather more biodiversity information on bycatch fauna from south–southeast of Brazil in the southwest Atlantic.

2. Materials and Methods
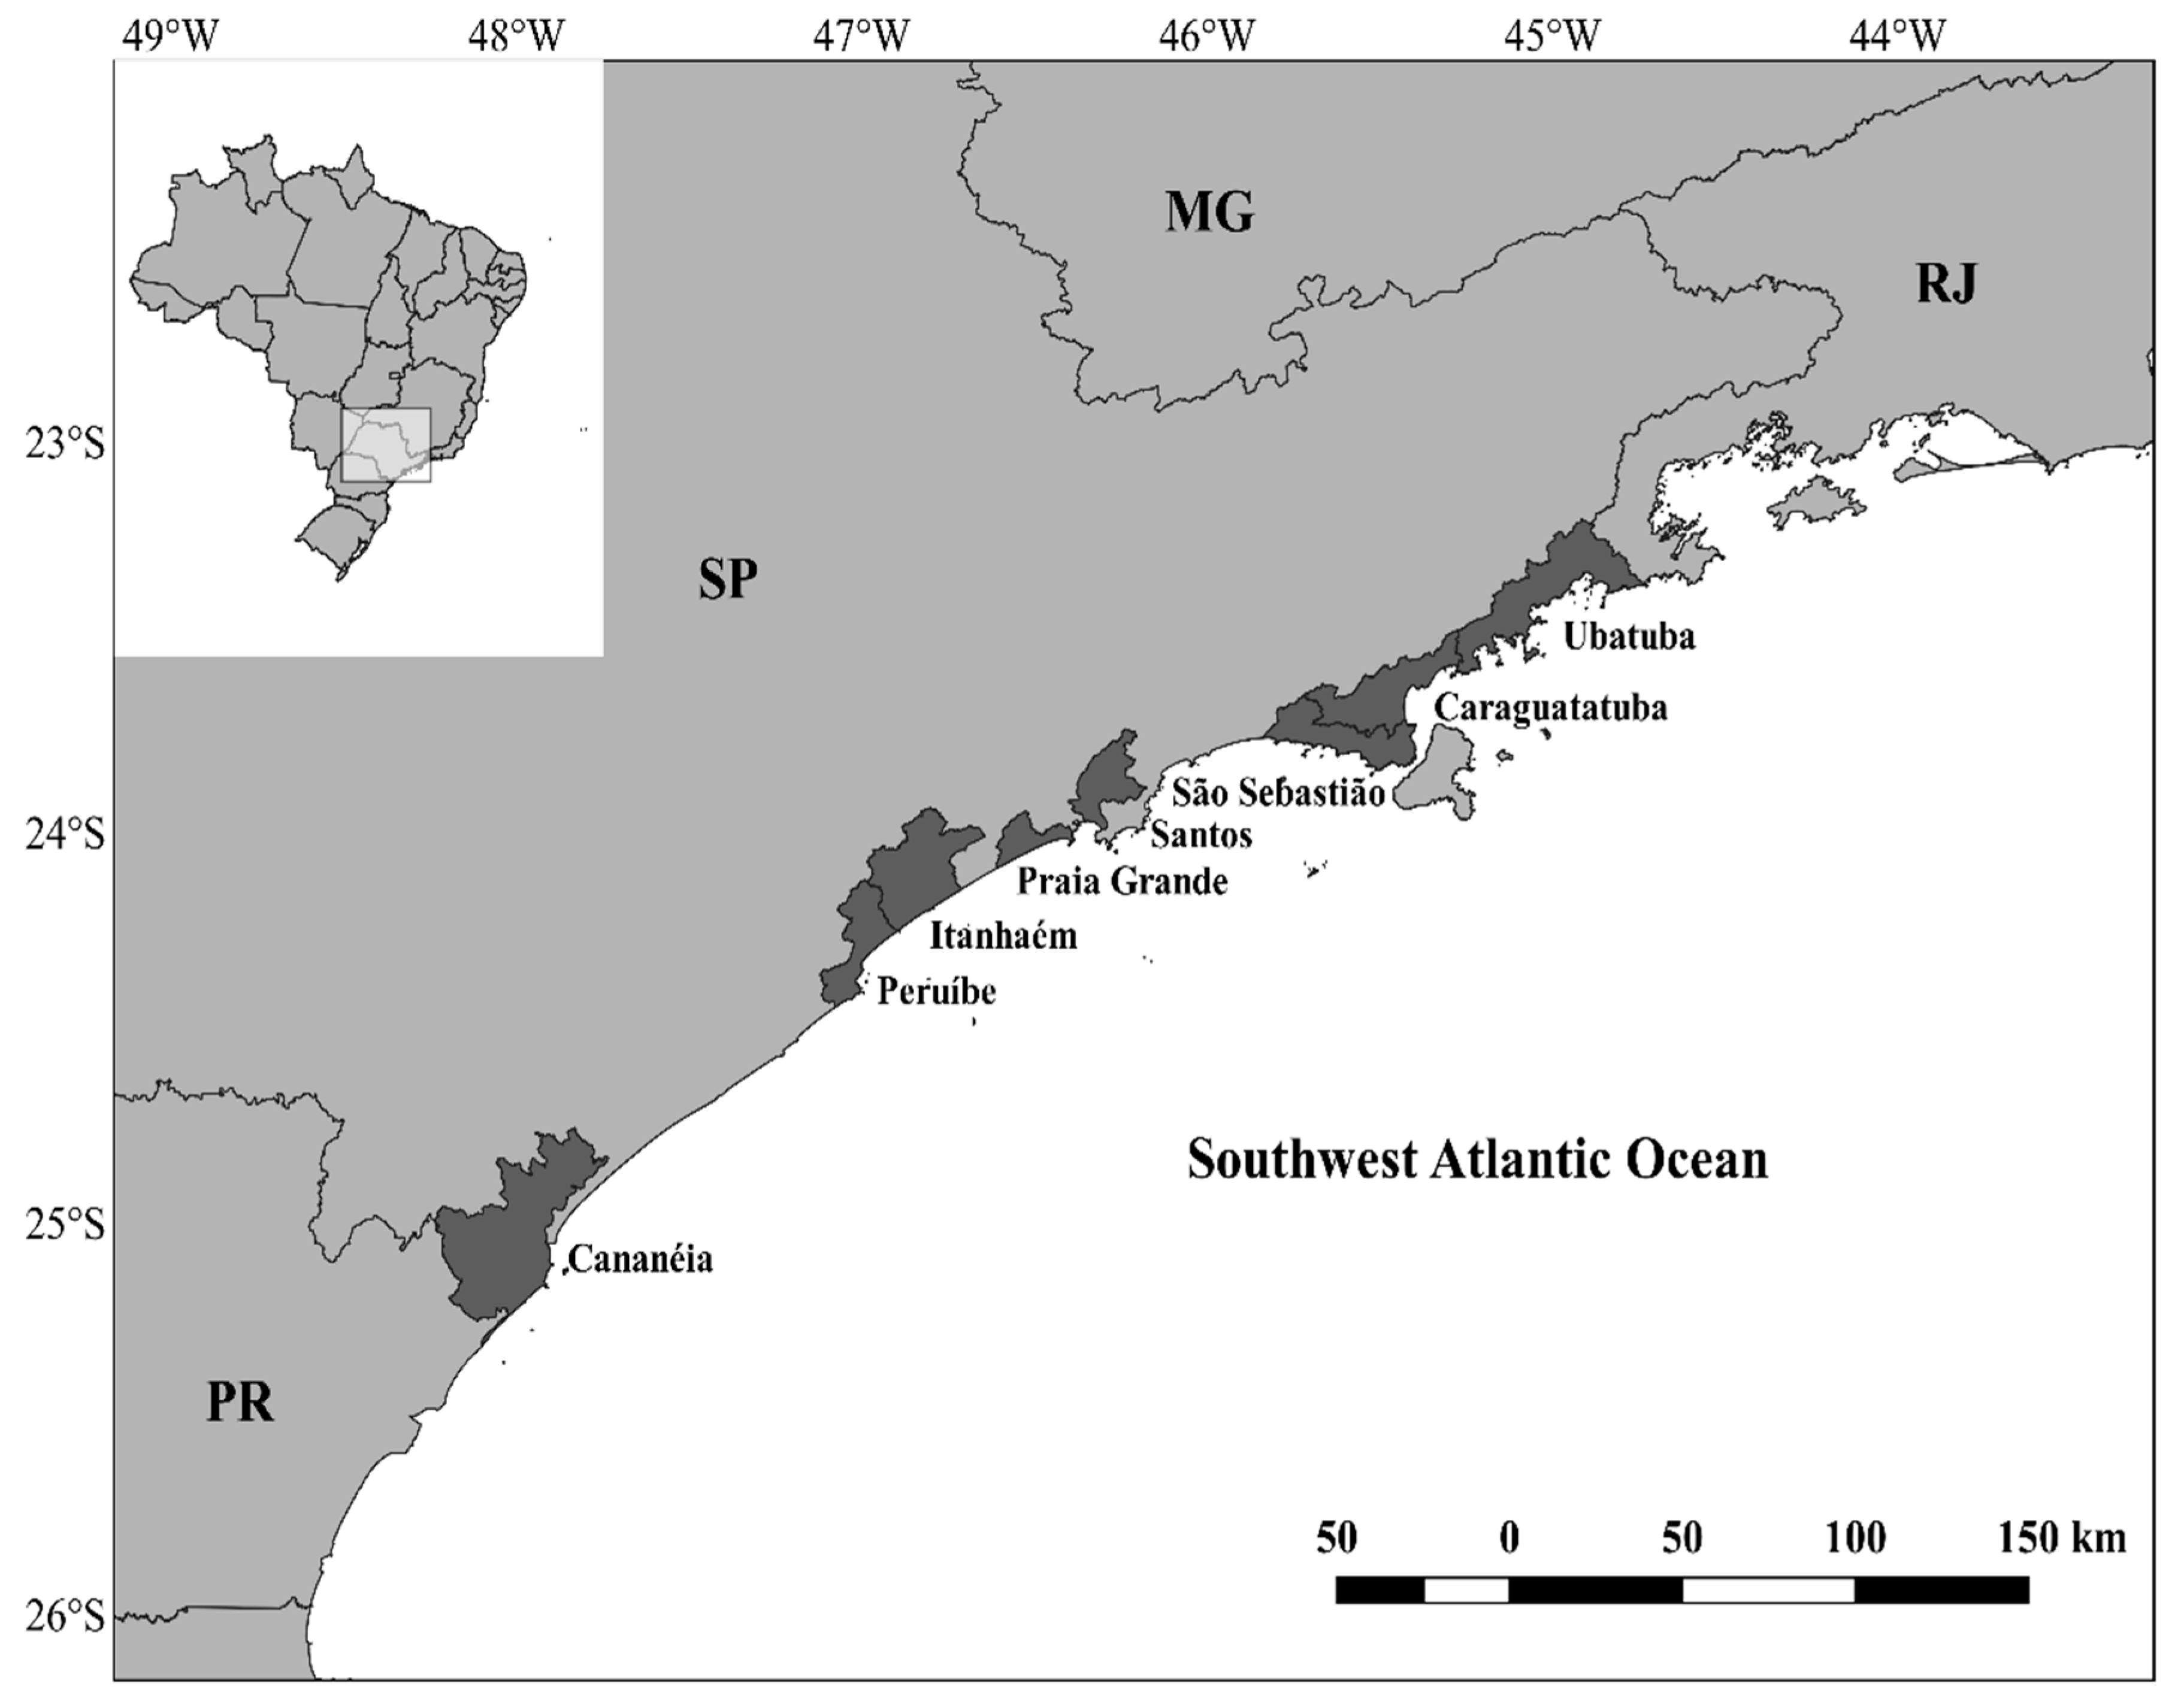
2.1. Sampling

Batoid muscle tissue samples were obtained from bycatch specimens from artisanal fisheries, such as gillnets and fish-traps, and also small-scale trawler fisheries, such as otter-trawls and beam-trawls, operating along the Brazilian south–southeast coast between 2012 and 2018 (Figure 1). All tissues samples were stored in 95% ethyl alcohol at −20 °C and deposited at the collection of the Genetics Fisheries and Conservation Laboratory (GenPesC) at the Marine Institute (IMar) of the Federal University of São Paulo (UNIFESP), campus Baixada Santista, under a permanent license issued by the Brazilian Ministry of the Environment (No. 50463-1).

2.2. DNA Extraction, Amplification, and Sequencing

Genomic DNA was extracted using the NucleoSpin® Tissue kit (MACHEREY-NAGEL GmbH & Co.). The mitochondrial cytochrome c oxidase subunit I gene (COI) was amplified by polymerase chain reaction (PCR) using the Platinum® Taq DNA Polymerase kit (Invitrogen) with the following primers: forward: Fish-F1: 5′-TCA ACC AAC CAC AAA GAC ATT GGC AC-3′, and reverse: Fish-R1: 5′-TAG ACT TCT GGG TGG CCA AAG AAT CA-3′ [31]. PCR products were purified with ExoSAP-IT PCR Product Cleanup Reagent (Applied Biosystems). Sequencing reactions were carried out using the BigDye Terminator v3.1 Cycle Sequencing Kit (Applied Biosystems), according to the manufacturer’s instructions, on a 3130xl Genetic Analyzer (Applied Biosystems).

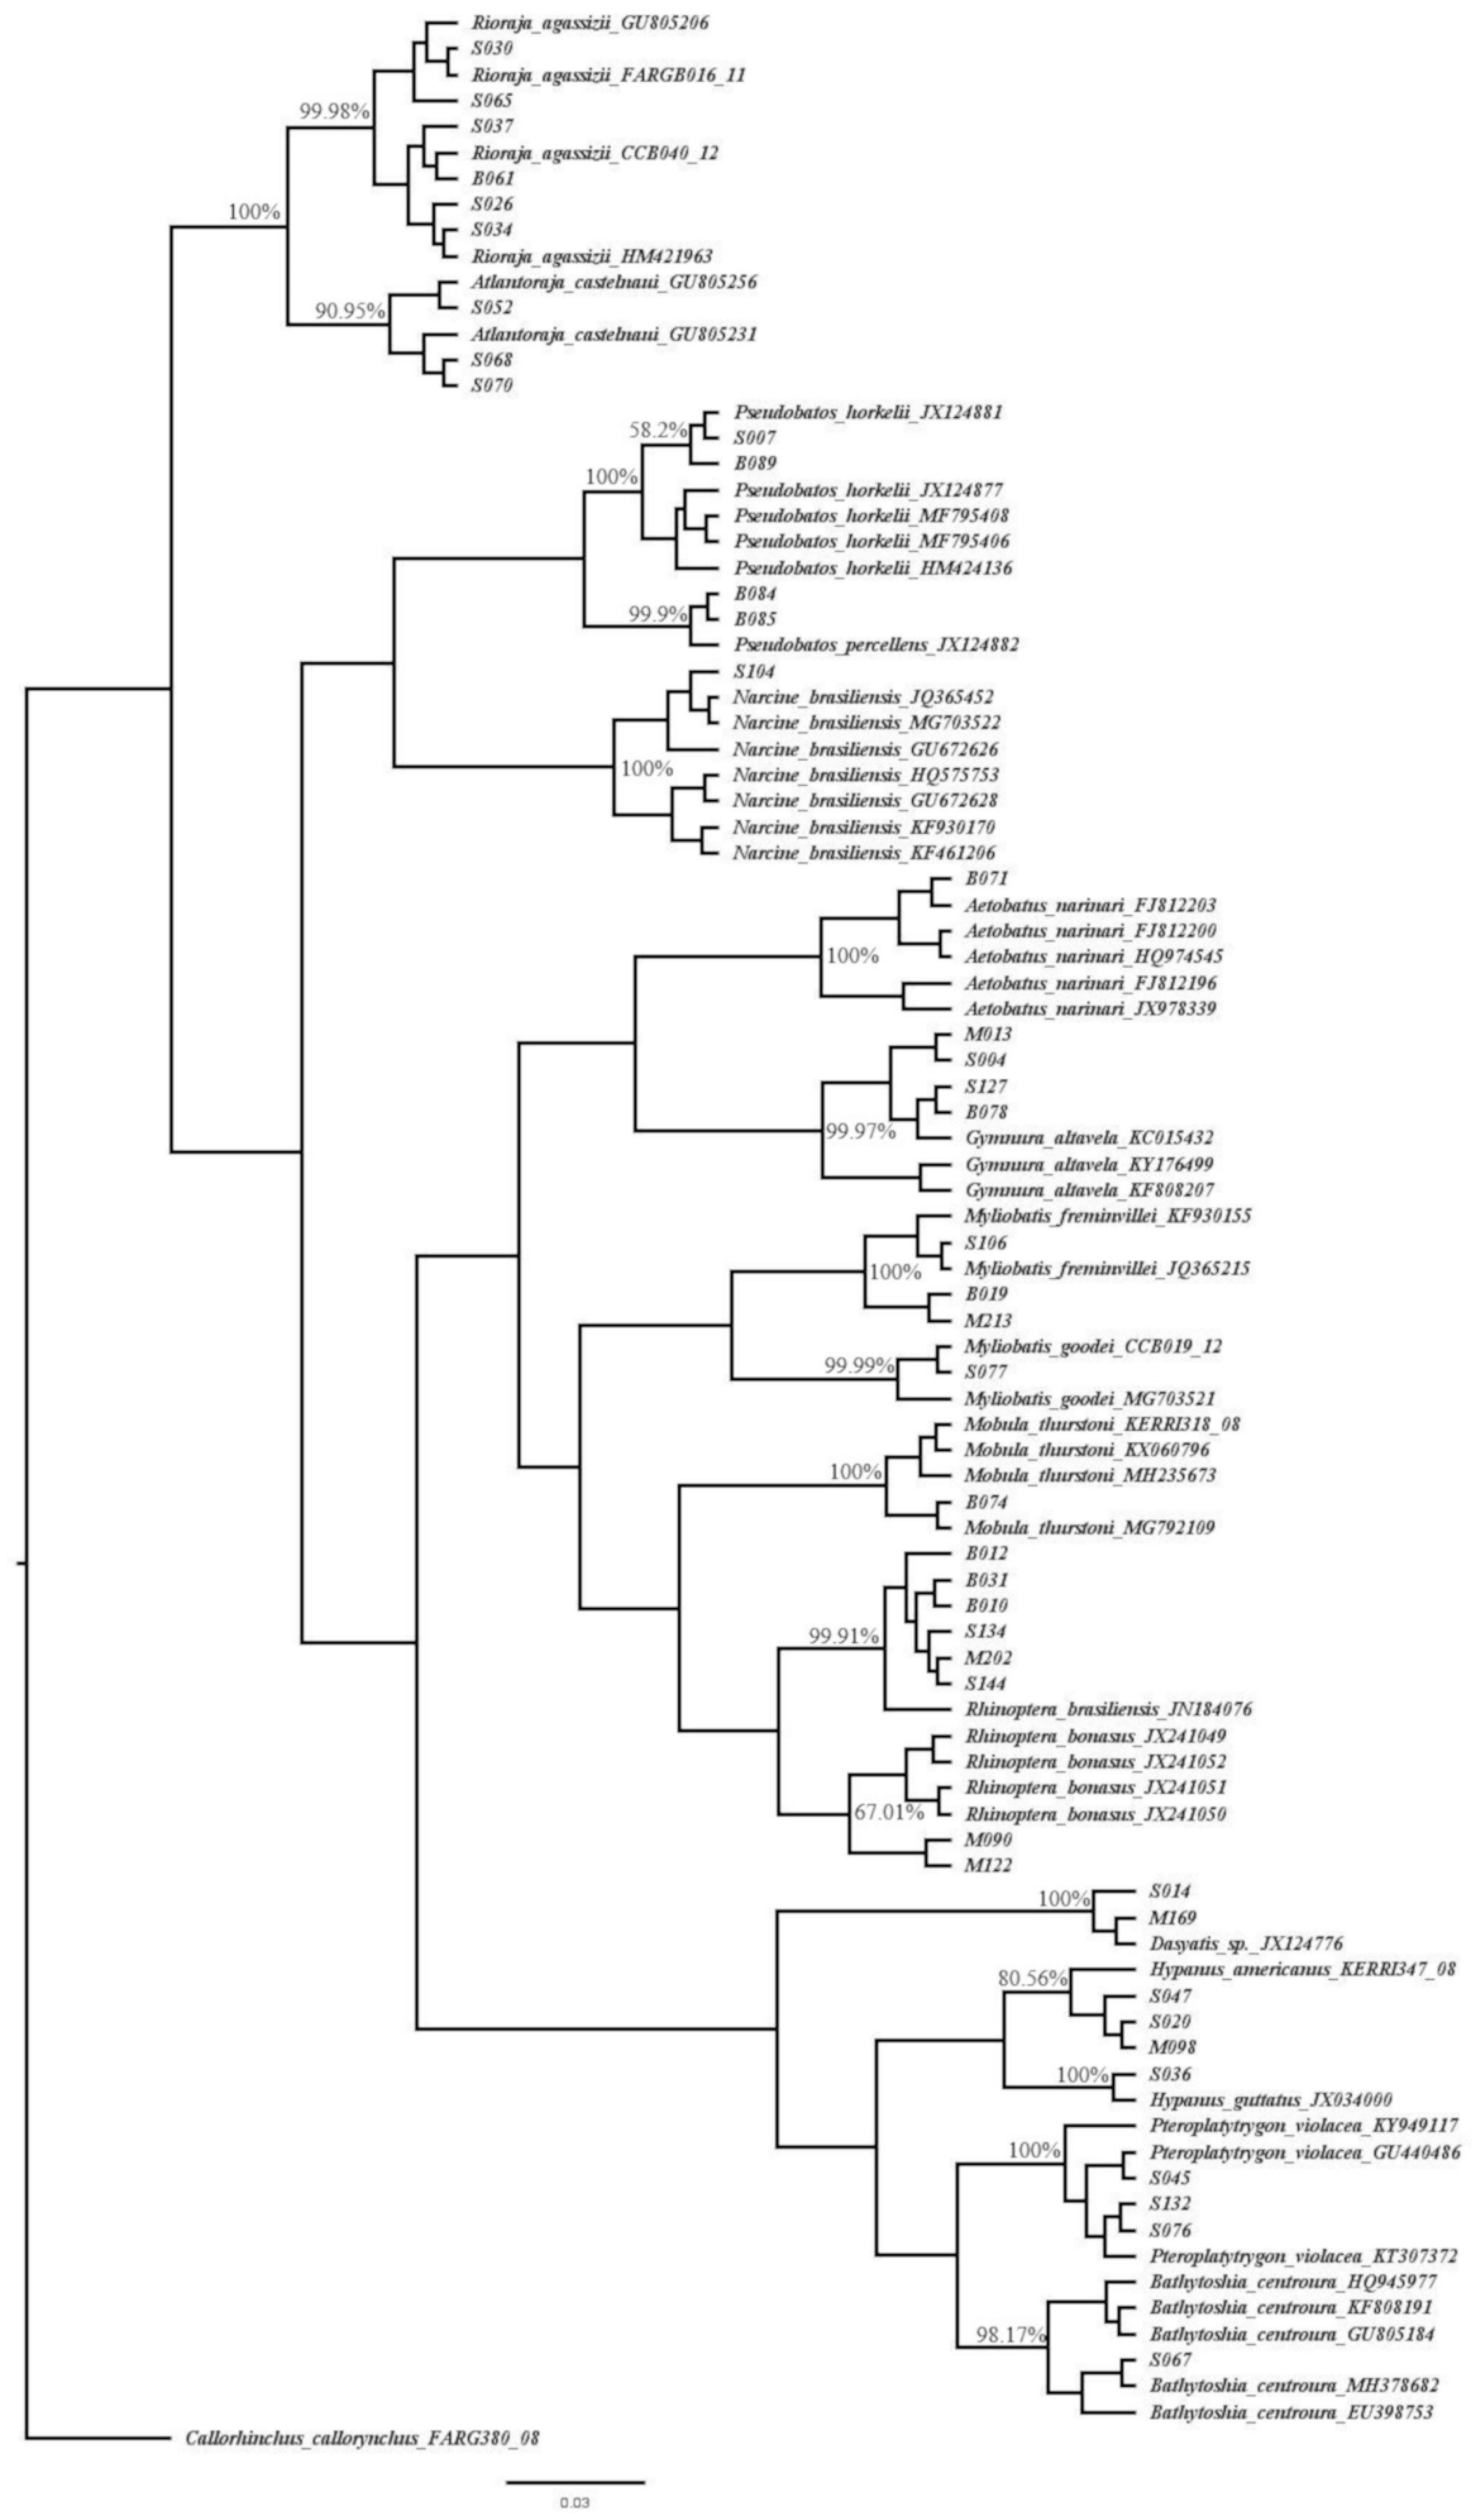
2.3. DNA-Based Species Identification

For taxonomic identification, no traditional morphological method was used due to the fact that the vast majority of individuals were not intact, which would compromise the identification itself. The species common names used by fishermen were not considered either, as they could bias identification; only DNA-based species identification was employed. Two methodological approaches were applied for species assignment: sequence similarity-based identification and phylogenetic tree-based identification [32]. First, a similarity test was performed between our sequences and the reference libraries in the genetic databases BOLD (the Barcode of Life Data system) [33] and GenBank® [34] using similarity scores (e.g., BLAST) [35], assigning the species name to the sequence with the highest similarity. Second, a phylogenetic tree-based method [36] was executed to assign unidentified barcodes to species based on tree clusters to estimate the phylogenic relationship between the reference barcodes and the query sequence. The query was assigned to the species it clustered within.
The second approach involved the construction of a phylogenetic tree based on the maximum-likelihood (ML) method, which was built using PhyML 3.2.2 [37] and implemented on Geneious R11.1.5 [38]. The PhyML uses a BioNJ tree as a starting tree, and tree topology search was set as the best from the nearest neighbor interchange (NNI) and subtree pruning and regrafting (SPR) methods. Robustness of reconstructed trees was estimated with 1000 non-parametric bootstrap replicates [39]. All COI sequences were aligned using the Multiple Sequence Comparison by Log-Expectation (MUSCLE) algorithm [40] in Geneious R11.1.5. The COI matrix was tested for nucleotide substitution saturation [41] with DAMBE6 [42] and showed no significant saturation. The best-fit nucleotide substitution model, the Generalized Time-Reversible Model (GTR), with invariable sites and Gamma shape parameter alpha (GTR + I + G) (p-inv = 0.57, α = 1.528), was evaluated using the Bayesian Information Criterion (BIC) and the Decision Theory (DT) with jModelTest2 on XSEDE [43,44] through the CIPRES Science Gateway v3.3 [45]. The PhyML tree was set as the initial tree of the Bayesian inference performed in BEAST v1.10.2 on XSEDE [46], adopting an unregulated relaxed lognormal clock [47] and the Yule speciation process [48,49] as priors. The posterior probability of parameters was estimated using Markov chain Monte Carlo (MCMC) with 300 million generations and 10% of burn-in. The model convergence, effective sample size (ESS), and 95% credible HPD (Highest Posterior Density) intervals were all calculated using TRACER, v1.7.1 [50]. The software TreeAnnotator v1.10.2 summarized the information of a sample of trees produced by BEAST onto a single Highest Log Clade Credibility Tree. For the phylogenetic tree construction, the generated sequences were coupled with the highest similarity score sequences downloaded from the Barcode Index Numbers (BINs) [51] (Appendix A), except for the species Rhinoptera bonasus, for which the sequences were obtained only from GenBank® because of the lack of a BIN. The American elephant fish, Callorhinchus callorynchus (FARG380-08) was defined as an outgroup.

3. Results

A total of 652 base pairs (bp) of COI barcode from 228 individuals were successfully sequenced and identified to the species level, and the results showed a high similarity (98.0–100.0%) to the COI sequences from the genetic databases, allowing the identification of four orders (Myliobatiformes, Rajiformes, Rhinopristiformes, Torpediniformes), seven families (Dasyatidae, Myliobatidae, Rhinopteridae, Gymnuridae, Arhynchobatidae, Rhinobatidae, Narcinidae), and at least 17 distinct batoid species (Table 1). The species Rhinoptera brasiliensis, Rioraja agassizii, Myliobatis freminvillei, and Gymnura altavela were the most represented, comprising 46.49% of the total samples. Among the identified samples, 44.3% belonged to species listed on the threat categories of the IUCN Red List, while 57.47% were protected in Brazil under Ordinance No. 445, dated 17 December 2014, issued by the Department of the Environment (MMA). In addition to the high proportion of threatened species, a total of 21.5% “data-deficient” (DD) batoid species were, for which the lack of biological information makes it impossible to properly evaluate their extinction risks (Table 1, Figure 2). Mobula thurstoni (3 specimens found) is listed in Appendix II of Convention on International Trade in Endangered Species (CITES) owning trade regulations besides being protected in Brazil. All the generated sequences were submitted to the GenBank® database under the accession numbers MK085522 to MK085749.
The Bayesian phylogenetic tree (Figure 3) was effective to separate all the identified sequence clusters from different species, since the topology of the phylogenetic tree, supported by high posterior credibility values, strengthened the sequence similarity-based identification, even for those that did not match at the lowest taxonomic level, such as Dasyatis sp. sequences, which accounted for 16.5% of the identified specimens (Table 1).

4. Discussion

The results demonstrate that the bycatch composition of batoid species in the central–southwest Atlantic consists of several protected species in Brazil, and also globally threatened species. According to the IUCN Red List, most of the identified species are classified as “data deficient” (DD), followed by “vulnerable” (VU) and “endangered” (EN) species (Figure 2). In addition, according to the Brazilian Red List, the majority of the identified species are classified as “critically endangered” CR and EN (Figure 2), and there is even a species, Mobula thurstoni, listed in Appendix II of CITES, which includes species that are not necessarily threatened with extinction, but whose trade must be regulated in order to avoid unsustainable exploration. Besides CITES regulations, mobulids have been reported worldwide as bycatch in several small- and large-scale fisheries [52], and have been previously reported as bycatch in the southwestern Atlantic Ocean [53]. In addition, artisanal fishing can also have impacts on the population levels. Reference [54] attributed an 88% decline in the Mozambique population of M. alfredi between 2003 and 2011 mostly to artisanal fishing.
In general, high-seas fisheries present more detailed and reliable elasmobranch bycatch data than coastal fisheries, probably because coastal fisheries are more diverse and complex [55].
According to the monitoring program for fishing activity of the state of São Paulo, during the study period, elasmobranch catches totalized 1,952,625.39 tons and showed an evident decrease in productivity over the years. If we consider only the sampled fisheries, which accounted for 69.59% of elasmobranch captures in the whole state, they consist of gillnets (42.82%), followed by otter-trawl (36.34%), beam-trawl (20.01%), and fish-traps (0.83%), (Appendix A). The development of a precise catch-data information system for fisheries that recognizes the peculiarities of this sector takes a huge effort. One of the main reasons for the lack of reliable and standardized fisheries data is related to the large variety of fishing gear, target species, and landing sites, which end up biasing catch-data sampling methods [56]. In addition, fishery catch trends often lack species-specific data, and in most cases, discards are neither recorded nor reported [57]. Such a situation has led to local extinctions of skates due to trawling, as occurred, for example, in the Irish Sea [58] and northwest Atlantic [59]. The impact of fisheries on biodiversity highlights the need to assess not only the conservation status of target species, but also of bycatch species, in particular for batoids discarded in coastal trawl fisheries. A high proportion of batoid bycatch, which fluctuated seasonally between 44.5% and 67.5% of the total trawlers’ capture biomass, was documented in Argentina [60], which is also located in the southwest Atlantic.
Bycatch research has traditionally evaluated large-scale fisheries, neglecting the potentially harmful effects of small-scale and artisanal fisheries on threatened species [61]. Nevertheless, it is of the utmost importance to encourage effective bycatch mitigation strategies for artisanal and small-scale fisheries, which account for the vast majority of the fishing workforce worldwide and mainly operate in coastal and continental shelf regions, which feature high productivity and aggregate high levels of marine biodiversity [61,62,63]. Some of the identified batoid species are widely distributed in the Atlantic, although most of them are endemic to the south–southwest Atlantic. According to Reference [64], restricted-range endemic species are particularly vulnerable, and, for this reason, conservation efforts must prioritize the identification of biodiversity hotspots based on species richness and endemism degree [65,66]. The southwest Atlantic is one of the most important and recognized global hotspots of elasmobranch species richness, functional diversity, and endemicity [4,67] and, as such, researchers, authorities, policy makers, and fisheries managers must prepare conservational plans focusing efforts and resources to preserve its biodiversity and mitigate the harmful effects of unsustainable fishing activity, such as bycatch. For instance, Pseudobatos horkelli, an endemic Brazilian guitarfish, is currently classified as CR by the IUCN Red List, and suffered a severe population decline of more than 80% due to intense anthropogenic pressures [68]. Another endemic skate, Atlantoraja castenauai, also suffered a massive population decline of about 75% [69]. On top of that, another endemic ray, the Brazilian cownose ray, Rhinoptera brasiliensis, was the most commonly identified species, accounting for 17.43% of total sampling. In fact, this species forms large groups and is susceptible to trawlers and gillnets that capture a large number of individuals, and, due to its life history, this ray is vulnerable to recruitment overfishing [70]. The same threats have already been observed in two endemic coastal sharks, the daggernose shark, Isogomphodon oxyrhynchus, from northern Brazil, and the spiny angel shark, Squatina guggenheim, from southern Brazil. Both species showed severe population declines, up to at least 90% and 85%, respectively, due to anthropogenic and fisheries threats similar to those described above [71,72,73]. This troubling scenario demonstrates the urgent need for improvements in Brazilian fisheries management in relation to Chondrichthyes, as observed by Reference [74].
This unsustainable fisheries situation is likely to stay unchanged or even escalate as unrestricted fishing continues without proper regulation, increasing the imminent risk of extinction for these species [69,70,72]. Although Brazilian law prohibits the capture, commercialization, and trade of many elasmobranch species, they are still illegally captured, landed, and traded [26,28].
Currently, 41.74% of the IUCN-listed elasmobranch species are classified as DD [5]. The lack of biological data is higher in chondrichthyans than in other evaluated vertebrate groups due to taxonomic uncertainties, incomplete range distributions, and biased population assessments. Our results showed that almost 22.47% of identified batoid species were classified as DD. These uncertainties can considerably influence the understanding of threats to these species and their risk patterns [75]. As a consequence, species potentially threatened could be currently neglected by conservation programs. Therefore, knowing the species’ actual conservation status is crucial for the implementation of proper biodiversity conservation efforts [76].
According to our results, 16.5% of samples did not match at the lowest taxonomic level, but only at the genus level, Dasyatis. This may happen if a species has not been properly deposited in genetic databases, or in the case of a non-formally described species or even an unknown species. However, the topology of the Bayesian phylogenetic tree highlights the clustering of the sequences identified as Dasyatis sp. on a separate clade, showing that individuals may belong to a different species but not to the other closely related identified species. This example has shown the importance of coupling the two methodological approaches used for species assignment in our study, sequence-similarity-based-identification and phylogenetic-tree-based-identification, since the Bayesian inference strengthened and conferred robustness upon the species identification, even in those cases where species-specific identification could not match with the lowest taxonomic level. Nevertheless, several batoid groups require taxonomic and nomenclature revisions in BOLD and GenBank® databases. This is a critical problem, since the names assigned to the sequences need to be continuously updated, and there are still sequences identified only at the genus or family level, making them non-informative for molecular identification purposes [77]. The level of the batoids’ taxonomic uncertainties was highlighted by Reference [78], and recently, the taxonomy of the Dasyatidae family was reviewed by Reference [79] through morphological and molecular approaches.
The impossibility of properly identifying different captured species results in incomplete, unreliable, and underestimated fisheries catch statistics, which makes it difficult to manage fisheries’ activity in a sustainable way [80]. Neglecting small-scale fisheries worldwide results in misleading statistics reported annually by FAO members, which omit and/or underestimate statistical fisheries catch-data, such as discards and IUU fisheries [81]. Reference [7] concluded that global catches reported to FAO between 1950 and 2010 were actually 50% higher than reported, and catches also declined more intensively. Data on the identification and quantification of each of the captured species are the most basic information for effective fisheries management. Nevertheless, this information is unavailable in many regions worldwide, which makes the situation even worse because the absence of adequate identification can generate non-effective management measures, as observed in Australia [82], where it was demonstrated that “at-vessel mortality” of sharks and rays in the same type of fishing gear can largely vary among species. In many countries of the southwest Atlantic, such as Brazil, the collection system of statistical fishery data has fallen apart, meaning that currently there is no national standardized data system; in fact, the reconstructed Brazilian catches were 1.8 times larger than previously reported landings [83]. Minimizing fisheries bycatch is a global environmental challenge [84,85]. Although fisheries scientists, managers, and industry have made substantial progress in improving fisheries management in data-poor fisheries [86], and also mitigating interactions and/or reducing bycatch with particular focus on endangered, threatened, and protected species, they continually aim to improve the performance of bycatch mitigation strategies while maintaining sustainable commercial harvest levels [84,87,88].
In the last few years, several studies in Brazil have developed and implemented molecular markers to identified elasmobranchs [25,26,89,90]. However, overall, a few studies have been focused on batoids [28,77,91]. Such findings highlight the necessity to implement DNA-based approaches to improve fisheries species-specific catch-data, and also for trading surveillance purposes. Thus, DNA barcoding has emerged as a widely accepted tool for species identification, due to its improved focus on data standardization and validation [92]. To conclude, our results show the bycatch batoid species composition in the southwest Atlantic, which consist of some species under protection by national and international laws. In order to attenuate fishery impacts over biodiversity, managers should monitor and report catches at the species level, prohibit trade and landings of threatened and protected species, and manage bycatch to minimize mortality of non-target species with the adoption of new technologies aiming to mitigate bycatch [93,94,95]. Crucial to this process is the implementation of an accurate and standardized DNA-based species identification method, such as DNA barcoding, to improve and promote the sustainability of biodiversity, as well as to support the productivity of the fishery activity.

Author Contributions

Conceptualization, B.L.d.S.F. and F.F.M.; Data curation, B.L.d.S.F., M.M.R. and F.F.M.; Formal analysis, B.L.d.S.F., R.R.D. and F.F.M.; Funding acquisition, R.R.D., M.M.R., C.O., F.F. and F.F.M.; Investigation, B.L.d.S.F., M.M.R., M.P.M., I.V.B. and J.B.D.B.; Methodology, B.L.d.S.F. and R.R.D.; Project administration, F.F.M.; Resources, M.M.R., C.O., F.F. and F.F.M.; Software, B.L.d.S.F.; Supervision, F.F.M.; Validation, B.L.d.S.F., R.R.D. and F.F.M.; Visualization, B.L.d.S.F. and R.R.D.; Writing—original draft, B.L.d.S.F., R.R.D., M.M.R., M.P.M., I.V.B., J.B.D.B. and F.F.M.; Writing—review & editing, B.L.d.S.F., R.R.D., M.M.R., C.O., F.F. and F.F.M.

Funding

Funding was provided by the São Paulo Research Foundation (FAPESP Nos #2011/23787-0; #2017/02420-8), the Coordination for the Improvement of Higher Education Personnel (CAPES) and the Brazilian National Council for Scientific and Technological Development (CNPq) to Bruno Lopes da Silva Ferrette and Juliana Beltramin De Biasi to support their PhD scholarships granted by the Postgraduate Program for Biological Sciences (Genetics) of the Biological Institute from Botucatu of the São Paulo State University (UNESP).

Acknowledgments

A special acknowledgment for all the small-scale and artisanal fishermen that provide the sampled bycatch individuals. Without their trust and support, the main objective could not be achieved.

Conflicts of Interest

The authors declare no conflict of interest.

Appendix A

Table A1. GenBank sequences utilized for the construction of the phylogenetic tree with barcode index numbers (BINs) of the identified species.
SpeciesGenBank Access Number
Atlantoraja castelnauiGU805239
Atlantoraja castelnauiGU805231
Atlantoraja castelnauiJX124737
Atlantoraja castelnauiJQ365232
Hypanus americanusKJ719465
Hypanus americanusKT075327
Hypanus americanusKF461168
Bathytoshia centrouraKT075311
Bathytoshia centrouraKJ719464
Bathytoshia centrouraKF808191
Hypanus guttatusJX034000
Hypanus guttatusKJ719467
Dasyatis sp.JX124776
Gymnura altavelaKC015432
Gymnura altavelaBIM344-13
Gymnura altavelaBIM365-13
Gymnura altavelaKF808207
Myliobatis freminvilleiKT075326
Myliobatis freminvilleiKF930155
Myliobatis goodeiJQ305804
Myliobatis goodeiJQ305809
Myliobatis goodeiJQ305807
Myliobatis goodeiJQ305806
Narcine brasiliensisJQ365452
Narcine brasiliensisJX124815
Narcine brasiliensisJX034007
Narcine brasiliensisKF930170
Pteroplatytrygon violaceaKT307373
Pteroplatytrygon violaceaKT307370
Pteroplatytrygon violaceaKF930342
Pteroplatytrygon violaceaKF808209
Pseudobatos horkeliiJX034017
Pseudobatos horkeliiHM424136
Pseudobatos horkeliiJX034016
Pseudobatos horkeliiJX124879
Rhinoptera bonasusJX241049
Rhinoptera bonasusJX241050
Rhinoptera bonasusJX241051
Rhinoptera bonasusKF245598
Rhinoptera brasiliensisJX124888
Rioraja agassiziiGU805208
Rioraja agassiziiGU805206
Rioraja agassiziiGU805204
Rioraja agassiziiGU805205
Squatina guggenheimFN431749
Squatina guggenheimFN431748
Squatina guggenheimFN431747
Squatina guggenheimFN431746
Callorhinchus callorynchusKP719792
Callorhinchus callorynchusKP719793
Callorhinchus callorynchusKP719794
Callorhinchus callorynchusKP719799
Table A2. Quantity of tons of elasmobranchs captured in the state of São Paulo, Brazil from 2012 to 2018 from the Monitoring Program for the Fishing Activity of São Paulo state (http://www.propesq.pesca.sp.gov.br/). Bottom line: the percentage of total captured by year. Final row: the percentage of total capture by fishing gear.
Fishing Gear2012201320142015201620172018Total%
otter-trawl135,026.098,975.881,566.882,897.146,071.420,935.428,360.7493,833.036.34
fish-traps1765.742457.951891.0804.2970.351069.92384.9611,344.10.83
gillnet112,890.085,540.370,005.757,010.391,245.776,519.188,560.2581,771.042.82
beam-trawl117,079.046,060.027,992.028,194.024,294.017,703.010,516.0271,838.020.01
Total366,761.0233,034.0181,456.0168,906.0162,581.0116,227.0129,822.01,358,786.0100.00
%26.9917.1513.3512.4311.978.559.55100.00

References

  1. Last, P.; Naylor, G.; Séret, B.; White, W.; de Carvalho, M.; Stehmann, M. Rays of the World, 1st ed.; CSIRO Publishing: Clayton, Australia, 2016; p. 800. [Google Scholar]
  2. Weigmann, S. Annotated checklist of the living sharks, batoids and chimaeras (Chondrichthyes) of the world, with a focus on biogeographical diversity. J. Fish Biol. 2016, 88, 837–1037. [Google Scholar] [CrossRef] [PubMed] [Green Version]
  3. Oliver, S.; Braccini, M.; Newman, S.J.; Harvey, E.S. Global patterns in the bycatch of sharks and rays. Mar. Policy 2015, 54, 86–97. [Google Scholar] [CrossRef]
  4. Dulvy, N.K.; Fowler, S.L.; Musick, J.A.; Cavanagh, R.D.; Kyne, P.M.; Harrison, L.R.; Carlson, J.K.; Davidson, L.N.; Fordham, S.V.; Francis, M.P.; et al. Extinction risk and conservation of the world’s sharks and rays. elife 2014, 3, e00590. [Google Scholar] [CrossRef] [PubMed]
  5. The IUCN Red List of Threatened Species. Version 2018-2. Available online: http://www.iucnredlist.org (accessed on 25 February 2019).
  6. FAO Fisheries and Aquaculture Department, Food and Agriculture Organization of the United Nations. Capture Fisheries. Available online: http://www.fao.org/fishery/ (accessed on 25 February 2019).
  7. Pauly, D.; Zeller, D. Catch reconstructions reveal that global marine fisheries catches are higher than reported and declining. Nat. Commun. 2016, 7, 10244. [Google Scholar] [CrossRef] [PubMed] [Green Version]
  8. Hall, M.A. On bycatches. Rev. Fish Biol. Fish. 1996, 6, 319–352. [Google Scholar] [CrossRef]
  9. Gray, C.A.; Kennelly, S.J. Bycatches of endangered, threatened and protected species in marine fisheries. Rev. Fish Biol. Fish. 2018, 28, 521–541. [Google Scholar] [CrossRef]
  10. Bellido, J.M.; Santos, M.B.; Pennino, M.G.; Valeiras, X.; Pierce, G.J. Fishery discards and bycatch: Solutions for an ecosystem approach to fisheries management? Hydrobiologia 2011, 670, 317. [Google Scholar] [CrossRef]
  11. Johnsen, J.P.; Eliasen, S. Solving complex fisheries management problems: What the EU can learn from the Nordic experiences of reduction of discards. Mar. Policy 2011, 35, 130–139. [Google Scholar] [CrossRef]
  12. Dulvy, N.K.; Baum, J.K.; Clarke, S.; Compagno, L.J.V.; Cortés, E.; Domingo, A.; Fordham, S.; Fowler, S.; Francis, M.P.; Gibson, C.; et al. You can swim but you can’t hide: The global status and conservation of oceanic pelagic sharks and rays. Aquat. Conserv. 2008, 18, 459–482. [Google Scholar] [CrossRef]
  13. Davies, R.W.; Cripps, S.J.; Nickson, A.; Porter, G. Defining and estimating global marine fisheries bycatch. Mar. Policy 2009, 33, 661–672. [Google Scholar] [CrossRef]
  14. Stevens, J.D.; Bonfil, R.; Dulvy, N.K.; Walker, P.A. The effects of fishing on sharks, rays, and chimaeras (chondrichthyans), and the implications for marine ecosystems. ICES J. Mar. Sci. 2000, 57, 476–494. [Google Scholar] [CrossRef] [Green Version]
  15. Zeller, D.; Cashion, T.; Palomares, M.; Pauly, D. Global marine fisheries discards: A synthesis of reconstructed data. Fish Fish. 2018, 19, 30–39. [Google Scholar] [CrossRef]
  16. Stobutzki, I.C.; Miller, M.J.; Heales, D.S.; Brewer, D.T. Sustainability of elasmobranchs caught as bycatch in a tropical prawn (shrimp) trawl fishery. Fish. Bull. 2002, 100, 800–821. [Google Scholar]
  17. Bornatowski, H.; Braga, R.R.; Vitule, J.R. Threats to sharks in a developing country: The need for effective simple conservation measures. Nat. Conserv. 2014, 12, 11–18. [Google Scholar] [CrossRef] [Green Version]
  18. Bornatowski, H.; Braga, R.R.; Vitule, J.R. Shark mislabeling threatens biodiversity. Science 2013, 340, 923. [Google Scholar] [CrossRef]
  19. Hebert, P.D.; Cywinska, A.; Ball, S.L.; Dewaard, J.R. Biological identifications through DNA barcodes. Proc.-R. Soc. Lond. Biol. Sci. 2003, 270, 313–321. [Google Scholar] [CrossRef] [PubMed]
  20. Wetterstrand, K.A. DNA Sequencing Costs: Data from the NHGRI Genome Sequencing Program (GSP). Available online: http://www.genome.gov/sequencingcostsdata (accessed on 25 February 2019).
  21. Dudgeon, C.L.; Blower, D.C.; Broderick, D.; Giles, J.L.; Holmes, B.J.; Kashiwagi, T.; Krück, N.C.; Morgan, J.A.; Tillett, B.J.; Ovenden, J.R. A review of the application of molecular genetics for fisheries management and conservation of sharks and rays. J. Fish Biol. 2012, 80, 1789–1843. [Google Scholar] [CrossRef] [PubMed]
  22. Shivji, M.; Clarke, S.; Pank, M.; Natanson, L.; Kohler, N.; Stanhope, M. Genetic identification of pelagic shark body parts for conservation and trade monitoring. Conserv. Biol. 2002, 16, 1036–1047. [Google Scholar] [CrossRef]
  23. Clarke, S.C.; Magnussen, J.E.; Abercrombie, D.L.; McAllister, M.K.; Shivji, M.S. Identification of shark species composition and proportion in the Hong Kong shark fin market based on molecular genetics and trade records. Conserv. Biol. 2006, 20, 201–211. [Google Scholar] [CrossRef]
  24. Clarke, S.C.; McAllister, M.K.; Milner-Gulland, E.J.; Kirkwood, G.P.; Michielsens, C.G.; Agnew, D.J.; Pikitch, E.K.; Nakano, H.; Shivji, M.S. Global estimates of shark catches using trade records from commercial markets. Ecol. Lett. 2006, 9, 1115–1126. [Google Scholar] [CrossRef]
  25. Mendonça, F.F.; Hashimoto, D.T.; Porto-Foresti, F.; Oliveira, C.; Gadig, O.B.; Foresti, F. Identification of the shark species Rhizoprionodon lalandii and R. porosus (Elasmobranchii, Carcharhinidae) by multiplex PCR and PCR-RFLP techniques. Mol. Ecol. Resour. 2009, 9, 771–773. [Google Scholar] [CrossRef] [PubMed]
  26. Bunholi, I.V.; Ferrette, B.L.S.; De Biasi, J.B.; Magalhães, C.O.; Rotundo, M.M.; Oliveira, C.; Foresti, F.; Mendonça, F.F. The fishing and illegal trade of the angelshark: DNA barcoding against misleading identifications. Fish. Res. 2018, 206, 193–197. [Google Scholar] [CrossRef]
  27. Fields, A.T.; Fischer, G.A.; Shea, S.K.; Zhang, H.; Abercrombie, D.L.; Feldheim, K.A.; Babcock, E.A.; Chapman, D.D. Species composition of the international shark fin trade assessed through a retail-market survey in Hong Kong. Conserv. Biol. 2018, 32, 376–389. [Google Scholar] [CrossRef]
  28. De-Franco, B.A.; Mendonça, F.F.; Oliveira, C.; Foresti, F. Illegal trade of the guitarfish Rhinobatos horkelii on the coasts of central and southern Brazil: Genetic identification to aid conservation. Aquat. Conserv. 2012, 22, 272–276. [Google Scholar] [CrossRef]
  29. Flowers, K.I.; Ajemian, M.J.; Bassos-Hull, K.; Feldheim, K.A.; Hueter, R.E.; Papastamatiou, Y.P.; Chapman, D.D. A review of batoid philopatry, with implications for future research and population management. Mar. Ecol. Prog. Ser. 2016, 562, 251–261. [Google Scholar] [CrossRef]
  30. Domingues, R.R.; Hilsdorf, A.W.; Gadig, O.B. The importance of considering genetic diversity in shark and ray conservation policies. Conserv. Genet. 2018, 19, 501–525. [Google Scholar] [CrossRef]
  31. Ward, R.D.; Zemlak, T.S.; Innes, B.H.; Last, P.R.; Hebert, P.D. DNA barcoding Australia’s fish species. Proc.-R. Soc. Lond. Biol. Sci. 2005, 360, 1847–1857. [Google Scholar] [CrossRef]
  32. Van Velzen, R.; Weitschek, E.; Felici, G.; Bakker, F.T. DNA barcoding of recently diverged species: Relative performance of matching methods. PLoS ONE 2012, 7, e30490. [Google Scholar] [CrossRef]
  33. Ratnasingham, S.; Hebert, P.D. BOLD: The Barcode of Life Data System. Mol. Ecol. Notes 2007, 7, 355–364. [Google Scholar] [CrossRef]
  34. Sayers, E.W.; Cavanaugh, M.; Clark, K.; Ostell, J.; Pruitt, K.D.; Karsch-Mizrachi, I. GenBank. Nucleic Acids Res. 2018, 47, 94–99. [Google Scholar] [CrossRef]
  35. Altschul, S.F.; Gish, W.; Miller, W.; Myers, E.W.; Lipman, D.J. Basic local alignment search tool. J. Mol. Biol. 1990, 215, 403–410. [Google Scholar] [CrossRef]
  36. Ronquist, F.; Huelsenbeck, J.P. MrBayes 3: Bayesian phylogenetic inference under mixed models. Bioinformatics 2003, 19, 1572–1574. [Google Scholar] [CrossRef] [PubMed] [Green Version]
  37. Guindon, S.; Dufayard, J.F.; Lefort, V.; Anisimova, M.; Hordijk, W.; Gascuel, O. New algorithms and methods to estimate maximum-likelihood phylogenies: Assessing the performance of PhyML 3.0. Syst. Biol. 2010, 59, 307–321. [Google Scholar] [CrossRef] [PubMed]
  38. Kearse, M.; Moir, R.; Wilson, A.; Stones-Havas, S.; Cheung, M.; Sturrock, S.; Buxton, S.; Cooper, A.; Markowitz, S.; Duran, C.; et al. Geneious Basic: An integrated and extendable desktop software platform for the organization and analysis of sequence data. Bioinformatics 2012, 28, 1647–1649. [Google Scholar] [CrossRef] [PubMed] [Green Version]
  39. Anisimova, M.; Gascuel, O. Approximate likelihood-ratio test for branches: A fast, accurate, and powerful alternative. Syst. Biol. 2006, 55, 539–552. [Google Scholar] [CrossRef] [PubMed]
  40. Edgar, R.C. MUSCLE: Multiple sequence alignment with high accuracy and high throughput. Nucleic Acids Res. 2004, 32, 1792–1797. [Google Scholar] [CrossRef] [PubMed]
  41. Xia, X.; Xie, Z.; Salemi, M.; Chen, L.; Wang, Y. An index of substitution saturation and its application. Mol. Phylogenet. Evol. 2003, 26, 1–7. [Google Scholar] [CrossRef]
  42. Xia, X. DAMBE6: New tools for microbial genomics, phylogenetics, and molecular evolution. J. Hered. 2017, 108, 431–437. [Google Scholar] [CrossRef]
  43. Darriba, D.; Taboada, G.L.; Doallo, R.; Posada, D. jModelTest 2: More models, new heuristics and parallel computing. Nat. Methods 2012, 9, 772. [Google Scholar] [CrossRef]
  44. Towns, J.; Cockerill, T.; Dahan, M.; Foster, I.; Gaither, K.; Grimshaw, A.; Hazlewood, V.; Lathrop, S.; Lifka, D.; Peterson, G.D.; et al. XSEDE: Accelerating scientific discovery. Comput. Sci. Eng. 2014, 16, 62–74. [Google Scholar] [CrossRef]
  45. Miller, M.A.; Pfeiffer, W.; Schwartz, T. Creating the CIPRES Science Gateway for inference of large phylogenetic trees. In 2010 Gateway Computing Environments Workshop (GCE); IEEE: Piscataway, NJ, USA, 2010; pp. 1–8. [Google Scholar]
  46. Suchard, M.A.; Lemey, P.; Baele, G.; Ayres, D.L.; Drummond, A.J.; Rambaut, A. Bayesian phylogenetic and phylodynamic data integration using BEAST 1.10. Virus Evol. 2018, 4, vey016. [Google Scholar] [CrossRef] [PubMed]
  47. Drummond, A.J.; Ho, S.Y.; Phillips, M.J.; Rambaut, A. Relaxed phylogenetics and dating with confidence. PLoS Biol. 2006, 4, e88. [Google Scholar] [CrossRef]
  48. Gernhard, T.; Hartmann, K.; Steel, M. Stochastic properties of generalised Yule models, with biodiversity applications. J. Math. Biol. 2008, 57, 713–735. [Google Scholar] [CrossRef]
  49. Yule, G.U. A mathematical theory of evolution, based on the conclusions of Dr. J.C. Willis, F.R.S. Proc.-R. Soc. Lond. Biol. Sci. 1925, 213, 21–87. [Google Scholar] [CrossRef]
  50. Rambaut, A.; Drummond, A.J.; Xie, D.; Baele, G.; Suchard, M.A. Posterior summarization in Bayesian phylogenetics using Tracer 1.7. Syst. Biol. 2018, 67, 901–904. [Google Scholar] [CrossRef]
  51. Ratnasingham, S.; Hebert, P.D. A DNA-based registry for all animal species: The Barcode Index Number (BIN) system. PLoS ONE 2013, 8, e66213. [Google Scholar] [CrossRef]
  52. Croll, D.A.; Dewar, H.; Dulvy, N.K.; Fernando, D.; Francis, M.P.; Galván-Magaña, F.; Hall, M.; Heinrichs, S.; Marshall, A.; Mccauley, D.; et al. Vulnerabilities and fisheries impacts: The uncertain future of manta and devil rays. Aquat. Conserv. 2016, 26, 562–575. [Google Scholar] [CrossRef]
  53. Mas, F.; Forselledo, R.; Domingo, A. Mobulid ray by-catch in longline fisheries in the south-western Atlantic Ocean. Mar. Freshw. Res. 2015, 66, 767–777. [Google Scholar] [CrossRef]
  54. Rohner, C.A.; Pierce, S.J.; Marshall, A.D.; Weeks, S.J.; Bennett, M.B.; Richardson, A.J. Trends in sightings and environmental influences on a coastal aggregation of manta rays and whale sharks. Mar. Ecol. Prog. Ser. 2013, 482, 153–168. [Google Scholar] [CrossRef] [Green Version]
  55. Bonfil, R.; Munro, G.; Valtysson, H.T.; Wright, M.; Preikshot, D.; Haggan, N.; Pauly, D.; Sumaila, U.R.; Pitcher, T.J. Distant Water Fleets: An Ecological, Economic and Social Assessment; Fisheries Centre, University of British Columbia: Vancouver, BC, Canada, 1998; p. 122. [Google Scholar]
  56. Chuenpagdee, R.; Rocklin, D.; Bishop, D.; Hynes, M.; Greene, R.; Lorenzi, M.R.; Devillers, R. The global information system on small-scale fisheries (ISSF): A crowdsourced knowledge platform. Mar. Policy 2017, 101, 158–166. [Google Scholar] [CrossRef]
  57. Dulvy, N.K.; Metcalfe, J.D.; Glanville, J.; Pawson, M.G.; Reynolds, J.D. Fishery stability, local extinctions, and shifts in community structure in skates. Conserv. Biol. 2000, 14, 283–293. [Google Scholar] [CrossRef]
  58. Brander, K. Disappearance of common skate, Raia batis, from the Irish Sea. Nature 1981, 290, 48–49. [Google Scholar] [CrossRef]
  59. Casey, J.M.; Myers, R.A. Near extinction of a large, widely distributed fish. Science 1998, 281, 690–692. [Google Scholar] [CrossRef]
  60. Tamini, L.L.; Chiaramonte, G.E.; Perez, J.E.; Cappozzo, H.L. Batoids in a coastal trawl fishery of Argentina. Fish. Res. 2006, 77, 326–332. [Google Scholar] [CrossRef]
  61. Žydelis, R.; Wallace, B.P.; Gilman, E.L.; Werner, T.B. Conservation of marine megafauna through minimization of fisheries bycatch. Conserv. Biol. 2009, 23, 608–616. [Google Scholar] [CrossRef]
  62. Shester, G.G.; Micheli, F. Conservation challenges for small-scale fisheries: Bycatch and habitat impacts of traps and gillnets. Biol. Conserv. 2011, 144, 1673–1681. [Google Scholar] [CrossRef]
  63. Senko, J.; White, E.R.; Heppell, S.S.; Gerber, L.R. Comparing bycatch mitigation strategies for vulnerable marine megafauna. Anim. Conserv. 2014, 17, 5–18. [Google Scholar] [CrossRef]
  64. Thomas, C.D.; Cameron, A.; Green, R.E.; Bakkenes, M.; Beaumont, L.J.; Collingham, Y.C.; Erasmus, B.F.; De Siqueira, M.F.; Grainger, A.; Hannah, L.; et al. Extinction risk from climate change. Nature 2004, 427, 145–148. [Google Scholar] [CrossRef] [Green Version]
  65. Myers, N.; Mittermeier, R.A.; Mittermeier, C.G.; Da Fonseca, G.A.; Kent, J. Biodiversity hotspots for conservation priorities. Nature 2000, 403, 853–858. [Google Scholar] [CrossRef]
  66. Olson, D.M.; Dinerstein, E. The Global 200: Priority ecoregions for global conservation. Ann. Mo. Bot. Gard. 2002, 89, 199–224. [Google Scholar] [CrossRef]
  67. Lucifora, L.O.; García, V.B.; Worm, B. Global diversity hotspots and conservation priorities for sharks. PLoS ONE 2011, 6, e19356. [Google Scholar] [CrossRef]
  68. Lessa, R.; Vooren, C.M. Pseudobatos horkelii. IUCN Red List Threatened Species. 2016. Available online: http://dx.doi.org/10.2305/IUCN.UK.2016-3.RLTS.T41064A103933918.en (accessed on 25 February 2019).
  69. Hozbor, N.; Massa, A.; Vooren, C.M. Atlantoraja castelnaui. IUCN Red List Threatened Species. 2004. Available online: http://dx.doi.org/10.2305/IUCN.UK.2004.RLTS.T44575A10921544.en (accessed on 25 February 2019).
  70. Vooren, C.M.; Lamónaca, A.F. Rhinoptera brasiliensis. IUCN Red List Threatened Species. 2004. Available online: http://dx.doi.org/10.2305/IUCN.UK.2004.RLTS.T44595A10912274.en (accessed on 25 February 2019).
  71. Lessa, R.; Charvet-Almeida, P.; Santana, F.M.; Almeida, Z. Isogomphodon oxyrhynchus. IUCN Red List Threatened Species. 2006. Available online: http://dx.doi.org/10.2305/IUCN.UK.2006.RLTS.T60218A12323498.en (accessed on 25 February 2019).
  72. Lessa, R.; Batista, V.S.; Santana, F.M. Close to extinction? The collapse of the endemic daggernose shark (Isogomphodon oxyrhynchus) off Brazil. Glob. Ecol. Conserv. 2016, 7, 70–81. [Google Scholar] [CrossRef]
  73. Chiaramonte, G.; Vooren, C.M. Squatina guggenheim. IUCN Red List Threat. Species. 2007. Available online: http://dx.doi.org/10.2305/IUCN.UK.2007.RLTS.T39330A10202558.en (accessed on 25 February 2019).
  74. Dulvy, N.K.; Simpfendorfer, C.A.; Davidson, L.N.; Fordham, S.V.; Bräutigam, A.; Sant, G.; Welch, D.J. Challenges and priorities in shark and ray conservation. Curr. Biol. 2017, 27, 565–572. [Google Scholar] [CrossRef]
  75. Butchart, S.H.; Bird, J.P. Data deficient birds on the IUCN Red List: What don’t we know and why does it matter? Biol. Conserv. 2010, 143, 239–247. [Google Scholar] [CrossRef]
  76. Bland, L.M.; Collen, B.E.; Orme, C.D.; Bielby, J.O. Predicting the conservation status of data-deficient species. Conserv. Biol. 2015, 29, 250–259. [Google Scholar] [CrossRef]
  77. Cerutti-Pereyra, F.; Meekan, M.G.; Wei, N.W.; O’Shea, O.; Bradshaw, C.J.; Austin, C.M. Identification of rays through DNA barcoding: An application for ecologists. PLoS ONE 2012, 7, e36479. [Google Scholar] [CrossRef]
  78. Last, P.R.; Stevens, J.D. Sharks and Rays of Australia; CSIRO: Canberra, Australia, 1994; p. 84. [Google Scholar]
  79. Last, P.R.; Naylor, G.J.; Manjaji-Matsumoto, B.M. A revised classification of the family Dasyatidae (Chondrichthyes: Myliobatiformes) based on new morphological and molecular insights. Zootaxa 2016, 4139, 345–368. [Google Scholar] [CrossRef]
  80. Holmes, B.H.; Steinke, D.; Ward, R.D. Identification of shark and ray fins using DNA barcoding. Fish. Res. 2009, 95, 280–288. [Google Scholar] [CrossRef]
  81. Zeller, D.; Harper, S.; Zylich, K.; Pauly, D. Synthesis of underreported small-scale fisheries catch in Pacific island waters. Coral Reefs 2015, 34, 25–39. [Google Scholar] [CrossRef]
  82. Braccini, J.M.; Waltrick, D. Species-specific at-vessel mortality of sharks and rays captured by demersal longlines. Mar. Policy 2019, 99, 94–98. [Google Scholar] [CrossRef]
  83. Freire, K.M.F.; Aragão, J.A.N.; Araújo, A.R.R.; Ávila-da-Silva, A.O.; Bispo, M.C.S.; Canziani, G.V.; Carneiro, M.H.; Gonçalves, F.D.S.; Keunecke, K.A.; Mendonça, J.T.; et al. Reconstruction of catch statistics for Brazilian marine waters (1950–2010). Fisheries catch reconstructions for Brazil’s mainland and oceanic islands. Fish. Cent. Res. 2015, 23, 3–30. [Google Scholar]
  84. Hall, S.J.; Mainprize, B.M. Managing by-catch and discards: How much progress are we making and how can we do better? Fish Fish. 2005, 6, 134–155. [Google Scholar] [CrossRef]
  85. Lewison, R.L.; Soykan, C.U.; Cox, T.; Peckham, H.; Pilcher, N.; LeBoeuf, N.; McDonald, S.; Moore, J.; Safina, C.; Crowder, L.B. Ingredients for addressing the challenges of fisheries bycatch. Bull. Mar. Sci. 2011, 87, 235–250. [Google Scholar] [CrossRef]
  86. Bradshaw, C.J.; Prowse, T.A.; Drew, M.; Gillanders, B.M.; Donnellan, S.C.; Huveneers, C.; Kuparinen, A. Predicting sustainable shark harvests when stock assessments are lacking. ICES J. Mar. Sci. 2018, 75, 1591–1601. [Google Scholar] [CrossRef]
  87. Cox, T.M.; Lewison, R.L.; Žydelis, R.; Crowder, L.B.; Safina, C.; Read, A.J. Comparing effectiveness of experimental and implemented bycatch reduction measures: The ideal and the real. Conserv. Biol. 2007, 21, 1155–1164. [Google Scholar] [CrossRef] [PubMed]
  88. O’keefe, C.E.; Cadrin, S.X.; Stokesbury, K.D. Evaluating effectiveness of time/area closures, quotas/caps, and fleet communications to reduce fisheries bycatch. ICES J. Mar. Sci. 2013, 71, 1286–1297. [Google Scholar] [CrossRef] [Green Version]
  89. Domingues, R.D.; Amorim, A.F.; Hilsdorf, A.W. Genetic identification of Carcharhinus sharks from the southwest Atlantic Ocean (Chondrichthyes: Carcharhiniformes). J. Appl. Ichthyol. 2013, 29, 738–742. [Google Scholar] [CrossRef]
  90. Mendonça, F.F.; Hashimoto, D.T.; De-Franco, B.A.; Porto-Foresti, F.; Gadig, O.B.; Oliveira, C.; Foresti, F. Genetic identification of lamniform and carcharhiniform sharks using multiplex-PCR. Conserv. Genet. Resour. 2010, 2, 31–35. [Google Scholar] [CrossRef]
  91. Palmeira, C.A.; Rodrigues-Filho, L.F.S.; Sales, J.B.S.; Vallinoto, M.; Schneider, H.; Sampaio, I. Commercialization of a critically endangered species (largetooth sawfish, Pristis perotteti) in fish markets of northern Brazil: Authenticity by DNA analysis. Food Control 2013, 34, 249–252. [Google Scholar] [CrossRef]
  92. Teletchea, F. After 7 years and 1000 citations: Comparative assessment of the DNA barcoding and the DNA taxonomy proposals for taxonomists and non-taxonomists. Mitochondrial DNA 2010, 21, 206–226. [Google Scholar] [CrossRef] [PubMed]
  93. Wakefield, C.B.; Santana-Garcon, J.; Dorman, S.R.; Blight, S.; Denham, A.; Wakeford, J.; Molony, B.W.; Newman, S.J. Performance of bycatch reduction devices varies for chondrichthyan, reptile, and cetacean mitigation in demersal fish trawls: Assimilating subsurface interactions and unaccounted mortality. ICES J. Mar. Sci. 2017, 74, 343–358. [Google Scholar] [CrossRef]
  94. Howard, S.; Brill, R.; Hepburn, C.; Rock, J.; Pol, M. Microprocessor-based prototype bycatch reduction device reduces bait consumption by spiny dogfish and sandbar shark. ICES J. Mar. Sci. 2018, 75, 2235–2244. [Google Scholar] [CrossRef]
  95. Richards, R.J.; Raoult, V.; Powter, D.M.; Gaston, T.F. Permanent magnets reduce bycatch of benthic sharks in an ocean trap fishery. Fish. Res. 2018, 208, 16–21. [Google Scholar] [CrossRef]
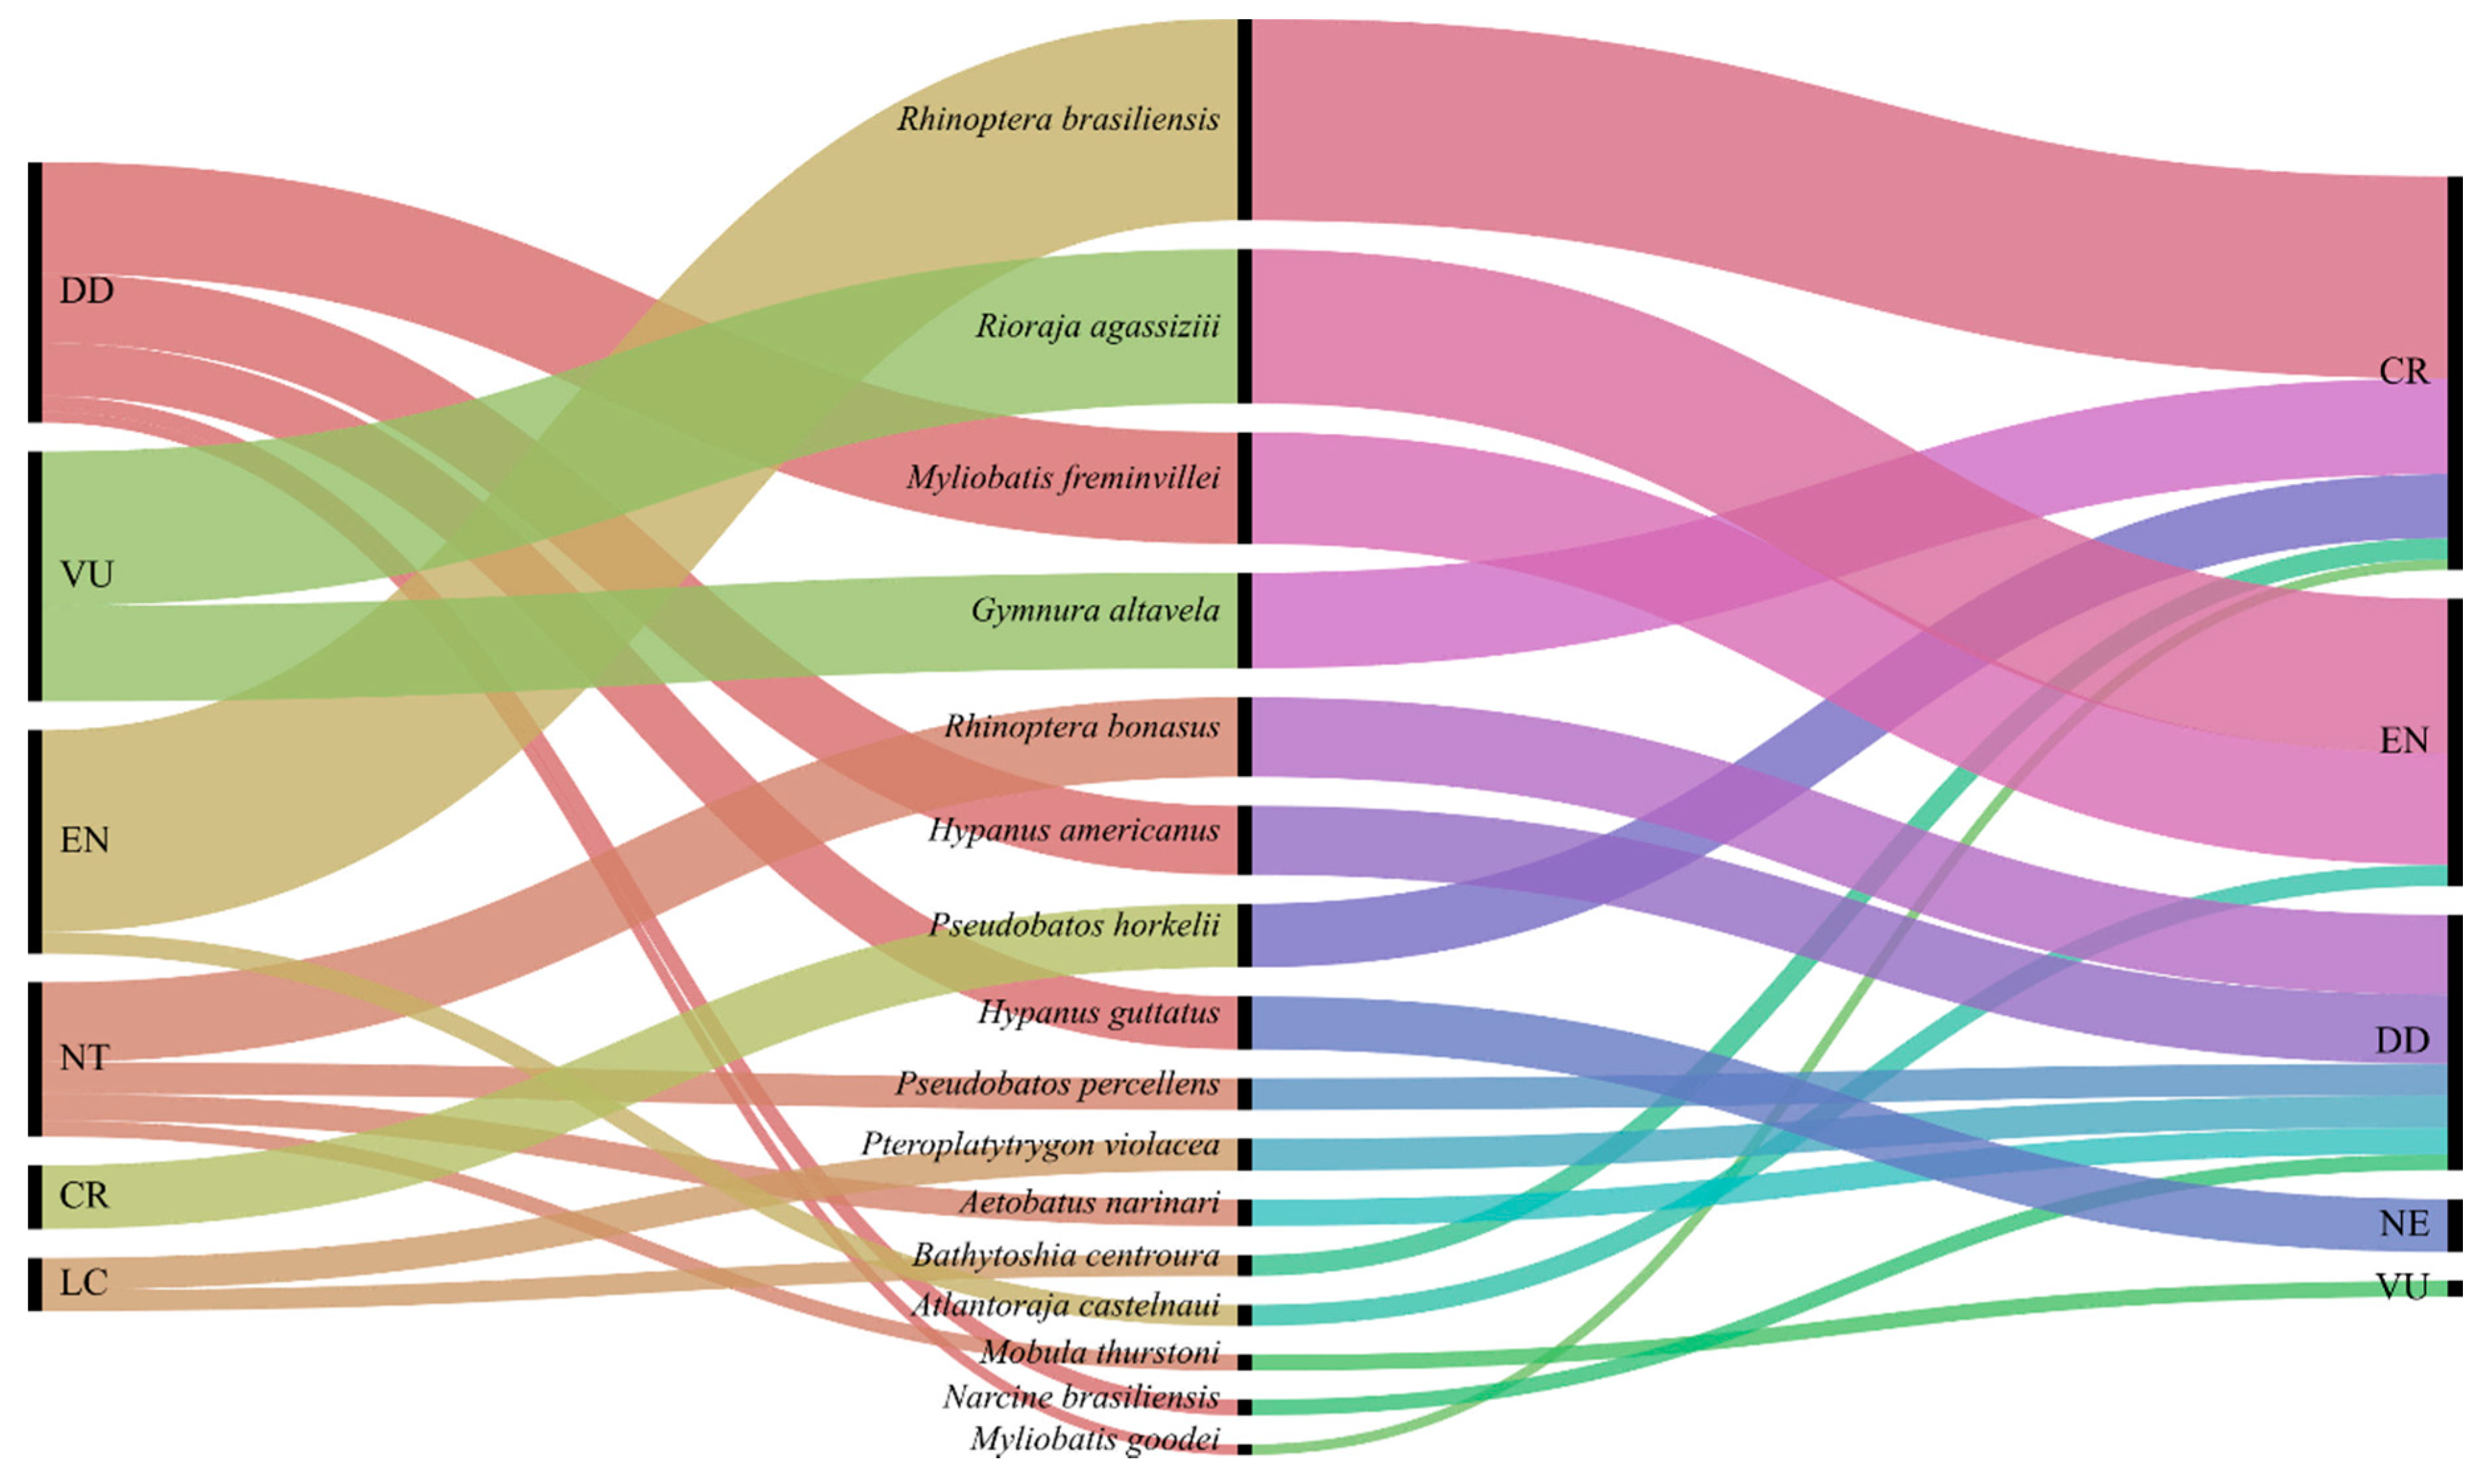
Figure 1. Batoid sampling locations scattered along the coast of the states of São Paulo (SP), Minas Gerais (MG), Rio de Janeiro (RJ), and Paraná (PR).
Genes 10 00304 g001
Figure 2. Alluvial diagrams allow to represent the correlation between the identified batoid species and their conservation status on the International Union for Conservation of Nature (IUCN) Red List and the Brazilian Red List. The left side of the chart shows the correlations between the identified batoid species and the IUCN Red List status; the right side shows the correlation between the identified batoids species and the Brazilian Red List. The chart was built using the online tool RAWGraphs (https://rawgraphs.io/).
Genes 10 00304 g002
Figure 3. Bayesian phylogenetic inference tree of cytochrome c oxidase subunit I (COI) using 94 haplotypes with 652 base pairs of sequences from BOLD, GenBank®, and also from this study. Node values indicate the percentage of posterior credibility values of trees. The plausible phylogenetic tree for the given data was produced using the Yule speciation model based on prior probabilities. Sxxx, Bxxx and Mxxx codes comprise the sequenced batoids individuals from this study.
Genes 10 00304 g003
Table 1. Identified batoid species; n, number of identified individuals; %, percentage of total sampling; IUCN, International Union for Conservation of Nature Red List species status; ICMBio, Brazilian Red List species status. CR, Critically Endangered; EN, Endangered; VU, Vulnerable; NT, Near Threatened; LC, Least Concern; DD, Data Deficient.
OrderFamilyCommon NameSpeciesn%IUCNICMBio
MyliobatiformesDasyatidaeRoughtail stingrayBathytoshia centroura41.75%LCCR
Southern stingrayHypanus americanus135.70%DDDD
Longnose stingrayHypanus guttatus104.39%DDNE
Blue pelagic stingrayPteroplatytrygon violacea62.63%LCDD
Dasyatis sp.3917.11%--
MyliobatidaeSpotted eagle rayAetobatus narinari52.19%NTDD
Smoothtail mobulaMobula thurstoni31.32%NTVU
Bullnose rayMyliobatis freminvillei219.21%DDEN
Southern eagle rayMyliobatis goodei20.88%DDCR
RhinopteridaeCownose rayRhinoptera bonasus156.58%NTDD
Brazilian cownose rayRhinoptera brasiliensis3816.67%ENCR
GymnuridaeSpiny butterfly rayGymnura altavela187.89%VUCR
RajiformesArhynchobatidaeSpotback skateAtlantoraja castelnaui41.75%ENEN
Rio skateRioraja agassizii2912.72%VUEN
RhinopristiformesRhinobatidaeBrazilian guitarfishPseudobatos horkelii125.26%CRCR
Southern guitarfishPseudobatos percellens62.63%NTDD
TorpediniformesNarcinidaeBrazilian electric rayNarcine brasiliensis31.32%DDDD
228100.00%

