Article

Genetic Effects of LPIN1 Polymorphisms on Milk Production Traits in Dairy Cattle

1
Department of Animal Genetics, Breeding and Reproduction, College of Animal Science and Technology, Key Laboratory of Animal Genetics, Breeding and Reproduction of Ministry of Agriculture and Rural Affairs, National Engineering Laboratory for Animal Breeding, China Agricultural University, Beijing 100193, China
2
Beijing Dairy Cattle Center, Qinghe’nanzhen Deshengmenwai Street, Chaoyang District, Beijing 100192, China
*
Author to whom correspondence should be addressed.
Genes 2019, 10(4), 265; https://doi.org/10.3390/genes10040265
Submission received: 12 March 2019 / Revised: 27 March 2019 / Accepted: 28 March 2019 / Published: 2 April 2019
(This article belongs to the Section Animal Genetics and Genomics)

Abstract

:
Our initial RNA sequencing work identified that lipin 1 (LPIN1) was differentially expressed during dry period, early lactation, and peak of lactation in dairy cows, and it was enriched into the fat metabolic Gene Ontology (GO) terms and pathways, thus we considered LPIN1 as the candidate gene for milk production traits. In this study, we detected the polymorphisms of LPIN1 and verified their genetic effects on milk yield and composition in a Chinese Holstein cow population. We found seven SNPs by re-sequencing the entire coding region and partial flanking region of LPIN1, including one in 5′ flanking region, four in exons, and two in 3′ flanking region. Of these, four SNPs, c.637T > C, c.708A > G, c.1521C > T, and c.1555A > C, in the exons were predicted to result in the amino acid replacements. With the Haploview 4.2, we found that seven SNPs in LPIN1 formed two haplotype blocks (D′ = 0.98–1.00). Single-SNP association analyses showed that SNPs were significantly associated with milk yield, fat yield, fat percentage, or protein yield in the first or second lactation (p = < 0.0001–0.0457), and only g.86049389C > T was strongly associated with protein percentage in both lactations (p = 0.0144 and 0.0237). The haplotype-based association analyses showed that the two haplotype blocks were significantly associated with milk yield, fat yield, protein yield, or protein percentage (p = < 0.0001–0.0383). By quantitative real-time PCR (qRT-PCR), we found that LPIN1 had relatively high expression in mammary gland and liver tissues. Furthermore, we predicted three SNPs, c.637T > C, c.708A > G, and c.1521C > T, using SOPMA software, changing the LPIN1 protein structure that might be potential functional mutations. In summary, we demonstrated the significant genetic effects of LPIN1 on milk production traits, and the identified SNPs could serve as genetic markers for dairy breeding.

1. Introduction

Genetic improvement can gradually induce smaller but permanent trait modifications [1], and genetic analyses have shown heritable variations in milk, fat and protein yields, and fat and protein percentages of bovine [2]. Genome-wide studies in dairy cows have allowed researchers to detect quantitative trait locus (QTL) harboring candidate polymorphic genes that are involved in milk production [3,4,5]. Moreover, studies have shown that the single nucleotide polymorphisms (SNPs) in the genes clearly influenced the milk yield and composition in Holsteins [6,7,8,9,10]. These results collectively suggest that loci found to affect milk production traits could be used in marker-assisted selection programs aimed at accelerating genetic progress of dairy cattle.
RNA sequencing (RNA-Seq) is an effective strategy to identify major genes for complex traits in human, domestic animals and plants, and previously we used it to analyze the liver transcriptome of Chinese Holstein cows among dry period, early lactation, and peak of lactation and found the expression of lipin 1 (LPIN1) significantly increased during peak of lactation compared to dry period (p = 0.00005, fold change = 2.02152) and during peak of lactation compared to early lactation (p = 0.00005, fold change = 1.30393). LPIN1 was also enriched into the fat metabolic GO terms and pathways, including lipid and fatty acid metabolic processes, triglyceride mobilization, glycerolipid and glycerophospholipid metabolism, and mTOR signaling pathway [11]. LPIN1, a member of the lipin family proteins that paly critical roles in lipid metabolism, maintains the lipid metabolic homeostasis due to its dual functions on lipid metabolism. LPIN1 is a phosphatidate phosphatase enzyme that is required for lipid synthesis, and it can also act as a transcriptional co-activator to active fatty acid oxidation [12]. Studies have shown that the LPIN1 links mTORC1 activity to the regulation of SREBP (sterol regulatory element-binding proteins) gene transcription [13,14,15], and that SREBPs integrate signals from multiple pathways to regulate fatty acids, triglycerides, and cholesterol synthesis [16,17]. LPIN1 acts with PPARα (peroxisome proliferator-activated receptor α) and PGC-1α (PPARγ coactivator 1α) to modulate the hepatic genes involved in fatty acid oxidation [18]. PPARα, enriched in liver, is involved in hepatic glucose production, lipogenesis, and fatty acid transport and catabolism [19]. In addition, LPIN1 is located 1.02 cM to the peak of the reported QTL region for milk fat yield [20], and is close to (0.0024–2.41 Mb) seven SNPs that have significant genetic effects on milk yield, fat yield, protein yield, fat percentage and protein percentage [21]. These data suggest that LPIN1 might be involved in milk synthesis. Herein, we present the polymorphisms of LPIN1 and their genetic effects on milk production traits in a Chinese Holstein cow population.

2. Materials and Methods

2.1. Animal Selection and Phenotypic Data Collection

We selected 1067 Chinese Holstein cows of 40 sire families from 22 dairy farms belonging to the Sanyuan Lvhe Dairy Farming Centre (Beijing, China) where the cows were maintained with the same feeding conditions. The sires were used for SNP discovery by PCR and sequencing and their 1067 daughters were for association analysis. The cows were selected according to the criteria as follows: (i) The cows in each sire family were distributed in different farms. (ii) At least six daughters were included in each sire family. (iii) Each cow had at least three generations of pedigree information and Dairy Herd Improvement (DHI) records for 305-day milk yield, protein yield, protein percentage, fat yield and fat percentage. The phenotypic data for the five traits during the first (1067 cows) and second (740 cows) lactations were provided by the Beijing Dairy Cattle Centre (http://www.bdcc.com.cn/; Beijing, China). The descriptive statistics of the phenotypic values for milk production traits in the two lactations are shown in Table S1.

2.2. Genomic DNA Extraction

Genomic DNAs were extracted from the semen samples of 40 sires using the salt-out procedure, and the DNAs from the blood samples of 1067 daughters were extracted using a TIANamp Blood DNA Kit (Tiangen, Beijing, China) according to the manufacturer’s instructions. The quantity and quality of the extracted DNA samples were measured by a NanoDrop 2000 spectrophotometer (Thermo Scientific, Hudson, NH, USA) and gel electrophoresis, respectively.

2.3. SNP Identification and Estimation of Linkage Disequilibrium (LD)

We designed the primers by Primer3 (http://bioinfo.ut.ee/primer3-0.4.0/) to amplify the entire coding region and 2000 bp of the both 5′ and 3′ flanking regions based on the bovine reference genome sequences of LPIN1 (Table S2). The primers then were synthesized by the Beijing Genomics Institute (BGI, Beijing, China). The conditions for PCR are shown in Table S2. Subsequently, the purified PCR products were sequenced using an ABI3730XL DNA analyzer (Applied Biosystems, Foster City, CA, USA). Then, we compared the sequences with the references on NCBI-BLAST (https://blast.ncbi.nlm.nih.gov/Blast.cgi) to discover the potential SNPs. The identified SNPs were individually genotyped using Sequenom MassArray for all the 1067 cows by matrix-assisted laser desorption/ionization time of flight mass spectrometry (MALDI-TOF MS, Sequenom MassARRAY, Bioyong Technologies Inc., HK).
Further, we used the Haploview 4.2 (Broad Institute of MIT and Harvard, Cambridge, MA, USA) to estimate the extent of Linkage Disequilibrium (LD) between the identified SNPs.

2.4. Association Analyses on Milk Production Traits

We utilized the SAS 9.13 software to estimate the associations of the SNPs or haplotype blocks with milk production traits on first or second lactation with the following animal model:
Y = μ + hys + b × M + G + a + e
where Y is the phenotypic value of each trait for each cow; μ is the overall mean; hys is the fixed effect of farm (1–22: 22 farms), year (1–4: 2012–2015), and season (1, April–May; 2, June–August; 3, September–November; and 4, December–March); b is the regression coefficient of covariant M ; M is the fixed effect of calving month; G is the genotype or haplotype combination effect; a is the individual random additive genetic effect, distributed as N   ( 0 , A δ a 2 ) with the additive genetic variance δ a 2 ; and e is the random residual, distributed as N   ( 0 ,   I δ e 2 ), with identity matrix I and residual error variance δ e 2 . Bonferroni correction was performed for multiple testing, and the significant level was equal to the raw P value divided by number of genotypes or haplotype combinations.
We also calculated the additive (a), dominant (d), and substitution (α) effects as follows: a = AA BB 2 ;   d = AB AA + BB 2 ;   α = a + d ( q p ) , where, AA, BB, and AB are the least square means of the milk production traits in the corresponding genotypes, p is the frequency of allele A, and q is the frequency of allele B.

2.5. Detection of LPIN1 Gene Expression by Quantitative Real-Time PCR (qRT-PCR)

To further reveal the potential function of LPIN1, we detected its expressions in eight tissues, including heart, liver, spleen, lung, kidney, ovary, mammary, and uterus. We selected three healthy lactating Chinese Holstein cows from the Sanyuanlvhe Dairy Farming Center (Beijing, China), and collected the eight tissues from each cow. The total RNAs from the eight tissues of each cow were isolated using Trizol reagent (Invitrogen, Carlsbad, CA, USA) according to the manufacturer’s instructions. Subsequently, we measured the quantity and quality of RNA with the NanoDrop 2000 spectrophotometer (Thermo Scientific, Hudson, DE, USA) and gel electrophoresis, respectively. We used PrimerScriptH RT reagent Kit (TaKaRa Biotechnology Co., Ltd., Dalian, China) for the reverse transcription. The qRT-PCR primers of LPIN1 and two reference genes (Ribosomal Protein S9, RPS9 and Ubiquitously Expressed Prefoldin Like Chaperone, UXT) are shown in Table S2. Then, we conducted the qRT-PCR in a LightCycler® 480 II (Roche, Penzberg, Germany) using SYBR green fluorescence (Roche) as the procedures presented in Table S2. We performed all the measurements in triplicate and the relative gene expression was normalized by the RPS9 and UXT with 2−ΔΔCt method.

2.6. Protein Structure Prediction

The NPSA SOPMA Server (https://npsa-prabi.ibcp.fr/cgi-bin/npsa_automat.pl?page=/NPSA/npsa_sopma.html) was used to predict the variation of protein secondary structure caused by the missense mutation in the coding region of LPIN1 gene, and the parameters were window width (17), similarity threshold (8), and number of states (4).

2.7. Ethics Approval

All protocols for sample collection were approved by the Institutional Animal Care and Use Committee (IACUC) at China Agricultural University (Beijing, China; permit number: DK996).

3. Results

3.1. SNPs Identification in LPIN1

By sequencing and sequence alignment, we identified seven SNPs in LPIN1 gene: one SNP in 5′ flanking region, four in exons, and two in 3′ flanking region. The genotypic and allelic frequencies of all the identified SNPs are summarized in Table 1. In addition, the four SNPs in the exons were predicted to result in amino acid replacements, namely, c.637T > C (ATG–ACG; methionine to threonine), c.708A > G (ACA–GCA; threonine to alanine), c.1521C > T (CCC–TCC; proline to serine), and c.1555A > C (CAT–CCT; histidine to proline; Table 1).

3.2. Association Analysis Between SNPs and the Five Milk Production Traits

Associations between seven SNPs of LPIN1 and five milk production traits are presented in Table 2. Using the single-SNP association analysis, we found that two (g.86049523C > T and g.86049389C > T), four (g.86129263C > G, c.1521C > T, g.86049523C > T and g.86049389C > T), four (g.86129263C > G, c.1521C > T, g.86049523C > T and g.86049389C > T), and one (g.86049389C > T) SNPs were significantly associated with milk yield (p < 0.0001), fat yield (p = < 0.0001–0.0298), protein yield (p = < 0.0001–0.0326), and protein percentage (p = 0.0237) in the first lactation, respectively. Similarly, five (c.637T > C, c.708A > G, c.1521C > T, c.1555A > C, and g.86049523C > T), two (g.86049523C > T and g.86049389C > T), four (g.86129263C > G, c.637T > C, c.1521C > T, and c.1555A > C), four (c.637T > C, c.708A > G, c.1555A > C, and g.86049523C > T), and one (g.86049523C > T) SNPs were significantly associated with milk yield (p = < 0.0001–0.0239), fat yield (p = 0.0053 and 0.0236), fat percentage (p = 0.0087–0.0457), protein yield (p = 0.0047–0.0281), and protein percentage (p = 0.0144) in the second lactation, respectively. The SNP g.86049523C > T was identified significantly associated with milk yield, fat yield, and protein yield in both first and second lactations (p = < 0.0001–0.0281), and g.86049389C > T was strongly associated with fat yield in both lactations (p = 0.0053–0.0023). Overall, seven SNPs of LPIN1 (g.86129263C > G, c.637T > C, c.708A > G, c.1521C > T, c.1555A > C, g.86049523C > T, and g.86049389C > T) were observed strongly associated with at least one milk production traits in the first and second lactations. Nevertheless, one (g.86129263C > G), three (c.637T > C, c.708A > G, and c.1555A > C), three (c.708A > G, g.86049523C > T, and g.86049389C > T), and five SNPs (g.86129263C > G, c.637T > C, c.708A > G, c.1521C > T, and c.1555A > C) had no genetic associations with milk yield, fat yield, fat percentage, and protein percentage in either lactation, respectively (p > 0.05).
In addition, we analyzed the additive, dominant and substitution effects of the seven SNPs in the first and second lactations, and found that the SNPs were significantly associated with at least one milk traits in the first or second lactation (p < 0.05; Table S3).

3.3. Associations Between Haplotype Blocks and the Five Milk Traits

We used Haploview 4.2 to estimate the extent of LD between the seven identified SNPs, and inferred two haplotype blocks, respectively, comprising two and five SNPs (Figure 1). The pairwise D′ measures indicated that SNPs in the block were highly linked (Block 1: D′ = 1; Block 2: D′ = 0.98–1.00). In Block 1, the frequency of the three haplotypes, H1 (CC), H2 (TT), and H3 (TC), were 76.1%, 10.55%, and 13.4%, respectively. For Block 2, three haplotypes, H1 (ACATC), H2 (CTGCG), and H3 (CCGCC), with frequencies of 41.9%, 27.4%, and 29.1%, respectively, were identified. Haplotype-based association analysis showed that the haplotype Block 1 was significantly associated milk yield (p < 0.0001), fat yield (p = < 0.0001), and protein yield (p = < 0.0001) in the first lactations, and associated with fat yield (p = 0.0185) and protein percentage (p = 0.01) in the second lactation. The haplotype Block 2 was significantly associated with milk yield (p = 0.002 and 0.0044) and protein yield (p = 0.0383 and 0.0052) in both lactations (Table 3). While haplotype Block 1 had no significant association with fat percentage, Block 2 had no association with fat yield, fat percentage, and protein percentage in both lactations (p > 0.05).

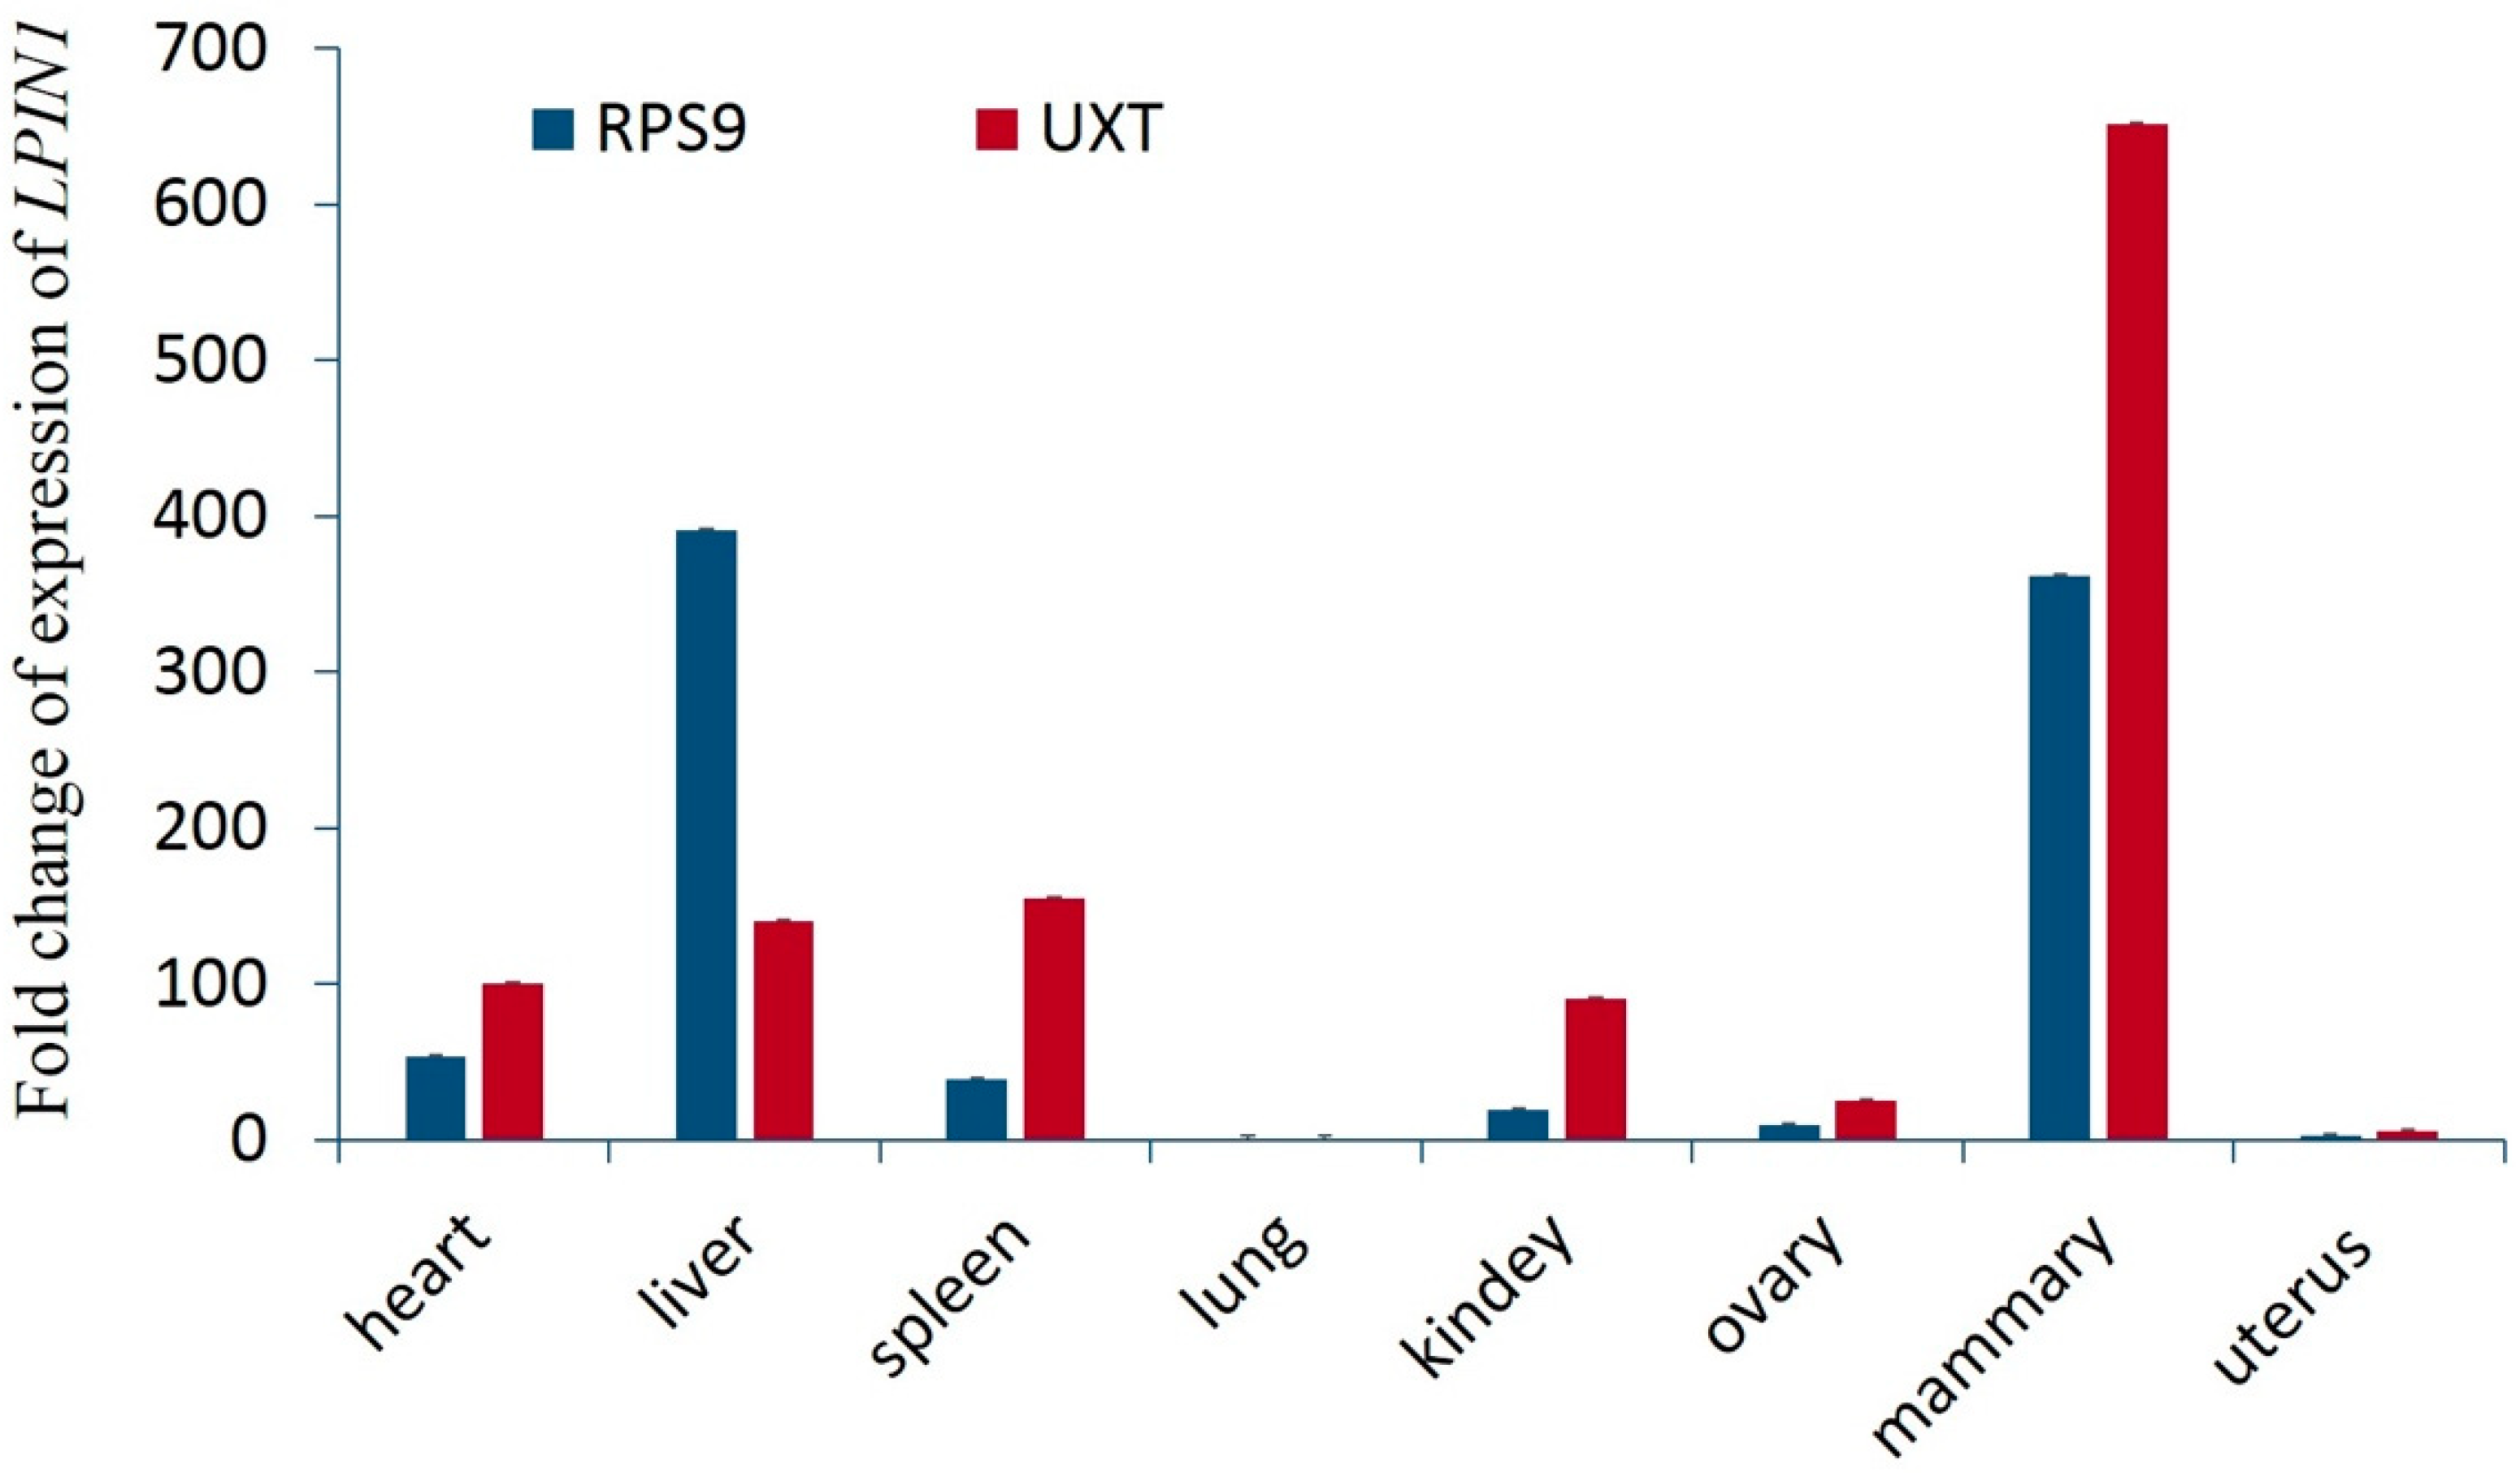
3.4. Expression of LPIN1 in Eight Tissues

Using qRT-PCR, we detected that LPIN1 gene was expressed in heart, liver, spleen, lung, kidney, ovary, mammary, and uterus of lactating Chinese Holstein, with relatively high expression in the mammary gland and liver, implying the LPIN1 might be involved in milk synthesis (Figure 2).

3.5. Protein Structure Variation Caused by the Missense Mutation

We further used the SOPMA software to predict the changes of the protein secondary structure of LPIN1 for the four missense mutations in the exons of LPIN1 gene, and found three missense mutations (c.637T > C, c.708A > G, and c.1521C > T) that changed the LPIN1 protein secondary structure (Table 1). Of these, the missense mutation (methionine to threonine) caused by c.637T > C led to the alpha helix changing 25.7–25.81%, extended strand 18.44–17.88%, and random coil 48.83–49.27%. The c.708A > G caused a missense mutation (threonine to alanine) to result in the changes of alpha helix of 25.7–26.03%, extended strand of 18.44–18.32%, and random coil of 48.83–48.6%. Due to the missense mutation proline to serine, caused by c.1521C > T, the alpha helix changed 25.7–25.81% and random coil 48.83–48.72%. However, the missense mutation caused by c.1555A > C, histidine to proline, did not change the protein secondary structure of LPIN1.

4. Discussion

Our initial RNA-Seq study suggested LPIN1 as the promising candidate gene for milk production traits in dairy cattle, and this follow-up investigation demonstrated the significant genetic associations of LPIN1 with milk, fat and protein yields.
Studies showing the important roles of SNPs for milk production traits in dairy cattle have been reported previously [8,9,10,22]. Pegolo et al. discovered two SNPs, rs136905033 and rs137457402, of LPIN1 associated with milk fatty acids in bovine [23]. Nafikov et al. did not observe any significant association between LPIN1 haplotypes and the milk fatty acid composition in Holstein cows [24]. In this study, we identified the polymorphisms of LPIN1 and found that the SNPs and haplotype blocks of this gene have strongly associations with milk production traits, especially milk, fat and protein yields. Further, based on the phenotypic values of the genotypes for each SNP (Table 2), we found that the genotype TT of c.1521C > T with higher milk production had a positive effect on milk yield. For milk fat, the genotypes GG of g.86129263C > G and CC of g.86049389C > T were positively influenced the fat yield, and the genotypes TT of c.637T > C and AA of c.1555A > C have more active effects on fat percentage. As for milk protein, we observed that the cows with genotypes GG of g.86129263C > G and TT of c.1521C > T produced more milk protein. In summary, our findings provide information for improving the milk production in dairy cattle.
In the current study, we identified LPIN1 as highly expressed in the mammary gland and liver tissues. The lactating bovine mammary gland is regarded as a formidable machine for triacylglycerol synthesizing. LPIN1 is the major isoform expressed in the bovine mammary, and it catalyzes phosphatidic acid to diacylglycerol in triacylglycerol synthesis [25,26]. LPIN1, a transcriptional co-activator for regulating fatty acid metabolism, influences lipid metabolism and glucose homeostasis in various tissues including liver, adipose tissue and some other cells [27]. The mRNA expression of LPIN1 in liver and adipose tissue have positive associations with body mass and insulin sensitivity, and its polymorphisms have been associated with metabolic syndrome [28]. The allele T of rs13412852 in LPIN1 is associated with lower body mass index and insulin levels [29], thus it is possibly considered as a protector for the metabolic syndrome alterations. These data suggest that LPIN1 might be involved in milk synthesis and in regulating the transcription of other genes involved in milk synthesis metabolism.
Furthermore, we found four missense mutations in the exons of LPIN1, and the association analysis results showed that the four mutations were significantly associated with milk yield, fat yield, fat percentage, or protein yield. Importantly, we predicted the protein secondary structure changes by these four mutations, and found that three missense mutations, c.637T > C, c.708A > G, and c.1521C > T, could change the LPIN1 protein structure by altering the alpha helix, extended strand, and random coil. Generally, the α-helix was preferably located at the core of the protein and had important roles in proteins for flexibility and conformational changes [30]. Therefore, we presumed that the LPIN1 protein might be more stable in conformation when the haplotype was H2 in Block 2, with the base C in c.637T > C, G in c.708A > G, and T in c.1521C > T. Hence, these three missense mutations might be the potential functional mutations for milk production by changing the protein structure in dairy cattle, and the further in-depth investigation should be performed to validate their biological roles.

5. Conclusions

In this study, we identified seven SNPs in LPIN1 and observed their significant genetic associations with milk production traits in dairy cattle. Three missense mutations, c.637T > C, c.708A > G, and c.1521C > T, might be functional mutations by changing the LPIN1 protein structure. Our findings provide worthwhile information that could be used in breeding programs.

Supplementary Materials

The following are available online at https://www.mdpi.com/2073-4425/10/4/265/s1. Table S1. Descriptive statistics of the phenotypic values for milk production traits in the first and second lactations. Table S2. Primers and procedures for PCR and qRT-PCR. Table S3. Additive, dominant and allele substitution effects of seven SNPs on milk production traits of LPIN1 gene in Chinese Holstein.

Author Contributions

Data curation, B.H., Y.Y., R.L., Y.Y., L.L. and D.S.; Formal analysis, B.H., Y.Y., and R.L.; Funding acquisition, B.H. and D.S.; Investigation, B.H., Y.Y. and R.L.; Methodology, B.H., Y.Y., and D.S.; Project administration, D.S.; Resources, Y.L., L.L. and D.S.; Supervision, D.S.; Writing—original draft, B.H.; and Writing—review and editing, B.H. and D.S.

Funding

This work was financially supported by the National Natural Science Foundation of China (31872330, 31802041), Beijing Dairy Industry Innovation Team (BAIC06-2018/2019), Beijing Science and Technology Program (D171100002417001), National Science and Technology Programs of China (2013AA102504), earmarked fund for Modern Agro-industry Technology Research System (CARS-36), and the Program for Changjiang Scholar and Innovation Research Team in University (IRT_15R62).

Conflicts of Interest

The authors declare no conflict of interests.

References

  1. Visentin, G.; Niero, G.; Berry, D.P.; Costa, A.; Cassandro, M.; De Marchi, M.; Penasa, M. Genetic (co)variances between milk mineral concentration and chemical composition in lactating Holstein-Friesian dairy cows. Animal 2019, 13, 477–486. [Google Scholar] [CrossRef] [PubMed]
  2. Bastin, C.; Soyeurt, H.; Gengler, N. Genetic parameters of milk production traits and fatty acid contents in milk for Holstein cows in parity 1-3. J. Anim. Breed. Genet. 2013, 130, 118–127. [Google Scholar] [CrossRef]
  3. Georges, M.; Nielsen, D.; Mackinnon, M.; Mishra, A.; Okimoto, R.; Pasquino, A.T.; Sargeant, L.S.; Sorensen, A.; Steele, M.R.; Zhao, X.; et al. Mapping quantitative trait loci controlling milk production in dairy cattle by exploiting progeny testing. Genetics 1995, 139, 907–920. [Google Scholar]
  4. Wang, D.; Ning, C.; Liu, J.F.; Zhang, Q.; Jiang, L. Short communication: Replication of genome-wide association studies for milk production traits in Chinese Holstein by an efficient rotated linear mixed model. J. Dairy Sci. 2019, 102, 2378–2383. [Google Scholar] [CrossRef]
  5. Fang, Z.H.; Bovenhuis, H.; van Valenberg, H.J.F.; Martin, P.; Duchemin, S.I.; Huppertz, T.; Visker, M. Genome-wide association study for alphaS1- and alphaS2-casein phosphorylation in Dutch Holstein Friesian. J. Dairy Sci. 2019, 102, 1374–1385. [Google Scholar] [CrossRef] [PubMed]
  6. Bouwman, A.C.; Bovenhuis, H.; Visker, M.H.; van Arendonk, J.A. Genome-wide association of milk fatty acids in Dutch dairy cattle. Bmc Genet. 2011, 12, 43. [Google Scholar] [CrossRef]
  7. Matsumoto, H.; Sasaki, K.; Bessho, T.; Kobayashi, E.; Abe, T.; Sasazaki, S.; Oyama, K.; Mannen, H. The SNPs in the ACACA gene are effective on fatty acid composition in Holstein milk. Mol. Biol. Rep. 2012, 39, 8637–8644. [Google Scholar] [CrossRef]
  8. Bhattarai, D.; Chen, X.; Ur Rehman, Z.; Hao, X.; Ullah, F.; Dad, R.; Talpur, H.S.; Kadariya, I.; Cui, L.; Fan, M.; et al. Association of MAP4K4 gene single nucleotide polymorphism with mastitis and milk traits in Chinese Holstein cattle. J. Dairy. Res. 2017, 84, 76–79. [Google Scholar] [CrossRef]
  9. Han, B.; Liang, W.; Liu, L.; Li, Y.; Sun, D. Determination of genetic effects of ATF3 and CDKN1A genes on milk yield and compositions in Chinese Holstein population. Bmc Genet. 2017, 18, 47. [Google Scholar] [CrossRef] [PubMed] [Green Version]
  10. Han, B.; Liang, W.; Liu, L.; Li, Y.; Sun, D. Genetic association of the ACACB gene with milk yield and composition traits in dairy cattle. Anim. Genet. 2018. [Google Scholar] [CrossRef] [PubMed]
  11. Liang, R.; Han, B.; Li, Q.; Yuan, Y.; Li, J.; Sun, D. Using RNA sequencing to identify putative competing endogenous RNAs (ceRNAs) potentially regulating fat metabolism in bovine liver. Sci. Rep. 2017, 7, 6396. [Google Scholar] [CrossRef]
  12. Chen, Y.; Rui, B.B.; Tang, L.Y.; Hu, C.M. Lipin family proteins--key regulators in lipid metabolism. Ann. Nutr. Metab. 2015, 66, 10–18. [Google Scholar] [CrossRef]
  13. Peterson, T.R.; Sengupta, S.S.; Harris, T.E.; Carmack, A.E.; Kang, S.A.; Balderas, E.; Guertin, D.A.; Madden, K.L.; Carpenter, A.E.; Finck, B.N.; et al. mTOR complex 1 regulates lipin 1 localization to control the SREBP pathway. Cell 2011, 146, 408–420. [Google Scholar] [CrossRef] [Green Version]
  14. Laplante, M.; Sabatini, D.M. Regulation of mTORC1 and its impact on gene expression at a glance. J. Cell Sci. 2013, 126, 1713–1719. [Google Scholar] [CrossRef] [Green Version]
  15. Kennedy, B.K.; Lamming, D.W. The Mechanistic Target of Rapamycin: The Grand ConducTOR of Metabolism and Aging. Cell Metab. 2016, 23, 990–1003. [Google Scholar] [CrossRef]
  16. Goldstein, J.L.; DeBose-Boyd, R.A.; Brown, M.S. Protein sensors for membrane sterols. Cell 2006, 124, 35–46. [Google Scholar] [CrossRef]
  17. Shao, W.; Espenshade, P.J. Expanding roles for SREBP in metabolism. Cell Metab. 2012, 16, 414–419. [Google Scholar] [CrossRef] [PubMed] [Green Version]
  18. Donkor, J.; Zhang, P.; Wong, S.; O’Loughlin, L.; Dewald, J.; Kok, B.P.; Brindley, D.N.; Reue, K. A conserved serine residue is required for the phosphatidate phosphatase activity but not the transcriptional coactivator functions of lipin-1 and lipin-2. J. Biol. Chem. 2009, 284, 29968–29978. [Google Scholar] [CrossRef]
  19. Hashimoto, T.; Cook, W.S.; Qi, C.; Yeldandi, A.V.; Reddy, J.K.; Rao, M.S. Defect in peroxisome proliferator-activated receptor alpha-inducible fatty acid oxidation determines the severity of hepatic steatosis in response to fasting. J. Biol. Chem. 2000, 275, 28918–28928. [Google Scholar] [CrossRef] [PubMed]
  20. Ashwell, M.S.; Heyen, D.W.; Sonstegard, T.S.; Van Tassell, C.P.; Da, Y.; VanRaden, P.M.; Ron, M.; Weller, J.I.; Lewin, H.A. Detection of quantitative trait loci affecting milk production, health, and reproductive traits in Holstein cattle. J. Dairy. Sci. 2004, 87, 468–475. [Google Scholar] [CrossRef]
  21. Cole, J.B.; Wiggans, G.R.; Ma, L.; Sonstegard, T.S.; Lawlor, T.J., Jr.; Crooker, B.A.; Van Tassell, C.P.; Yang, J.; Wang, S.; Matukumalli, L.K.; et al. Genome-wide association analysis of thirty one production, health, reproduction and body conformation traits in contemporary U.S. Holstein cows. BMC Genomics 2011, 12, 408. [Google Scholar] [CrossRef] [PubMed]
  22. Weikard, R.; Kuhn, C.; Goldammer, T.; Freyer, G.; Schwerin, M. The bovine PPARGC1A gene: molecular characterization and association of an SNP with variation of milk fat synthesis. Physiol. Genomics 2005, 21, 1–13. [Google Scholar] [CrossRef] [PubMed] [Green Version]
  23. Pegolo, S.; Cecchinato, A.; Mele, M.; Conte, G.; Schiavon, S.; Bittante, G. Effects of candidate gene polymorphisms on the detailed fatty acids profile determined by gas chromatography in bovine milk. J. Dairy. Sci. 2016, 99, 4558–4573. [Google Scholar] [CrossRef] [PubMed]
  24. Nafikov, R.A.; Schoonmaker, J.P.; Korn, K.T.; Noack, K.; Garrick, D.J.; Koehler, K.J.; Minick-Bormann, J.; Reecy, J.M.; Spurlock, D.E.; Beitz, D.C. Polymorphisms in lipogenic genes and milk fatty acid composition in Holstein dairy cattle. Genomics 2014, 104, 572–581. [Google Scholar] [CrossRef] [PubMed]
  25. Han, G.S.; Wu, W.I.; Carman, G.M. The Saccharomyces cerevisiae lipin homolog is a Mg2+ dependent phosphatidate phosphatase enzyme. J. Biol. Chem. 2006, 281, 9210–9218. [Google Scholar] [CrossRef]
  26. Bionaz, M.; Loor, J.J. ACSL1, AGPAT6, FABP3, LPIN1, and SLC27A6 are the most abundant isoforms in bovine mammary tissue and their expression is affected by stage of lactation. J. Nutr. 2008, 138, 1019–1024. [Google Scholar] [CrossRef]
  27. Reue, K.; Zhang, P. The lipin protein family: dual roles in lipid biosynthesis and gene expression. FEBS Lett. 2008, 582, 90–96. [Google Scholar] [CrossRef]
  28. Reue, K. The lipin family: mutations and metabolism. Curr. Opin. Lipidol. 2009, 20, 165–170. [Google Scholar] [CrossRef]
  29. Fawcett, K.A.; Grimsey, N.; Loos, R.J.; Wheeler, E.; Daly, A.; Soos, M.; Semple, R.; Syddall, H.; Cooper, C.; Siniossoglou, S.; et al. Evaluating the role of LPIN1 variation in insulin resistance, body weight, and human lipodystrophy in U.K. Populations. Diabetes 2008, 57, 2527–2533. [Google Scholar] [CrossRef]
  30. Jia, M.; Luo, L.; Liu, C. Statistical correlation between protein secondary structure and messenger RNA stem-loop structure. Biopolymers 2004, 73, 16–26. [Google Scholar] [CrossRef]
Figure 1. Linkage disequilibrium estimated among the SNPs in LPIN1 (D′ = 0.98–1.00). Seven SNPs of LPIN1 formed two haplotype blocks. The values in boxes are pairwise SNP correlations (D′), while bright red boxes without numbers indicate complete LD (D′ = 1). The blocks indicate haplotype blocks and the text above the horizontal numbers is the SNP names.
Genes 10 00265 g001
Figure 2. Expression profiles of LPIN1 gene in eight different tissues. RPS9 and UXT were the two reference genes.
Genes 10 00265 g002
Table 1. Details of single nucleotide polymorphisms (SNPs) identified in LPIN1 gene.
SNP nameAliasLocationPosition (UMD3.1)GenBank no.GenotypeGenotypic FrequencyAlleleAllelic FrequencyCodonAmino AcidAlpha Helix (%)Extended Strand (%)Beta Turn (%)Random Coil (%)
g.86129263C > G 5′ flanking regionchr11:86129263rs211527179CC0.52C0.72
CG0.40G0.28
GG0.08
c.637T > Cp.Met103Threxon 5chr11:86093896rs110871255TT0.35T0.58ATGMethionine25.718.447.0448.83
TC0.46C0.42ACGThreonine25.8117.887.0449.27
CC0.19
c.708A > Gp.Thr127Alaexon 5chr11:86093825rs110161110AA0.18A0.42ACAThreonine25.718.447.0448.83
AG0.47G0.58GCAAlanine26.0318.327.0448.6
GG0.35
c.1521C > Tp.Pro398Serexon 8chr11:86082411rs207681322CC0.52C0.72CCCProline25.718.447.0448.83
CT0.40T0.28TCCSerine25.8118.447.0448.72
TT0.08
c.1555A > Cp.His409Proexon 8chr11:86082377rs137642654AA0.18A0.41CATHistidine25.718.447.0448.83
AC0.46C0.59CCTProline25.718.447.0448.83
CC0.35
g.86049523C > T 3′ flanking regionchr11:86049523rs135886289CC0.80C0.89
TC0.19T0.11
TT0.01
g.86049389C > T 3′ flanking regionchr11:86049389rs109039955CC0.57C0.76
CT0.38T0.24
TT0.05
Table 2. Associations of seven SNPs with milk production traits in two lactations in Chinese Holstein (LSM ± SE).
SNPLactationGenotype (No.)Milk Yield (kg)Fat Yield (kg)Fat Percentage (%)Protein Yield (kg)Protein Percentage (%)
g.86129263C > G1CC (549)10,277 ± 64.99339.78 ± 2.89 a3.33 ± 0.03302.37 ± 2.1 a2.95 ± 0.01
GC (418)10,373 ± 66.2343.97 ± 2.93 b3.33 ± 0.03305.94 ± 2.13 b2.96 ± 0.01
GG (84)10,427 ± 102348.19 ± 4.28 b3.36 ± 0.04308.25 ± 3.12 b2.96 ± 0.01
p0.08970.0264 *0.73950.0171 *0.6191
2CC (393)10,830 ± 66.31394.13 ± 2.943.65 ± 0.03 a322.86 ± 2.142.98 ± 0.01
GC (279)10,909 ± 70.55389.92 ± 3.13.57 ± 0.03 b323.77 ± 2.262.96 ± 0.01
GG (56)11,027 ± 121.7396.24 ± 5.053.58 ± 0.05 ab328.01 ± 3.682.97 ± 0.02
p0.17420.17780.0114 *0.3210.3621
c.637T > C1CC (355)10,306 ± 67.75341.19 ± 2.993.33 ± 0.03304.44 ± 2.182.96 ± 0.01
CT (471)10,298 ± 65.56342.24 ± 2.913.34 ± 0.03303.55 ± 2.122.95 ± 0.01
TT (195)10,260 ± 79.47340.9 ± 3.433.34 ± 0.03301.61 ± 2.52.95 ± 0.01
p0.80010.83260.83540.39770.3462
2CC (245)10,822 ± 74.61 ab387.99 ± 3.263.59 ± 0.03 a320.57 ± 2.38 ab2.96 ± 0.01
CT (334)10,915 ± 69.65 a393.46 ± 3.083.61 ± 0.03 ab324.8 ± 2.24 a2.98 ± 0.01
TT (134)10,695 ± 88.29 b391.37 ± 3.793.68 ± 0.04 b318.59 ± 2.76 b2.98 ± 0.01
p0.0239 *0.13840.0457 *0.0135 *0.3878
c.708A > G1AA (189)10,306 ± 79.73341.1 ± 3.433.33 ± 0.03302.25 ± 2.52.94 ± 0.01
GA (483)10,283 ± 65.18341.71 ± 2.93.34 ± 0.03302.53 ± 2.112.95 ± 0.01
GG (363)10,288 ± 67.68339.86 ± 2.993.33 ± 0.03302.91 ± 2.182.96 ± 0.01
p0.94150.69670.70410.94820.4343
2AA (131)10,585 ± 87.91 a385.53 ± 3.753.67 ± 0.04315.15 ± 2.73 a2.98 ± 0.01
GA (345)10,820 ± 67.54 b388.86 ± 2.993.61 ± 0.03321.28 ± 2.17 b2.98 ± 0.01
GG (249)10,700 ± 74.6 ab382.4 ± 3.273.59 ± 0.03315.81 ± 2.38 a2.96 ± 0.01
p0.0108 *0.060.05780.0047 **0.1921
c.1521C > T1CC (548)10,353 ± 64.39342.88 ± 2.86 a3.33 ± 0.03305.29 ± 2.08 a2.95 ± 0.01
CT (424)10,416 ± 66.09346.9 ± 2.93 ab3.34 ± 0.03308.3 ± 2.13 b2.96 ± 0.01
TT (82)10,529 ± 102.6351.26 ± 4.3 b3.35 ± 0.04311.14 ± 3.13 b2.96 ± 0.01
P0.12770.0298 *0.89690.0326 *0.5631
2CC (391)10,794 ± 66.73 Aa389.16 ± 2.923.66 ± 0.03 a320.29 ± 2.132.98 ± 0.01
CT (286)10,752 ± 71.54 Aa383.27 ± 3.133.59 ± 0.03 b319.05 ± 2.282.97 ± 0.01
TT (56)11,321 ± 125.69 B387.58 ± 5.113.56 ± 0.05 ab324.06 ± 3.732.95 ± 0.02
p<0.0001 **0.07340.0087 **0.3430.4776
c.1555A > C1AA (190)10,318 ± 79.45342.83 ± 3.423.34 ± 0.03303.86 ± 2.492.95 ± 0.01
CA (484)10,276 ± 64.88341.58 ± 2.883.34 ± 0.03303.41 ± 2.12.96 ± 0.01
CC (367)10,289 ± 68.17341.3 ± 3.013.33 ± 0.03304.43 ± 2.192.96 ± 0.01
p0.81290.85920.94280.81190.3199
2AA (129)10,608 ± 88.23 Aa390.24 ± 3.773.7 ± 0.04 a316.59 ± 2.74 a2.99 ± 0.01
CA (349)10,875 ± 68.16 Bb393.78 ± 3.013.63 ± 0.03 ab322.98 ± 2.19 b2.98 ± 0.01
CC (249)10,772 ± 73.77 ab387.22 ± 3.223.6 ± 0.03 b318.36 ± 2.35 a2.96 ± 0.01
p0.005 **0.05150.023 *0.0087 **0.1266
g.86049523C > T1CC (849)10,240 ± 60.9 Aa338 ± 2.73 Aa3.32 ± 0.03302.19 ± 1.99 Aa2.96 ± 0.01
TC (200)10,560 ± 77.78 Bb352.15 ± 3.36 Bb3.35 ± 0.03311.83 ± 2.45 Bb2.96 ± 0.01
TT (12)10,457 ± 242.54 ab330.84 ± 9.83 ab3.21 ± 0.1303.49 ± 7.17 ab2.92 ± 0.04
p<0.0001 **<.0001 **0.2535<0.0001 **0.4739
2CC (595)10,802 ± 63.12 a388.88 ± 2.84 a3.61 ± 0.03322.08 ± 2.05 a2.97 ± 0.01 a
TC (137)10,647 ± 86.89 ab385.9 ± 3.71 ab3.65 ± 0.04320.52 ± 2.73 a3 ± 0.01 Bb
TT (5)9933.02 ± 349.64 b351.83 ± 14.12 b3.54 ± 0.14294.92 ± 10.4 b2.98 ± 0.05 ab
p0.0091 **0.0236 *0.4408 0.0281 *0.0144 *
g.86049389C > T1CC (590)10,320 ± 62.88 Aa343.46 ± 2.8 Aa3.34 ± 0.03305.67 ± 2.04 Aa2.96 ± 0.01 a
CT (394)10,562 ± 66.66 Bb350.18 ± 2.95 Bb3.32 ± 0.03313.12 ± 2.15 Bb2.96 ± 0.01 a
TT (56)10,518 ± 118.53 ab341.71 ± 4.9 ab3.27 ± 0.05306.2 ± 3.57 ab2.92 ± 0.02 b
p<0.0001 **0.0023 **0.2859<0.0001 **0.0237 *
2CC (416)10,783 ± 65.86391.43 ± 2.93 a3.64 ± 0.03319.02 ± 2.142.97 ± 0.01
CT (277)10,725 ± 71.14384.63 ± 3.13 b3.61 ± 0.03318.2 ± 2.282.98 ± 0.01
TT (35)10,916 ± 149.18399.1 ± 6.14 a3.68 ± 0.06326.33 ± 4.483 ± 0.02
p0.35220.0053 **0.25850.16620.1656
Note: The number in the bracket represents the number of cows for the corresponding genotype; p shows the significance for the genetic effects of SNPs; a,b within the same column with different superscripts means p < 0.05; A,B within the same column with different superscripts means p < 0.01; * indicates p < 0.05; ** indicates p < 0.01.
Table 3. Associations of haplotype blocks with milk production traits in two lactations in Chinese Holstein (LSM ± SE).
BlockLactationHaplotype Combination (No.)Milk Yield (kg)Fat Yield (kg)Fat Percentage (%)Protein Yield (kg)Protein Percentage (%)
LPIN1-11H1H1 (614)10,244 ± 63.83 Aa341.58 ± 2.85 Aa3.35 ± 0.03302.9 ± 2.08 Aa2.96 ± 0.01
H1H2 (174)10,592 ± 80.33 Bb355.63 ± 3.45 B3.36 ± 0.03314.22 ± 2.52 B2.96 ± 0.01
H1H3 (223)10,374 ± 76.44 a340.98 ± 3.32 Aa3.31 ± 0.03306.43 ± 2.42 Aa2.96 ± 0.01
p<0.0001 **<0.0001 **0.1356<0.0001 **0.7979
2H1H1 (426)10,820 ± 66.83390.47 ± 2.98 a3.62 ± 0.03320.89 ± 2.172.97 ± 0.01 a
H1H2 (121)10,695 ± 92.24384.18 ± 3.95 ab3.61 ± 0.04320.77 ± 2.873 ± 0.01 b
H1H3 (158)10,797 ± 84.63382.69 ± 3.64 b3.56 ± 0.03318.51 ± 2.652.96 ± 0.01 a
p0.35320.0185 *0.16960.54620.01 *
LPIN1-21H1H1 (201)10,195 ± 81.19 Aa339.42 ± 3.383.32 ± 0.03303.29 ± 2.49 ac2.94 ± 0.01
H1H2 (227)10,498 ± 78.47 Bb346.15 ± 3.33.35 ± 0.03307.55 ± 2.39 bc2.95 ± 0.01
H1H3 (247)10,299 ± 76.23 ab340.2 ± 3.193.33 ± 0.03302.72 ± 2.35 a2.95 ± 0.01
H2H2 (80)10,398 ± 110.37 ab348.02 ± 4.383.36 ± 0.04307.48 ± 3.2 abc2.96 ± 0.01
H2H3 (183)10,332 ± 80.05 ab342.19 ± 3.373.32 ± 0.03308.35 ± 2.47 b2.96 ± 0.01
H3H3 (93)10,178 ± 104.38 a341.58 ± 4.093.36 ± 0.04302.3 ± 3.04 ac2.95 ± 0.01
p0.002 **0.12760.80470.0383 *0.8859
2H1H1 (134)10,632 ± 88.27 a387.72 ± 3.793.66 ± 0.04315.83 ± 2.76 Aa2.98 ± 0.01
H1H2 (154)10,907 ± 84.15 ab390.43 ± 3.633.58 ± 0.03323.03 ± 2.64 Cc2.97 ± 0.01
H1H3 (184)10,944 ± 80.55 b394.99 ± 3.493.62 ± 0.03323.2 ± 2.54 BCbc2.96 ± 0.01
H2H2 (54)10,909 ± 123.9 ab390.82 ± 5.153.58 ± 0.05322.46 ± 3.76 abc2.97 ± 0.02
H2H3 (121)10,748 ± 89.14 ab383.7 ± 3.813.57 ± 0.04315.33 ± 2.78 Aa2.94 ± 0.01
H3H3 (68)10,700 ± 109.38 ab387.14 ± 4.573.61 ± 0.04317.31 ± 3.33 abc2.97 ± 0.02
p0.0044 **0.07080.21620.0052 **0.3756
Note: H means haplotype; the number in the bracket represents the number of cows for the corresponding haplotype combination; LPIN1-1: H1(CC), H2(TT), H3(TC); LPIN1-2: H1(ACATC), H2(CTGCG), H3(CCGCC); p shows the significance for genetic effects among the haplotype blocks; * indicates p < 0.05; ** indicates p < 0.01; a,b,c within the same column with different superscripts means p < 0.05; A,B,C within the same column with different superscripts means p < 0.01.

