Ancient Mitochondrial Genomes Reveal the Absence of Maternal Kinship in the Burials of Çatalhöyük People and Their Genetic Affinities
Abstract
1. Introduction
2. Materials and Methods
3. Results
4. Discussion
5. Conclusions
Supplementary Materials
Author Contributions
Funding
Acknowledgments
Conflicts of Interest
References
- Hodder, I. Ethics and archaeology: The attempt at Çatalhöyük. East. Archaeol. 2002, 65, 174–181. [Google Scholar] [CrossRef]
- Düring, B.S.; Marciniak, A. Households and communities in the central Anatolian Neolithic. Archaeol. Dialogues 2005, 12, 165. [Google Scholar] [CrossRef]
- Hodder, I.; Pels, P. History houses: A new interpretation of architectural elaboration at Çatalhöyük. Relig. Emerg. Civiliz. Çatalhöük Case Study 2010, 163–186. [Google Scholar] [CrossRef]
- Düring, B.S. Constructing Communities: Clustered Neighbourhood Settlements of the Central Anatolian Neolithic ca. 8500–5500 cal. BC; Nederlands Instituut voor het Nabije Oosten: Leiden, The Netherlands, 2006. [Google Scholar]
- Mellaart, J. Çatal Hüyük: A Neolithic Town in Anatolia; McGraw-Hill: New York, NY, USA, 1967. [Google Scholar]
- Düring, B.S. Reconsidering the Çatalhöyük community: From households to settlement systems. J. Mediterr. Archaeol. 2007, 20, 155–182. [Google Scholar] [CrossRef]
- Pilloud, M.A.; Larsen, C.S. “Official” and “practical” kin: Inferring social and community structure from dental phenotype at Neolithic Çatalhöyük, Turkey. Am. J. Phys. Anthropol. 2011, 145, 519–530. [Google Scholar] [CrossRef] [PubMed]
- Ricaut, F.-X.; Auriol, V.; von Cramon-Taubadel, N.; Keyser, C.; Murail, P.; Ludes, B.; Crubézy, E. Comparison between morphological and genetic data to estimate biological relationship: The case of the Egyin Gol necropolis (Mongolia). Am. J. Phys. Anthropol. 2010, 143, 355–364. [Google Scholar] [CrossRef] [PubMed]
- Fernandes, D.; Sirak, K.; Novak, M.; Finarelli, J.A.; Byrne, J.; Connolly, E.; Carlsson, J.E.L.; Ferretti, E.; Pinhasi, R.; Carlsson, J. The Identification of a 1916 Irish Rebel: New Approach for Estimating Relatedness from Low Coverage Homozygous Genomes. Sci. Rep. 2017, 7, 41529. [Google Scholar] [CrossRef] [PubMed]
- Monroy Kuhn, J.M.; Jakobsson, M.; Günther, T. Estimating genetic kin relationships in prehistoric populations. PLoS ONE 2018, 13, e0195491. [Google Scholar] [CrossRef] [PubMed]
- Lipatov, M.; Sanjeev, K.; Patro, R.; Veeramah, K. Maximum Likelihood Estimation of Biological Relatedness from Low Coverage Sequencing Data. bioRxiv 2015. [Google Scholar] [CrossRef]
- Juras, A.; Chyleński, M.; Krenz-Niedbała, M.; Malmström, H.; Ehler, E.; Pospieszny, Ł.; Łukasik, S.; Bednarczyk, J.; Piontek, J.; Jakobsson, M.; et al. Investigating kinship of Neolithic post-LBK human remains from Krusza Zamkowa, Poland using ancient DNA. Forensic Sci. Int. Genet. 2017, 26, 30–39. [Google Scholar] [CrossRef] [PubMed]
- Brami, M.; Heyd, V. The origins of Europe’s first farmers: The role of Hacılar and western Anatolia, fifty years on. Praehist. Z. 2011, 86, 165–206. [Google Scholar] [CrossRef]
- Çilingiroğlu, Ç.; Çakırlar, C. Towards configuring the neolithisation of Aegean Turkey. Doc. Praehist. 2013, 40, 21–29. [Google Scholar] [CrossRef]
- Özdoğan, M. Archaeological evidence on the westward expansion of farming communities from eastern Anatolia to the Aegean and the Balkans. Curr. Anthropol. 2011, 52, S415–S430. [Google Scholar] [CrossRef]
- Baird, D. The Late Epipaleolithic, Neolithic, and Chalcolithic of the Anatolian Plateau, 13,000–4000 BC. In A Companion to the Archaeology of the Ancient Near East; Wiley-Blackwell: Hoboken, NJ, USA, 2012; pp. 431–465. ISBN 978-1-4443-6079-0. [Google Scholar]
- Baird, D.; Fairbairn, A.; Martin, L.; Middleton, C. The Boncuklu Project: The origins of sedentism, cultivation and herding in central Anatolia. In The Neolithic in Turkey: New Excavations and New Research-Central Turkey; Archaeology and Art Publications: Istanbul, Turkey, 2012. [Google Scholar]
- Baird, D.; Fairbairn, A.; Jenkins, E.; Martin, L.; Middleton, C.; Pearson, J.; Asouti, E.; Edwards, Y.; Kabukcu, C.; Mustafaoğlu, G.; et al. Agricultural origins on the Anatolian plateau. Proc. Natl. Acad. Sci. USA 2018, 115, E3077. [Google Scholar] [CrossRef] [PubMed]
- Gérard, F.-L.T. The Neolithic of Central Anatolia. Internal Developments and External Relations during the 9th–6th Millennia cal BC; Ege Yayınları: Istanbul, Turkey, 2002; ISBN 978-975-8070-52-7. [Google Scholar]
- Schoop, U.-D. The Late Escape of the Neolithic from the Central Anatolian Plain. In How Did Farming Reach Europe? Anatolian-European Relations from the Second Half of the 7th through to the First Half of the 6th Millennium cal BC. Proceedings of the International Workshop Istanbul, 20–22 May 2004. Byzas 2; Lichter, C., Ed.; Ege Yayinlari: Istanbul, Turkey, 2005; pp. 41–58. ISBN 975-8071-06-8. [Google Scholar]
- Arbuckle, B.S.; Kansa, S.W.; Kansa, E.; Orton, D.; Çakırlar, C.; Gourichon, L.; Atici, L.; Galik, A.; Marciniak, A.; Mulville, J.; et al. Data Sharing Reveals Complexity in the Westward Spread of Domestic Animals across Neolithic Turkey. PLoS ONE 2014, 9, e99845. [Google Scholar] [CrossRef] [PubMed]
- Horejs, B.; Milić, B.; Ostmann, F.; Thanheiser, U.; Weninger, B.; Galik, A. The Aegean in the Early 7th Millennium BC: Maritime Networks and Colonization. J. World Prehist. 2015, 28, 289–330. [Google Scholar] [CrossRef] [PubMed]
- Nazaroff, A.J.; Baysal, A.; Çiftçi, Y.; Prufer, K. Resilience and Redundance: Resource Networks and the Neolithic Chert Economy at Çatalhöyük, Turkey. Eur. J. Archaeol. 2015, 18, 402–428. [Google Scholar] [CrossRef]
- Poupeau, G.; Le Bourdonnec, F.-X.; Carter, T.; Delerue, S.; Steven Shackley, M.; Barrat, J.-A.; Dubernet, S.; Moretto, P.; Calligaro, T.; Milić, M.; et al. The use of SEM-EDS, PIXE and EDXRF for obsidian provenance studies in the Near East: A case study from Neolithic Çatalhöyük (central Anatolia). J. Archaeol. Sci. 2010, 37, 2705–2720. [Google Scholar] [CrossRef]
- Marciniak, A. Bridging up Anatolia. Çatalhöyük and northwestern Anatolia in the Late Neolithic. In Amici Magistro et Collegae suo Ioanni Christopho Kozłowski Dedicant; Valde-Nowak, P., Sobczyk, K., Nowak, M., Źrałka, J., Eds.; Institute of Archaeology, Jagiellonian University, Alter Publishing House: Kraków, Poland, 2018; pp. 281–290. ISBN 978-83-948382-3-2. [Google Scholar]
- Karul, N.; Avci, M.B. Neolithic communities in the eastern Marmara region: Aktopraklik C. Anatolica 2011, 37, 1–15. [Google Scholar]
- Özdoğan, M.; Krauβ, R. An Anatolian perspective on the Neolithization process in the Balkans. New questions, new prospects. In Beginnings–New Research Appearance Neolithic Northwest Anatolia Carpathian Basin; VML: Rahden, Germany, 2011; pp. 23–33. [Google Scholar]
- Mathieson, I.; Lazaridis, I.; Rohland, N.; Mallick, S.; Patterson, N.; Roodenberg, S.A.; Harney, E.; Stewardson, K.; Fernandes, D.; Novak, M. Genome-wide patterns of selection in 230 ancient Eurasians. Nature 2015, 528, 499–503. [Google Scholar] [CrossRef] [PubMed]
- Omrak, A.; Günther, T.; Valdiosera, C.; Svensson, E.M.; Malmström, H.; Kiesewetter, H.; Aylward, W.; Storå, J.; Jakobsson, M.; Götherström, A. Genomic Evidence Establishes Anatolia as the Source of the European Neolithic Gene Pool. Curr. Biol. 2015, 26, 270–275. [Google Scholar] [CrossRef] [PubMed]
- Kılınç, G.M.; Omrak, A.; Özer, F.; Günther, T.; Büyükkarakaya, A.M.; Bıçakçı, E.; Baird, D.; Dönertaş, H.M.; Ghalichi, A.; Yaka, R.; et al. The Demographic Development of the First Farmers in Anatolia. Curr. Biol. 2016, 26, 2659–2666. [Google Scholar] [CrossRef] [PubMed]
- Cessford, C. A new dating sequence for Çatalhöyük. Antiquity 2001, 75, 717–725. [Google Scholar] [CrossRef]
- Allentoft, M.E.; Sikora, M.; Sjogren, K.-G.; Rasmussen, S.; Rasmussen, M.; Stenderup, J.; Damgaard, P.B.; Schroeder, H.; Ahlstrom, T.; Vinner, L.; et al. Population genomics of Bronze Age Eurasia. Nature 2015, 522, 167–172. [Google Scholar] [CrossRef] [PubMed]
- Yang, D.Y.; Eng, B.; Waye, J.S.; Dudar, J.C.; Saunders, S.R. Technical note: Improved DNA extraction from ancient bones using silica-based spin columns. Am. J. Phys. Anthropol. 1998, 105, 539–543. [Google Scholar] [CrossRef]
- Svensson, E.M.; Anderung, C.; Baubliene, J.; Persson, P.; Malmström, H.; Smith, C.; Vretemark, M.; Daugnora, L.; Götherström, A. Tracing genetic change over time using nuclear SNPs in ancient and modern cattle. Anim. Genet. 2007, 38, 378–383. [Google Scholar] [CrossRef] [PubMed]
- Lampa, S.; Dahlö, M.; Olason, P.I.; Hagberg, J.; Spjuth, O. Lessons learned from implementing a national infrastructure in Sweden for storage and analysis of next-generation sequencing data. GigaScience 2013, 2, 9. [Google Scholar] [CrossRef] [PubMed]
- Juras, A.; Chyleński, M.; Ehler, E.; Malmström, H.; Żurkiewicz, D.; Włodarczak, P.; Wilk, S.; Peška, J.; Fojtík, P.; Králík, M.; et al. Mitochondrial genomes reveal an east to west cline of steppe ancestry in Corded Ware populations. Sci. Rep. 2018, 8, 11603. [Google Scholar] [CrossRef] [PubMed]
- Günther, T.; Valdiosera, C.; Malmström, H.; Ureña, I.; Rodriguez-Varela, R.; Sverrisdóttir, Ó.O.; Daskalaki, E.A.; Skoglund, P.; Naidoo, T.; Svensson, E.M. Ancient genomes link early farmers from Atapuerca in Spain to modern-day Basques. Proc. Natl. Acad. Sci. USA 2015, 112, 11917–11922. [Google Scholar] [CrossRef] [PubMed]
- Meyer, M.; Kircher, M. Illumina sequencing library preparation for highly multiplexed target capture and sequencing. Cold Spring Harb. Protoc. 2010, 2010, t5448. [Google Scholar] [CrossRef] [PubMed]
- Li, H.; Durbin, R. Fast and accurate short read alignment with Burrows–Wheeler transform. Bioinformatics 2009, 25, 1754–1760. [Google Scholar] [CrossRef] [PubMed]
- Andrews, R.M.; Kubacka, I.; Chinnery, P.F.; Lightowlers, R.N.; Turnbull, D.M.; Howell, N. Reanalysis and revision of the Cambridge reference sequence for human mitochondrial DNA. Nat. Genet. 1999, 23, 147. [Google Scholar] [CrossRef] [PubMed]
- Anderson, S.; Bankier, A.T.; Barrell, B.G.; de Bruijn, M.H.; Coulson, A.R.; Drouin, J.; Eperon, I.C.; Nierlich, D.P.; Roe, B.A.; Sanger, F. Sequence and organization of the human mitochondrial genome. Nature 1981, 290, 457. [Google Scholar] [CrossRef] [PubMed]
- Skoglund, P.; Storå, J.; Götherström, A.; Jakobsson, M. Accurate sex identification of ancient human remains using DNA shotgun sequencing. J. Archaeol. Sci. 2013, 40, 4477–4482. [Google Scholar] [CrossRef]
- Li, H.; Handsaker, B.; Wysoker, A.; Fennell, T.; Ruan, J.; Homer, N.; Marth, G.; Abecasis, G.; Durbin, R.; 1000 Genome Project Data Processing Subgroup. The Sequence Alignment/Map format and SAMtools. Bioinform. Oxf. Engl. 2009, 25, 2078–2079. [Google Scholar] [CrossRef] [PubMed]
- Jónsson, H.; Ginolhac, A.; Schubert, M.; Johnson, P.L.; Orlando, L. mapDamage2.0: Fast approximate Bayesian estimates of ancient DNA damage parameters. Bioinformatics 2013, 29, 1682–1684. [Google Scholar] [CrossRef] [PubMed]
- Fu, Q.; Mittnik, A.; Johnson, P.L.F.; Bos, K.; Lari, M.; Bollongino, R.; Sun, C.; Giemsch, L.; Schmitz, R.; Burger, J.; et al. A Revised Timescale for Human Evolution Based on Ancient Mitochondrial Genomes. Curr. Biol. 2013, 23, 553–559. [Google Scholar] [CrossRef] [PubMed]
- Renaud, G.; Slon, V.; Duggan, A.T.; Kelso, J. Schmutzi: Estimation of contamination and endogenous mitochondrial consensus calling for ancient DNA. Genome Biol. 2015, 16, 224. [Google Scholar] [CrossRef] [PubMed]
- Korneliussen, T.S.; Albrechtsen, A.; Nielsen, R. ANGSD: Analysis of Next Generation Sequencing Data. BMC Bioinform. 2014, 15, 356. [Google Scholar] [CrossRef] [PubMed]
- Chyleński, M.; Juras, A.; Ehler, E.; Malmström, H.; Piontek, J.; Jakobsson, M.; Marciniak, A.; Dabert, M. Late Danubian mitochondrial genomes shed light into the Neolithisation of Central Europe in the 5(th) millennium BC. BMC Evol. Biol. 2017, 17, 80. [Google Scholar] [CrossRef] [PubMed]
- Vianello, D.; Sevini, F.; Castellani, G.; Lomartire, L.; Capri, M.; Franceschi, C. HAPLOFIND: A New Method for High-Throughput mtDNA Haplogroup Assignment. Hum. Mutat. 2013, 34, 1189–1194. [Google Scholar] [CrossRef] [PubMed]
- Weissensteiner, H.; Pacher, D.; Kloss-Brandstätter, A.; Forer, L.; Specht, G.; Bandelt, H.-J.; Kronenberg, F.; Salas, A.; Schönherr, S. HaploGrep 2: Mitochondrial haplogroup classification in the era of high-throughput sequencing. Nucleic Acids Res. 2016, 44, W58–W63. [Google Scholar] [CrossRef] [PubMed]
- Van Oven, M.; Kayser, M. Updated comprehensive phylogenetic tree of global human mitochondrial DNA variation. Hum. Mutat. 2009, 30, E386–E394. [Google Scholar] [CrossRef] [PubMed]
- Robinson, J.T.; Thorvaldsdóttir, H.; Winckler, W.; Guttman, M.; Lander, E.S.; Getz, G.; Mesirov, J.P. Integrative genomics viewer. Nat. Biotechnol. 2011, 29, 24–26. [Google Scholar] [CrossRef] [PubMed]
- Moravčík, O.; Ehler, E.; Novotný, J.; Pačes, J.; Juras, A.; Chyleński, M. AmtDB: A database of ancient human mitochondrial genomes. Nucleic Acids Res. 2018, 47, D29–D32. [Google Scholar]
- Brandt, G.; Haak, W.; Adler, C.J.; Roth, C.; Szécsényi-Nagy, A.; Karimnia, S.; Möller-Rieker, S.; Meller, H.; Ganslmeier, R.; Friederich, S. Ancient DNA reveals key stages in the formation of central European mitochondrial genetic diversity. Science 2013, 342, 257–261. [Google Scholar] [CrossRef] [PubMed]
- Lazaridis, I.; Patterson, N.; Mittnik, A.; Renaud, G.; Mallick, S.; Kirsanow, K.; Sudmant, P.H.; Schraiber, J.G.; Castellano, S.; Lipson, M.; et al. Ancient human genomes suggest three ancestral populations for present-day Europeans. Nature 2014, 513, 409–413. [Google Scholar] [CrossRef] [PubMed]
- Haak, W.; Lazaridis, I.; Patterson, N.; Rohland, N.; Mallick, S.; Llamas, B.; Brandt, G.; Nordenfelt, S.; Harney, E.; Stewardson, K.; et al. Massive migration from the steppe was a source for Indo-European languages in Europe. Nature 2015, 522, 207–211. [Google Scholar] [CrossRef] [PubMed]
- Pedregosa, G.; Varoquaux, A.; Gramfort, V.; Michel, B.; Thirion, O.; Grisel, M.; Blondel, P.; Prettenhofer, R.; Weiss, V.; Dubourg, J.; et al. Duchesnay, Scikit-learn: Machine Learning in Python. J. Mach. Learn. Res. 2011, 12, 2825–2830. [Google Scholar]
- Hunter, J.D. Matplotlib: A 2D graphics environment. Comput. Sci. Eng. 2007, 9, 90–95. [Google Scholar] [CrossRef]
- Van der Maaten, L.; Hinton, G. Visualizing data using t-SNE. J. Mach. Learn. Res. 2008, 9, 2579–2605. [Google Scholar]
- Excoffier, L.; Lischer, H.E.L. Arlequin suite ver 3.5: A new series of programs to perform population genetics analyses under Linux and Windows. Mol. Ecol. Resour. 2010, 10, 564–567. [Google Scholar] [CrossRef] [PubMed]
- Nei, M.; Li, W.H. Mathematical model for studying genetic variation in terms of restriction endonucleases. Proc. Natl. Acad. Sci. USA 1979, 76, 5269–5273. [Google Scholar] [CrossRef] [PubMed]
- Marciniak, A.; Barański, M.Z.; Bayliss, A.; Czerniak, L.; Goslar, T.; Southon, J.; Taylor, R.E. Fragmenting times: Interpreting a Bayesian chronology for the Late Neolithic occupation of Çatalhöyük East, Turkey. Antiquity 2015, 89, 154–176. [Google Scholar] [CrossRef]
- Tylor, J. Excavations in the South Area. In Çatalhöyük 2012 Archive Report; Tung, B., Ed.; Çatalhöyük Research Project: Çatalhöyük, Turkey, 2012; pp. 35–61. [Google Scholar]
- Mills, B.J. Relational Networks and Religious Sodalities at Çatalhöyük. In Religion at Work in a Neolithic Society: Vital Matters; Hodder, I., Ed.; Cambridge University Press: Cambridge, UK, 2014; pp. 159–186. ISBN 978-1-107-04733-4. [Google Scholar]
- Hodder, I. More on history houses at Çatalhöyük: A response to Carleton et al. J. Archaeol. Sci. 2016, 67, 1–6. [Google Scholar] [CrossRef]
- Bıçakçı, E.; Godon, M.; Çakan, Y.G. Tepecik-Çiftlik. In The Neolithic in Turkey; Özdoğan, M., Başgelen, N., Kuniholm, P., Eds.; Archaeology and Art Publications: İstanbul, Turkey, 2012; Volume 3, pp. 89–134. ISBN 978-605-396-199-4. [Google Scholar]
- Renfrew, C.; Boyle, K.V. Archaeogenetics: DNA and the Population Prehistory of Europe; McDonald Institute of Archeological Research: Cambridge, UK, 2000; ISBN 1-902937-08-2. [Google Scholar]
- Gronenborn, D. Beyond the models: Neolithisation in Central Europe. Proc. Br. Acad. 2007, 144, 73–98. [Google Scholar]
- Lazaridis, I.; Nadel, D.; Rollefson, G.; Merrett, D.C.; Rohland, N.; Mallick, S.; Fernandes, D.; Novak, M.; Gamarra, B.; Sirak, K. Genomic insights into the origin of farming in the ancient Near East. Nature 2016, 536, 419–424. [Google Scholar] [CrossRef] [PubMed]
- Bramanti, B.; Thomas, M.G.; Haak, W.; Unterlaender, M.; Jores, P.; Tambets, K.; Antanaitis-Jacobs, I.; Haidle, M.N.; Jankauskas, R.; Kind, C.-J. Genetic discontinuity between local hunter-gatherers and central Europe’s first farmers. Science 2009, 326, 137–140. [Google Scholar] [CrossRef] [PubMed]
- Haak, W.; Balanovsky, O.; Sanchez, J.J.; Koshel, S.; Zaporozhchenko, V.; Adler, C.J.; Der Sarkissian, C.S.; Brandt, G.; Schwarz, C.; Nicklisch, N. Ancient DNA from European early neolithic farmers reveals their near eastern affinities. PLoS Biol. 2010, 8, e1000536. [Google Scholar] [CrossRef] [PubMed]
- Özdoğan, M. A new look at the introduction of the Neolithic way of life in Southeastern Europe. Changing paradigms of the expansion of the Neolithic way of life. Doc. Praehist. 2014, 41, 33–49. [Google Scholar] [CrossRef]
- Perlès, C. The Early Neolithic in Greece: The First Farming Communities in Europe; Cambridge University Press: Cambridge, UK; New York, NY, USA, 2001; ISBN 978-0-521-00027-7. [Google Scholar]
- Özdoğan, E. Current Research and New Evidence for the Neolithization Process in Western Turkey. Eur. J. Archaeol. 2015, 18, 33–59. [Google Scholar] [CrossRef]


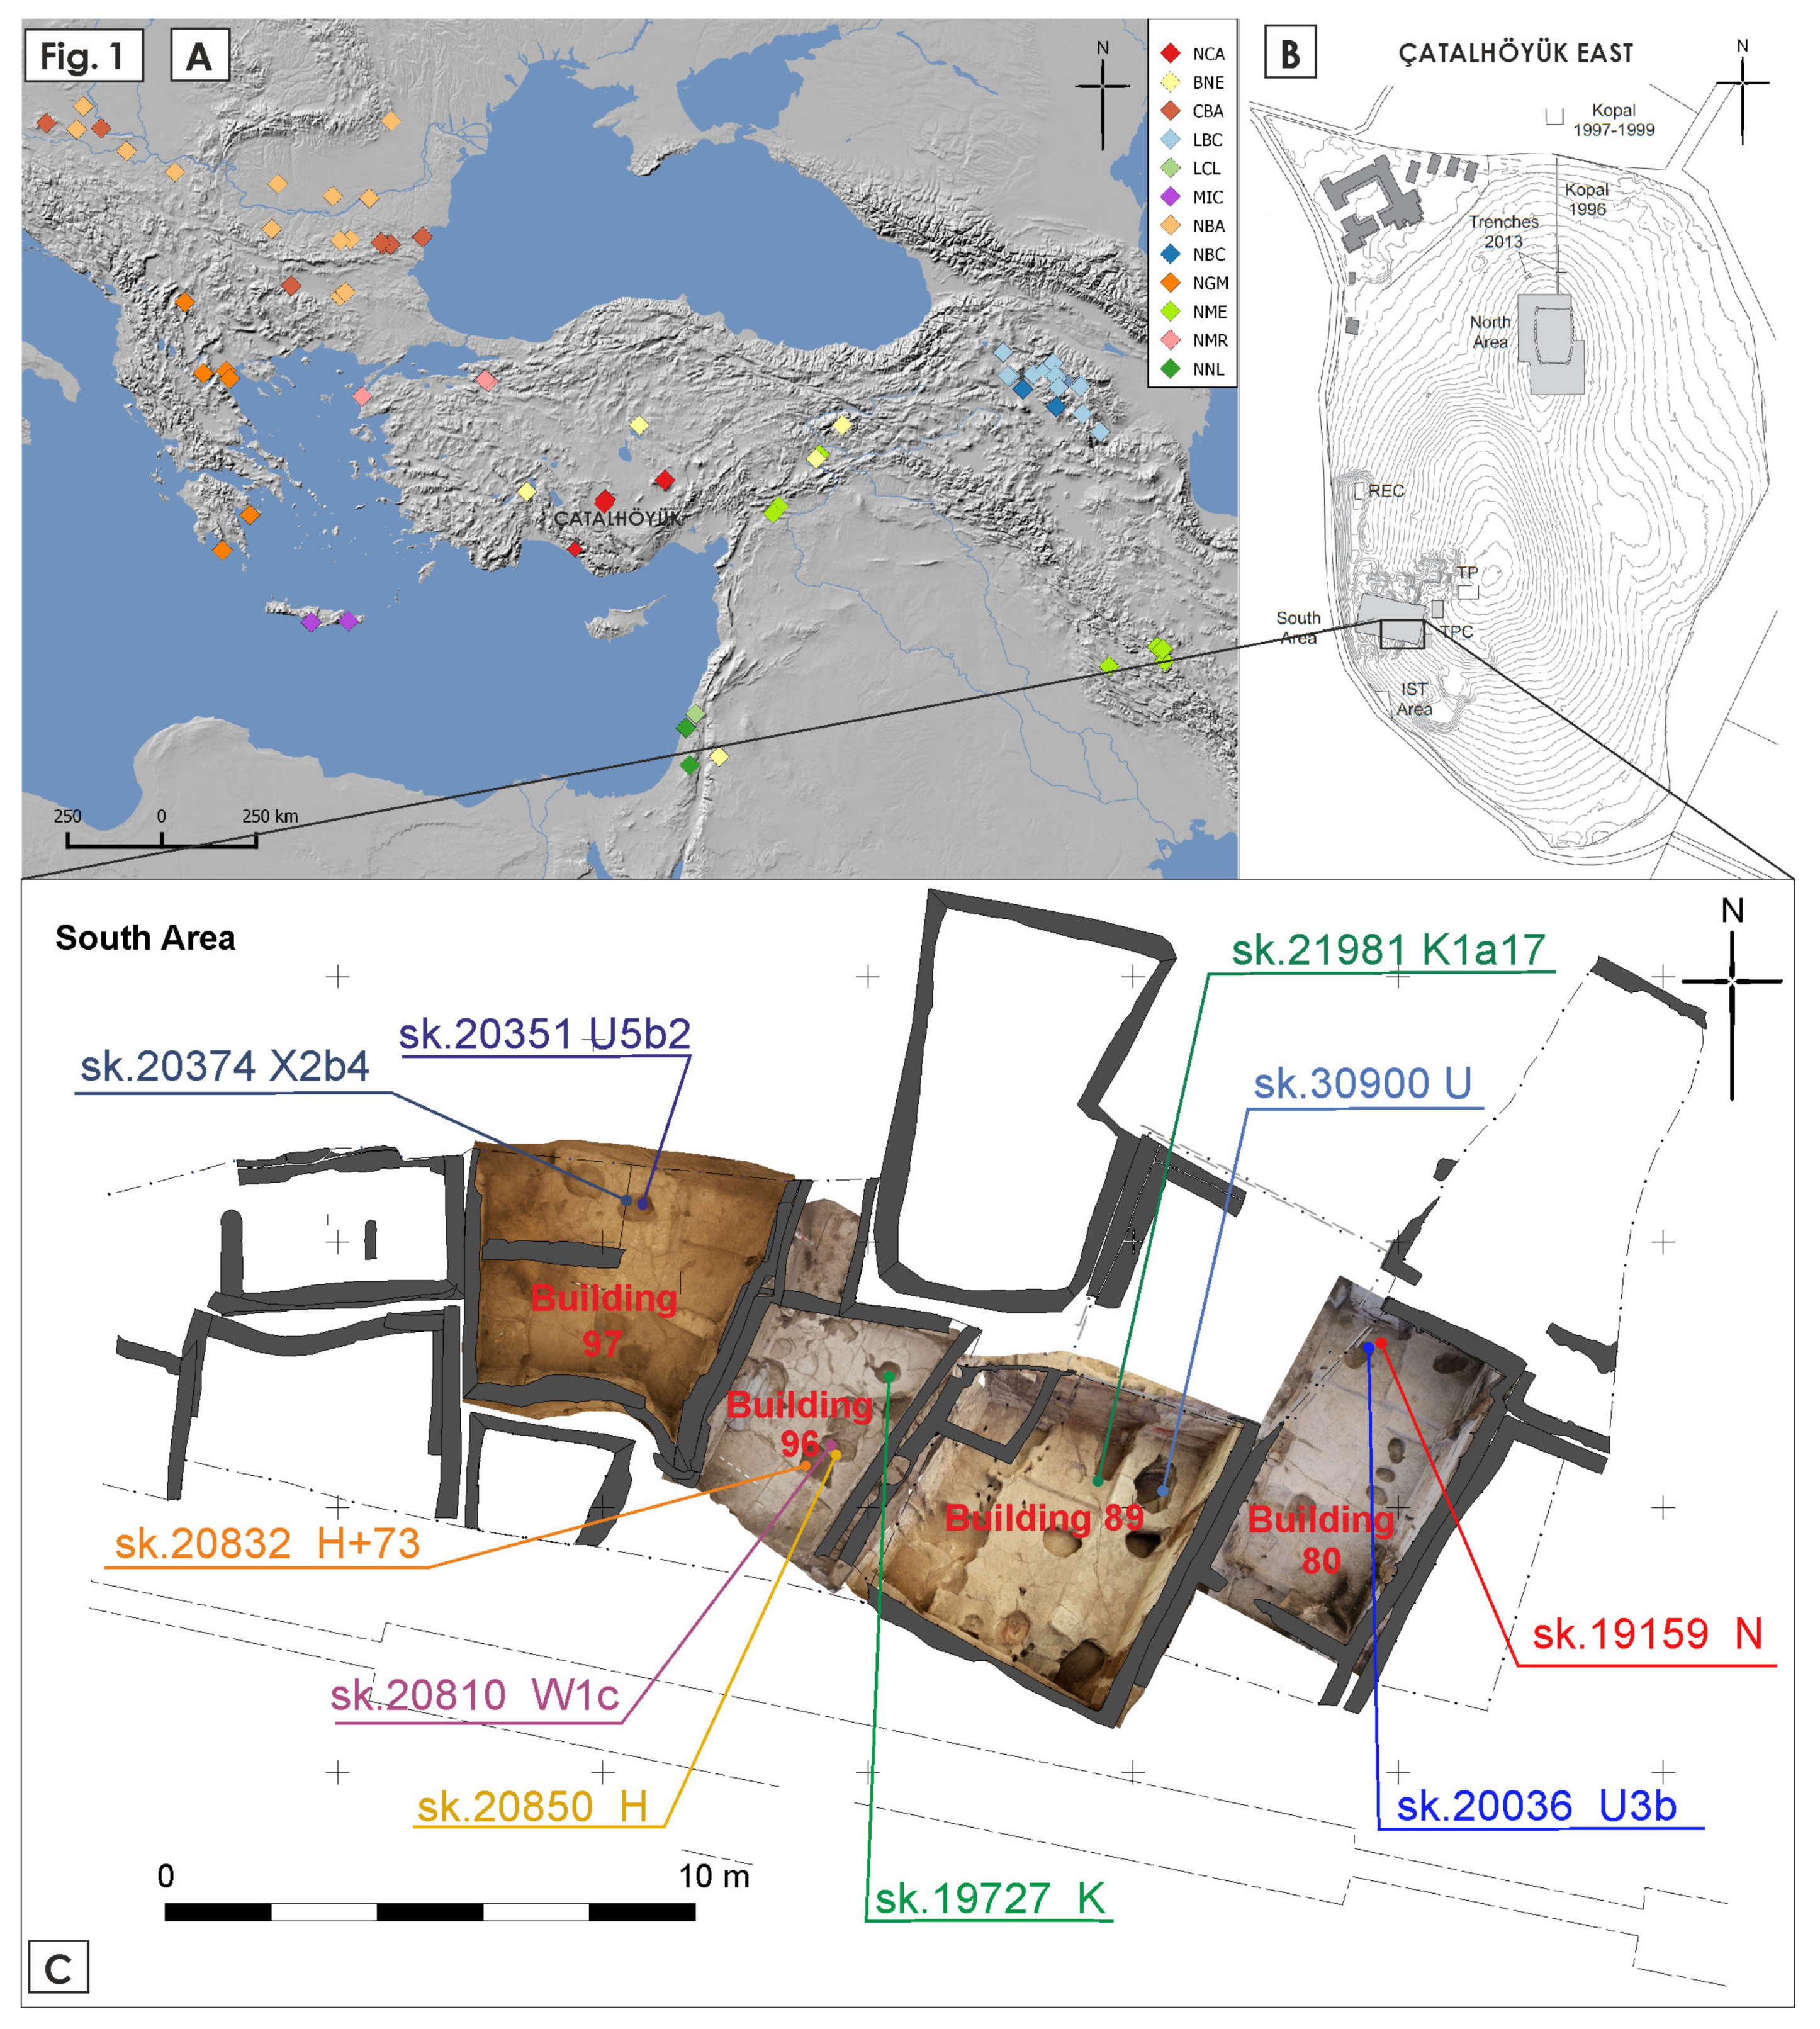
| Skeleton Number | Building | Age at Death | Morphological Sex | Proportion of Human DNA (%) | Mt Coverage | Molecular Sex | Mitochondrial Haplogroup |
|---|---|---|---|---|---|---|---|
| 20036 | 80 | child (3–12) | n.a. | 3.3 | 235.94 | Probable XY (0.0729) | U3b |
| 19159 | 80 | adolescent (12–20) | n.a. | 4.5 | 14.30 | Probable XY (0.0783) | N |
| 21981 | 89 | infant (0–3) | n.a. | 26.6 | 8.14 | XX (0.0005) | K1a17 |
| 30900 | 89 | infant (0–3) | n.a. | 1.0 | 35.07 | Probable XY (0.0665) | U |
| 20810 | 96 | adult (20+) | male? | 0.5 | 21.34 | Not assigned | W1c |
| 19727 | 96 | child (3–12) | n.a. | 2.0 | 24.83 | XY (0.107) | K |
| 20832 | 96 | older adult (50+) | female? | 0.6 | 7.18 | XX (0.0042) | H+73 |
| 20850 | 96 | child (3–12) | n.a. | 0.5 | 10.02 | XX (0.0027) | H |
| 20374 | 97 | mature adult(35–50) | male? | 1.3 | 41.40 | Not assigned | X2b4 |
| 20351 | 97 | adolescent (12–20) | female? | 0.6 | 17.91 | Not assigned | U5b2 |
© 2019 by the authors. Licensee MDPI, Basel, Switzerland. This article is an open access article distributed under the terms and conditions of the Creative Commons Attribution (CC BY) license (http://creativecommons.org/licenses/by/4.0/).
Share and Cite
Chyleński, M.; Ehler, E.; Somel, M.; Yaka, R.; Krzewińska, M.; Dabert, M.; Juras, A.; Marciniak, A. Ancient Mitochondrial Genomes Reveal the Absence of Maternal Kinship in the Burials of Çatalhöyük People and Their Genetic Affinities. Genes 2019, 10, 207. https://doi.org/10.3390/genes10030207
Chyleński M, Ehler E, Somel M, Yaka R, Krzewińska M, Dabert M, Juras A, Marciniak A. Ancient Mitochondrial Genomes Reveal the Absence of Maternal Kinship in the Burials of Çatalhöyük People and Their Genetic Affinities. Genes. 2019; 10(3):207. https://doi.org/10.3390/genes10030207
Chicago/Turabian StyleChyleński, Maciej, Edvard Ehler, Mehmet Somel, Reyhan Yaka, Maja Krzewińska, Mirosława Dabert, Anna Juras, and Arkadiusz Marciniak. 2019. "Ancient Mitochondrial Genomes Reveal the Absence of Maternal Kinship in the Burials of Çatalhöyük People and Their Genetic Affinities" Genes 10, no. 3: 207. https://doi.org/10.3390/genes10030207
APA StyleChyleński, M., Ehler, E., Somel, M., Yaka, R., Krzewińska, M., Dabert, M., Juras, A., & Marciniak, A. (2019). Ancient Mitochondrial Genomes Reveal the Absence of Maternal Kinship in the Burials of Çatalhöyük People and Their Genetic Affinities. Genes, 10(3), 207. https://doi.org/10.3390/genes10030207


