Article

The Mitochondrial Genomes of Neuropteridan Insects and Implications for the Phylogeny of Neuroptera

1
College of Plant Protection, Henan Agricultural University, Zhengzhou 450002, China
2
Department of Plant and Animal Production, Kirsehir Vocational School of Technical Sciences, Ahi Evran University, 40100 Kirsehir, Turkey
*
Authors to whom correspondence should be addressed.
Genes 2019, 10(2), 108; https://doi.org/10.3390/genes10020108
Submission received: 26 December 2018 / Revised: 23 January 2019 / Accepted: 29 January 2019 / Published: 1 February 2019
(This article belongs to the Special Issue Mitochondrial Genomes: Genetic and Transcriptomic Studies)

Abstract

:
The higher-level phylogeny of Neuroptera is explored here based on the newly determined mitochondrial genomic data, with a special focus on the interfamilial relationships of this group. Despite considerable progress in our understanding of neuropteran relationships, several mutually exclusive hypotheses have come out according to morphology-based analyses and molecular sequence data. The evaluation of these hypotheses is hampered by the limited taxonomic coverage of previous studies. In this paper, we sequenced four mitochondrial genomes to improve the taxonomic sampling for families: Myrmeleontidae, Ascalaphidae and outgroup Corydalidae. Phylogenetic analyses were run using various inference methods to (1) confirm that Coniopterygidae is sister to all other Neuroptera; (2) place Hemerobiidae as sister to Chrysopidae; (3) support the monophyly of Myrmeleontiformia and define its interfamilial relationships; and (4) recover Myrmeleontidae as paraphyletic due to the nested Ascalaphidae.

1. Introduction

Neuropterida is an early-diverging lineage of holometabolous insects with nearly 6500 described species classified into 20 families [1]. This group is generally recognized as an insect superorder, consisting of the orders Neuroptera (lacewings, mantidflies, antlions and their relatives), Megaloptera (alderflies, dobsonflies and fishflies) and Raphidioptera (snakeflies). Neuroptera is a relatively large clade within Neuropterida, including about 6000 species in 15~17 families [2,3,4]. The monophyly of Neuroptera has been well supported by morphological and molecular data [2,4,5], although its internal relationships are still under debate [3].
Based on the morphological characters, the taxon Neuroptera is divided into three suborders Nevrorthiformia, Myrmeleontiformia and Hemerobiiformia [2,6,7]. Antlions (Myrmeleontiformia: Myrmeleontidae) are composed of over 1630 species [8] and form the most diverse family within Neuropterida. The antlions are well known for their remarkable pit building behavior. Larvae of some species are able to construct pitfall traps in loose material to catch ants or other prey. Moreover, larvae of antlions exhibit distinguished morphological characteristics [9], such as the complex piercing and sucking mouthparts. Determining the phylogenetic relationship of antlions to other neuropteran insects is a critical step toward categorizing their biological diversity. A cladistic analysis based on morphological characters indicated a sister-group relationship between Myrmeleontidae and Ascalaphidae [2]. This hypothesis is further corroborated by molecular studies based on multiple genes [10] and mitochondrial genome sequences [11,12,13]. However, some analyses demonstrated the paraphyly of Myrmeleontidae, with regard to Ascalaphidae [4,5,14].
Mitochondrial genomes have been widely utilized for insect phylogeny reconstruction [5,11,12,13,15,16,17,18,19,20,21,22,23]. Recent studies have demonstrated that mitochondrial genome sequences are useful for resolving the higher-level relationships within Neuropterida [5,11,12,13]. As of November 2018, 45 complete or nearly complete neuropteran mitogenomes from sixteen families are available on GenBank. Although these molecular data contributed to the resolution of neuropteran relationships in recent studies [11,12,13], the number of sequenced species was still limited in comparison to the total number of known Neuroptera species. In this paper, we determined mitochondrial genome sequences for two species from the family Myrmeleontidae (Neuroptera), one from both Ascalaphidae (Neuroptera) and Corydalidae (Megaloptera), using next-generation sequencing approach, to improve taxonomic sampling for the reconstruction of phylogenetic relationships within Neuroptera.
In the phylogenetic analyses of combined mtDNA gene sequences, some species from both outgroup (i.e., Xanthostigma gobicola in Raphidioptera) and ingroup (i.e., four representatives of Coniopterygidae and Dilaridae in Neuroptera) displayed the obviously long branch lengths. The maximum likelihood analyses using the site-homogeneous GTR model resulted in a non-monophyletic Neuroptera, due to the outside position of Coniopterygidae. The potential long-branch attraction between Raphidioptera and Coniopterygidae may lead to unexpected result. Sequence comparative analyses showed that current mitogenomic data was affected by both nucleotide compositional heterogeneity and rate heterogeneity, because the sequences leading to the long-branched taxa were more heterogeneous than others and had the higher nonsynonymous substitution rate. Recent studies have suggested that the site-heterogeneous CAT-GTR model [24] implemented in PhyloBayes [25,26] can reduce the systematic errors [27,28] and improved the accuracy of phylogenetic reconstruction using mitogenomic data [5,17,18,19,22,23,29]. The site-heterogeneous CAT-GTR model can better account for data heterogeneities by the Dirichlet processes [24,25]. Different categories of substitution processes are estimated for sequence sites and the global exchange rates can be inferred from the data [25]. The site-heterogeneous CAT-GTR model is thus more effective in handling LBA artifacts than the site-homogeneous model.
The aim of this study is to investigate the interfamilial relationships of Neuroptera by using the expanded mitochondrial genome sequence data, with an emphasis on the affinity of Myrmeleontidae with Ascalaphidae. The site-heterogeneous CAT-GTR model recovered the monophyly of Neuroptera and supported the Myrmeleontidae as a paraphyletic group with respect to Ascalaphidae.

2. Materials and Methods

2.1. Taxonomic Sampling

Taxa examined here included 49 neuropteran taxa which represented 16 families [3,4] recognized in this order (Table 1). This study also included available mitochondrial genomes of three species from Megaloptera and of three species from Raphidioptera for outgroup comparison [4,5,13].
Samples of two species from Myrmeleontidae (Dendroleon pantherinus and Euroleon nostras), of one species from both Ascalaphidae (Suhpalacsa sp.) and Corydalidae (Neochauliodes punctatolosus) were collected from Three-lake in Guangshui, Hubei, China. The specimens were preserved in 95% ethanol and stored at −20 ℃ for further sequencing. Voucher specimens have been deposited at the Entomological Museum of Henan Agricultural University.

2.2. Molecular Data Collection

Total genomic DNA was extracted from the thoracic muscle of individual specimen using the TIANamp Micro DNA Kit (TIANGEN BIOTECH CO., LTD, Beijing, China), following manufacturers’ instructions. The DNA concentration was measured by Nucleic acid-protein analyzer (QUAWELL TECHNOLOGY INC., Sunnyvale, CA, United States).
Genomic DNA for each sample was added into four different libraries, respectively. Besides the species determined in this study, each library also contained 20 unrelated samples, which are the insect species from the Hemiptera or Coleoptera. Equimolar amounts of genomic DNA from each sample were mixed into the library to improve the sequencing efficiency of each species. Libraries were prepared by using the Illumina TruSeqTM DNA Sample Prep Kit (Illumina, San Diego, CA, USA), with the insert size of 350 bp. The subsequent sequencing was conducted in a single lane with 150 bp PE reads on an Illumina HiSeq X Ten platform (Beijing Novogene Bioinformatics Technology Co., Ltd, Beijing, China).
Raw reads were filtered with NGS QC Toolkit using default settings [30]. Reads containing adapters and poly-N and low-quality reads were removed from raw data. At the same time, phred quality scores of 20 and 30 (i.e., Q20 means that the chances of this base being called incorrectly are 1 in 100 and Q30 means 1 in 1000), GC-content and sequence duplication level of the cleaned data were calculated. All the downstream analyses were based on clean data with high quality (avg. Q20 > 90% and avg. Q30 > 80%). De novo assembly for data from pooled sequencing was performed with IDBA-UD v. 1.1.1 [31]. The assemblies were constructed using 200 for the setting of the minimum size of a contig and an initial k-mer size of 40, an iteration size of 10 and a maximum k-mer size of 90.
The mitogenomic assemblies were identified by blasting with the prior mitochondrial baiting sequences (cox1-5’) of four neuropteridan species newly sequenced in this study, which were amplified by standard PCR reactions with the primers designed by Song et al. (2016) [22]. The mitochondrial genome annotations were conducted using the MITOS server [32], under default settings and the invertebrate genetic code for the mitochondrial DNA. The gene boundaries were further refined by alignment with homologous sequences of neuropteridan species (see Table 1 for details). To check the quality of the assembled mtDNA sequences, the mappings to the mitochondrial contigs were conducted using BWA v. 0.7.5 [33]. Alignments produced in SAM format were converted to sorted BAM format by SAMtools v. 0.1.19 [34]. Statistics for nucleotide coverage were generated with Qualimap v.2.2.1 [35].

2.3. Sequence Alignment

DNA sequences were aligned separately for each protein-coding gene in TranslatorX [36], with the invertebrate genetic code and using MAFFT [37] for the amino-acid alignment. At the same time, Gblocks v.0.91b [38] was applied to remove the ambiguously aligned positions, with all options for a less stringent selection. RNA genes were separately aligned using MAFFT under the iterative refinement method incorporating the most accurate local pairwise alignment information (E-INS-i) and ambiguously aligned sites were pruned using Gblocks with the same settings mentioned above. Gaps in the alignments were stripped by Gap Strip/Squeeze v2.1.0, with 40% Gap tolerance (http://www.hiv.lanl.gov/content/sequence/GAPSTREEZE/gap.html). The alignments were concatenated using FASconCAT_v1.0 [39].
We created three data sets with varying gene content under the full 55 taxa for the preliminary phylogenetic analyses: (1) PCGRNA (14,535 bp): the nucleotide data with all genes (protein-coding, ribosomal RNA and transfer RNA genes); (2) PCGRNA_Gblocks (13,925 bp): all gene alignments masked by Gblocks were concatenated; (3) PCG12RNA (10,755 bp): the 13 protein-coding genes excluding the third codon position were combined with RNA gene alignments with Gblocks treatment. In addition, a taxon reduced data set of 52taxa_PCGRNA (14,535 bp), excluding the long-branched Raphidioptera, was compiled to investigate the potential long-branch attraction effect.

2.4. DNA Analyses

The heterogeneity of sequence divergences within the alignments was analyzed by using AliGROOVE procedure [40], with the default sliding window size and the gaps being treated as ambiguous characters. Nucleotide substitution saturation was assessed for each codon position of the protein-coding genes, the whole protein-coding gene alignment, tRNA genes, rRNA genes and the concatenated data set of tRNA and rRNA genes, by using Xia’s method [41,42] as implemented in DAMBE 5 [43]. We ran the program yn00 from the package PAML [44] to calculate the nonsynonymous (dN) and synonymous (dS) substitution rates of protein-coding genes, with the method of Yang and Nielsen [45].

2.5. Phylogenetic Analyses

Phylogenetic analyses of the three combined data sets mentioned above were conducted using maximum likelihood (ML) and Bayesian inference (BI) approaches. Partitioned ML analyses were performed using the IQ-TREE [46] as implemented on the web server (http://iqtree.cibiv.univie.ac.at/). The data blocks were defined by gene and by codon for the 13 protein-coding genes without data treatments, while the data blocks were defined by gene only for the data alignments masked by Gblocks or with the third codon position excluded. The 22 tRNA genes and two rRNA genes were considered as two separate partitions. The data set of PCGRNA contained 41 partitions, while the PCGRNA_Gblocks and the PCG12RNA included 15 partitions, respectively. The best-fit substitution models were determined (Supplementary Table S1) using the Auto function on W-IQ-TREE with ModelFinder [47]. We performed 10,000 ultrafast [48] bootstrap replicates to investigate nodal support across the topology.
Bayesian inference (BI) was performed using PhyloBayes MPI [24,26] as implemented in the CIPRES Science Gateway [49]. Two independent runs were performed for each analysis and each run implemented two Markov chain Monte Carlo (MCMC) chains in parallel for at least 30,000 iterations. The CAT-GTR model was applied to Bayesian tree searches on nucleotide data sets. The values of maxdiff (maximum split frequency) < 0.1 and ESS (effective sample size) > 100 were acknowledged as a good indicator of convergence. The first 1000 trees of each MCMC were treated as the burn-in and the majority-rule consensus tree was computed from the remaining trees of the two chains of each Bayesian inference analysis.

3. Results

3.1. Reconstruction of Mitochondrial Genomes

As shown in Table 2, at least 128 million high-quality PE reads were produced for each library. Most of these clean reads are non-mitochondrial sequences, because only < 0.3% reads can match with the reference mitochondrial contigs assembled by IDBA-UD. Sequencing depth did not correlate with the completeness of mitochondrial contigs. A relatively complete mitochondrial genome sequence was identified in a single large contig for three species, namely D. pantherinus, E. nostras and Suhpalacsa sp. The mitochondrial genome sequence of N. punctatolosus was assembled from two separate contigs. The average depth of coverage of mitochondrial genome sequences was generally high, ranging from 49 to 538.

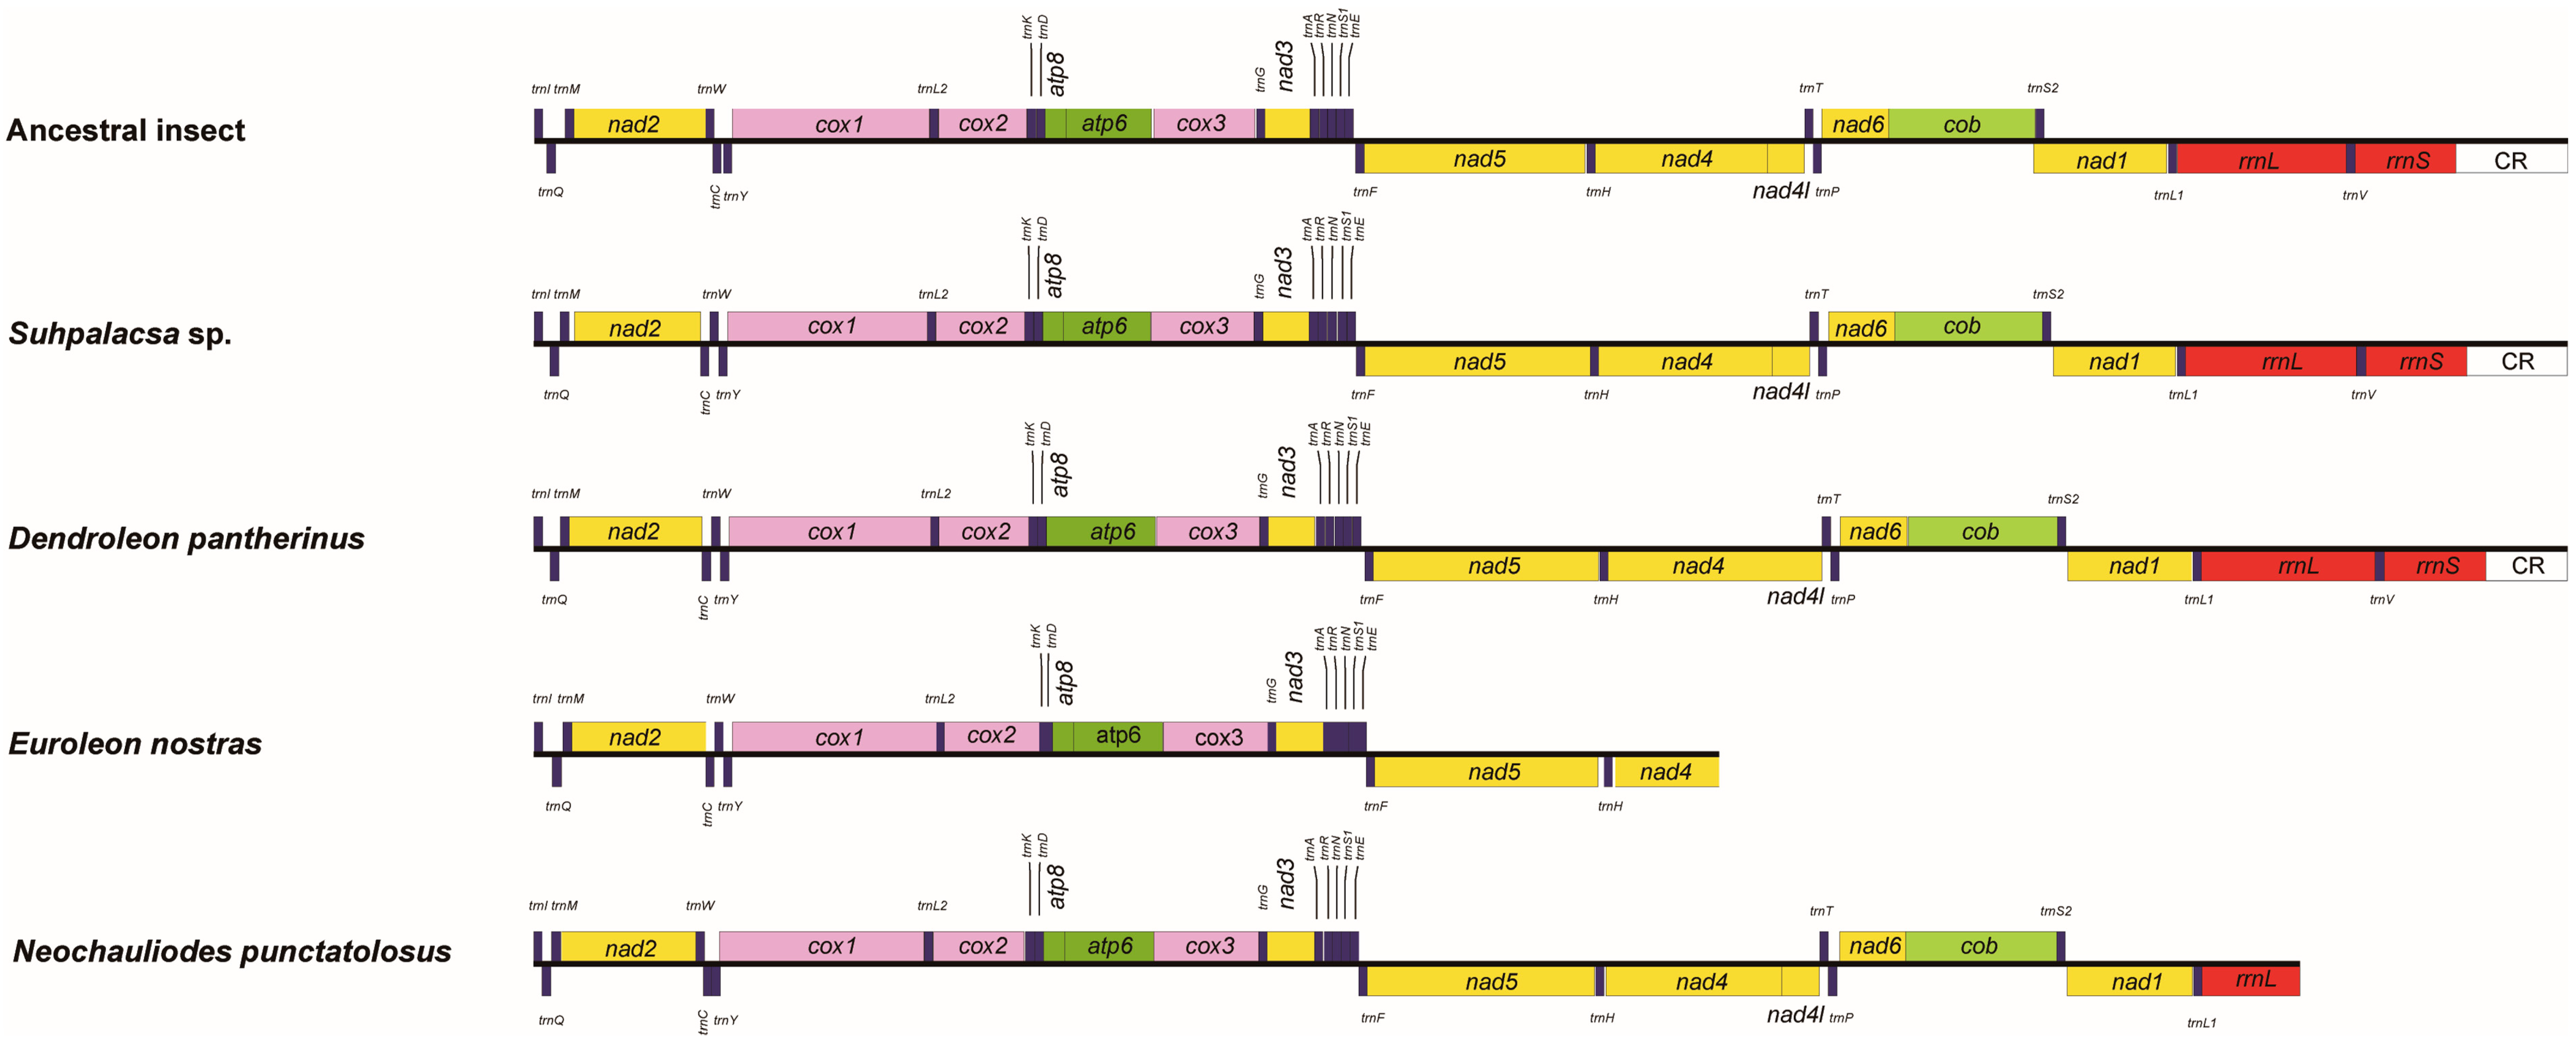
3.2. Genome Structure

The mitochondrial genome sequences of Suhpalacsa sp. and D. pantherinus were 15,540 bp and 15,416 bp in size, respectively. These two mitochondrial genomes included a typical set of 37 genes and a partial control region. The mitochondrial genome sequences of N. punctatolosus and E. nostras were 13,404 bp and 9095 bp in size, which consisted of 35 and 26 mitochondrial genes (Figure 1), respectively. Besides the control region, there was a long non-coding region (54–73 bp) present downstream of trnI in the major strand in three neuropteran mitochondrial genomes (i.e., D. pantherinus, E. nostras and Suhpalacsa sp.). The mitochondrial genome of D. pantherinus also contained two intergenic regions with 49 bp and 58 bp, which were located between trnE and trnF and between nad1 and trnL, respectively. Other intergenic identified regions were no more than 10 bp length. No remarkable overlapping genes were found.
The gene order of trnC-trnW-trnY was observed in the newly sequenced mitochondrial genomes for Suhpalacsa sp., D. pantherinus and E. nostras, while the mitochondrial genome of N. punctatolosus had a different arrangement (trnW-trnC-trnY) (Figure 1). The secondary structures of the full set of tRNA genes for D. pantherinus and Suhpalacsa sp. were shown in Figure S1. The length of the tRNA genes ranges from 61 bp to 71 bp. All tRNA genes exhibited the typical cloverleaf structure, except for trnS1(AGN). A single loop structure instead of the stem-and-loop structure formed the DHU arm of trnS(AGN).
For the two nearly complete mitochondrial genomes of D. pantherinus and Suhpalacsa sp., the rrnL and rrnS were respectively identified between trnL1 and trnV and between trnV and control region, with the lengths of 1324 bp and 1315 bp and 775 bp and 778 bp. The gene location and gene lengths were similar to other published neuropteran insects [5,11,12]. Mitochondrial genomes of other two species sequenced (i.e., E. nostras and N. punctatolosus) are partial and lack the complete rRNA genes (Figure 1). The secondary structures of rRNA genes were inferred with reference to models proposed in the study of Yan et al. (2014) [11]. Figure 2 and Figure S2 showed the secondary structures for rrnL and rrnS of D. pantherinus and Suhpalacsa sp., respectively. The rrnL consisted of I, II, IV, V and VI structural domains and 50 helices. The domain III was missing because the sequence region between domain II and IV was too short to form the corresponding stem and/or loop structures. There were 275 canonical pairings (A-U and G-C) identified in the rrnL secondary structures of D. pantherinus and Suhpalacsa sp.. The number of non-canonical pairings for two species was 70 (G-U: 47, U-U: 13, A-A: 4, A-G: 4, A-C: 1, U-C: 1) and 73 (G-U: 50, U-U: 18, A-A: 1, A-G: 2, A-C: 1, U-C: 1), which were similar to those observed in previous study [11]. The predicted secondary structure of the mitochondrial rrnS gene contained four typical domains (I-IV) and 34 helices. The rrnS secondary structures of D. pantherinus and Suhpalacsa sp. had 161 and 163 canonical pairings, respectively. The number of non-canonical pairings was 41 (G-U: 27, U-U: 9, A-A: 1, A-G: 1, A-C: 2, G-G: 1) and 46 (G-U: 23, U-U: 16, A-A: 1, A-G: 5, A-C: 1).

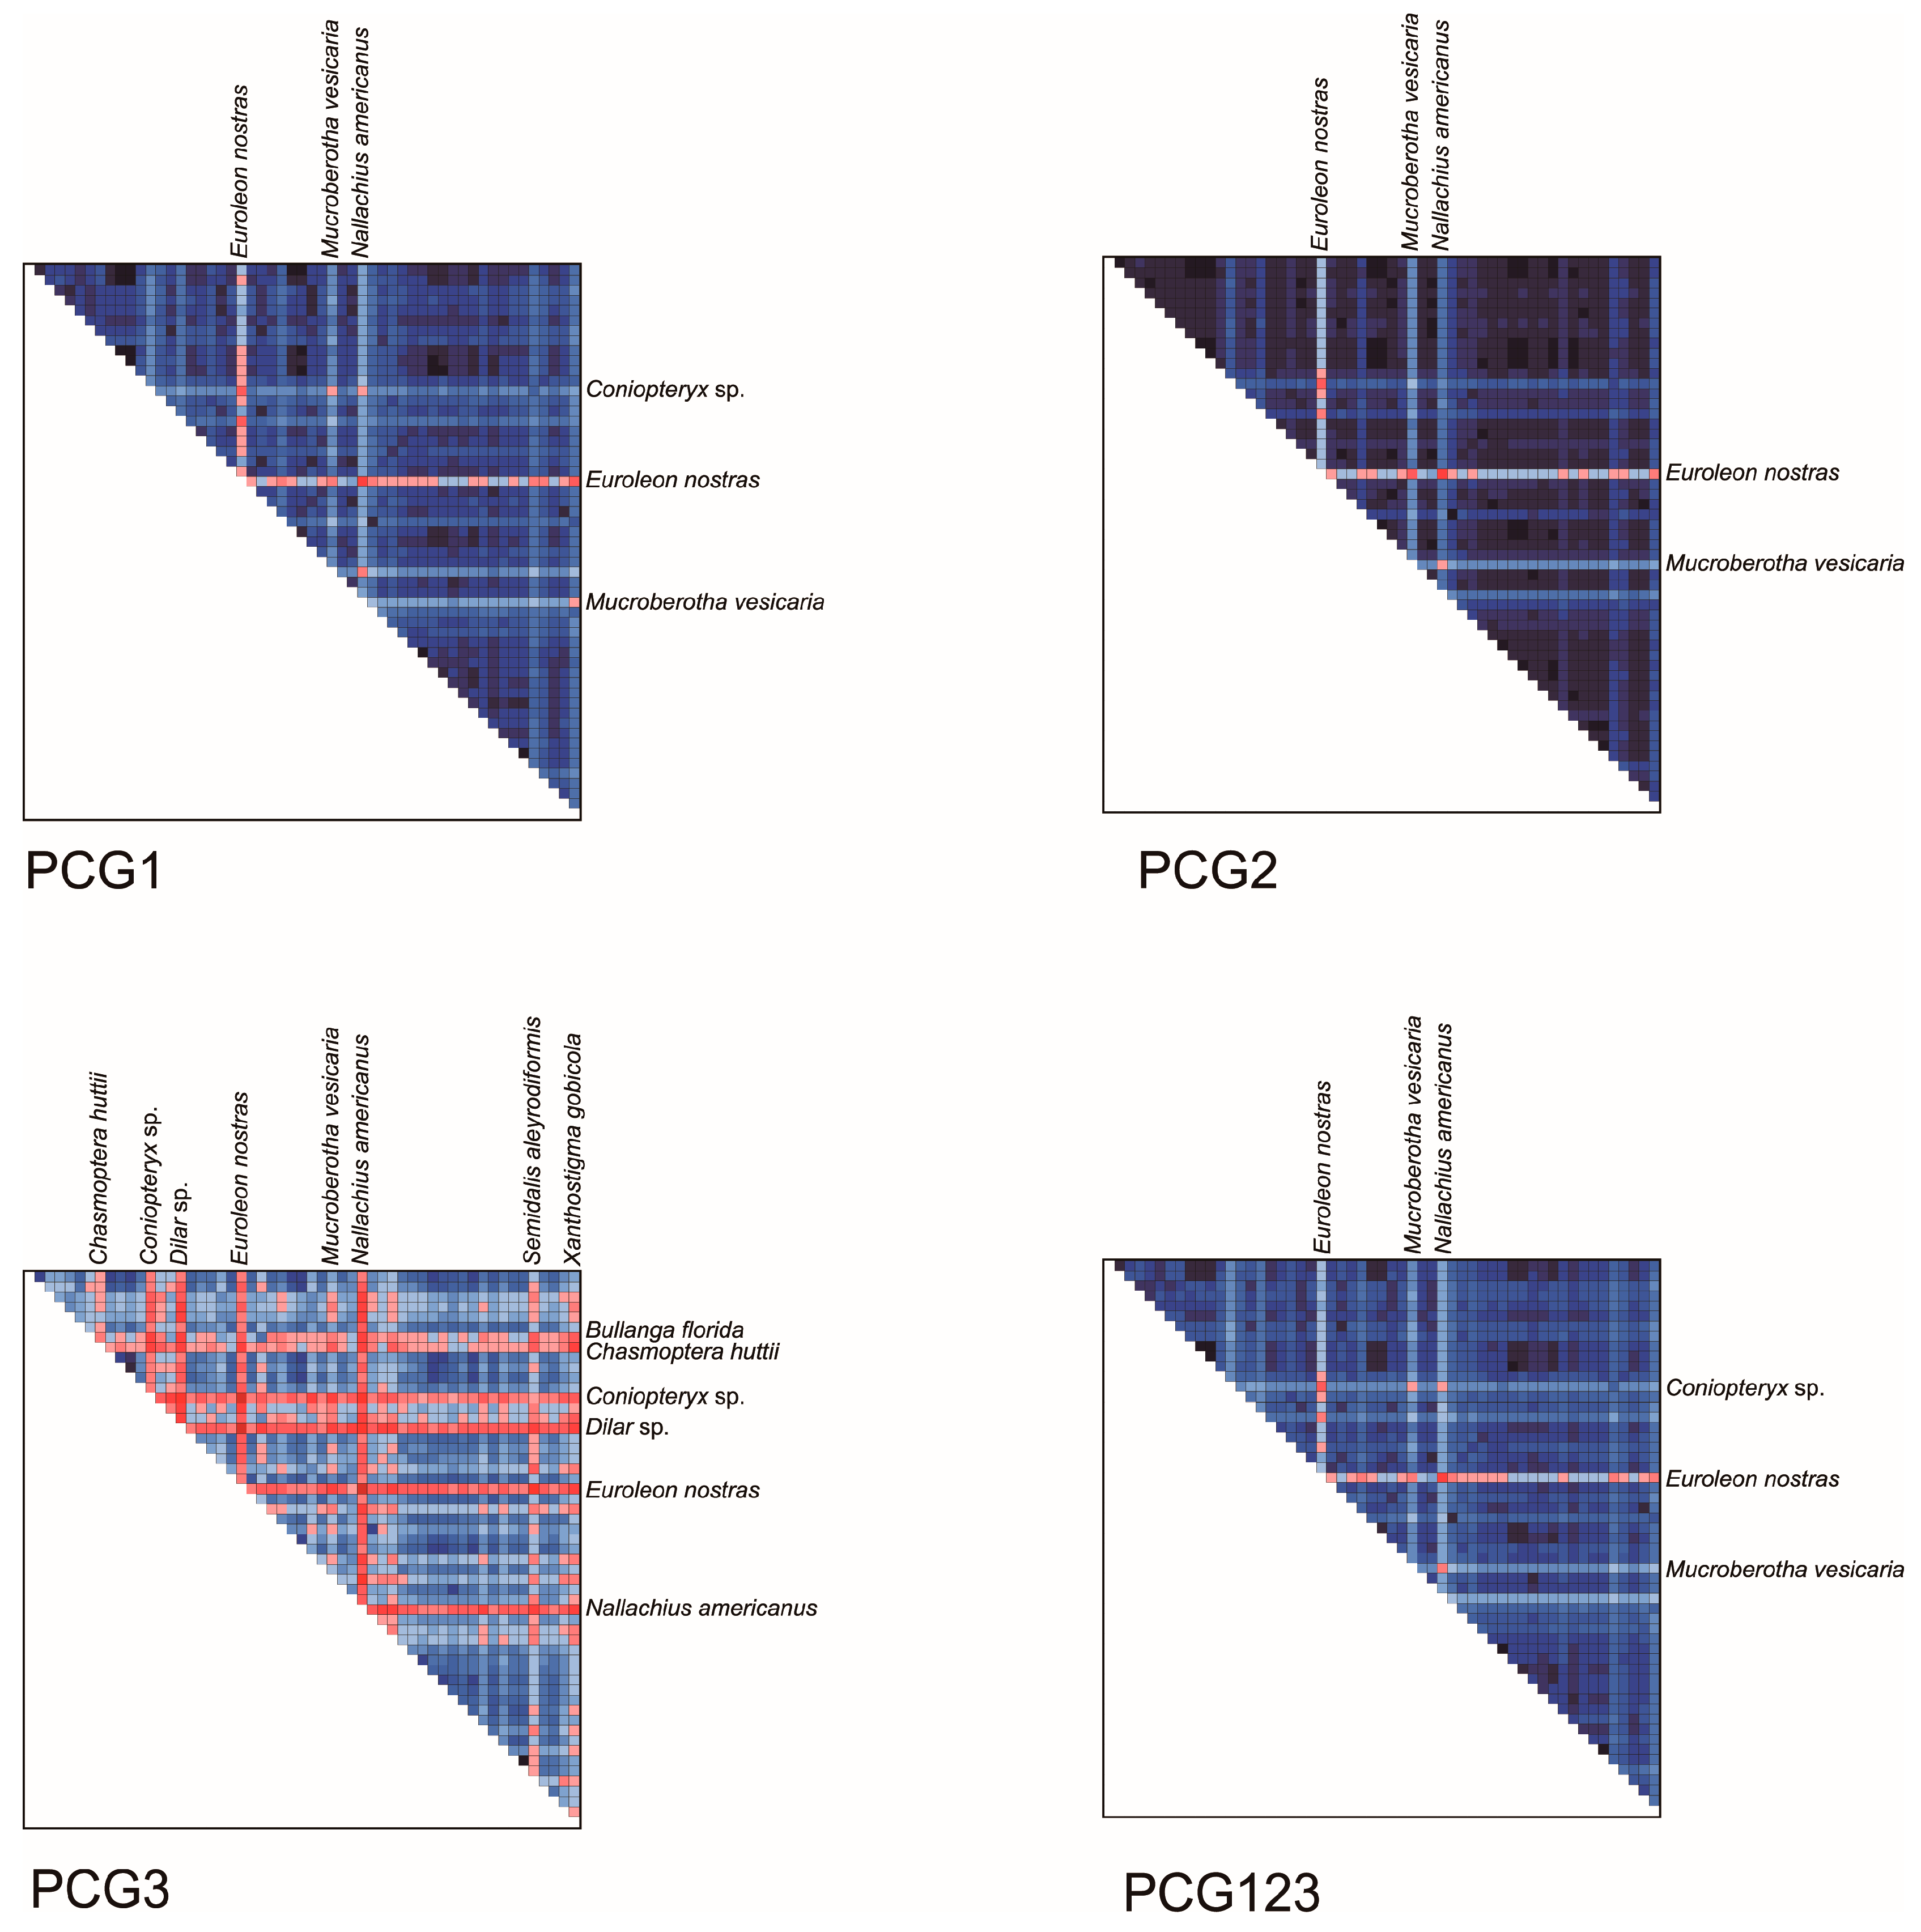
3.3. Characteristics of Data Matrix

The results of base compositional heterogeneity analyses showed both the first codon positions and the second codon positions had low heterogeneity of sequence composition. In contrast, a remarkably higher heterogeneity was found in the third codon positions of protein-coding genes (Figure 3). The mitochondrial genome sequences of Semidalis aleyrodiformis, Coniopteryx sp., Nallachius americanus, Dilar sp. and E. nostras were more heterogeneous than other neuropteridan species. Data masked by Gblocks and removing the third codon positions had no significant effect on the level of heterogeneity when comparing with data set of PCGRNA (Figure S3). The saturation analyses (Table 3) revealed that all codon positions of protein-coding genes and the mitochondrial RNA gene partitions were unsaturated for symmetric tree shapes (Iss < Iss.cSym). However, under the assumption of an asymmetrical tree, the third codon positions of protein-coding genes and the rRNA gene partition were significantly saturated (Iss > Iss.cAsym) or close to saturation.
The averages of nonsynonymous substitution rates (dN) and synonymous substitution rates (dS) of the 55 species pairs are shown in Table 4. Our results showed that all species analyzed shared a similar dS value (4.45 to 4.95). In comparison, different insect groups had distinct dN and dN/dS values. Several species from Chrysopidae had the smallest dN (ca. 0.097) and dN/dS (ca. 0.021) values, while the species from Coniopterygidae (S. aleyrodiformis and Coniopteryx sp.), Dilaridae (N. americanus and Dilar sp.) and Raphidioptera (Xanthostigma gobicola, Negha inflata and Inocellia fujiana) had larger dN (≥ 0.162) and dN/dS (≥ 0.033) values than other neuropteridan species. It seemed that nonsynonymous substitution rates were correlated with the heterogeneity of sequence divergences observed in the current data.

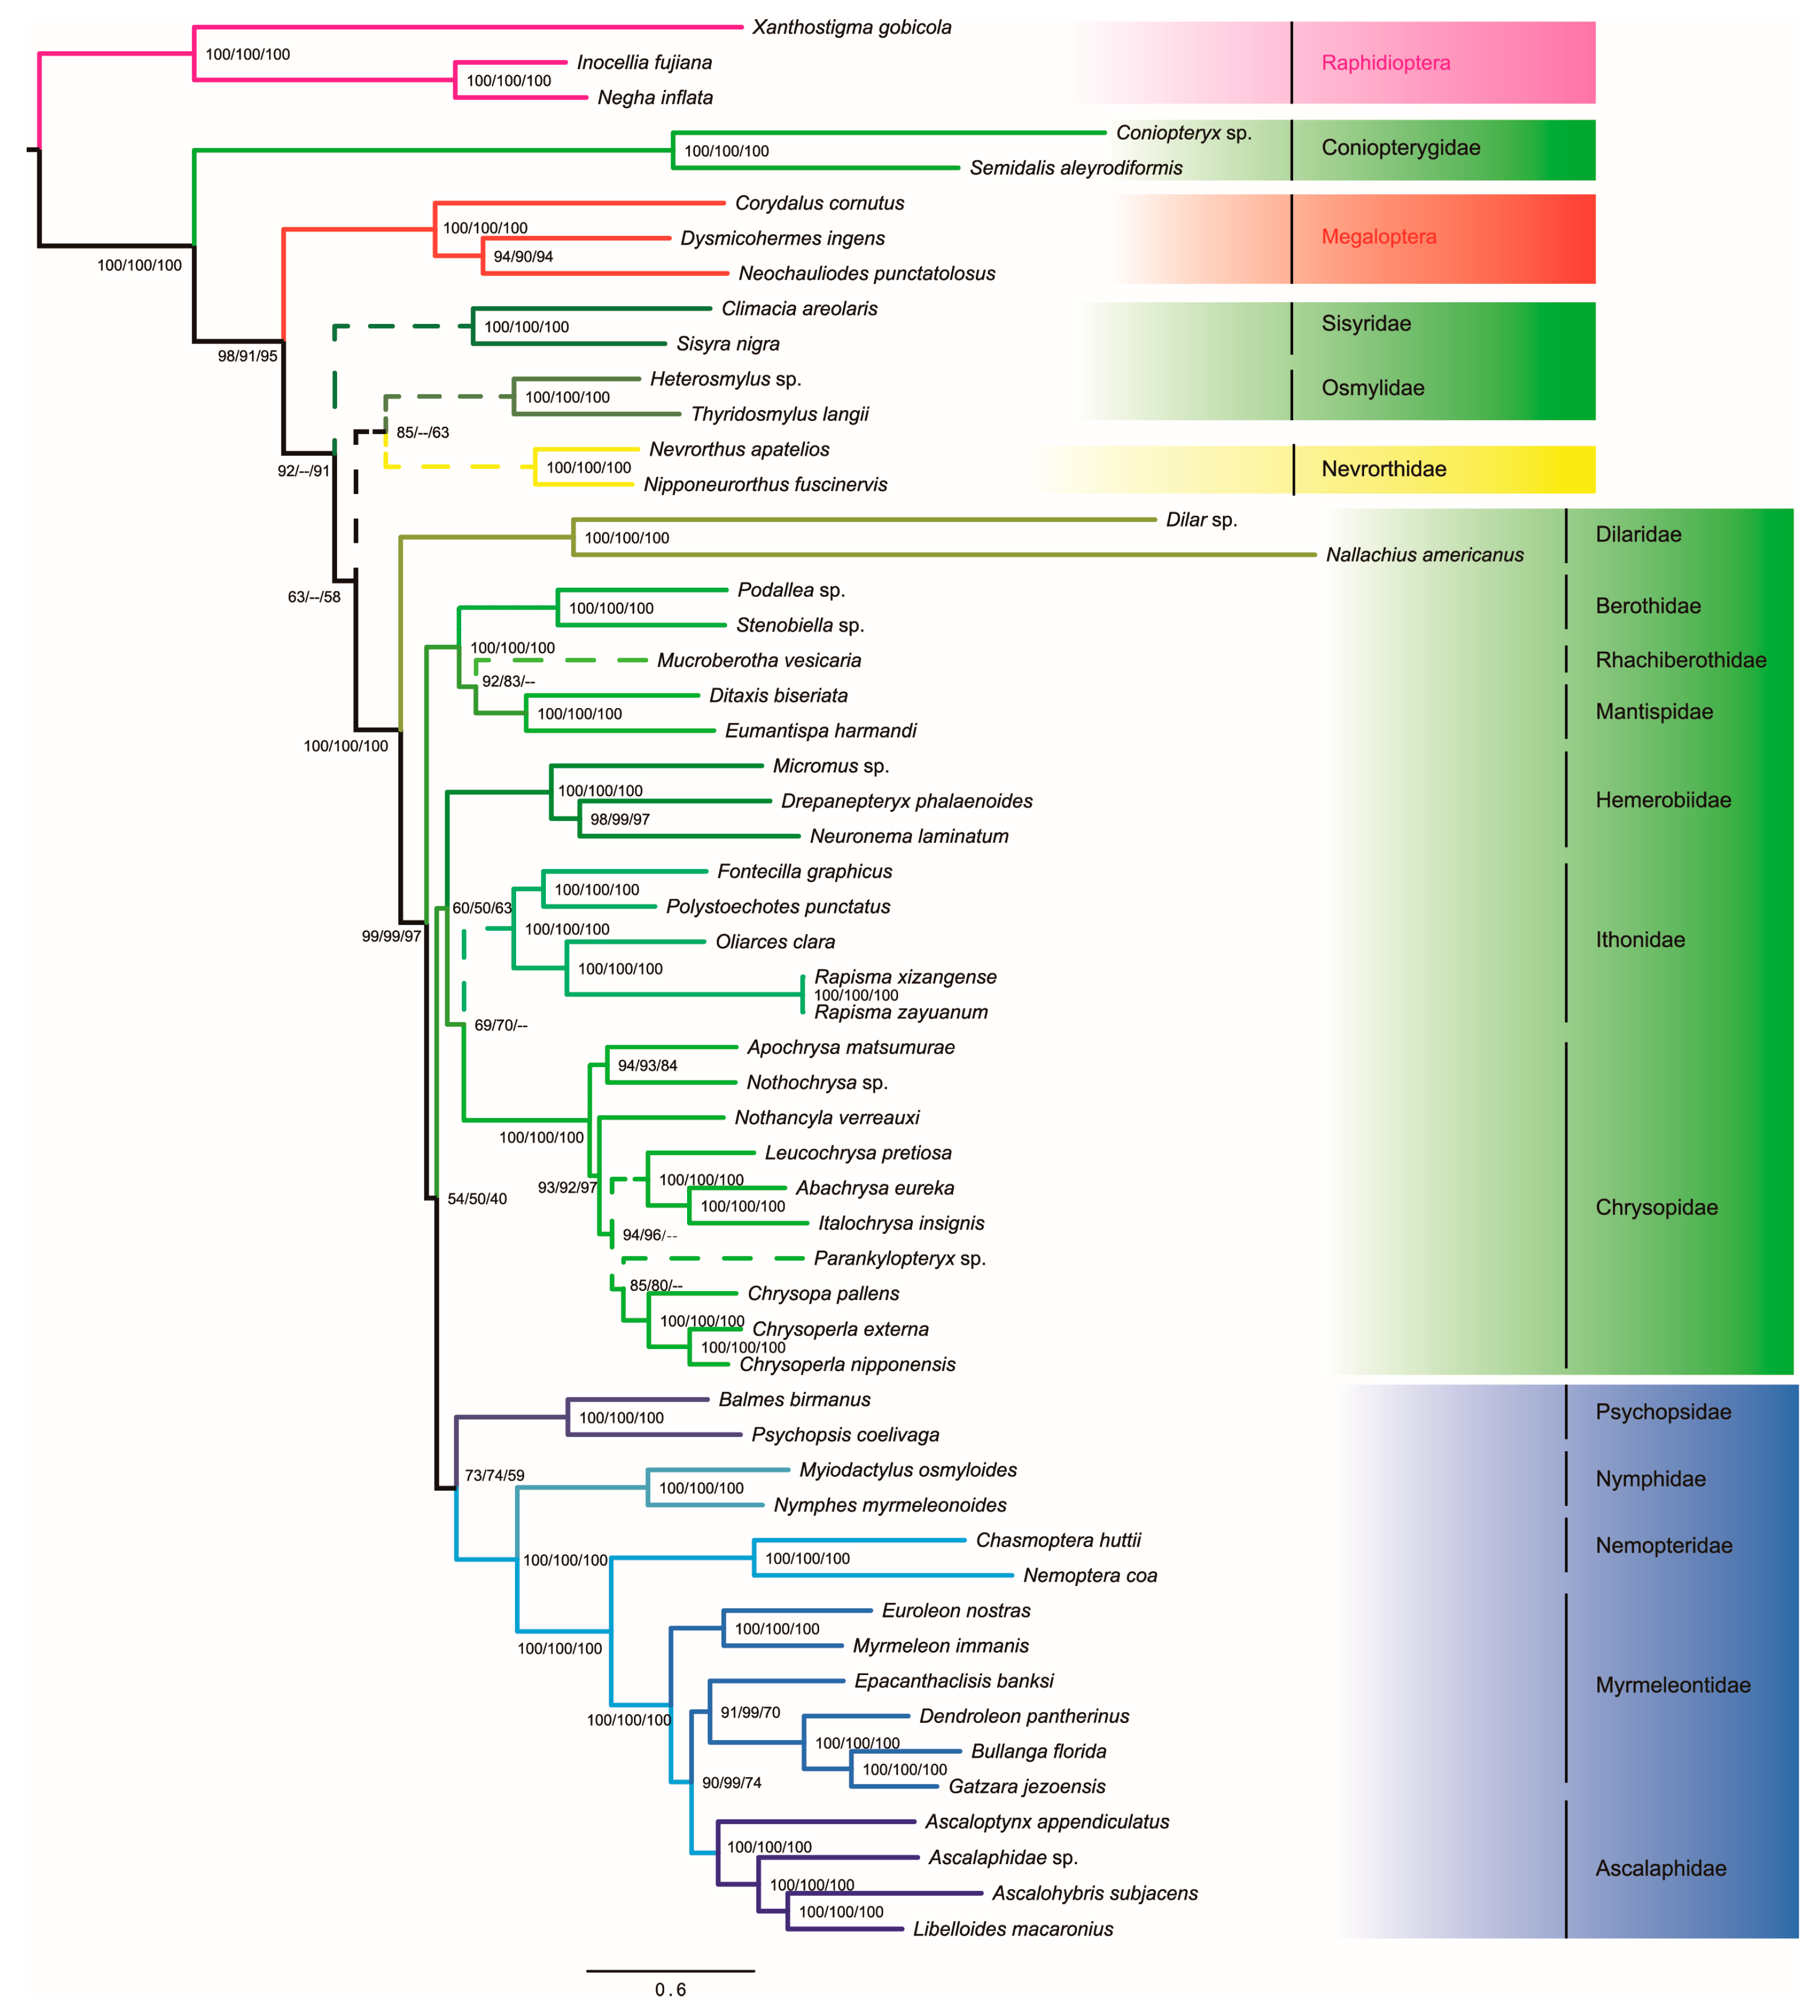
3.4. Phylogenetic Analyses

ML analyses from the data sets of PCGRNA, PCGRNA_Gblocks and PCG12RNA yielded conflicting hypotheses (Figure 4). In contrast, under the Bayesian inference analyses, data masking and removal of the third codon positions had no significant impact on the tree topology reconstruction, with only slightly changed support values at some nodes (Figure 5).
The monophyly of Neuroptera was only supported by BI analyses under the site-heterogeneous CAT-GTR model. In ML trees from the site-homogeneous GTR model, Megaloptera was nested within Neuroptera, which resulted in non-monophyly of the later. It is noteworthy that the branch lengths leading to the outgroup Raphidioptera as well as two ingroup taxa Coniopterygidae and Dilaridae are strikingly long as compared to other neuropteridan species. Long-branch attraction effect may give a reasonable explanation for the incongruence between results of ML and BI analyses.
Myrmeleontiformia consisting of five extant families, namely Ascalaphidae, Myrmeleontidae, Nemopteridae, Nymphidae and Psychopsidae, was strongly supported by BI analyses (PP ≥ 0.96). In the ML analyses, the Myrmeleontiformia was also recovered but with low to moderate support (59 ≤ BP ≤ 74). In both ML and BI analyses, Hemerobiiformia was consistently recovered to be non-monophyletic. The monophyly of the Neuroptera families with more than two taxa included in this study was robustly supported (BP = 100, PP = 1), with the exception of Myrmeleontidae. Myrmeleontidae formed a paraphyletic grade with respect to Ascalaphidae, regardless of alignments and inference methods applied.
Within Neuroptera, Coniopterygidae constituted the most basal clade and was sister to all other neuropteran lineages in BI analyses. The second clade included a sister-group (Nevrorthidae + Sisyridae), albeit with weak nodal support (PP ≤ 0.91). In the ML tree from PCGRNA or PCG12RNA, Sisyridae emerged as the second-earliest branching neuropteran lineage. However, in the ML tree from the PCGRNA_Gblocks, a combined clade comprising (Sisyridae + (Osmylidae + Nevrorthidae)) formed the second branching lineage of Neuroptera, albeit with low support values for deep nodes (BP ≤ 55).
A clade including three families of Berothidae, Rhachiberothidae and Mantispidae was placed in an intermediate position within Neuroptera. However, the interrelationships among these families and support varied in different analyses. ML trees from PCGRNA and PCGRNA_Gblocks supported a branching pattern of (Berothidae + (Rhachiberothidae + Mantispidae)), whereas ML tree from PCG12RNA and all Bayesian trees found Rhachiberothidae as a sister taxon to Berothidae. The BI analysis from data set masked by Gblocks had a relatively higher node support value for the clade (Rhachiberothidae + Berothidae) than those from the data sets of PCGRNA and PCG12RNA. A sister taxon relationship between Hemerobiidae and Chrysopidae was well supported in BI analyses (PP = 0.96 or 0.99). ML analyses from PCGRNA and PCGRNA_Gblocks placed the Ithonidae as the sister group to Chrysopidae. However, the support for the position of this relationship was relatively weak (BP ≤ 70). ML tree from PCG12RNA and all Bayesian trees placed Ithonidae as the sister group to the clade Myrmeleontiformia. A stable internal relationship within the monophyletic Ithonidae was consistently retrieved by all analyses (BP = 100, PP = 1), which included two species from the Rapisma and one from the Polystoechotes.

4. Discussion

The triple suborder classification system of Neuroptera was proposed based mainly on the morphological characters [2,50,51]. However, molecular studies more often retrieved a paraphyletic Hemerobiiformia with regard to Myrmeleontiformia [4,5,52]. A study by Winterton et al. (2010) [14] based on morphological and molecular data also recovered Hemerobiiformia as a non-monophyletic group. The current study based on the full mitochondrial genomic data supported the non-monophyly of Hemerobiiformia in all analyses. The suborder Nevrorthiformia contained the sole family Nevrorthidae. The composition of Nevrorthidae was once regarded as the members of Sisyridae [50,53]. Zwick (1967) considered Nevrorthidae as an independent family and a sister group to the Sisyridae [54]. Both families have the truly aquatic larvae, which are distinct from other neuropteran families [6,53]. Aspöck et al. (2001) [2] placed Nevrorthidae/Nevrorthiformia to be an early offshoot and sister group to all other Neuroptera. However, the most basal placement of Nevrorthidae has been controversial [14,55,56]. A recent mitochondrial phylogenomic study also indicated a more derived position of Nevrorthidae and placed it as sister to Sisyridae [5]. A study [4] based on anchored hybrid enrichment data and including a more comprehensive taxon sampling recovered Nevrorthidae as sister to Osmylidae. In addition, Winterton et al. (2017) [57] provided morphological evidence supporting this sister relationship. Our mitochondrial genomic data recovered Nevrorthidae as a sister-group to either Osmylidae (under homogeneous model ML analyses from PCGRNA and PCG12RNA) or Sisyridae (under homogeneous model ML analysis from PCGRNA_Gblocks and under heterogeneous model BI analyses from PCGRNA, PCGRNA_Gblocks and PCG12RNA), while the placement of Nevrorthidae as sister to the rest of Neuroptera was never supported. The exact placement of Nevrorthidae needs further analysis.
In BI analyses, two representatives from Coniopterygidae exhibited remarkable long-branches compared to other neuropteran species. Coniopterygidae was recovered as the most basal group in Neuroptera (PP = 1). To investigate the potential long-branch attraction between in- and outgroups, we removed the long-branched Raphidioptera to repeat ML and Bayesian analyses. As a result, the ingroup relationships were unaffected by the reduced-outgroup set under ML analysis (Figure S4). Bayesian analysis based on the reduced-outgroup data set resulted only in slight rearrangements within basal groups of Neuroptera. The Coniopterygidae was consistently retrieved as the sister to all other neuropteran lineages in both ML and BI trees (Figures S4–S5). In previous studies based on the morphological data, the placement of Coniopterygidae was rather variable among various authors [2,7,51,56,58,59,60]. Recent molecular studies have begun to converge on the “Coniopterygidae most basal” hypothesis [4,5,14,61]. Our mitochondrial genomic data further corroborated the earliest divergence of Coniopterygidae in Neuroptera.
Dilaridae is a small group of Neuroptera that comprises approximately 100 species in the three subfamilies [4,17]. Morphological analyses supported Dilaridae as sister group to the clade including Berothidae, Rhachiberothidae and Mantispidae [2,7,51,56,58]. All four families clustered together to form the ‘dilarid’ clade [2,7,51,55,56,58,62,63]. But morphological characters supporting the monophyly of this group is often considered to be homoplasious [4]. Recent molecular analyses provided an alternative hypothesis that Dilaridae was placed in an intermediate position between the early-branching neuropteran lineages (i.e., Coniopterygidae, Nevrorthidae, Sisyridae and Osmylidae) and the majority of Hemerobiiformia and Myrmeleontiformia [4,5]. Our analyses were in accordance with the prior molecular studies, that the Dilaridae occupied an intermediate position in the Neuroptera trees from all data sets.
Three families of Berothidae, Rhachiberothidae and Mantispidae constitute the superfamily Mantispoidea. Fused unpaired parameres and hypermetamorphosis were proposed as the synapomorphies for the Mantispidae-Rhachiberothidae-Berothidae clade [2]. The monophyly of Mantispoidea is well resolved, although the interrelationships of taxa within this superfamily have been controversial. The Rhachiberothidae was once recognized as a member of either Mantispidae [64] or Berothidae [65]. This group is more usually considered a separate family by current authors [2,4,5,14]. Aspöck et al. (2001) [2] supported Rhachiberothidae to be sister to Berothidae based on morphological characters. The mitochondrial genome data consistently recovered Rhachiberothidae as sister to Mantispidae [5]. The anchored hybrid enrichment data retrieved Rhachiberothidae as sister to a subfamily of Mantispidae (i.e., Symphrasinae) [4]. This study gave a conflicting result on the phylogeny of Mantispoidea. ML trees from PCGRNA and PCGRNA_Gblocks strongly supported the (Berothidae + (Rhachiberothidae + Mantispidae)) clade, while ML tree from PCG12RNA and all BI trees recovered the relationships of (Mantispidae + (Rhachiberothidae + Berothidae)). Because of the better performance of the CAT-GTR model implemented in PhyloBayes in reducing systematic errors [27], the BI trees may be the most accurate reflection of Mantispoidea relationships based on the current data.
Compared with taxon sampling for the Ithonidae clade in the study of Wang et al. (2017) [5], only one additional species from Rapisma (i.e., Rapisma zayuanum) was incorporated into the current data matrix. Therefore, it is not unexpected that similar tree topology of this group is recovered. The result supported the expanded concept of the family Ithonidae to include the Rapismatidae and Polystoechotidae [3]. The Ithonidae was placed between Hemerobiidae and Chrysopidae in the ML analyses from PCGRNA and PCGRNA_Gblocks. But the support for this placement was weak (BP ≤ 69). In contrast, ML analysis from PCG12RNA and all BI analyses reconstructed Ithonidae as sister to the entire Myrmeleontiformia. The latter arrangement was more congruent with a previous mitochondrial genome study [5]. A sister-group relationship between Hemerobiidae and Chrysopidae was recovered in all BI analyses with strong support (PP ≥ 0.96). This hypothesis was also supported by the previous morphological [58] and molecular [5,52] studies.
The monophyly of Myrmeleontiformia has been well established [4,5,50,53]. The relationships among families of Myrmeleontiformia remain contentious [2,50]. Traditionally, Psychopsidae was recognized as the first diverging clade of Myrmeleontiformia, next was Nemopteridae and the Nymphidae as being sister to the (Myrmeleontidae + Ascalaphidae) clade. Aspöck (2002) [50] suggested that Psychopsidae and Nemopteridae formed a sister group and together they were sister to all other Myrmeleontiformia. The morphological analysis of Aspöck & Aspöck (2008) [58] supported Nemopteridae to be a sister-group of the (Myrmeleontidae + Ascalaphidae) clade and a sister-group relation between Psychopsidae and Nymphidae. Recent molecular studies also supported Nemopteridae as a sister-group of the (Myrmeleontidae + Ascalaphidae) clade but the sister-group relationship between Psychopsidae and Nymphidae was not returned [4,5]. In this study, each of the optimal trees indicated that the clade including Myrmeleontidae and Ascalaphidae was the sister group of Nemopteridae, followed successively by Nymphidae and Psychopsidae. This branch sequence was in agreement with the results of Wang et al. (2017) [5]. In addition, expanded taxon sampling confirmed the paraphyly of Myrmeleontidae, with respect to Ascalaphidae.

Supplementary Materials

The following are available online at https://www.mdpi.com/2073-4425/10/2/108/s1, Figure S1: The secondary structures of 22 tRNA genes predicted for (A) Dendroleon pantherinus and (B) Suhpalacsa sp., Figure S2: The secondary structure of (A) rrnL and (B) rrnS genes predicted for Suhpalacsa sp., Figure S3: AliGROOVE heat maps of pairwise sequence comparisons for the data sets of 55taxa_PCGRNA, 55taxa_PCGRNA_Gblocks and 55taxa_PCG12RNA, Figure S4: Maximum likelihood tree inferred from the data set of 52taxa_PCGRNA using IQ-TREE under the GTR model, Figure S5: Bayesian tree inferred from the data set 52taxa_PCGRNA using PhyloBayes under the CAT-GTR model, Table S1: The best-fitting models selected by ModelFinder for the data set of (A) PCGRNA with 55 taxa, (B) PCGRNA_Gblocks with 55 taxa and (C) PCG12RNA with 55 taxa.

Author Contributions

N.S. and X.-M.Y. designed this study. N.S. and X.-X.L. performed the molecular experiments. N.S., X.-X.L. and Q.Z. analyzed the data. All authors discussed results and implications. N.S. wrote the manuscript and HB made the linguistic control. All authors have read and approved the final manuscript.

Funding

This research is supported by grants from the National Natural Science Foundation of China (No. 31402002), Key Scientific Research Projects of Henan Province, China (Grant Nos. 16A210029, 18B210006), Study on Technology of Chemical Fertilizer Reduction and Synergism in Tea Garden (2016YFD0200901), Fruit Industry System of Henan Province (S2014-11-G03).

Conflicts of Interest

The funding sponsors had no role in the design of the study; in the collection, analyses or interpretation of data; in the writing of the manuscript or in the decision to publish the results.

References

  1. Oswald, J.D. Lacewing Digital Library. Available online: http://lacewing.tamu.edu/ (accessed on 12 September 2015).
  2. Aspöck, U.; Plant, J.D.; Nemeschkal, H.L. Cladistic analysis of Neuroptera and their systematic position within Neuropterida (Insecta: Holometabola: Neuropterida: Neuroptera). Syst. Entomol. 2001, 26, 73–86. [Google Scholar] [CrossRef]
  3. Winterton, S.L.; Makarkin, V.N. Phylogeny of moth lacewings and giant lacewings (Neuroptera: Ithonidae, Polystoechotidae) using DNA sequence data, morphology, and fossils. Ann. Entomol. Soc. Am. 2010, 103, 511–522. [Google Scholar] [CrossRef]
  4. Winterton, S.L.; Lemmon, A.R.; Gillung, J.P.; Garzon, I.J.; Badano, D.; Bakkes, D.K.; Breitkreuz, L.C.V.; Engel, M.S.; Lemmon, E.M.; Liu, X.Y.; et al. Evolution of lacewings and allied orders using anchored phylogenomics (Neuroptera, Megaloptera, Raphidioptera). Syst. Entomol. 2018, 43, 330–354. [Google Scholar] [CrossRef]
  5. Wang, Y.; Liu, X.; Garzón-Orduña, I.J.; Winterton, S.L.; Yan, Y.; Aspöck, U.; Aspöck, H.; Yang, D. Mitochondrial phylogenomics illuminates the evolutionary history of Neuropterida. Cladistics 2017, 33, 617–636. [Google Scholar] [CrossRef]
  6. Aspöck, U.; Haring, E.; Aspöck, H. The phylogeny of the Neuropterida: Long lasting and current controversies and challenges (Insecta: Endopterygota). Arthropod. Syst. Phyl. 2012, 70, 119–129. [Google Scholar]
  7. Beutel, R.G.; Friedrich, F.; Aspöck, U. The larval head of Nevrorthidae and the phylogeny of Neuroptera (Insecta). Zool. J. Linn. Soc-Lond. 2010, 158, 533–562. [Google Scholar] [CrossRef]
  8. Stange, L.A. Systematic catalog, bibliography, and classification of the world antlions (Insecta: Neuroptera: Myrmeleontidae). Am. Entomol. Inst. 2004, 74, 565. [Google Scholar]
  9. Badano, D.; Pantaleoni, R.A. The larvae of European Myrmeleontidae (Neuroptera). Zootaxa 2014, 3762, 1–71. [Google Scholar] [CrossRef]
  10. Michel, B.; Clamens, A.L.; Béthoux, O.; Kergoat, G.J.; Condamine, F.L. A first higher-level time-calibrated phylogeny of antlions (Neuroptera: Myrmeleontidae). Mol. Phylogenet. Evol. 2017, 107, 103–116. [Google Scholar] [CrossRef]
  11. Yan, Y.; Wang, Y.; Liu, X.; Winterton, S.L.; Yang, D. The first mitochondrial genomes of antlion (Neuroptera: Myrmeleontidae) and split-footed lacewing (Neuroptera: Nymphidae), with phylogenetic implications of Myrmeleontiformia. Int. J. Biol. Sci. 2014, 10, 895. [Google Scholar] [CrossRef]
  12. Zhang, L.; Yang, J. The mitochondrial genome of Gatzara jezoensis (Neuroptera: Myrmeleontidae) and phylogenetic analysis of Neuroptera. Biochem. Syst. Ecol. 2017, 71, 230–235. [Google Scholar] [CrossRef]
  13. Song, N.; Lin, A.; Zhao, X. Insight into higher-level phylogeny of Neuropterida: Evidence from secondary structures of mitochondrial rRNA genes and mitogenomic data. PLoS ONE 2018, 13, e0191826. [Google Scholar] [CrossRef] [PubMed]
  14. Winterton, S.L.; Hardy, N.B.; Wiegmann, B.M. On wings of lace: Phylogeny and Bayesian divergence time estimates of Neuropterida (Insecta) based on morphological and molecular data. Syst. Entomol. 2010, 35, 349–378. [Google Scholar] [CrossRef]
  15. Crampton-Platt, A.; Timmermans, M.J.; Gimmel, M.L.; Kutty, S.N.; Cockerill, T.D.; Vun Khen, C.; Vogler, A.P. Soup to Tree: The phylogeny of beetles inferred by mitochondrial metagenomics of a Bornean rainforest sample. Mol. Biol. Evol. 2015, 32, 2302–2316. [Google Scholar] [CrossRef]
  16. Gillett, C.P.; Crampton-Platt, A.; Timmermans, M.J.; Jordal, B.H.; Emerson, B.C.; Vogler, A.P. Bulk de novo mitogenome assembly from pooled total DNA elucidates the phylogeny of weevils (Coleoptera: Curculionoidea). Mol. Biol. Evol. 2014, 31, 2223–2237. [Google Scholar] [CrossRef]
  17. Li, H.; Leavengood, J.M., Jr.; Chapman, E.G.; Burkhardt, D.; Song, F.; Jiang, P.; Liu, J.; Zhou, X.; Cai, W. Mitochondrial phylogenomics of Hemiptera reveals adaptive innovations driving the diversification of true bugs. Proc. Biol. Sci. 2017, 284. [Google Scholar] [CrossRef]
  18. Li, H.; Shao, R.; Song, N.; Song, F.; Jiang, P.; Li, Z.; Cai, W. Higher-level phylogeny of paraneopteran insects inferred from mitochondrial genome sequences. Sci. Rep. 2015, 5, 8527. [Google Scholar] [CrossRef]
  19. Liu, Y.; Song, F.; Jiang, P.; Wilson, J.J.; Cai, W.; Li, H. Compositional heterogeneity in true bug mitochondrial phylogenomics. Mol. Phylogenet. Evol. 2018, 118, 135–144. [Google Scholar] [CrossRef]
  20. Simon, C.; Buckley, T.R.; Frati, F.; Stewart, J.B.; Beckenbach, A.T. Incorporating molecular evolution into phylogenetic analysis, and a new compilation of conserved polymerase chain reaction primers for animal mitochondrial DNA. Annu. Rev. Ecol. Evol. Syst. 2006, 37, 545–579. [Google Scholar] [CrossRef]
  21. Simon, S.; Hadrys, H. A comparative analysis of complete mitochondrial genomes among Hexapoda. Mol. Phylogenet. Evol. 2013, 69, 393–403. [Google Scholar] [CrossRef]
  22. Song, N.; Li, H.; Song, F.; Cai, W.Z. Molecular phylogeny of Polyneoptera (Insecta) inferred from expanded mitogenomic data. Sci. Rep. 2016, 6, 36175. [Google Scholar] [CrossRef] [PubMed]
  23. Timmermans, M.J.; Barton, C.; Haran, J.; Ahrens, D.; Culverwell, C.L.; Ollikainen, A.; Dodsworth, S.; Foster, P.G.; Bocak, L.; Vogler, A.P. Family-Level Sampling of Mitochondrial Genomes in Coleoptera: Compositional Heterogeneity and Phylogenetics. Genome Biol. Evol. 2015, 8, 161–175. [Google Scholar] [CrossRef] [PubMed]
  24. Lartillot, N.; Philippe, H. A Bayesian mixture model for across-site heterogeneities in the amino-acid replacement process. Mol. Biol. Evol. 2004, 21, 1095–1109. [Google Scholar] [CrossRef] [PubMed]
  25. Lartillot, N.; Lepage, T.; Blanquart, S. PhyloBayes 3: A Bayesian software package for phylogenetic reconstruction and molecular dating. Bioinformatics 2009, 25, 2286–2288. [Google Scholar] [CrossRef]
  26. Lartillot, N.; Rodrigue, N.; Stubbs, D.; Richer, J. PhyloBayes MPI: Phylogenetic reconstruction with infinite mixtures of profiles in a parallel environment. Syst. Biol. 2013, 62, 611–615. [Google Scholar] [CrossRef]
  27. Lartillot, N.; Brinkmann, H.; Philippe, H. Suppression of long-branch attraction artefacts in the animal phylogeny using a site-heterogeneous model. BMC Evol. Biol. 2007, 7, S4. [Google Scholar] [CrossRef] [PubMed]
  28. Boussau, B.; Walton, Z.; Delgado, J.A.; Collantes, F.; Beani, L.; Stewart, I.J.; Cameron, S.A.; Whitfield, J.B.; Johnston, J.S.; Holland, P.W.H.; et al. Strepsiptera, phylogenomics and the long branch attraction problem. PLoS ONE 2014, 9, e107709. [Google Scholar] [CrossRef] [PubMed]
  29. Song, F.; Li, H.; Jiang, P.; Zhou, X.; Liu, J.; Sun, C.; Vogler, A.P.; Cai, W. Capturing the phylogeny of Holometabola with mitochondrial genome data and Bayesian site-heterogeneous mixture models. Genome Biol. Evol. 2016, 8, 1411–1426. [Google Scholar] [CrossRef]
  30. Patel, R.K.; Jain, M. NGS QC Toolkit: A toolkit for quality control of next generation sequencing data. PLoS ONE 2012, 7, e30619. [Google Scholar] [CrossRef] [PubMed]
  31. Peng, Y.; Leung, H.C.; Yiu, S.M.; Chin, F.Y. IDBA-UD: A de novo assembler for single-cell and metagenomic sequencing data with highly uneven depth. Bioinformatics 2012, 28, 1420–1428. [Google Scholar] [CrossRef]
  32. Bernt, M.; Donath, A.; Juhling, F.; Externbrink, F.; Florentz, C.; Fritzsch, G.; Putz, J.; Middendorf, M.; Stadler, P.F. MITOS: Improved de novo metazoan mitochondrial genome annotation. Mol. Phylogenet. Evol. 2013, 69, 313–319. [Google Scholar] [CrossRef] [PubMed]
  33. Li, H.; Durbin, R. Fast and accurate short read alignment with Burrows-Wheeler transform. Bioinformatics 2009, 25, 1754–1760. [Google Scholar] [CrossRef] [PubMed]
  34. Li, H.; Handsaker, B.; Wysoker, A.; Fennell, T.; Ruan, J.; Homer, N.; Marth, G.; Abecasis, G.; Durbin, R.; Genome Project Data Processing, S. The Sequence Alignment/Map format and SAMtools. Bioinformatics 2009, 25, 2078–2079. [Google Scholar] [CrossRef]
  35. Okonechnikov, K.; Conesa, A.; García-Alcalde, F. Qualimap 2: Advanced multisample quality control for high-throughput sequencing data. Bioinformatics 2016, 32, 292–294. [Google Scholar] [CrossRef]
  36. Abascal, F.; Zardoya, R.; Telford, M.J. TranslatorX: Multiple alignment of nucleotide sequences guided by amino acid translations. Nucleic. Acids Res. 2010, 38, W7–W13. [Google Scholar] [CrossRef]
  37. Katoh, K.; Standley, D.M. MAFFT multiple sequence alignment software version 7: Improvements in performance and usability. Mol. Biol. Evol. 2013, 30, 772–780. [Google Scholar] [CrossRef] [PubMed]
  38. Castresana, J. Selection of conserved blocks from multiple alignments for their use in phylogenetic analysis. Mol. Biol. Evol. 2000, 17, 540–552. [Google Scholar] [CrossRef]
  39. Kuck, P.; Meusemann, K. FASconCAT: Convenient handling of data matrices. Mol. Phylogenet. Evol. 2010, 56, 1115–1118. [Google Scholar] [CrossRef]
  40. Kuck, P.; Meid, S.A.; Gross, C.; Wagele, J.W.; Misof, B. AliGROOVE—Visualization of heterogeneous sequence divergence within multiple sequence alignments and detection of inflated branch support. BMC Bioinform. 2014, 15. [Google Scholar] [CrossRef] [PubMed]
  41. Xia, X.; Xie, Z.; Salemi, M.; Chen, L.; Wang, Y. An index of substitution saturation and its application. Mol. Phylogenet. Evol. 2003, 26, 1–7. [Google Scholar] [CrossRef]
  42. Xia, X.; Lemey, P. Assessing substitution saturation with DAMBE. In The phylogenetic handbook: A practical approach to DNA and protein phylogeny, 2nd ed.; Cambridge University Press: Cambridge, UK, 2009. [Google Scholar]
  43. Xia, X.H. DAMBE5: A Comprehensive Software Package for Data Analysis in molecular biological evolution. Mol. Biol. Evol. 2013, 30, 1720–1728. [Google Scholar] [CrossRef] [PubMed]
  44. Yang, Z. PAML 4: Phylogenetic analysis by maximum likelihood. Mol. Biol. Evol. 2007, 24, 1586–1591. [Google Scholar] [CrossRef] [PubMed]
  45. Yang, Z.; Nielsen, R. Estimating synonymous and nonsynonymous substitution rates under realistic evolutionary models. Mol. Biol. Evol. 2000, 17, 32–43. [Google Scholar] [CrossRef] [PubMed]
  46. Nguyen, L.T.; Schmidt, H.A.; von Haeseler, A.; Minh, B.Q. IQ-TREE: A fast and effective stochastic algorithm for estimating maximum-likelihood phylogenies. Mol. Biol. Evol. 2015, 32, 268–274. [Google Scholar] [CrossRef]
  47. Kalyaanamoorthy, S.; Minh, B.Q.; Wong, T.K.F.; von Haeseler, A.; Jermiin, L.S. ModelFinder: Fast model selection for accurate phylogenetic estimates. Nat. Methods. 2017, 14, 587–589. [Google Scholar] [CrossRef] [PubMed]
  48. Hoang, D.T.; Chernomor, O.; von Haeseler, A.; Minh, B.Q.; Vinh, L.S. UFBoot2: Improving the ultrafast bootstrap approximation. Mol. Biol. Evol. 2017, 35, 518–522. [Google Scholar] [CrossRef] [PubMed]
  49. Miller, M.; Pfeiffer, W.; Schwartz, T. Creating the CIPRES Science Gateway for inference of large phylogenetic trees. Gateway Comput. Environ. Workshop (GCE) 2010, 14, 1–8. [Google Scholar]
  50. Aspöck, U. Phylogeny of the Neuropterida (Insecta: Holometabola). Zool. Scr. 2002, 31, 51–55. [Google Scholar] [CrossRef]
  51. Beutel, R.G.; Zimmermann, D.; Kraus, M.; Randolf, S.; Wipfler, B. Head morphology of Osmylus fulvicephalus (Osmylidae, Neuroptera) and its phylogenetic implications. Org. Divers. Evol. 2010, 10, 311–329. [Google Scholar] [CrossRef]
  52. Haring, E.; Aspöck, U. Phylogeny of the Neuropterida: A first molecular approach. Syst. Entomol. 2004, 29, 415–430. [Google Scholar] [CrossRef]
  53. Engel, M.S.; Winterton, S.L.; Breitkreuz, L.C.V. Phylogeny and Evolution of Neuropterida: Where Have Wings of Lace Taken Us? Annu. Rev. Entomol. 2018, 63, 531–551. [Google Scholar] [CrossRef] [PubMed]
  54. Zwick, P. Beschreibung der aquatischen Larve von Neurorthus [sic] fallax (Rambur) und Errichtung der neuen Planipennierfamilie Neurorthidae [sic] fam. nov. Gewässer Abwässer 1967, 44, 65–86. [Google Scholar]
  55. Randolf, S.; Zimmermann, D.; Aspöck, U. Head anatomy of adult Sisyra terminalis (Insecta: Neuroptera: Sisyridae) - functional adaptations and phylogenetic implications. Arthropod. Struct. Dev. 2013, 42, 565–582. [Google Scholar] [CrossRef] [PubMed]
  56. Randolf, S.; Zimmermann, D.; Aspöck, U. Head anatomy of adult Nevrorthus apatelios and basal splitting events in Neuroptera (Neuroptera: Nevrorthidae). Arthropod Syst. Phyl. 2014, 72, 111–136. [Google Scholar]
  57. Winterton, S.L.; Zhao, J.; Garzon-Orduna, I.J.; Wang, Y.J.; Liu, Z.Q. The phylogeny of lance lacewings (Neuroptera: Osmylidae). Syst. Entomol. 2017, 42, 555–574. [Google Scholar] [CrossRef]
  58. Aspöck, U.; Aspöck, H. Phylogenetic relevance of the genital sclerites of Neuropterida (Insecta: Holometabola). Syst. Entomol. 2008, 33, 97–127. [Google Scholar] [CrossRef]
  59. Winterton, S.L. Molecular phylogeny of Neuropterida with emphasis on the lacewings (Neuroptera). Entomol. Abh 2003, 61, 158–160. [Google Scholar]
  60. Zimmermann, D.; Klepal, W.; Aspöck, U. The first holistic SEM study of Coniopterygidae (Neuroptera) - structural evidence and phylogenetic implications. Eur. J. Entomol. 2009, 106, 651–662. [Google Scholar] [CrossRef]
  61. Misof, B.; Liu, S.; Meusemann, K.; Peters, R.S.; Donath, A.; Mayer, C. Phylogenomics resolves the timing and pattern of insect evolution. Science 2014, 346, 763–767. [Google Scholar] [CrossRef]
  62. Randolf, S.; Zimmermann, D.; Aspöck, U. Head anatomy of adult Coniopteryx pygmaea Enderlein 1906: Effects of miniaturization and the systematic position of Coniopterygidae (Insecta: Neuroptera). Arthropod. Struct. Dev. 2017, 46, 304–322. [Google Scholar] [CrossRef]
  63. Zimmermann, D.; Randolf, S.; Metscher, B.; Aspöck, U. The function and phylogenetic implications of the tentorium in adult Neuroptera (Insecta). Arthropod Struct. Dev. 2011, 40, 571–582. [Google Scholar] [CrossRef] [PubMed]
  64. Willmann, R. The phylogenetic position of the Rhachiberothinae and the basal sister-group relationships within the Mantispidae (Neuroptera). Syst. Entomol. 1990, 15, 253–265. [Google Scholar] [CrossRef]
  65. Aspöck, U.; Mansell, M. Arevision of the family Rhachiberothidae Tjeder, 1959, stat. n. (Neuroptera). Syst. Entomol. 1994, 19, 181–206. [Google Scholar] [CrossRef]
Figure 1. Comparison of structures of mitochondrial genomes among Suhpalacsa sp., Dendroleon pantherinus, Euroleon nostras, Neochauliodes punctatolosus and the putative ancestral insect. Linearized representation illustrates the gene arrangements of the circular genomes. The mitochondrial genomes of Suhpalacsa sp. and D. pantherinus are nearly complete. The E. nostras and N. punctatolosus have the partial mitochondrial genomes. The transcriptional direction of mitochondrial genes labeled above the line is from left to right and those labeled below the line indicate the opposite direction.
Genes 10 00108 g001
Figure 2. The secondary structures of (A) rrnL and (B) rrnS predicted for Dendroleon pantherinus.
Genes 10 00108 g002
Figure 3. AliGROOVE heat maps of pairwise sequence comparisons for the protein coding genes with 55 taxa. The AliGROOVE graph shows the mean similarity scores between sequences. AliGROOVE scores range from −1 (indicating great difference in rates from the remainder of the data set, i.e., red coloring implies the significant heterogeneity) to +1 (indicating rates match all other comparisons, i.e., blue labeling).
Genes 10 00108 g003
Figure 4. Phylogenetic tree inferred from IQ-TREE analysis of the PCGRNA data set with 55 taxa under the site-homogeneous GTR model. The clades with varying positions in the analyses of PCGRNA_Gblocks and PCG12RNA are indicated by dotted lines. Branch support values are presented near each node (Left: PCGRNA, Middle: PCGRNA_Gblocks, Right: PCG12RNA). Scale bar represents substitutions/site. The greens indicate the lineages of Hemerobiiformia and the blues indicate those of Myrmeleontiformia, while the yellow indicates the Nevrorthidae of Nevrorthiformia.
Genes 10 00108 g004
Figure 5. Bayesian tree inferred with PhyloBayes using the 55taxa PCGRNA data set under the site-heterogeneous CAT-GTR model. The species with different topology in the analysis from PCG12RNA is indicated by dotted lines. Values at nodes are Bayesian posterior probability support (Left: PCGRNA, Middle: PCGRNA_Gblocks, Right: PCG12RNA). Scale bar represents substitutions/site. The meaning of color is the same as those in Figure 4.
Genes 10 00108 g005
Table 1. Listing of taxa included in this study. Included is the detailed taxonomic status of each species used in the phylogenetic analyses and the GenBank accession number for each species.
ItemOrderSuborderFamilySpecies Accession
number
IngroupNeuropteraMyrmeleontiformiaAscalaphidaeAscalohybris subjacensKC758703
NeuropteraMyrmeleontiformiaAscalaphidaeAscaloptynx appendiculatusFJ171324
NeuropteraMyrmeleontiformiaAscalaphidaeLibelloides macaroniusNC_015609
NeuropteraMyrmeleontiformiaAscalaphidaeSuhpalacsa sp.MK301247
NeuropteraHemerobiiformiaRhachiberothidaeMucroberotha vesicariaKT425092
NeuropteraHemerobiiformiaBerothidaePodallea sp.KT425091
NeuropteraHemerobiiformiaBerothidaeStenobiella sp.KT425081
NeuropteraHemerobiiformiaChrysopidaeAbachrysa eurekaKY587199
NeuropteraHemerobiiformiaChrysopidaeApochrysa matsumuraeNC_015095
NeuropteraHemerobiiformiaChrysopidaeChrysopa pallensNC_019618
NeuropteraHemerobiiformiaChrysopidaeChrysoperla externaKU877169
NeuropteraHemerobiiformiaChrysopidaeChrysoperla nipponensisNC_015093
NeuropteraHemerobiiformiaChrysopidaeItalochrysa insignisKY587200
NeuropteraHemerobiiformiaChrysopidaeLeucochrysa pretiosaKY587201
NeuropteraHemerobiiformiaChrysopidaeNothancyla verreauxiKP264629
NeuropteraHemerobiiformiaChrysopidaeNothochrysa sp.KP264630
NeuropteraHemerobiiformiaChrysopidaeParankylopteryx sp.KY587202
NeuropteraHemerobiiformiaConiopterygidaeConiopteryx sp.KT425078
NeuropteraHemerobiiformiaConiopterygidaeSemidalis aleyrodiformisKT425067
NeuropteraHemerobiiformiaDilaridaeDilar sp.KT425073
NeuropteraHemerobiiformiaDilaridaeNallachius americanusKT425071
NeuropteraHemerobiiformiaHemerobiidaeDrepanepteryx phalaenoidesKT425087
NeuropteraHemerobiiformiaHemerobiidaeMicromus sp.KT425075
NeuropteraHemerobiiformiaHemerobiidaeNeuronema laminatumKR078257
NeuropteraHemerobiiformiaIthonidaeFontecilla graphicusKT425072
NeuropteraHemerobiiformiaIthonidaeOliarces claraKT425090
NeuropteraHemerobiiformiaIthonidaePolystoechotes punctatusFJ171325
NeuropteraHemerobiiformiaIthonidaeRapisma xizangenseKF626446
NeuropteraHemerobiiformiaIthonidaeRapisma zayuanumKF626447
NeuropteraHemerobiiformiaMantispidaeDitaxis biseriataFJ859906
NeuropteraHemerobiiformiaMantispidaeEumantispa harmandiKT425080
NeuropteraMyrmeleontiformiaMyrmeleontidaeDendroleon pantherinusMK301246
NeuropteraMyrmeleontiformiaMyrmeleontidaeEuroleon nostrasMK301248
NeuropteraMyrmeleontiformiaMyrmeleontidaeBullanga floridaKX369241
NeuropteraMyrmeleontiformiaMyrmeleontidaeEpacanthaclisis banksiKF701327
NeuropteraMyrmeleontiformiaMyrmeleontidaeGatzara jezoensisKY364372
NeuropteraMyrmeleontiformiaMyrmeleontidaeMyrmeleon immanisKJ461323
NeuropteraMyrmeleontiformiaNemopteridaeChasmoptera huttiiKT425069
NeuropteraMyrmeleontiformiaNemopteridaeNemoptera coaKT425079
NeuropteraNevrorthiformiaNevrorthidaeNevrorthus apateliosKT425074
NeuropteraNevrorthiformiaNevrorthidaeNipponeurorthus fuscinervisKT425076
NeuropteraMyrmeleontiformiaNymphidaeMyiodactylus osmyloidesKT425089
NeuropteraMyrmeleontiformiaNymphidaeNymphes myrmeleonoidesKJ461322
NeuropteraMyrmeleontiformiaOsmylidaeHeterosmylus sp.KT425077
NeuropteraMyrmeleontiformiaOsmylidaeThyridosmylus langiiKC515397
NeuropteraMyrmeleontiformiaPsychopsidaeBalmes birmanusKT425083
NeuropteraMyrmeleontiformiaPsychopsidaePsychopsis coelivagaKT425082
NeuropteraHemerobiiformiaSisyridaeClimacia areolarisKT425088
NeuropteraHemerobiiformiaSisyridaeSisyra nigraKT425070
OutgroupRaphidiopteraInocelliidaeInocellia fujianaKT425085
RaphidiopteraInocelliidaeNegha inflataKT425086
RaphidiopteraRaphidiidaeXanthostigma gobicolaKT425093
MegalopteraCorydalidaeNeochauliodes punctatolosusMK301249
MegalopteraSialidaeDysmicohermes ingensKJ806318
MegalopteraCorydalidaeCorydalus cornutusFJ171323
Note: Bold indicates the species newly sequenced in this study.
Table 2. Statistics associated to the sequencing of mitochondrial genomes using NGS-Illumina technology in four neuropteridan species.
SpeciesContig LengthMapped BasesMean CoverageTotal Number of ReadsMapped Paired Reads
Suhpalacsa sp.15,5408,365,370538163,544,33655,770/0.03%
Dendroleon pantherinus15,4165,518,285357179,658,61436,789/0.02%
Euroleon nostras90952,222,880244128,598,23614,820/0.01%
Neochauliodes punctatolosus-----
N. punctatolosus contig-17013340,17449128,598,2362268/0.00%
N. punctatolosus contig-26391607,74995128,598,2364052/0.00%
Table 3. Substitution saturations measured by DAMBE using Xia’s method.
Gene partitionsNumOTUIssaIss.cSymbPsymcIss.cAsymdPasyme
PCG1320.349 0.808 0.000 0.554 0.000
PCG2320.240 0.808 0.000 0.554 0.000
PCG3320.736 0.808 0.000 0.554 0.000
PCG123320.406 0.818 0.000 0.572 0.000
tRNA+rRNA320.452 0.807 0.000 0.549 0.000
tRNA320.361 0.773 0.000 0.488 0.000
rRNA 320.511 0.787 0.000 0.515 0.798
aIss: index of substitution saturation; bIss.cSym: index of substitution saturation assuming a symmetrical true tree; cPsym: probability of significant difference between Iss and Iss.cSym (two-tailed test); d Iss.cAsym: index of substitution saturation assuming an asymmetrical true tree; e Pasym: probability of significant difference between Iss and Iss.cAsym (two-tailed test).
Table 4. The substitution rate analyses conducted by yn00 implemented in PAML.
SpeciesdNdSdN/dS
Abachrysa eureka0.101 4.517 0.022
Apochrysa matsumurae0.100 4.614 0.022
Ascalohybris subjacens0.130 4.758 0.027
Ascaloptynx appendiculatus0.109 4.770 0.023
Balmes birmanus0.099 4.621 0.021
Bullanga florida0.113 4.808 0.023
Chasmoptera huttii0.126 4.839 0.026
Chrysopa pallens0.097 4.601 0.021
Chrysoperla externa0.097 4.580 0.021
Chrysoperla nipponensis0.097 4.691 0.021
Climacia areolaris0.131 4.647 0.028
Coniopteryx sp.0.202 4.835 0.042
Corydalus cornutus0.145 4.789 0.030
Dendroleon pantherinus0.111 4.780 0.023
Dilar sp.0.162 4.949 0.033
Ditaxis biseriata0.105 4.648 0.023
Drepanepteryx phalaenoides0.114 4.688 0.024
Dysmicohermes ingens0.132 4.614 0.029
Epacanthaclisis banksi0.106 4.795 0.022
Eumantispa harmandi0.103 4.544 0.023
Euroleon nostras0.110 4.743 0.023
Fontecilla graphicus0.102 4.574 0.022
Gatzara jezoensis0.114 4.704 0.024
Heterosmylus sp.0.125 4.598 0.027
Inocellia fujiana0.173 4.584 0.038
Italochrysa insignis0.106 4.594 0.023
Leucochrysa pretiosa0.098 4.554 0.022
Libelloides macaronius0.111 4.835 0.023
Micromus sp.0.113 4.626 0.024
Mucroberotha vesicaria0.100 4.626 0.022
Myiodactylus osmyloides0.108 4.669 0.023
Myrmeleon immanis0.105 4.733 0.022
Nallachius americanus0.175 4.860 0.036
Negha inflata0.174 4.570 0.038
Nemoptera coa0.140 4.768 0.029
Neochauliodes punctatolosus0.136 4.779 0.028
Neuronema laminatum0.118 4.667 0.025
Nevrorthus apatelios0.119 4.654 0.025
Nipponeurorthus fuscinervis0.118 4.596 0.026
Nothancyla verreauxi0.099 4.545 0.022
Nothochrysa sp.0.097 4.583 0.021
Nymphes myrmeleonoides0.107 4.536 0.024
Oliarces clara0.106 4.624 0.023
Parankylopteryx sp.0.100 4.544 0.022
Podallea sp.0.113 4.696 0.024
Polystoechotes punctatus0.098 4.586 0.021
Psychopsis coelivaga0.102 4.704 0.022
Rapisma xizangense0.120 4.452 0.027
Rapisma zayuanum0.120 4.450 0.027
Semidalis aleyrodiformis0.185 4.728 0.039
Sisyra nigra0.131 4.600 0.028
Stenobiella sp.0.108 4.626 0.023
Suhpalacsa sp.0.109 4.798 0.023
Thyridosmylus langii0.134 4.725 0.028
Xanthostigma gobicola0.185 4.691 0.039

