Article

Non-Syndromic Cleft Lip with or without Cleft Palate: Genome-Wide Association Study in Europeans Identifies a Suggestive Risk Locus at 16p12.1 and Supports SH3PXD2A as a Clefting Susceptibility Gene

by
Iris ALM van Rooij
1,†,
Kerstin U Ludwig
2,†,
Julia Welzenbach
2,
Nina Ishorst
2,
Michelle Thonissen
3,
Tessel E Galesloot
1,
Edwin Ongkosuwito
3,
Stefaan J Bergé
4,
Khalid Aldhorae
5,
Augusto Rojas-Martinez
6,
Lambertus ALM Kiemeney
1,7,
Joris Robert Vermeesch
8,
Han Brunner
9,10,
Nel Roeleveld
1,
Koen Devriendt
11,
Titiaan Dormaar
12,13,
Greet Hens
14,
Michael Knapp
15,
Carine Carels
8,9,16,† and
Elisabeth Mangold
2,*,†
1
Department for Health Evidence, Radboud Institute for Health Sciences, Radboud university medical center, 6500 HB Nijmegen, The Netherlands
2
Institute of Human Genetics, University of Bonn, 53127 Bonn, Germany
3
Department of Dentistry, Radboud Institute for Health Sciences, Section of Orthodontics and Craniofacial Biology, Radboud university medical center, 6500 HB Nijmegen, The Netherlands
4
Department of Oral and Maxillofacial Surgery, Radboud university medical center, 6500 HB Nijmegen, The Netherlands
5
Orthodontic Department, College of Dentistry, Thamar University, Thamar, Yemen
6
Tecnologico de Monterrey, School of Medicine, and Universidad Autonoma de Nuevo Leon, Centro de Investigación y Desarrollo en Ciencias de la Salud, Monterrey 64460, Mexico
7
Department of Urology, Radboud Institute for Health Sciences, Radboud university medical center, 6500 HB Nijmegen, The Netherlands
8
Department of Human Genetics, KU Leuven, 3000 Leuven, Belgium
9
Department of Human Genetics, and Donders Institute for Brain, Cognition and Behaviour, Radboud university medical center, 6500 HB Nijmgen, The Netherlands
10
Department of Clinical Genetics, and GROW School for Oncology and Developmental Biology, Maastricht University Medical Center, 6202 AZ Maastricht, The Netherlands
11
Center for Human Genetics, University Hospitals Leuven, KU Leuven, 3000 Leuven, Belgium
12
Department of Imaging and Pathology, KU Leuven, 3000 Leuven, Belgium
13
Oral and Maxillofacial Surgery, University Hospitals Leuven, 3000 Leuven, Belgium
14
Department of Neurosciences, Experimental Otorhinolaryngology, KU Leuven, 3000 Leuven, Belgium
15
Institute of Medical Biometry, Informatics and Epidemiology, University of Bonn, 53127 Bonn, Germany
16
Orthodontics, University Hospitals KU Leuven, 3000 Leuven, Belgium
*
Author to whom correspondence should be addressed.
These authors have contributed equally to this work.
Genes 2019, 10(12), 1023; https://doi.org/10.3390/genes10121023
Submission received: 4 November 2019 / Revised: 4 December 2019 / Accepted: 5 December 2019 / Published: 7 December 2019
(This article belongs to the Special Issue Molecular Genetics of Facial Traits and Malformations)

Abstract

:
Non-syndromic cleft lip with or without cleft palate (nsCL/P) ranks among the most common human congenital malformations, and has a multifactorial background in which both exogenous and genetic risk factors act in concert. The present report describes a genome-wide association study (GWAS) involving a total of 285 nsCL/P patients and 1212 controls from the Netherlands and Belgium. Twenty of the 40 previously reported nsC/LP susceptibility loci were replicated, which underlined the validity of this sample. SNV-based analysis of the data identified an as yet unreported suggestive locus at chromosome 16p12.1 (p-value of the lead SNV: 4.17 × 10⁻⁷). This association was replicated in two of three patient/control replication series (Central European and Yemeni). Gene analysis of the GWAS data prioritized SH3PXD2A at chromosome 10q24.33 as a candidate gene for nsCL/P. To date, support for this gene as a cleft gene has been restricted to data from zebrafish and a knockout mouse model. The present GWAS was the first to implicate SH3PXD2A in non-syndromic cleft formation in humans. In summary, although performed in a relatively small sample, the present GWAS generated novel insights into nsCL/P etiology.

1. Introduction

Orofacial clefting represents the second most common congenital malformation in humans, after various forms of heart defects all combined [1]. Despite advances in surgical correction, the disorder has lifelong implications for the health and social integration of those affected. Improved understanding of cleft etiology may facilitate development of new preventative measures and therapeutic approaches, and may improve genetic counseling for families at risk.
Clefting can occur either as part of a complex malformation syndrome or as an isolated anomaly, and several cleft subphenotypes have been defined according to the affected anatomical structures. The most frequent subphenotype is non-syndromic cleft lip with or without cleft palate (nsCL/P). In European populations, the estimated prevalence of nsCL/P is around 1:1000 [1]. The etiology of nsCL/P is multifactorial, whereby genetic risk factors, environmental exposures, and potential gene–environment interactions all contribute to disease susceptibility. The estimated contribution of all combined genetic factors to nsCL/P is 90% [2].
Since 1989, diverse genetic approaches have been used to identify genes and pathways underlying nsCL/P, including linkage and candidate gene studies. However, prior to the commencement of the genomics era around a decade ago, extensive research efforts had identified only two common genetic factors that could be considered true nsCL/P-associated risk factors: (1) the regulatory region of the Interferon Regulatory Factor 6 (IRF6), which was identified in a candidate gene association study; and (2) the Forkhead Box E1 (FOXE1) risk locus, which was identified in a meta-analysis of linkage data [3,4]. In the genomics era, new DNA sequencing techniques have enabled whole-exome sequencing, which has led to the identification of potential nsCL/P susceptibility variants in Cadherin 1 (CDH1) and a small number of other genes [5,6,7]. Variants detected to date via exome sequencing have been dominant, heterozygous, and can be important for the respective family as carriers of such variants can be at high risk. However, these are rare findings, and currently explain only a small fraction of patients.
Many key genetic findings in nsCL/P have resulted from another powerful tool of the genomics era, i.e., the genome-wide association study (GWAS) and follow-up analysis approach. To date, this approach has identified a total of 38 common risk loci for nsCL/P [8,9,10,11,12,13,14,15,16,17,18,19,20].
At the time of writing, a total 40 common nsCL/P risk loci are known. However, these account for only a modest proportion of the genetic variance of nsCL/P, e.g., up to 30% of the narrow-sense heritability in the European population [19]. Thus, the existence of further common risk loci must be assumed. Given the tremendous success of the nsCL/P GWAS and follow-up study approach over the past decade, further GWAS appear to be warranted.
The present report describes a GWAS in a medium-sized nsCL/P case/control sample of European ethnicity recruited in the Netherlands and Belgium. In addition to the SNV-wise evaluation of data, gene-based and pathway analyses were performed. In these analyses, genetic marker data were aggregated to the level of whole genes or biological processing to test the joint association of all markers in the gene with the phenotype of interest, thereby increasing statistical power.

2. Materials and Methods

2.1. Ethics Statement

The study was approved by the Regional Committee on Research Involving Human Subjects Arnhem-Nijmegen, and the Review Board for Clinical Studies of the University Hospital KU Leuven. All study procedures were performed in accordance with the principles of the Declaration of Helsinki. The NBS protocol was approved by the Regional Committee on Research Involving Human Subjects Arnhem-Nijmegen. Written informed consent was obtained from all patients/participants, or their parents/legal guardians in the case of legal minors.

2.2. GWAS Patients

Patients were part of the AGORA project (Aetiological Research into Genetic and Occupational/Environmental Risk Factors for Anomalies in Children) [21]. The AGORA project commenced in 2005 and has established a large data and biobank of DNA samples and clinical and questionnaire data from: (i) children with congenital malformations or childhood cancer, (ii) their respective parents, and (iii) controls. Patients are recruited at two sites: (1) the Radboud University Medical Center (Radboudumc) Nijmegen, The Netherlands; and (2) University Hospital KU, Leuven, Belgium. Only patients with nsCL/P were eligible for inclusion in the present study. Patients with other cleft phenotypes, such as an isolated cleft palate, and patients with a possible specific malformation syndrome, intellectual disability, or other anomalies were excluded from the present study.
In the Nijmegen initiative, collection of data and biomaterials from patients with clefting commenced in 2007. Intraoperative blood or saliva samples were collected, and parents were asked to complete a questionnaire and to donate blood or saliva samples. The questionnaire addresses demographics and family history, among other factors. At the beginning of 2012, three “biomaterial donation days” were arranged to collect blood or saliva from clefting patients who had been treated at Radboudumc prior to 2007. At these sessions, blood or saliva samples and questionnaire data were also collected from parents.
In the Leuven initiative, collection of data and biomaterials from patients with clefting commenced in 2010. Blood samples and clinical and questionnaire data (e.g., demographics and family history) were collected from pediatric patients and their parents.
At both Leuven and Nijmegen clinical sites, all pediatric clefting patients underwent a clinical examination by an orthodontist, a maxillofacial surgeon, a plastic surgeon, and a clinical geneticist from the Cleft Lip and Palate team. To determine phenotype classification in the present cohort, data were retrieved from the respective medical charts.
The present analyses were performed using DNA samples from nsCL/P patients who were treated and followed up at: (1) Radboudumc (n = 219); or (2) University Hospital of KU Leuven (n = 66). The initial patient sample therefore comprised 285 nsCL/P patients. All patients were of self-reported European ancestry. Ancestral background in the Dutch and Belgian samples was assessed by identifying the origins of the grandparents and the parents, respectively.

2.3. GWAS Controls

Population-based controls (n = 1212) were drawn from the Nijmegen Biomedical Study (NBS), a population-based survey conducted by the Department for Health Evidence and the Department of Laboratory Medicine of the Radboud University Medical Center. This cohort was established to generate a universal reference population for the investigation of genetic variation and lifestyle and environmental exposures for a variety of traits and diseases in case/control studies [22]. A total of 22,451 age- and sex-stratified, randomly selected inhabitants of the municipality of Nijmegen received an invitation to fill out a postal questionnaire on lifestyle and medical history, and to donate an 8.5 mL blood sample in a serum separator tube and a 10 mL EDTA blood sample. The overall response to the questionnaire was 42% (n = 9350), and 69% (n = 6468) of the respondents donated blood samples.

2.4. GWAS Genotyping and Quality Control (QC)

Within the AGORA project, standard methods are used to extract DNA from blood collected in EDTA tubes or saliva specimens collected in ORAgene containers (DNA Genotek Inc., Ottawa, Canada). In the present study, genotyping of the 285 nsCL/P patients from AGORA was performed using the Illumina OmniExpressExome Array (Illumina, San Diego, CA, USA). Within the NBS project, DNA was genotyped using Illumina chips. For the present analyses, Illumina’s OmniExpress Array (Illumina, San Diego, CA, USA) genotype data for the 1212 NBS participants were available. A total of 718,286 SNVs were present in both patients and controls.
Exclusion criteria for patient and control data were: (i) any discrepancy between documented and genotyped sex; (ii) a call rate of <99%; or (iii) evidence from multidimensional scaling (MDS) of ethnic outlier status (Figure S1). Un-relatedness between individuals was evaluated using the program KING [23].
Markers were excluded from the analysis if the minor allele frequency (MAF) was <1% or the call rate was <95% in either patients or controls. In addition, markers were excluded if there was deviation from Hardy–Weinberg equilibrium at p < 10−4 in controls or p < 10−6 in patients.

2.5. Imputation of GWAS Data

The combined post-QC dataset for patients and controls was subjected to imputation using the June 2014 release of the 1000 Genomes Project and the program IMPUTE2 [24]. SNVs with an INFO score ≥ 0.4 and a MAF > 1% were then tested for association using SNPTEST [25]. For the logistic regression analysis, the first five components obtained from MDS were used as covariates.

2.6. Genome-Wide Association Analysis

Four patients were excluded due to gender incompatibility (discrepancy between documented and genotyped sex). Two patients and one control sample were excluded due to a call rate < 99%. Five patients and 24 controls were excluded due to relatedness. Fifteen patients were excluded due to ethnic outlier status. Following these QC procedures, 259 patients and 1187 controls remained for further analysis. In total, 8,785,346 imputed SNVs with an INFO score ≥ 0.4 and a MAF > 1% were finally tested. For each SNV passing QC, a logistic regression model was considered, with the additively coded SNV as the predictor variable and the first five MDS coordinates as covariates. The p-value of the likelihood ratio test of no association was then calculated.

2.7. Replication Analysis for Two Interesting SNVs

Two SNVs were of particular interest, as they had small p-values and were located in regions not reported to be nsCL/P risk loci. For these two interesting candidate SNVs (rs73145631 at chromosome 12, and rs56383345 at chromosome 16), replication was performed by genotyping these SNVs in three case/control nsCL/P samples: (i) 223 nsCL/P patients and 978 controls of Central European descent (sample presented in Mangold et al., 2010); (ii) 156 nsCL/P patients and 337 controls from the Chiapas, Mexico (sample presented in Rojas-Martinez et al. 2013); and (iii) 231 nsCL/P patients and 422 controls from Yemen (sample presented in Böhmer et al., 2014) [10,26,27].
A MassARRAY genotyping assay was designed using the Assay Design Suite Software v 1.0 Software (AGENA Bioscience, San Diego, USA). The genotyping assay contained these two SNVs of interest and 26 SNVs from other projects. SNVs were genotyped using the MassARRAY system and end-point PCR, followed by matrix-assisted laser desorption/ionization time-of-flight (MALDI-ToF) mass spectrometry (AGENA Bioscience, San Diego, USA). Data analysis was performed using the AGENA Spectrodesigner Software package. Individual genotypes were assigned using the AGENA Typer Analysis software. Primers were synthesized at Metabion, Germany (individual primer sequences available upon request). Intra- and interplate duplicates were included for quality control purposes. No genotype inconsistencies were observed.
Association statistics were calculated by applying the Armitage-trend test separately for each sample cohort. For each SNV, relative risks of the three replication cohorts were combined using fixed-effect meta-analysis.

2.8. Prioritization of Candidate Genes

To prioritize candidate genes from the present GWAS dataset, SNV data with an INFO score > 0.6 were uploaded into FUMAGWAS (https://fuma.ctglab.nl/) [28]. Gene and gene-set analyses implemented in FUMAGWAS were based on GWAS summary statistics. In the present study, these analyses were performed with MAGMA, a tool that can be used for gene and gene-set analysis from GWAS data [29]. Input SNVs were mapped to 18,644 protein coding genes. Genome wide significance was defined as a p-value of 0.05/18,644 = 2.682 × 10⁻⁶.

2.9. Expression Analysis using SysFACE

Evaluation of expression of a given candidate gene and its neighboring genes was performed using the bioinformatics tool SysFACE (systems tool for craniofacial expression-based gene discovery; https://bioinformatics.udel.edu/research/sysface). For each gene, expression data for various time-points of murine embryonic development in organs specific for the phenotype under study (maxilla, frontonasal, palate) were identified from microarray-based genome-level gene expression profiles across various mouse embryonic orofacial tissues.

3. Results

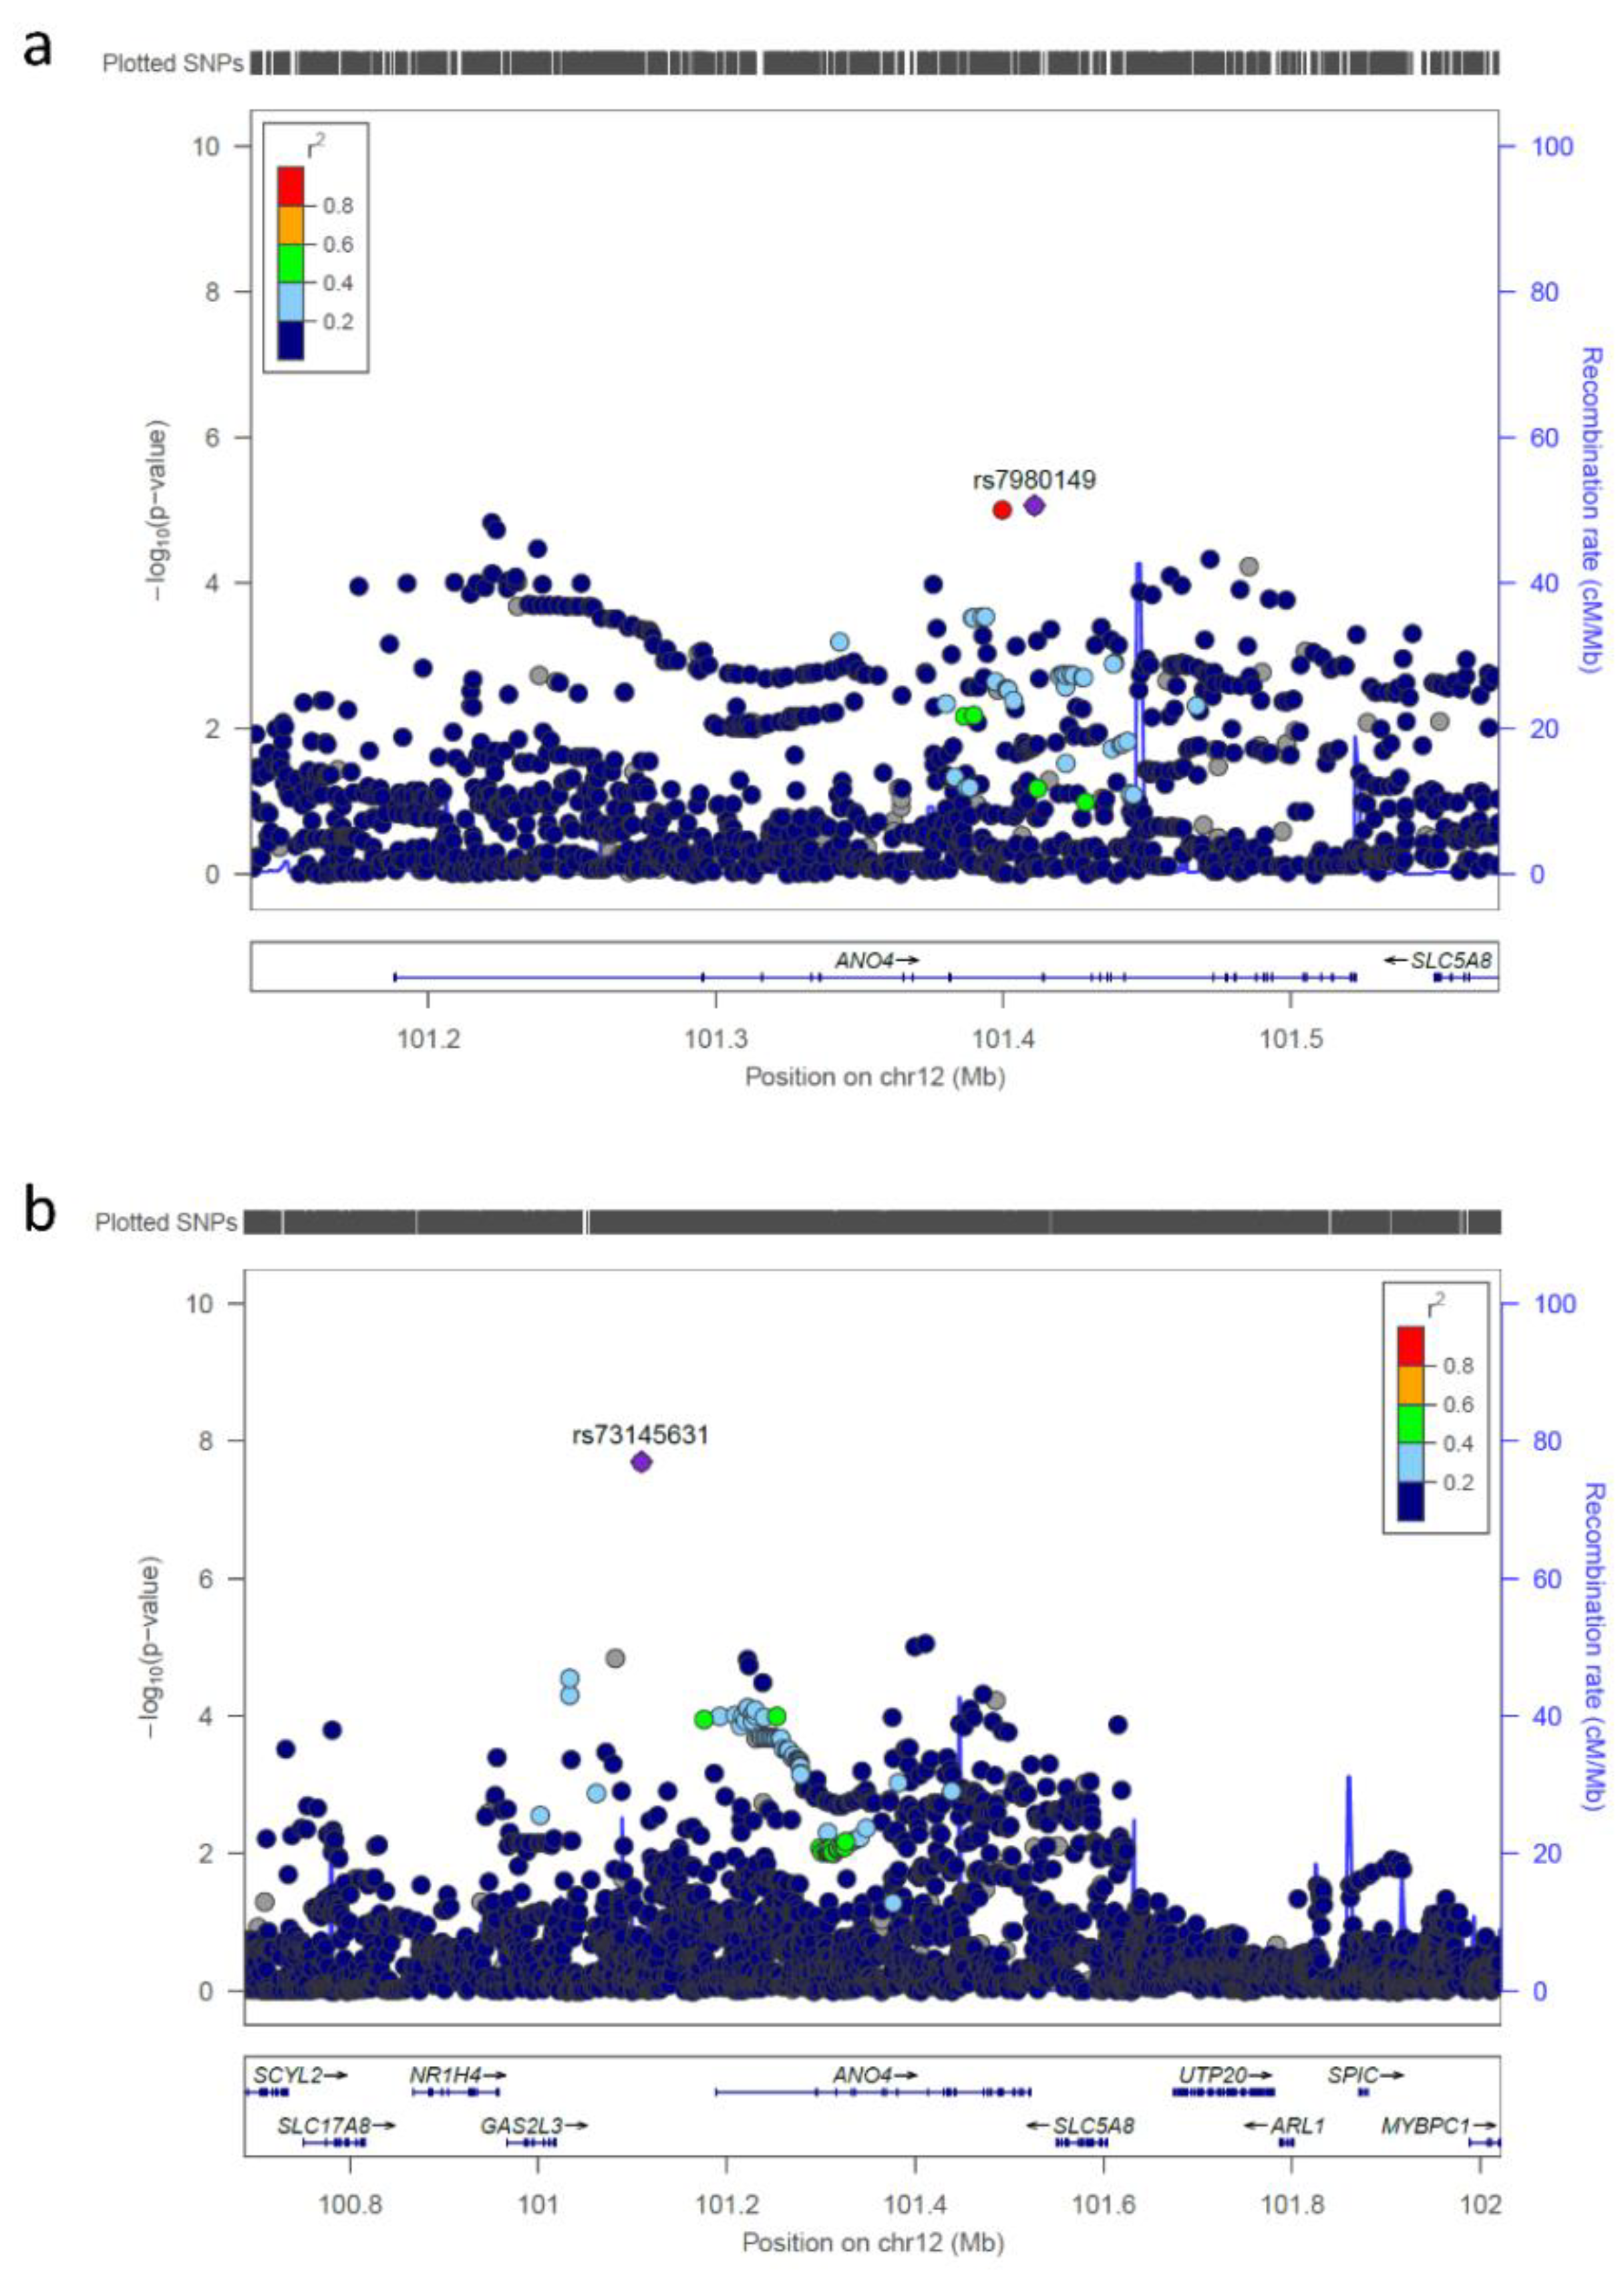
3.1. SNV-Based Analysis

A total of 615,168 autosomal markers passed QC for both samples. The genomic inflation factor lambda was 1.044. The Q–Q plot is shown in Figure S2.
In the imputed GWAS data, 228 SNVs at a total of 25 different loci yielded p-values < 10−5 and an INFO score > 0.8 (Table 1, Table S1, Figure S3).
Genome-wide significance (p < 5 × 10⁻⁸) was reached by 63 SNVs at two loci. One of the genome-wide significant SNVs was rs73145631 at 12q23.1, a locus that has not been reported as an nsCL/P risk locus previously. It was subjected to a replication step in three independent case/control samples (Table 2). In none of the three replication samples, nor after combining the replication data in a meta-analysis was the association for this SNV replicated. The other 62 genome-wide significant SNVs were located at an already well-known nsCL/P susceptibility locus at chromosome 8q24.21. This locus was initially identified in the Central European case/control sample that served as a replication sample for the present study [8]. It was later replicated in many other samples—among others, the Mexican and the Yemeni replication samples that were used for replication in the present study [26,27]. This locus was therefore not included in the replication step of the present study.
This locus had not been reported as a recognized nsCL/P risk locus in previous studies. Therefore, rs56383345 was also subjected to replication in the three independent patient/control samples (Table 2). A nominally significant p-value was obtained for rs56383345 in both the European and the Yemeni sample (0.027 and 0.0099 respectively). The p-value obtained after combination of all three replication samples by meta-analysis was also nominally significant (p = 0.00167). However, no association signal was obtained in the Mexican sample only (p = 0.577). Rs56383345 is located in a 930 kb non-coding region. Evaluation of the 16p12.1 region with the bioinformatics tool SysFACE did not implicate any flanking genes as cleft candidate genes.

3.2. Replication of Previously Reported nsCL/P Susceptibility Loci

Of the 40 previously reported nsCL/P susceptibility loci, 20 showed at least a nominally significant p-value (p < 0.05) in the present dataset (Table 3). For three of these loci, the lead SNV from the literature and the lead SNV in the present dataset were identical. At 15 of the 20 loci, a SNV in substantial linkage disequilibrium (LD) (r2 > 0.6) with the lead SNV from the literature achieved a lower p-value. For two of the 20 loci, the lead SNVs were not in LD with the lead SNV from the literature.

3.3. Gene-Based Evaluation and Gene-Set Analysis

For the gene-based evaluation, genome-wide significance was set by FUMAGWAS at p < 2.672 × 10⁻⁶ and was achieved by two different genes: (i) SH3 And PX Domains 2A (SH3PXD2A) at chromosome 10q24.33 (p = 1.82 × 10⁻⁸); and (ii) anoctamin 4 (ANO4) at chromosome 12q23.1 (p = 1.46×10⁻⁷) (Figure 2, Figure 3, Figure S4, Table S2). To date, neither of these genes has been proposed as a candidate gene for clefting in humans. For ANO4, the SysFACE evaluation revealed no expression at any relevant embryonic time-points in tissues of relevance to lip and palate development in the mouse model (Figure S5). However, Growth Arrest Specific 2 Like 3 (GAS2L3), which is located upstream of ANO4, is expressed in the murine maxilla at E11.5 to E12.5, and Insulin-Like Growth Factor 1 (IGF1), which is located downstream, is expressed in the murine maxilla at E11.5 to E12.5 and also in the murine palate at E14.5.
Genes with a suggestive p-value (2.672 × 10⁻⁶ < p < 10−4) in the gene analysis included the gene Paired Box 7 (PAX7) at chromosome 1p36.13. PAX7 is a well-known cleft candidate gene (Table 4). The PAX7 locus has shown genome-wide association in two previous studies, and rare, potentially pathogenic variants located in or near PAX7 have been reported in patients with orofacial clefting [30,31,32,33].
The gene-set analysis implemented in FUMAGWAS revealed twelve gene ontology (GO) gene sets with an adjusted p-value < 0.05 (Table S2). The two gene sets with the lowest p-values were GO_TISSUE_MORPHOGENESIS (adjusted p = 0.0259) and GO_KERATINOCYTE_PROLIFERATION (adjusted p = 0.0259).

4. Discussion

The present report describes a GWAS performed in nsCL/P patients from the Netherlands and Belgium and unaffected controls from the Netherlands. The sample comprised 259 patients and 1187 controls, and thus represents a medium-sized nsCL/P cohort. Nonetheless, the replication of 20 of the 40 previously reported nsCL/P susceptibility loci—four of which were originally identified in Asian samples—demonstrated the power of the sample. Notably, at the well-established nsCL/P susceptibility locus at chromosome 8q24.21, the analyses identified 62 genome-wide significant SNVs. Among others, the results of the gene-set analysis prioritized GO_TISSUE_MORPHOGENESIS and GO_KERATINOCYTE_PROLIFERATION. This was consistent with the hypothesis that nsCL/P arises from the disturbed proliferation, adhesion, and apoptosis of cells in the facial prominences during embryogenesis, and demonstrated the validity of the present Dutch/Belgian sample [33].
The SNV-based analysis identified a novel locus at chromosome 16p12.1 yielding suggestive evidence of association (lead SNV rs56383345 with a p = 4.17 × 10⁻⁷). This association was replicated in two of the three replication series (Central European and Yemeni). The association was not replicated in the Mexican patient/control series. However, the MAF for this SNV in the Mexican series was <2%, so the sample would not be expected to have much power to detect a true association. The SNV rs56383345 maps to a 930 kb non-coding region at 16p12.1, and is not located in any currently known regulatory element [34]. The nearest flanking genes are heparan sulfate-glucosamine 3-sulfotransferase 4 (HS3ST4) upstream and C16orf82 downstream. Neither of these genes, nor any other genes near rs56383345, has any reported role in cleft development. Furthermore, no orofacial clefting has been reported in those patients from the DECIPHER database [35] who have a copy number variant encompassing the new suggestive susceptibility locus or either one of the flanking genes.
Twenty of the 40 recognized nsCL/P susceptibility loci were replicated with at least a nominally significant p-value (p < 0.05) in the present study. At 3 of these 20 replicated loci, the lead SNV reported in the literature and the lead SNV in the present dataset were identical, and at 15 loci a SNV in LD (r2 > 0.6) with the lead SNV from the literature achieved a smaller p-value. Notably, at two of the 20 replicated loci, namely 1p36 and 3q29, additional peaks with lead SNVs not in LD with the lead SNV from the original literature were identified. This suggested that the original sample and the Dutch/Belgian sample have differing haplotype structures.
In addition to the “typical” single-SNV analyses, the present study involved a gene analysis, which generated several interesting findings. In a gene analysis, genetic marker data are aggregated to the level of whole genes to test the joint associations of all markers in the gene with the phenotype [36]. Previous authors have suggested that this approach represents a potentially more powerful alternative to single-SNV analyses. The gene analysis approach has the advantage of considerably reducing the required number of tests, and renders possible detection of effects consisting of multiple weaker associations, which would otherwise be overlooked.
The present gene analysis prioritized SH3PXD2A at chromosome 10q24.33 as a candidate gene for nsCL/P. SH3PXD2A is a protein-coding gene with 15 exons and a size of 267 kb. The SH3PXD2A gene product is necessary for the formation and function of podosomes, which are structures located on the cellular surface that establish close contact with the extracellular matrix, and are involved in cell migration and matrix degradation [37]. Observations in zebrafish and knockout mice suggest that SH3PXD2A is also a potential risk gene for orofacial clefting [38,39]. In mammals, the primary and secondary palate forms from cranial-neural-crest-cell-derived mesenchymal protuberances, and any alteration in the growth, proliferation, movement, adhesion, or death of cells composing the palatal structures can affect palatal architecture and lead to orofacial clefting. SH3PXD2A encodes TKS5, a scaffold protein shown to be fundamental to zebrafish neural crest cell migration in vivo [38]. However, even stronger support for that SH3PXD2A may be a cleft candidate gene has been generated by Cejudo-Martin et al., who showed that disruption of the mouse Sh3pxd2a gene was associated with complete cleft of the secondary palate in 50–90% of mutant mice [39]. Of note, the fact, that the mouse model in Cejudo-Martin et al. has a cleft of the secondary palate but not a cleft lip, does not speak against this gene being also involved in nsCL/P formation in humans. The present gene analysis provides the first strong support for the involvement of SH3PXD2A in non-syndromic cleft formation in humans.
Gene evaluation of the present GWAS data also prioritized the gene anoctamin 4 (ANO4) at chromosomal band 12q23.1. Interestingly one SNV, rs73145631, located 79 kb upstream of the transcription start site of this gene, achieved genome-wide significance in this dataset. The SNV association signal should be considered independent of the MAGMA gene analysis, which only took into account signals located between the transcription start and stop sites of the gene. The protein product of the candidate gene, ANO4, is a transmembrane protein from the anoctamin family. This protein family plays a key role in diverse physiological functions, including ion transport, phospholipid scrambling, and the regulation of other ion channels. While the ANO1 and ANO2 proteins have been functionally characterized, the roles of other family members, such as ANO4, remain poorly understood and controversial [40]. There is currently no convincing support for ANO4 as a cleft susceptibility gene in the literature or publically available databases on gene expression, such as SysFace. However, it is possible that rather than being attributable to the ANO4 gene itself, this association signal was generated by a regulatory element located intronically in ANO4, which influences the activity of another nearby gene. Notably, two genes in the vicinity of the ANO4 signal are expressed at relevant embryonic time-points in tissues of relevance to lip and palate development in the mouse model: (i) Growth Arrest Specific 2 Like 3 (GAS2L3), located upstream from ANO4; and (ii) Insulin Like Growth Factor 1 (IGF1), located downstream [34]. In the present GWAS, the genome-wide significant association signal for rs73145631 in the ANO4 upstream region could be interpreted as additional independent support for the ANO4 locus, despite being based on the same data. However, for several reasons, these results must be interpreted with caution. First, no supportive association signal for rs73145631 was found in any of the three replication cohorts. Second, interpretation of the GWAS association signal for rs73145631 was hampered by the fact that no SNVs were in LD with this SNV in this dataset. Even though it was not replicated in any of the three replication samples, the finding may be a true association specific to the present Dutch/Belgian sample, or may represent a false positive signal from a single marker.
After Asians, Europeans represent the second most common ethnicity in published nsCL/P association studies. The largest ethnically homogenous GWAS sample to date included 2033 patients of Chinese ancestry [17]. The largest European SNV data set explored to date combined 1158 nsCL/P patients from two large studies in a genome-wide meta-analysis [20]. Compared to such studies, the present sample size was relatively small, but this sample was valid and allowed the generation of interesting results warranting further investigation. The present sample is also of value in terms of future meta-analyses of GWAS data. These meta-analyses will increase statistical power for locus discovery, and facilitate the elucidation of the genetic background of orofacial clefting.

5. Conclusions

In summary, the present GWAS generated novel insights into the etiology of nonsyndromic orofacial clefting. The gene-based analysis provided strong support for SH3PXD2A as a candidate gene identified in animal models, and the SNV analysis identified two novel suggestive risk loci. The present results demonstrate how even medium-sized, clinically well characterized GWAS samples can improve knowledge of the genetic basis of nsCL/P.

Supplementary Materials

The following are available online at https://www.mdpi.com/2073-4425/10/12/1023/s1, Figure S1: Multidimensional Scaling (MDS) analysis, Dutch/Belgian GWAS individuals in blue, patients open diamonds, controls dots; Figure S2: QQ-plot; Figure S3: Manhattan plot of summary statistics; Figure S4: Manhattan plot of gene-based test; Figure S5: UCSC tracks of ANO4 region including SysFace data; Table S1–S2: (S1) 25 nsCL/P risk loci with genome-wide significant or suggestive association in imputed Dutch/Belgian GWAS, (S2) Gene-set analysis.

Author Contributions

Conceptualization, C.C., E.M., I.A.v.R. and K.L.; methodology, C.C., I.A.v.R., J.W., M.K. and N.I.; formal analysis, J.W., M.K. and N.I.; investigation, C.C., E.M., E.O., G.H., I.A.v.R., H.B., J.R.V., J.W., K.D., K.U.L., L.A.K., M.T., N.I., N.R., S.J.B., T.D. and T.E.G.; resources, A.R.-M., C.C, E.M., E.O., G.H., I.A.v.R., H.B., J.R.V., K.A., K.D., K.L., L.A.K., M.T., N.R., S.J.B., T.D. and T.E.G.; data curation, M.K. and T.E.G.; writing—original draft preparation, C.C., E.M., I.A.v.R., K.U.L., M.T., N.I. and M.K.; writing—review and editing, A.R.-M., C.C., E.O., G.H., H.B., I.A.v.R., J.R.V., J.W., K.A., K.D., L.K., M.T., N.R., S.J.B., T.D. and T.G.; supervision, C.C., E.M., I.A.v.R. and K.L.; funding acquisition, C.C.; project administration C.C. and I.A.v.R.

Funding

This study was sponsored by the EOS Research Grant 2015, (EOS: European Orthodontic Society, London; Title of the study: Genome-wide association study for orofacial clefts and subphenotypes); by The European Science Foundation (09-RNP-023, Title of the network grant: ESF Network for Orofacial Clefts Research, Prevention and Treatment (EuroCleftNet)); and by the German Research Foundation (Grant LU1944-3/1, Title of the study: Integrative craniofacial genomics).

Acknowledgments

The authors thank all patients, relatives, and control individuals for their participation. We thank Marjan Kloen, the social nurse of the Cleft lip/palate team of the Radboudumc for her help in the recruitment of patients and acknowledge the invaluable assistance of all other clinical, laboratory, and bioinformatic personnel. This study makes use of data generated by the DECIPHER community. A full list of centres who contributed to the generation of the data is available from http://decipher.sanger.ac.uk and via email from [email protected]. Funding for the project was provided by the Wellcome Trust.

Conflicts of Interest

The authors declare no conflict of interest.

References

  1. Mangold, E.; Ludwig, K.U.; Nöthen, M.M. Breakthroughs in the genetics of orofacial clefting. Trends Mol. Med. 2011, 17, 725–733. [Google Scholar] [CrossRef] [PubMed]
  2. Grosen, D.; Bille, C.; Petersen, I.; Skytthe, A.; von Hjelmborg, J.B.; Pedersen, J.K.; Murray, J.C.; Christensen, K. Risk of oral clefts in twins. Epidemiology 2011, 22, 313–319. [Google Scholar] [CrossRef] [PubMed]
  3. Rahimov, F.; Marazita, M.L.; Visel, A.; Cooper, M.E.; Hitchler, M.J.; Rubini, M.; Domann, F.E.; Govil, M.; Christensen, K.; Bille, C.; et al. Disruption of an AP-2alpha binding site in an IRF6 enhancer is associated with cleft lip. Nat. Genet. 2008, 40, 1341–1347. [Google Scholar] [CrossRef] [PubMed] [Green Version]
  4. Moreno, L.M.; Mansilla, M.A.; Bullard, S.A.; Cooper, M.E.; Busch, T.D.; Machida, J.; Johnson, M.K.; Brauer, D.; Krahn, K.; Daack-Hirsch, S.; et al. FOXE1 association with both isolated cleft lip with or without cleft palate, and isolated cleft palate. Hum. Mol. Genet. 2009, 18, 4879–4896. [Google Scholar] [CrossRef] [Green Version]
  5. Bureau, A.; Parker, M.M.; Ruczinski, I.; Taub, M.A.; Marazita, M.L.; Murray, J.C.; Mangold, E.; Noethen, M.M.; Ludwig, K.U.; Hetmanski, J.B.; et al. Whole Exome sequencing of distant relatives in multiplex families implicates rare variants in candidate genes for oral clefts. Genetics 2014, 197, 1039–1044. [Google Scholar] [CrossRef] [Green Version]
  6. Cox, L.L.; Cox, T.C.; Uribe, L.M.M.; Zhu, Y.; Richter, C.T.; Nidey, N.; Standley, J.M.; Deng, M.; Blue, E.; Chong, J.X.; et al. Mutations in the Epithelial Cadherin-p120-Catenin Complex Cause Mendelian Non-Syndromic Cleft Lip with or without Cleft Palate. Am. J. Hum. Genet. 2018, 102, 1143–1157. [Google Scholar] [CrossRef] [Green Version]
  7. Cox, T.C.; Lidral, A.C.; McCoy, J.C.; Liu, H.; Cox, L.L.; Zhu, Y.; Anderson, R.D.; Uribe, L.M.M.; Anand, D.; Deng, M.; et al. Mutations in GDF11 and the extracellular antagonist, Follistatin, as a likely cause of Mendelian forms of orofacial clefting in humans. Hum. Mutat. 2019, 40, 1813–1825. [Google Scholar] [CrossRef]
  8. Birnbaum, S.; Ludwig, K.U.; Reutter, H.; Herms, S.; Steffens, M.; Rubini, M.; Baluardo, C.; Ferrian, M.; de Assis, N.A.; Alblas, M.; et al. Key susceptibility locus for nonsyndromic cleft lip with or without cleft palate on chromosome 8q24. Nat. Genet. 2009, 41, 473–477. [Google Scholar] [CrossRef]
  9. Grant, S.F.A.; Wang, K.; Zhang, H.; Glaberson, W.; Annaiah, K.; Kim, C.E.; Bradfield, J.P.; Glessner, J.T.; Thomas, K.A.; Garris, M.; et al. A genome-wide association study identifies a locus for nonsyndromic cleft lip with or without cleft palate on 8q24. J. Pediatr. 2009, 155, 909–913. [Google Scholar] [CrossRef]
  10. Mangold, E.; Ludwig, K.U.; Birnbaum, S.; Baluardo, C.; Ferrian, M.; Herms, S.; Reutter, H.; de Assis, N.A.; Chawa, T.A.; Mattheisen, M.; et al. Genome-wide association study identifies two susceptibility loci for nonsyndromic cleft lip with or without cleft palate. Nat. Genet. 2010, 42, 24–26. [Google Scholar] [CrossRef] [Green Version]
  11. Beaty, T.H.; Murray, J.C.; Marazita, M.L.; Munger, R.G.; Ruczinski, I.; Hetmanski, J.B.; Liang, K.Y.; Wu, T.; Murray, T.; Fallin, M.D.; et al. A genome-wide association study of cleft lip with and without cleft palate identifies risk variants near MAFB and ABCA4. Nat. Genet. 2010, 42, 525–529. [Google Scholar] [CrossRef]
  12. Ludwig, K.U.; Mangold, E.; Herms, S.; Nowak, S.; Paul, A.; Becker, J.; Herberz, R.; Alchawa, T.; Böhmer, A.C.; Mattheisen, M.; et al. Genome-wide meta-analyses of nonsyndromic cleft lip with or without cleft palate indentify six new risk loci. Nat Genet. 2012, 44, 968–971. [Google Scholar] [CrossRef] [PubMed] [Green Version]
  13. Beaty, T.H.; Taub, M.A.; Scott, A.F.; Murray, J.C.; Marazita, M.L.; Schwender, H.; Parker, M.M.; Hetmanski, J.B.; Balakrishnan, P.; Mansilla, M.A.; et al. Confirming genes influencing risk to cleft lip with/without cleft palate in a case-parent trio study. Hum. Genet. 2013, 132, 771–781. [Google Scholar] [CrossRef] [Green Version]
  14. Sun, Y.; Huang, Y.; Yin, A.; Pan, Y.; Wang, Y.; Wang, C.; Du, Y.; Wang, M.; Lan, F.; Hu, Z.; et al. Genome-wide association study identifies a new susceptibility locus for cleft lip with or without a cleft palate. Nat. Commun. 2015, 6, 6414. [Google Scholar] [CrossRef] [Green Version]
  15. Ludwig, K.U.; Ahmed, S.T.; Böhmer, A.C.; Sangani, N.B.; Varghese, S.; Klamt, J.; Schuenke, H.; Gültepe, P.; Hofmann, A.; Rubini, M.; et al. Meta-analysis Reveals Genome-Wide Significance at 15q13 for Nonsyndromic Clefting of Both the Lip and the Palate, and Functional Analyses Implicate GREM1 As a Plausible Causative Gene. PLoS Genet. 2016, 12, e1005914. [Google Scholar] [CrossRef] [Green Version]
  16. Leslie, E.J.; Carlson, J.C.; Shaffer, J.R.; Feingold, E.; Wehby, G.; Laurie, C.A.; Jain, D.; Laurie, C.C.; Doheny, K.F.; McHenry, T.; et al. A multi-ethnic genome-wide association study identifies novel loci for non-syndromic cleft lip with or without cleft palate on 2p24.2, 17q23 and 19q13. Hum. Mol. Genet. 2016, 25, 2862–2872. [Google Scholar] [CrossRef] [Green Version]
  17. Yu, Y.; Zuo, X.; He, M.; Gao, J.; Fu, Y.; Qin, C.; Meng, L.; Wang, W.; Song, Y.; Cheng, Y.; et al. Genome-wide analyses of non-syndromic cleft lip with palate identify 14 novel loci and genetic heterogeneity. Nat. Commun. 2017, 8, 14364. [Google Scholar] [CrossRef]
  18. Mostowska, A.; Gaczkowska, A.; Żukowski, K.; Ludwig, K.U.; Hozyasz, K.K.; Wójcicki, P.; Mangold, E.; Böhmer, A.C.; Heilmann-Heimbach, S.; Knapp, M.; et al. Common variants in DLG1 locus are associated with non-syndromic cleft lip with or without cleft palate. Clin. Genet. 2018, 93, 784–793. [Google Scholar] [CrossRef]
  19. Ludwig, K.U.; Böhmer, A.C.; Bowes, J.; Nikolic, M.; Ishorst, N.; Wyatt, N.; Hammond, N.L.; Gölz, L.; Thieme, F.; Barth, S.; et al. Imputation of orofacial clefting data identifies novel risk loci and sheds light on the genetic background of cleft lip ± cleft palate and cleft palate only. Hum. Mol. Genet. 2017, 26, 829–842. [Google Scholar] [CrossRef]
  20. Leslie, E.J.; Carlson, J.C.; Shaffer, J.R.; Butali, A.; Buxó, C.J.; Castilla, E.E.; Christensen, K.; Deleyiannis, F.W.B.; Leigh Field, L.; Hecht, J.T.; et al. Genome-wide meta-analyses of nonsyndromic orofacial clefts identify novel associations between FOXE1 and all orofacial clefts, and TP63 and cleft lip with or without cleft palate. Hum. Genet. 2017, 136, 275–286. [Google Scholar] [CrossRef] [Green Version]
  21. van Rooij, I.A.L.M.; van der Zanden, L.F.M.; Bongers, E.M.H.F.; Renkema, K.Y.; Wijers, C.H.W.; Thonissen, M.; Dokter, E.M.J.; Marcelis, C.L.M.; de Blaauw, I.; Wijnen, M.H.W.A.; et al. AGORA, a data- and biobank for birth defects and childhood cancer. Birth Defects Res. Part A-Clin. Mol. Teratol. 2016, 106, 675–684. [Google Scholar] [CrossRef]
  22. Galesloot, T.E.; Vermeulen, S.H.; Swinkels, D.W.; de Vegt, F.; Franke, B.; den Heijer, M.; de Graaf, J.; Verbeek, A.L.M.; Kiemeney, L.A.L.M. Cohort Profile: The Nijmegen Biomedical Study (NBS). Int. J. Epidemiol. 2017, 46, 1099–1100. [Google Scholar] [CrossRef] [Green Version]
  23. Manichaikul, A.; Mychaleckyj, J.C.; Rich, S.S.; Daly, K.; Sale, M.; Chen, W.M. Robust relationship inference in genome-wide association studies. Bioinformatics 2010, 26, 2867–2873. [Google Scholar] [CrossRef] [PubMed] [Green Version]
  24. Howie, B.; Fuchsberger, C.; Stephens, M.; Marchini, J.; Abecasis, G.R. Fast and accurate genotype imputation in genome-wide association studies through pre-phasing. Nat. Genet. 2012, 44, 955–959. [Google Scholar] [CrossRef]
  25. Marchini, J.; Howie, B. Genotype imputation for genome-wide association studies. Nat. Rev. Genet. 2010, 11, 499–511. [Google Scholar] [CrossRef]
  26. Rojas-Martinez, A.; Reutter, H.; Chacon-Camacho, O.; Leon-Cachon, R.B.R.; Munoz-Jimenez, S.G.; Nowak, S.; Becker, J.; Herberz, R.; Ludwig, K.U.; Paredes-Zenteno, M.; et al. Genetic risk factors for nonsyndromic cleft lip with or without cleft palate in a Mesoamerican population: Evidence for IRF6 and variants at 8q24 and 10q25. Birth Defects Res. A. Clin. Mol. Teratol. 2010, 88, 535–537. [Google Scholar] [CrossRef]
  27. Aldhorae, K.A.; Böhmer, A.C.; Ludwig, K.U.; Esmail, A.H.A.; Al-Hebshi, N.N.; Lippke, B.; Gölz, L.; Nöthen, M.M.; Daratsianos, N.; Knapp, M.; et al. Nonsyndromic cleft lip with or without cleft palate in Arab populations: Genetic analysis of 15 risk loci in a novel case-control sample recruited in Yemen. Birth Defects Res. Part A - Clin. Mol. Teratol. 2014, 100, 307–313. [Google Scholar] [CrossRef]
  28. Watanabe, K.; Taskesen, E.; Van Bochoven, A.; Posthuma, D. Functional mapping and annotation of genetic associations with FUMA. Nat. Commun. 2017, 8, 1826. [Google Scholar] [CrossRef] [Green Version]
  29. de Leeuw, C.A.; Mooij, J.M.; Heskes, T.; Posthuma, D. MAGMA: Generalized Gene-Set Analysis of GWAS Data. PLoS Comput. Biol. 2015, 11, e1004219. [Google Scholar] [CrossRef]
  30. Leslie, E.J.; Koboldt, D.C.; Kang, C.J.; Ma, L.; Hecht, J.T.; Wehby, G.L.; Christensen, K.; Czeizel, A.E.; Deleyiannis, F.W.-B.; Fulton, R.S.; et al. IRF6 mutation screening in non-syndromic orofacial clefting: Analysis of 1521 families. Clin. Genet. 2016, 90, 28–34. [Google Scholar] [CrossRef] [Green Version]
  31. Butali, A.; Mossey, P.; Adeyemo, W.; Eshete, M.; Gaines, L.; Braimah, R.; Aregbesola, B.; Rigdon, J.; Emeka, C.; Olutayo, J.; et al. Rare functional variants in genome-wide association identified candidate genes for nonsyndromic clefts in the African population. Am. J. Med. Genet. Part A 2014, 164, 2567–2571. [Google Scholar] [CrossRef] [PubMed] [Green Version]
  32. Gowans, L.J.J.; Adeyemo, W.L.; Eshete, M.; Mossey, P.A.; Busch, T.; Aregbesola, B.; Donkor, P.; Arthur, F.K.N.; Bello, S.A.; Martinez, A.; et al. Association studies and direct DNA sequencing implicate genetic susceptibility loci in the etiology of nonsyndromic orofacial clefts in sub-Saharan African populations. J. Dent. Res. 2016, 95, 1245–1256. [Google Scholar] [CrossRef] [PubMed]
  33. Jugessur, A.; Farlie, P.G.; Kilpatrick, N. The genetics of isolated orofacial clefts: From genotypes to subphenotypes. Oral Dis. 2009, 15, 437–453. [Google Scholar] [CrossRef] [PubMed]
  34. Wilderman, A.; VanOudenhove, J.; Kron, J.; Noonan, J.P.; Cotney, J. High-Resolution Epigenomic Atlas of Human Embryonic Craniofacial Development. Cell Rep. 2018, 23, 1581–1597. [Google Scholar] [CrossRef]
  35. Firth, H.V.; Richards, S.M.; Bevan, A.P.; Clayton, S.; Corpas, M.; Rajan, D.; Van Vooren, S.; Moreau, Y.; Pettett, R.M.; Carter, N.P. DECIPHER: Database of Chromosomal Imbalance and Phenotype in Humans Using Ensembl Resources. Am. J. Hum. Genet. 2009, 84, 524–533. [Google Scholar] [CrossRef] [Green Version]
  36. Wang, L.; Jia, P.; Wolfinger, R.D.; Chen, X.; Zhao, Z. Gene set analysis of genome-wide association studies: Methodological issues and perspectives. Genomics 2011, 98, 1–8. [Google Scholar] [CrossRef] [Green Version]
  37. Seals, D.F.; Azucena, E.F.; Pass, I.; Tesfay, L.; Gordon, R.; Woodrow, M.; Resau, J.H.; Courtneidge, S.A. The adaptor protein Tks5/Fish is required for podosome formation and function, and for the protease-driven invasion of cancer cells. Cancer Cell 2005, 7, 155–165. [Google Scholar] [CrossRef] [Green Version]
  38. Murphy, D.A.; Diaz, B.; Bromann, P.A.; Tsai, J.H.; Kawakami, Y.; Maurer, J.; Stewart, R.A.; Izpisúa-Belmonte, J.C.; Courtneidge, S.A. A Src-Tks5 pathway is required for neural crest cell migration during embryonic development. PLoS ONE 2011, 6, e22499. [Google Scholar] [CrossRef] [Green Version]
  39. Cejudo-Martin, P.; Yuen, A.; Vlahovich, N.; Lock, P.; Courtneidge, S.A.; Díaz, B. Genetic disruption of the Sh3pxd2a gene reveals an essential role in mouse development and the existence of a novel isoform of Tks5. PLoS ONE 2014, 9, e107674. [Google Scholar] [CrossRef] [Green Version]
  40. Picollo, A.; Malvezzi, M.; Accardi, A. TMEM16 proteins: Unknown structure and confusing functions. J. Mol. Biol. 2015, 427, 94–105. [Google Scholar] [CrossRef] [Green Version]
Figure 1. Regional association plot for a novel suggestive non-syndromic cleft lip with or without cleft palate (nsCL/P) locus on chromosome 16p12.1. Plotted SNVs include both genotyped and imputed variants.
Genes 10 01023 g001
Figure 2. Regional association plot for the candidate gene SH3PXD2A.
Genes 10 01023 g002
Figure 3. An unreported suggestive locus at chromosome 12q23.1 (a) Regional association plot showing a genome-wide significant marker upstream of the anoctamin 4 (ANO4) gene. It is of note that in our dataset, there were no SNVs in LD with the lead SNV rs73145631. (b) Regional association plot for the ANO4 gene.
Genes 10 01023 g003
Table 1. Twenty-five nsCL/P risk loci achieving genome-wide significant or suggestive evidence for association in imputed Dutch/Belgian genome-wide association study (GWAS).
LeadSNV_ID 1ChromosomePos (hg19)Alleles 2Case Frequency AControl Frequency AAll ORp-Value 3
rs36068947119003293G/GC0.5920.7021.621.06 × 10-6
rs11247713128230494A/G0.1650.2611.782.54 × 10-6
rs12404189181851687T/C0.9510.8990.464.48 × 10-6
rs1457946471213880572A/G0.9150.9642.463.17 × 10-6
rs12663811236681990A/G0.680.7811.681.49 × 10-6
rs1342938922564600G/A0.7130.8071.686.34 × 10-6
rs14319032168468315T/C0.1130.1921.868.76 × 10-6
rs112762347513103319G/A0.9520.9863.565.80 × 10-6
rs48680995170982499T/C0.1560.0890.534.29 × 10-6
rs14110917472926872G/GA0.9240.8560.493.95 × 10-6
rs9875258129946154C/A0.610.7481.898.73 × 10-11
rs153546210102973872A/G0.6230.5180.655.69 × 10-6
rs491805210105555131G/A0.3030.2030.582.34 × 10-6
rs1777030710115259535G/C0.9840.9420.262.59 × 10-6
rs1482486231223265077CA/C0.9070.9612.521.38 × 10-6
rs79800901267951884C/A0.9080.9582.282.35 × 10-6
rs7314563112101109530G/A0.9850.9360.231.99 × 10-8
rs5681451112125789014C/T0.6080.7051.559.01 × 10-6
rs1844671329622636G/T0.4280.3160.621.53 × 10-6
rs105207881596126414T/C0.9730.9240.346.19 × 10-6
rs563833451626344915G/C0.9220.8450.464.17 × 10-7
rs116409521678093932G/T0.6930.5870.636.22 × 10-6
rs72155551729564603G/A0.2310.3311.643.28 × 10-6
rs612967041775721588G/A0.9320.9722.558.22 × 10-6
rs735124491918123050G/C0.8880.9462.197.00 × 10-6
1underlined = genome-wide significant SNVs, 2 major allele first, risk allele underlined, 3 only markers with a p-value < 10−5 are presented. Pos = position, OR = odds ratio. The 25 loci also included an interesting locus at chromosome 16p12.1. This locus gave a suggestive p-value (5 × 10⁻⁸ < p < 10−5), and its lead SNV was rs56383345, with a p-value of 4.17 × 10⁻⁷ (Figure 1).
Table 2. Replication of two interesting SNVs in three replication samples of different biogeographical backgrounds.
SNV-IDp-Values after Genotyping of SNV in Respective Replication Sample
SNV-IDChr.Pos. (hg19)Bonn 1Mexico 2Yemen 3All 4OR (95% CI)
rs7314563112q23.11011095300.544n.a.*0.7140.4881.18 (0.74–1.90)
rs5638334516p12.1263449150.0270.577 **0.00990.001671.53 (1.17–1.98)
Bold = nominal significant result, italics = risk allele in this subsample not identical with risk allele in Dutch/Belgian discovery sample, Chr. = chromosome, pos. = position, OR = odds ratio, CI = confidence interval, n.a. = not applicable. * MAF below 1% in controls, therefore excluded (notable: rs17447439: 0.9% in controls vs. 1.7% in cases), ** 1.7% in cases and 1.2% in controls. 1 nsCL/P case control sample of 223 nsCL/P patients and 978 controls of Central European descent (no overlap with Bonn GWAS). 2 156 nsCL/P patients and 337 controls from the Chiapas, Mexico. 3 231 nsCL/P patients and 422 controls from Yemen. 4combined analysis of Bonn, Mexico, and Yemen.
Table 3. P-values for 40 literature nsCL/P risk loci in imputed Dutch/Belgian GWAS.
Literature Risk Locus 1Literature Lead SNV at Respective LocusBetter Dutch/Belgian GWAS lead SNV at Respective Locus
LocusOriginal StudySNVPos. (hg19)p-Value 2ORSNV 3Pos (hg19)p-Value 2,3OR
1p36Ludwig et al. 2012 [12]rs742071189798742.11 × 10-51.54rs36068947190032931.06272 × 10-61.62
1p22Beaty et al. 2010 [11]rs560426945534380.2994460.90rs952499945584250.06162170.83
1q32.1Rahimov et al. 2008 [3]rs6429612099892700.000559970.69----
2p25.1Yu et al. 2017 [17]rs28798299724420.8988771.00----
2p24.2Leslie et al. 2016 [16]rs7552167339284.84 × 10-51.52rs62122693167348783.10168 × 10-51.56
2p21PKDCCLudwig et al. 2017 [19]rs6740960421816790.007453251.28rs17029056421583040.000112591.52
2p21THADALudwig et al. 2012 [12]rs7590268435401250.131981.20rs6544652436262120.08819381.23
3p11.1Ludwig et al. 2012 [12]rs7632427895343770.03428970.81rs3792572894565550.01013780.77
3q12.1Beaty et al. 2013 [13]rs793464996260288.21 × 10-50.70rs9832134998367224.67043 × 10-50.66
3q28Leslie et al. 2017 [20]rs764798691895533720.002476751.77rs174474391895494235.67543 × 10-52.26
3q29Mostowska et al. 2018 [18]rs3382171970269270.09860850.85rs340995521967997350.02289881.27
4p16.2Yu et al. 2017 [17]rs190798948189250.7517761.05rs1093789348104910.6497520.94
4q28.1Yu et al. 2017 [17]rs9088221249062570.6575990.89rs768373041248681110.5328670.86
5p12Yu et al. 2017 [17]rs10462065440688460.2583441.18rs139738798441834190.1093771.26
8p11.23Yu et al. 2017 [17]rs13317382695140.7744450.97rs75168396380144290.30381.11
8q21Ludwig et al. 2012 [12]rs12543318888683400.001183170.73----
8q22.1Yu et al. 2017 [17]rs957448955413020.5600230.94rs4442106956094880.06269760.83
8q24Birnbaum et al. 2009 [8]rs9875251299461548.73 × 10-111.89----
9q22.2Yu et al. 2017 [17]rs10908902922248250.01783561.31rs2031970922041720.002522251.41
9q22.32Yu et al. 2017 [17]rs10512248982597030.09387440.84rs28591501982786440.06964480.82
9q21.33Moreno et al. 2009 [4]rs37582491006141400.005196181.32rs70337651005917050.001275451.38
10q25Mangold et al. 2010 [10]rs70781601188275600.000192911.60rs57882081188360760.0001064331.63
12q13.13Yu et al. 2017 [17]rs3741442533467500.1054650.31-4-4-4-4
12q13.2Yu et al. 2017 [17]rs705704564354120.04188321.22rs773107563695060.02109781.26
12q21.1Yu et al. 2017 [17]rs2304269720802720.4833160.86rs11178895720894110.3218040.84
13q31.1Ludwig et al. 2012 [12]rs8001641806928110.002689451.34rs11841646806793020.001350741.37
14q22.1Ludwig et al. 2017 [19]rs4901118518561090.3676071.10rs60454187518565660.2797050.9
14q22.1Yu et al. 2017 [17]rs7148069518396450.7318531.03----
14q32.13Yu et al. 2017 [17]rs1243572953794990.3434131.12rs1243561953698860.2011461.16
15q13Ludwig et al. 2016 [15]rs1258763330504230.05214381.19rs13329310330525530.04990030.83
15q22.2Ludwig et al. 2012 [12]rs1873147633126320.4698811.08rs12902152633139680.1676011.19
15q24Ludwig et al. 2017 [19]rs28689146750055750.4423031.08----
16p13.3Sun et al. 2015 [14]rs804936739804450.1590991.13rs1107679239685670.003168071.33
17q13.1Beaty et al. 2010 [11]rs989144689354160.1863881.14----
17q21.32Yu et al. 2017 [17]rs1838105450089350.002311740.73rs197907449820810.0002823871.45
17q22Mangold et al. 2010 [10]rs227727547769550.1800571.14----
17q23.2Leslie et al. 2016 [16]rs1588366610764280.009011310.75rs72843145610529490.00572870.72
19p13.3Ludwig et al. 2017 [19]rs374610120508230.9292810.95----
19q12Leslie et al. 2016 [16]rs73039426335209610.269591.20----
20q12Beaty et al. 2010 [11]rs13041247392690740.01010810.77rs34753522392783910.000373450.69
pos. = position, OR = odds ratio, - = no SNV with smaller p-value at this locus compared to literature lead SNV. 1 bold if locus reached a nominal significant p-value in Dutch/Belgian GWAS. 2 p-value in boldface if nominal significant. 3normal letters if in LD with literature lead SNV (r2 > 0.6; r2 taken from LD Link), italics if not in LD with literature lead SNV and p < 10−4. 4 MAF of lead SNV in Dutch/Belgian GWAS below 0.01, did not pass QC.
Table 4. Gene analysis with MAGMA as implemented in FUMAGWASGene 1.
Chromosomep-Value 1
SH3PXD2A102.3729 × 10−8
ANO4121.4588 × 10−7
CMSS132.9078 × 10−6
FILIP1L37.1274 × 10−6
CLEC3A161.0871 × 10−5
PAX7211.9157 × 10−5
CCDC14024.4909 × 10−5
ESR167.1554 × 10−5
IFITM3118.5273 × 10−5
PANX1118.7342 × 10−5
BLMH179.5824 × 10−5
1bold = genome wide significant genes/p-values. 2 previously known nsCL/P susceptibility gene.

