Article

Transcriptional Analysis of Masson Pine (Pinus massoniana) under High CO2 Stress

1
Key Laboratory of Forestry Genetics & Biotechnology of Ministry of Education, Co-Innovation Center for Sustainable Forestry in Southern China, Nanjing Forestry University, Nanjing 210037, China
2
Baisha state-owned forest farm, Shanghang 364200, China
*
Author to whom correspondence should be addressed.
Genes 2019, 10(10), 804; https://doi.org/10.3390/genes10100804
Submission received: 23 August 2019 / Revised: 10 October 2019 / Accepted: 10 October 2019 / Published: 13 October 2019
(This article belongs to the Section Plant Genetics and Genomics)

Abstract

:
To explore the molecular mechanism of the response of Masson pine (Pinus massoniana), the main coniferous tree in southern China, to high CO2 stress, transcriptome sequencing was carried out to analyze the genome-wide responses of annual seedlings under different durations (0 h, 6 h, 12 h and 24 h) of high CO2 stress. The results showed that a total of 3080/1908, 3110/2115 and 2684/1483 genes were up-/down-regulated after 6 h, 12 h and 24 h of treatment, respectively, compared with control check group (CK, 0 h). Kyoto Encyclopedia of Genes and Genomes (KEGG) analysis showed that most of these differentially expressed genes (DEGs) were enriched in energy metabolism, carbohydrate synthesis, cell wall precursor synthesis and hormone regulation pathways. For energy metabolism, the expression of most genes involved in photosynthesis (including the light reaction and Calvin cycle) was generally inhibited, while the expression of genes related glycolysis, the tricarboxylic acid (TCA) cycle and PPP pathway was up-regulated. In addition, the increase in the CO2 concentration induced the up-regulation of gene expression in the sucrose synthesis pathway. Among all starch synthesis genes, GBSS (granule-bound starch synthase) had the highest expression level. On the other hand, during the synthesis of hemicellulose and pectin (cell wall precursor substances), the expression levels of GMD (GDP-mannose 4,6-dehydratase), MGP (Mannose-1-phosphate guanylyl transferase) and RHM (Rhamnose biosynthetic enzyme) were the highest, suggesting that the synthesis of the raw materials hemicellulose and pectin in Masson pine under stress were mainly supplied by GDP-Man, GDP-Fuc and UDP-Rha. Finally, stress inhibited gene expression in the ABA (Abscisic Acid) synthesis pathway and induced gene expression in the GA (Gibberellin), SA (Salicylic acid), BR(Brassinolide) and MeJA (Methyl Jasmonate) pathways. Stomatal switches were regulated by hormonal interactions. This experiment elaborated on the response and molecular mechanism of Masson pine to CO2 stress and aided in screening carbon sequestration genes for the corresponding molecular research of Masson pine in the future.

1. Introduction

As humans enter an industrial society, environmental issues have become increasingly prominent. Global warming has been widely monitored by governments and the public worldwide and has risen to become one of the most important political, diplomatic, and economic issues [1]. According to the Global Carbon Project (GCP), global CO2 emissions from fossil fuels and industry reached 36.8 Gt in 2017, an increase of approximately 65% from the baseline year (1990) of the Kyoto Protocol [2]. And atmospheric CO2 concentrations will rise from 380 ppm today to 550 ppm by 2050 [3]. These numbers are increasing because of the overuse of fossil fuels. Therefore, mitigating global warming caused by the increase in the CO2 concentration in the atmosphere has become a serious global challenge.
Studies have shown that elevated CO2 concentrations cause changes in plant morphological structures [4], reduce stomatal conductance [5] and the leaf nitrogen metabolism rate [6] and impact other reactions. To maintain normal growth and development, plants have developed a series of physiological, biochemical and molecular regulatory mechanisms, including stomatal regulation, ion homeostasis, signal transduction, etc [7]. Tolerance to high CO2 concentrations is a complex trait controlled by genes that play important roles in CO2 stress responses in various plants, including heat shock proteins [8], WRKY [9,10], and other photosynthetic-related genes [11]. These previous studies have indicated that the overexpression of these genes could increase the resistance of plants to CO2 stress and that the tolerance of plants to high concentrations of CO2 could be improved by transgenic and molecular marker-assisted breeding.
Masson pine (Pinus massoniana) is a conifer species distributed in 17 provinces, autonomous regions and municipalities located south of the Qinling Mountains in China. It thrives in a warm and humid climate, growing in arid, barren gravel soil and sandy soil. It is a pioneer species for restoring forests in barren hills [12]. Studies have shown that the carbon sequestration capacity of Masson pine is much higher than the average carbon sequestration of forests in China [13]. The carbon sequestration of each organ of Masson pine is between 533.93 and 568.08 g·kg−1, which is higher than the carbon content of 32 common tree species (444.0~494.5 g·kg−1) [14]. In recent years, there have been many studies on the physiological and biochemical responses to CO2 stress and the screening of candidate CO2-resistance genes [15,16,17]; however, few studies on the CO2 tolerance mechanism and transcriptome response of Masson pine have been reported. In this study, a next-generation transcriptome sequencing analysis of Masson pine under high CO2 stress was evaluated using the Illumina HiSeq sequencing platform. The transcriptome results were used to identify genes that might be involved in the response to CO2 and to clarify the possible molecular mechanisms involved in the adaptation to CO2 stress. To verify the accuracy of the sequencing results, we selected several genes for quantitative real-time PCR (qRT-PCR) verification. The results improve our understanding of environmental acclimation mechanisms in Masson pine and serve as a molecular-level reference to inform future work on the enhancement of CO2 tolerance in Masson pine.

2. Materials and Methods

2.1. Plant Material and Experimental Conditions

One-year-old Masson pine seedlings, obtained from the seed orchard of Baisha state-owned forest farm, Shanghang, Fujian Province, China (25°15′ N, 116°62′ E), were used in this study. Individuals of the same clones with similar heights, uniform growth and strong growth potential were selected as the test materials and subsequently moved into a growth chamber to recover for 15d. The growth conditions were 10 h light/14 h dark cycles at 25 °C in the chamber. Air containing about two times of the chamber CO2 concentration before experiment was aerated into the growth chamber constantly for at least 24 h. The CO2 concentration in the chamber was monitored by an infrared CO2 analysis reader (SenseAir, Delsbo, Sweden). The seedlings were sampled after 6 h, 12 h and 24 h of treatment with the high CO2 concentration, and the needles were selected for downstream experiments.

2.2. Total RNA Isolation, Complementary DNA Library Preparation and Sequencing

Total RNA from four treatments (0 h, 6 h, 12 h and 24 h) seedlings (Among them, 0h treatment was considered as the control check group (CK group)) with three biological replicates for each treatment was extracted using the Plant RNA Isolation Kit (Tiangen, Beijing, China). Sequencing library were constructed using RNA Library Prep Kit for Illumina (NEB, Boston, MA, USA). Then the libraries were sequenced using a Hiseq 4000 (Illumina, San Diego, CA, USA), and generated 150 bp paired-end reads. To get clean reads, sequences with length less than 30 bp, reads with N ratio over 10% and without inserted fragments due to reasons such as connector self-connection and adapter sequences were removed using SeqPrep (https://github.com/jstjohn/SeqPrep) and Sickle (https://github.com/najoshi/sickle) [18]

2.3. Transcriptome Assembly and Functional Annotation

De novo assembly of all the clean reads was conducted using Trinity version 2.5.0 (https://github.com/trinityrnaseq/trinityrnaseq/wiki) based on all parameters set as their defaults [19]. Transcripts corresponding to paralogous genes were sorted out to finally obtain the assembly sequences. TransRate software version 1.0.3 (http://hibberdlab.com/transrate/) was used to filter and optimize the initial assembly sequences obtained from Trinity [20], and the assembled sequence was evaluated using BUSCO (Benchmarking Universal Single-Copy Orthologs) version 3.0.2 (http://busco.ezlab.org) [21]. Both of the two softwares ran with their default parameters.
To functionally annotate genes, the sequences were BLASTed in Kyoto Encyclopedia of Genes and Genomes (KEGG) (https://www.genome.jp/kegg/) public databases. KEGG enrichment analysis for the DEGs was carried out by KOBAS version 3.0. In this software, False-positive were assessed by BH (FDR correction with Benjamini/Hochberg) method with a cut-off E-value of 10−6. When the p-adjust (the adjusted p-value) of a KEGG pathway was less than 0.05, we considered this KEGG pathway was significantly enriched.

2.4. Differential Expression Analysis

The gene expression level for each sample was determined according to the transcripts per million reads (TPM) using RSEM version 1.2.31 (Univ Wisconsin, Madison, WI, USA) with all parameters set as its defaults [22], in which the read counts were normalized using the edgeR package with the Trimmed Mean of M-values method, and then the length of the gene (L) and the normalized counts (N) were used to calculate the TPM (TPM = 106 × (Ni/Li)/∑(Nj/Lj)). The DEGseq R package version 1.10.1 was used to analyze differential expression of different samples [23]. The significant differential expression threshold was set as q-value < 0.005 and |log2(foldchange)| ≥ 1 [24]. The heatmap and differential expression of genes among samples were analyzed using “pheatmap” R package version 1.0.12 (Massachusetts General Hospital, Boston, MA, USA).

2.5. Quantitative Real-Time PCR Validation

To validate the RNA-sequencing (RNA-seq) results, the expression levels of nine genes were measured using qRT-PCR. Reaction mixtures consisted of 10 μL of 2× TOP Green qRT-PCR SuperMix (TOYOBO Biotech, Shanghai, China), 0.4 μL of forward primer and reverse primer, 2 μL of complementary DNA (cDNA), 0.4 μL of 50× Passive Reference Dye and 6.8 μL of ddH2O. The PCR program was set up in six stages: (1) 94 °C for 30 s (preincubation), (2) 94 °C for 5 s, (3) 55 °C for 15 s, (4) 72 °C for 10 s, repeated 40 times (amplification), (5) 95 °C for 0.5 s, and (6) 60 °C for 1 min (melt). The PCR quality was estimated based on melting curves. TUA (Alpha-tubulin) was used as the internal control [25]. The gene-specific primers employed are shown in Table A1 from Appendix A. Three independent biological replicates and three technical replicates for each biological replicate were run. Quantification was achieved using comparative cycle threshold (Ct) values, and gene expression levels were calculated using the 2−∆∆Ct method [25]. The significance was determined by t-test using SPSS statistical software (IBM, New York, NY, USA) (p < 0.05).

3. Results

3.1. Transcriptome Sequencing and De Novo Assembly

The cDNA libraries of the four treatments (0 h (CK), 6 h, 12, and 24 h) were sequenced and generated a total number of 49,314,299, 47,459,322, 45,980,036, and 60,876,932 raw reads and 48,795,571, 46,976,134, 45,496,760, and 60,205,674 clean reads, respectively (Table 1). The raw data and sequences can be found online at the NCBI (https://www.ncbi.nlm.nih.gov/) Sequence Read Archive (SRA) database (accession number PRJNA561037). Compared with the reference sequences obtained from Trinity assembly, there were generated a total number of 16,879,027, 16,459,249, 15,859,340 and 21,108,414 mapped reads of 0 h, 6 h, 12 h, and 24 h treatments, respectively. An average mapped ratio of 70% was obtained. The Q30, a key parameter that represents the quality of sequenced bases, was 94.04%, 94.22%, 93.86% and 93.4% for the 0 h, 6 h, 12 h, and 24 h treatments, respectively (Table 1).
The Trinity software generated 140,863 transcripts with an average length of 891 bp and an N50 of 1463 bp. In total, 92,424 unigenes were obtained in the range of 201~15,491 bp. Of these, 48,592 (52.57%) were less than 500 bp, 22,267 (24.09%) were 501~1000 bp, 12,887 (13.94%) were 1001~2000 bp and the remaining 8678 (9.39%) were >2000 bp (Table 2). TransRate and software BUSCO evaluated the assembly results, and transcript score was 0.20045 and 77.7%, respectively, and unigenes was 0.30498 and 74.2%, respectively (Table 2). According to previous reports [26,27], in Masson pine, unigene obtained by transcriptome sequencing under other stress treatments ranged from 70,896 to 101,806. Our results were similar to them. Combined with the N50 and Q30, we believe that the sequencing results are relatively reliable and could be further analyzed.

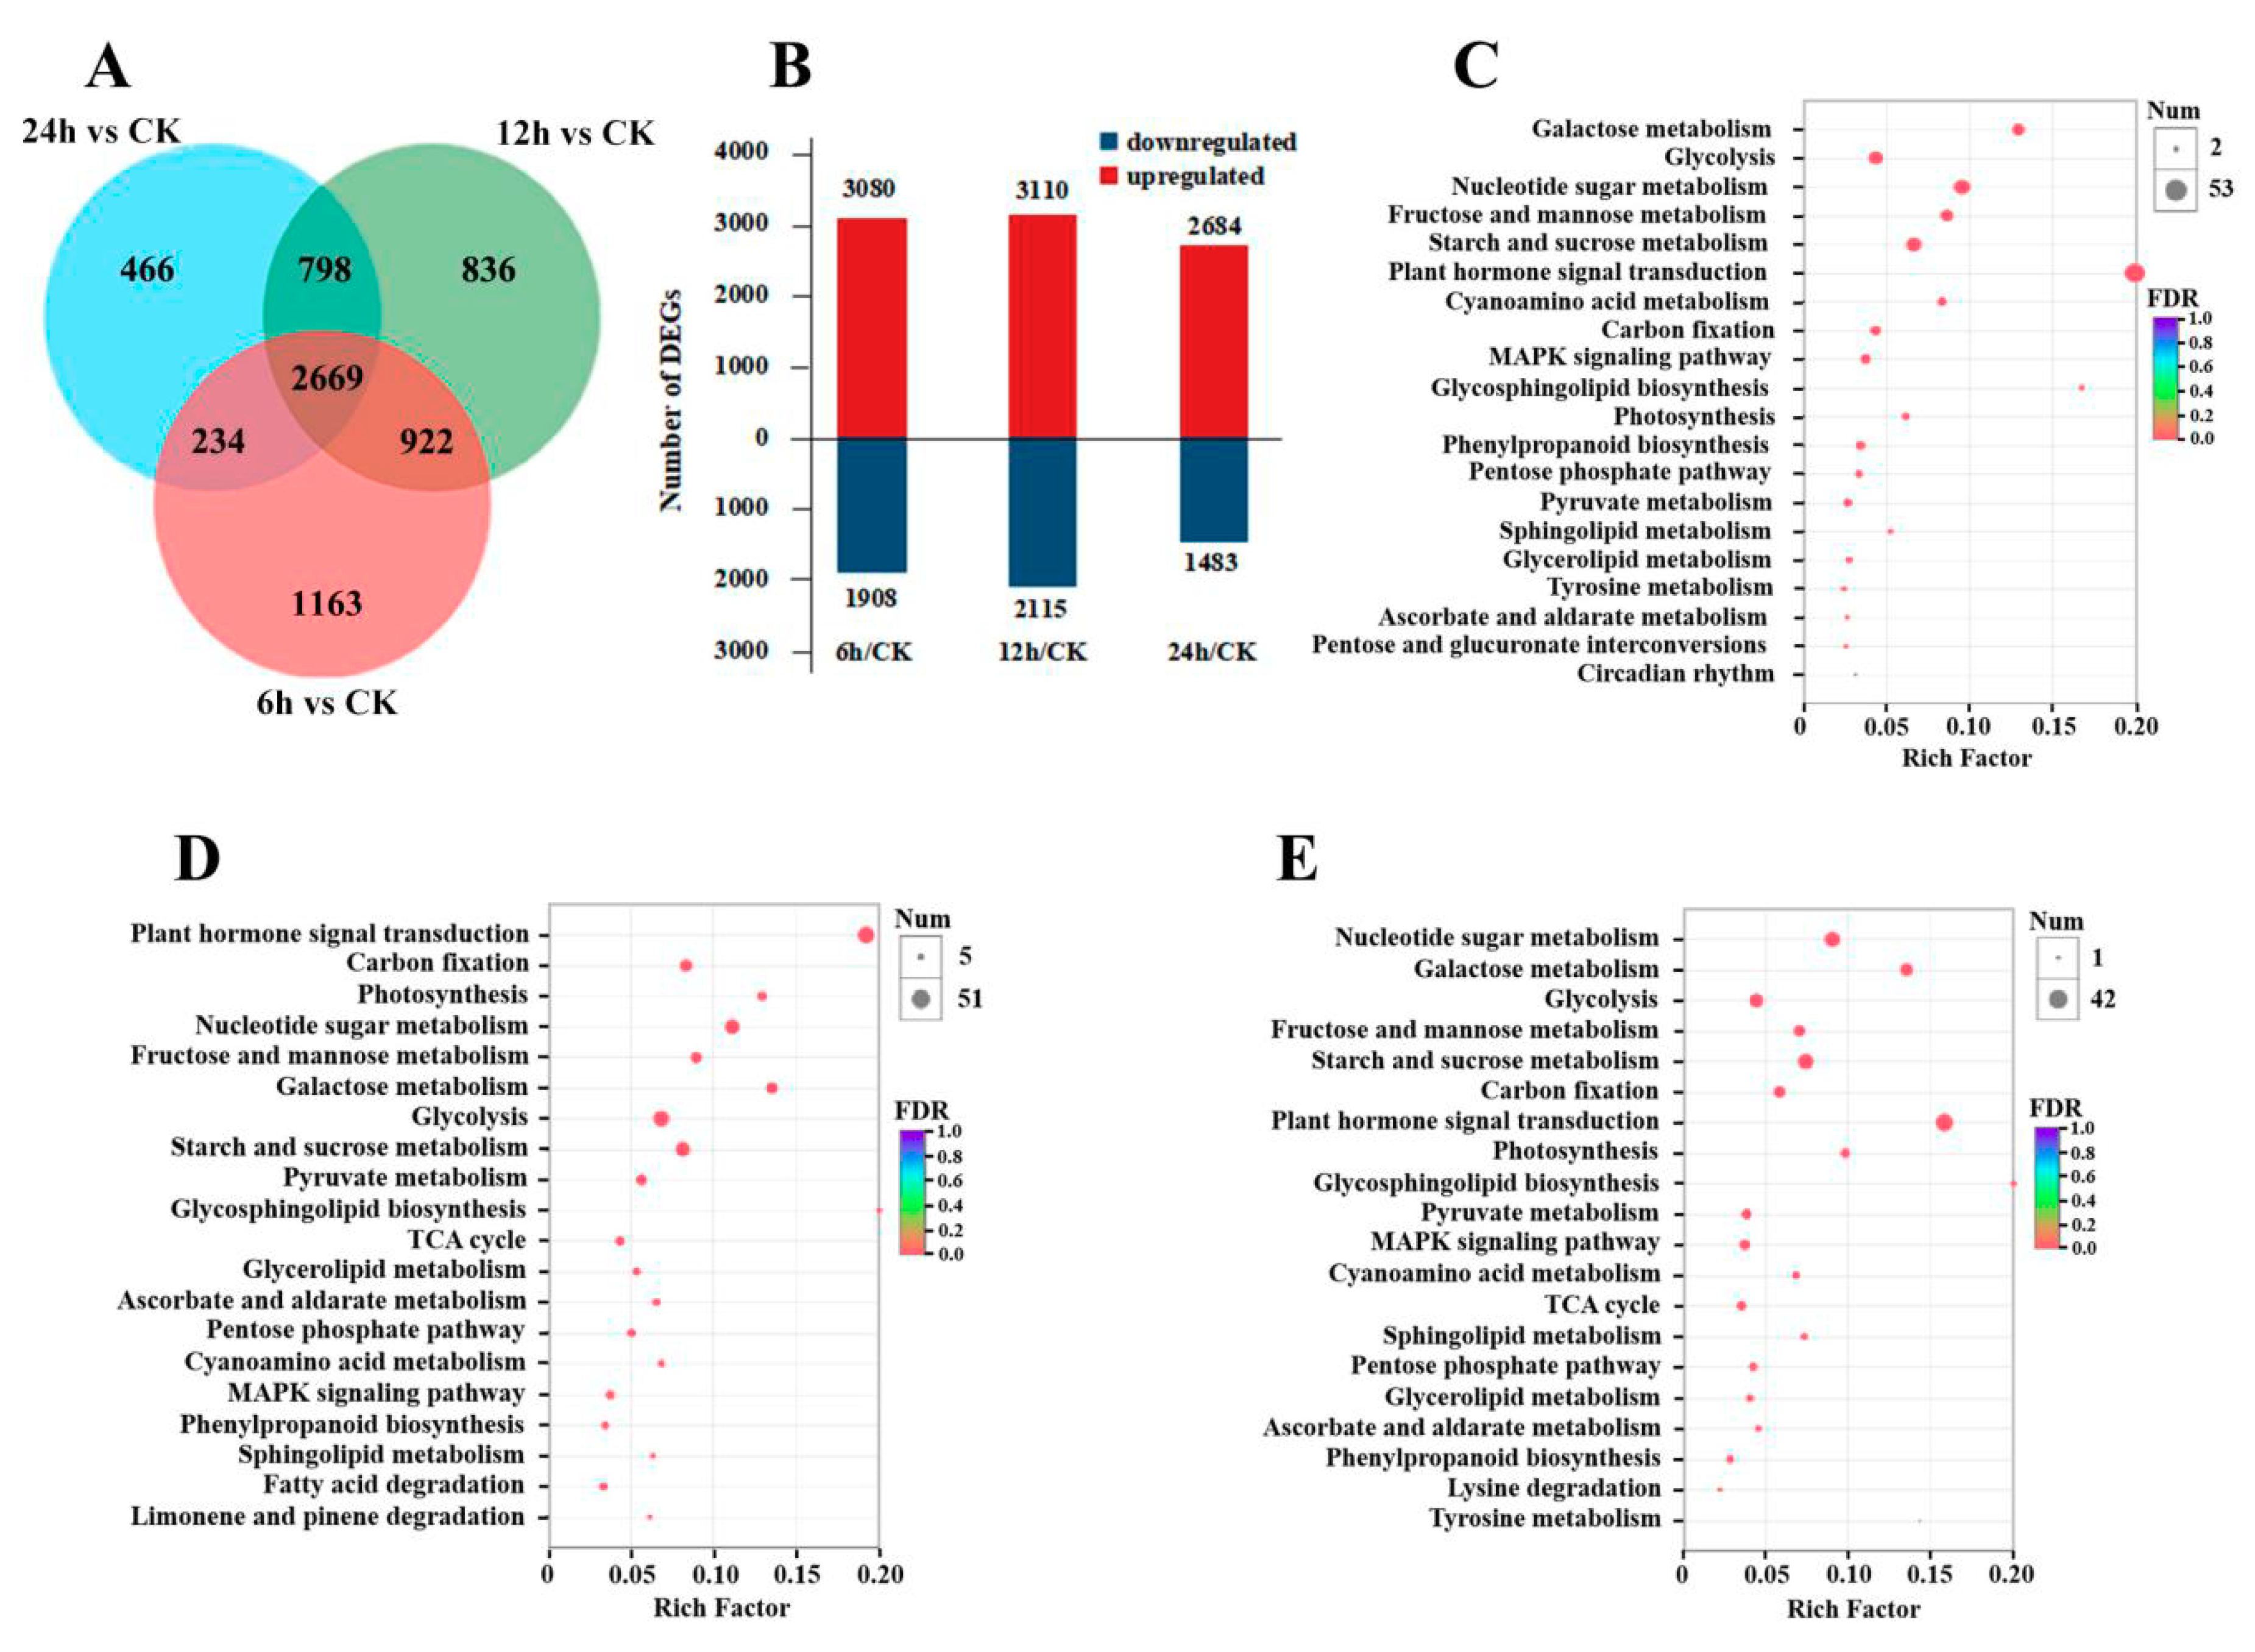
3.2. Gene Expression and KEGG Enrichment Analysis under CO2 Stress

A total of 7088 genes were differentially expressed between the samples from the three CO2 stress treatments and the control samples. Of these, 4988, 5225 and 4167 genes were differentially expressed between 6 h and CK, 12 h and CK, and 24 h and CK treatments, respectively (Figure 1A). Among the differentially expressed genes (DEGs), 3080/1908, 3110/2115 and 2684/1483 genes were up-/down-regulated at 6 h, 12 h, and 24 h, respectively, compared with CK (Figure 1B). Gene enrichment analysis of the DEGs based on KEGG analysis revealed that these genes were mainly involved in several pathways at different time points, including photosynthesis, carbon fixation (the Calvin cycle), glycolysis, the tricarboxylic acid (TCA) cycle, starch and sucrose metabolism, fructose and mannose metabolism, galactose metabolism and plant hormone signal transduction, etc. (Figure 1C,D,E). In the three KEGG enrichment Figures that compare the different treatment time points with CK, all of the above pathways ranked within the top 20 pathways (except the “TCA cycle” in 6 h/CK, Figure 1C), indicating that energy metabolism, carbohydrate synthesis, cell wall synthesis and hormone regulation may be the main metabolic activities in Masson pine under high CO2 stress.

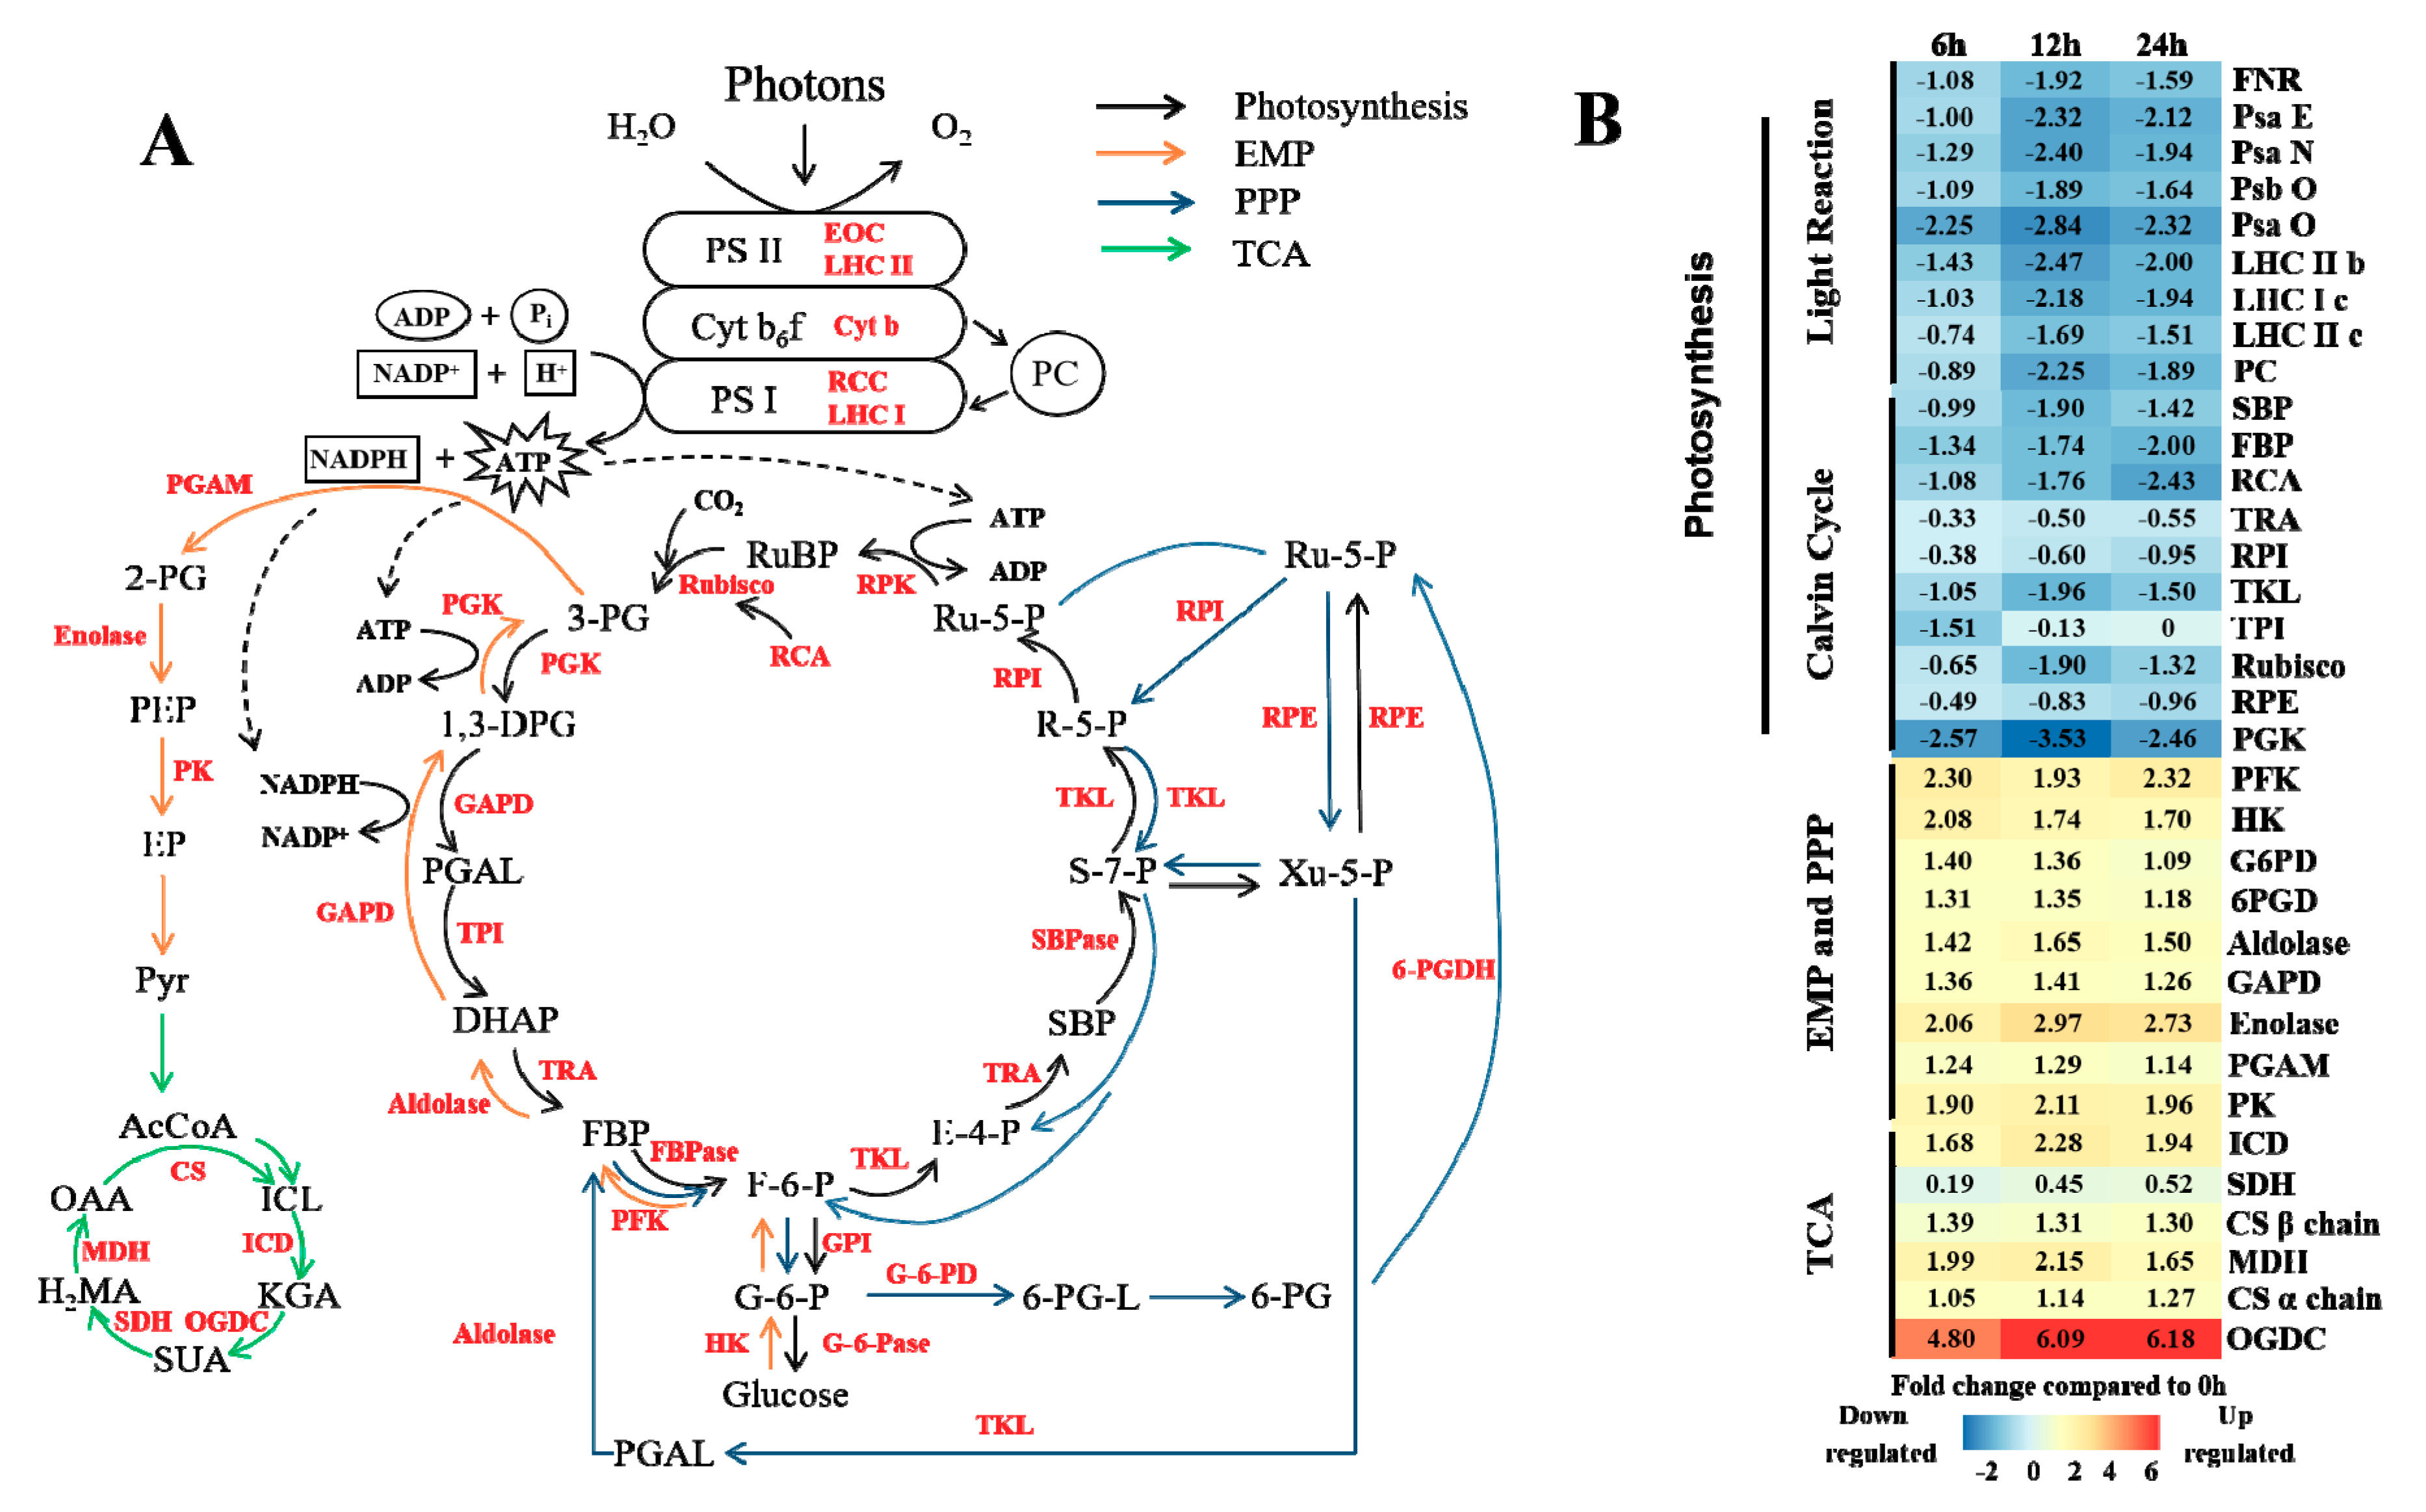
3.3. Energy Metabolism under Elevated CO2 Stress

Figure 2 shows the energy metabolic pathways and the general pattern of the relative changes in the related gene expression patterns in Masson pine under high CO2 concentration conditions. Notably, in the transcriptome data, the pathways involved in energy metabolism were polarized. After Masson pine had been exposed to CO2 stress, in the photosynthesis pathways, including the photoreactions and Calvin cycle (Figure 2A, black arrow), the relative expression of each gene in the metabolic pathway except for GAPD (glyceraldehyde-3-phosphate dehydrogenase) showed a downward trend (Figure 2B). GAPD catalyzes 3-phosphoglyceraldehyde (PGAL) to 1,3-diphosphoglycerate (1,3-DPG) in the Calvin cycle and 1,3-DPG to dihydroxy-acetone phosphate (DHAP) in the Embden-Meyerhof-Parnas (EMP) pathway (Figure 2A, orange arrow). Since GAPD plays a role in these two metabolic pathways, the change in its expression patterns may be the result of superposition. Moreover, the gene expression patterns involved in both photosynthesis and other metabolic pathways (such as RPI (Ribulose Phosphate Isomerase) or RPE (Ribulose Phosphate Epimerase)) decreased more slowly than those involved only in photosynthesis (such as RCA (Rubisco Activase) or FBP (Fructose-1,6-diphosphate)). On the other hand, the relative expression levels of genes in other pathways involved in energy anabolism, including the EMP pathway, the pentose phosphate (PPP) pathway (Figure 2A, blue arrow) and TCA (Figure 2A, green arrow), generally increased (Figure 2B). Among them, the expression rate of OGDC (α-ketoglutarate dehydrogenase) increased the fastest and was 4.8, 6.09 and 6.18 times that of CK at 6 h, 12 h and 24 h, respectively. In general, the omics data revealed that energy metabolism was strongly enhanced for contributing to elevated CO2 tolerance in Masson pine, except for the light reaction and Calvin cycle.

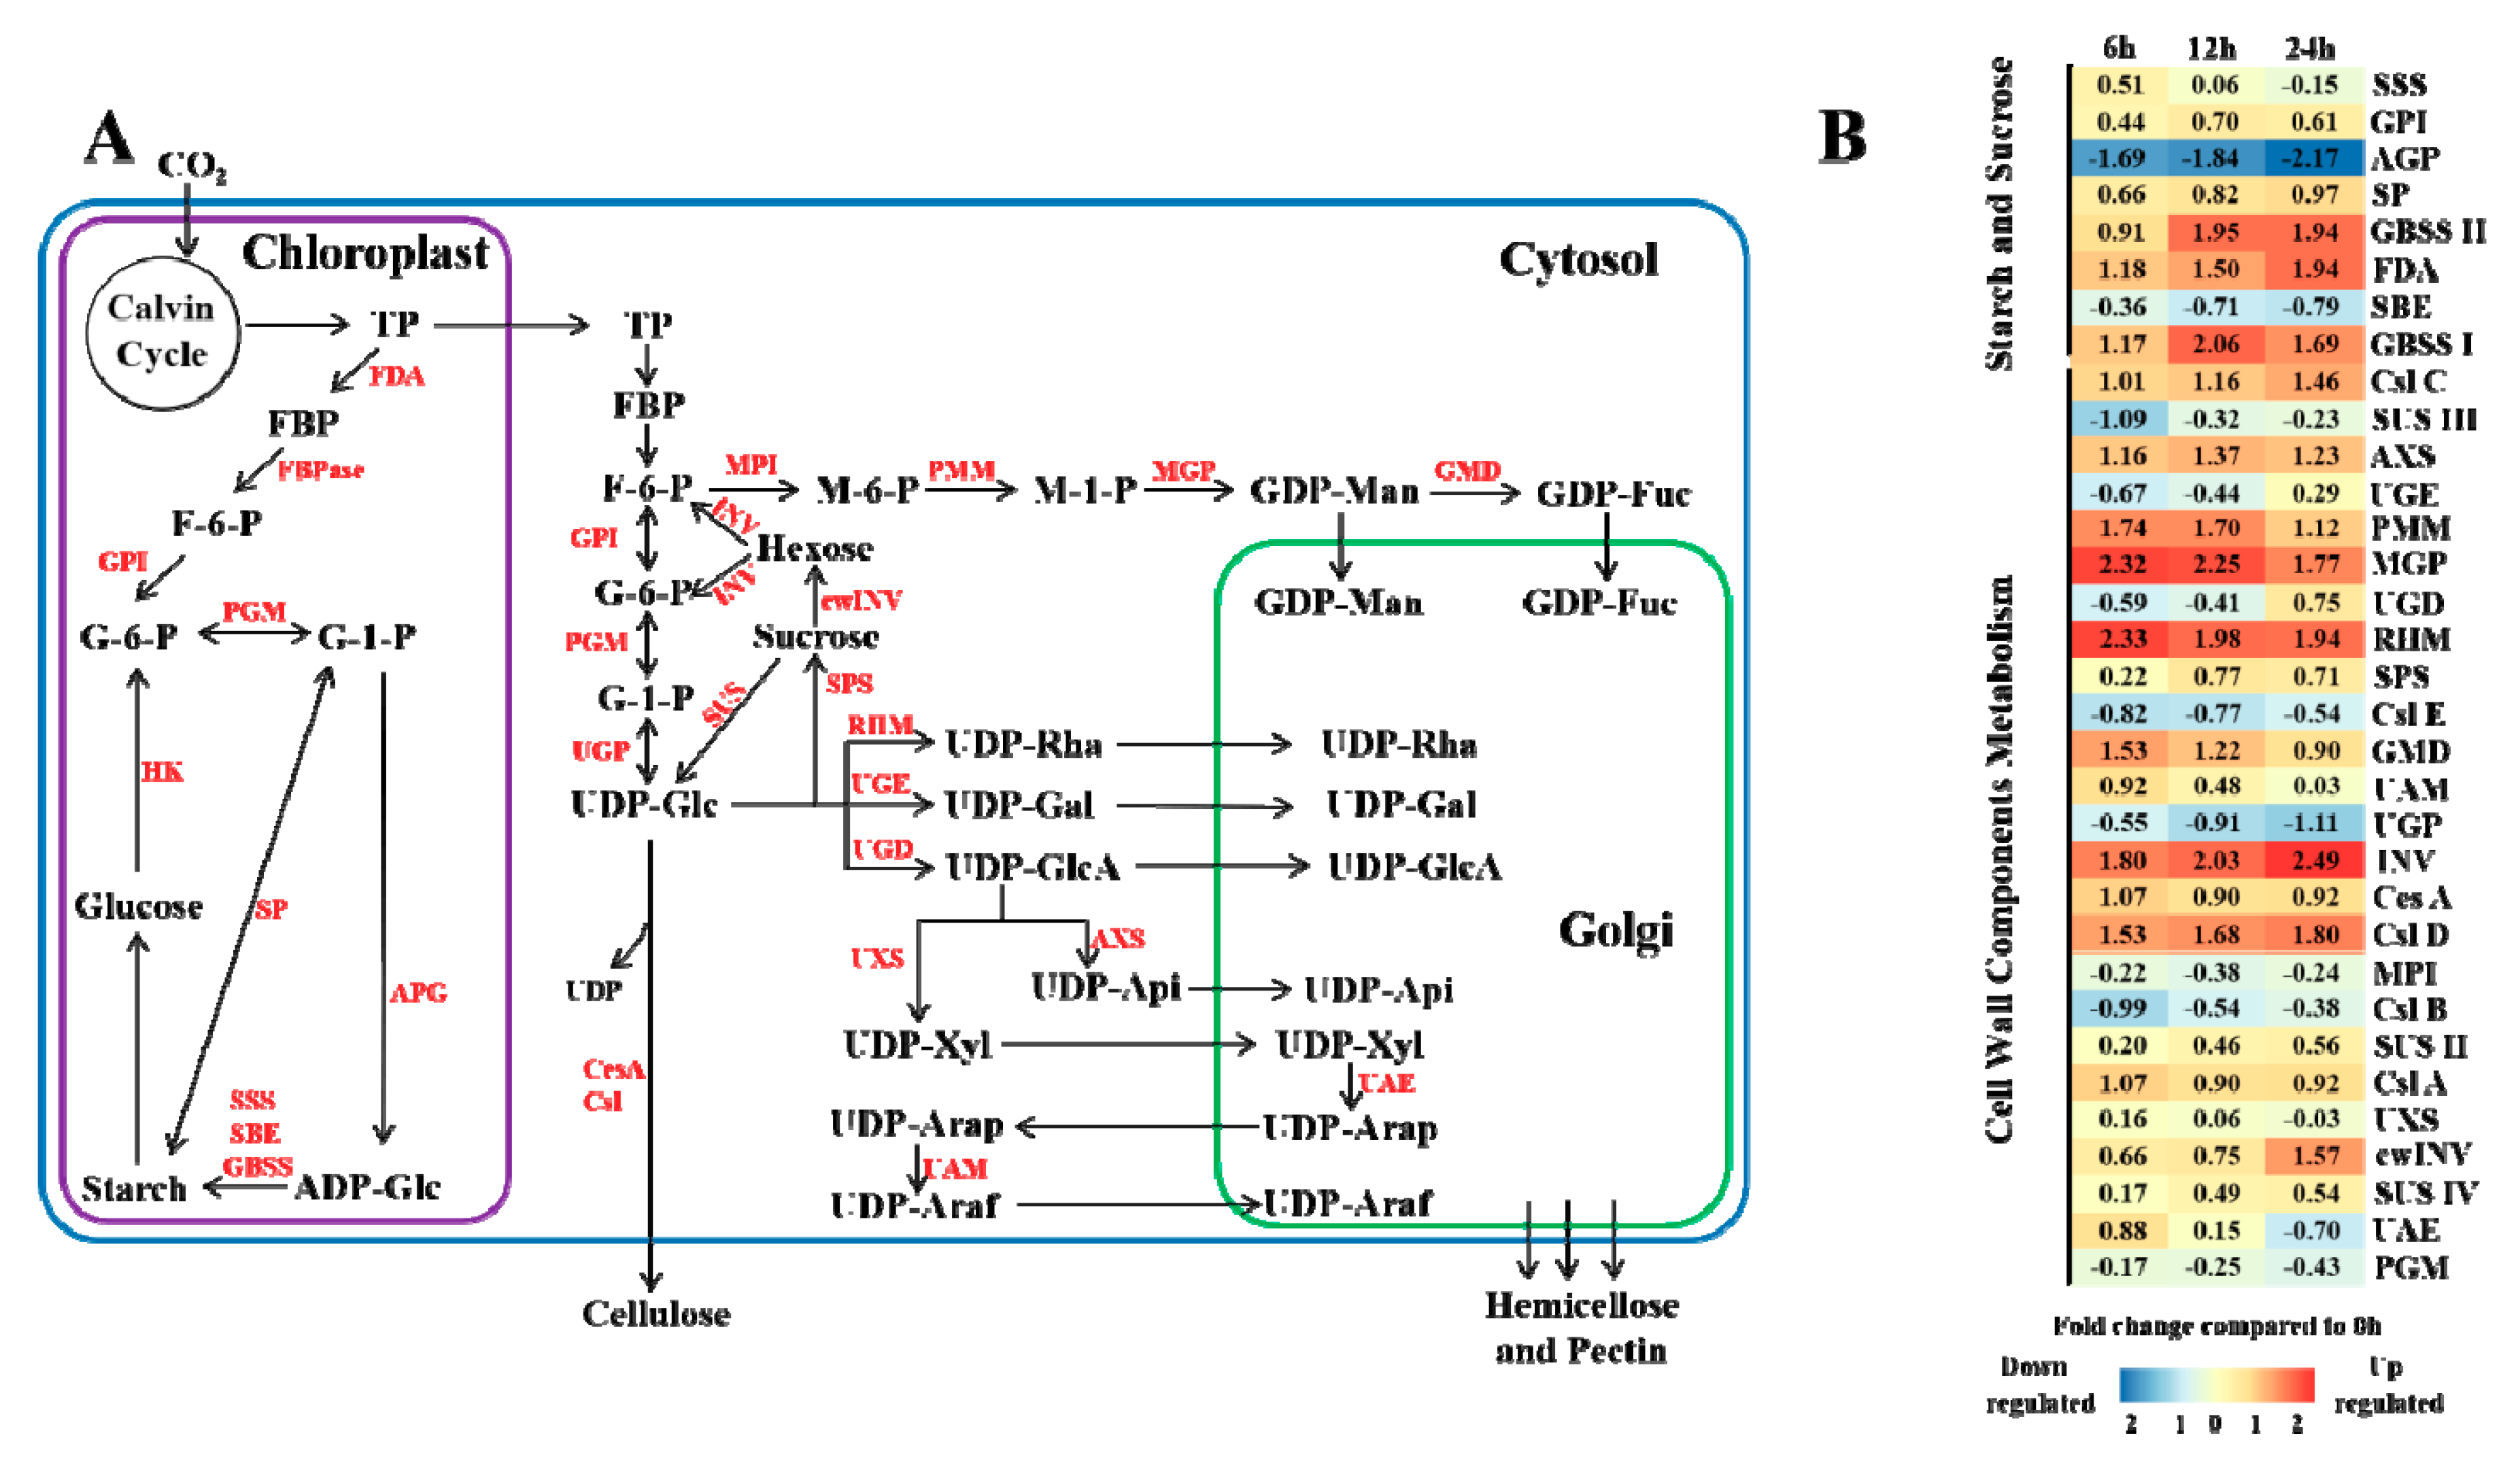
3.4. Biosynthesis of Sucrose, Starch and Cell Wall Components under Elevated CO2 Stress

The expression levels of the genes in the sucrose and starch synthesis pathways generally showed a trend of up- or slightly down-regulation under CO2 stress conditions compared with CK, except for AGP (Adenosine Diphosphoglucose Pyrophosphorylase) and SBE (Starch Branching Enzyme) (Figure 3B). AGP catalyzes adenosine diphosphate glucose (ADP-Glc) from glucose-1-phosphate (G-1-P), and its expression continued to decline with increasing stress time. On the other hand, among the genes in starch metabolic pathway, the expression of GBSS (Granule-bound Starch Synthase) was higher than SSS (Soluble Starch Synthase) and SBE.
After a series of reactions, triose phosphate was transformed into UDP-Glc in the cytoplasm (Figure 3A), and then it was catalyzed to sucrose by sucrose-phosphate synthase (SPS). After being subjected to stress treatment, the expression levels of SPS at 6 h, 12 h and 24 h were no significant difference (Figure 3B). Meanwhile, sucrose can be transformed to UDP-Glc and hexose by sucrose synthase (SUS) and cell wall invertase (cwINV), and hexose can then be catalyzed by cytosolic invertase (INV) to form fructose-6-phosphate (F-6-P) and glucose-6-phosphate (G-6-P), which are the synthetic precursors of UDP-Glc (Figure 3A). In the above series of reactions, the expression of SUS, cwINV and INV were up-regulated in different degrees under CO2 stress compared with CK. In addition, UDP-Glc is the precursor for cellulose synthesis, which is catalyzed by cellulose synthase complex (CSC), including cellulose synthase subunit (CesA), cellulose synthase (Csl) and its isoenzymes (Figure 3A). The experimental results showed that the expression levels of CesA, Csl A, Csl C and Csl D were up-regulated with increasing stress time. However, Csl B and Csl E decreased at the same time (Figure 3B). In general, the omics data revealed that gene expression patterns in sugar and cell wall component metabolic pathways were enhanced under elevated CO2 stress in Masson pine.

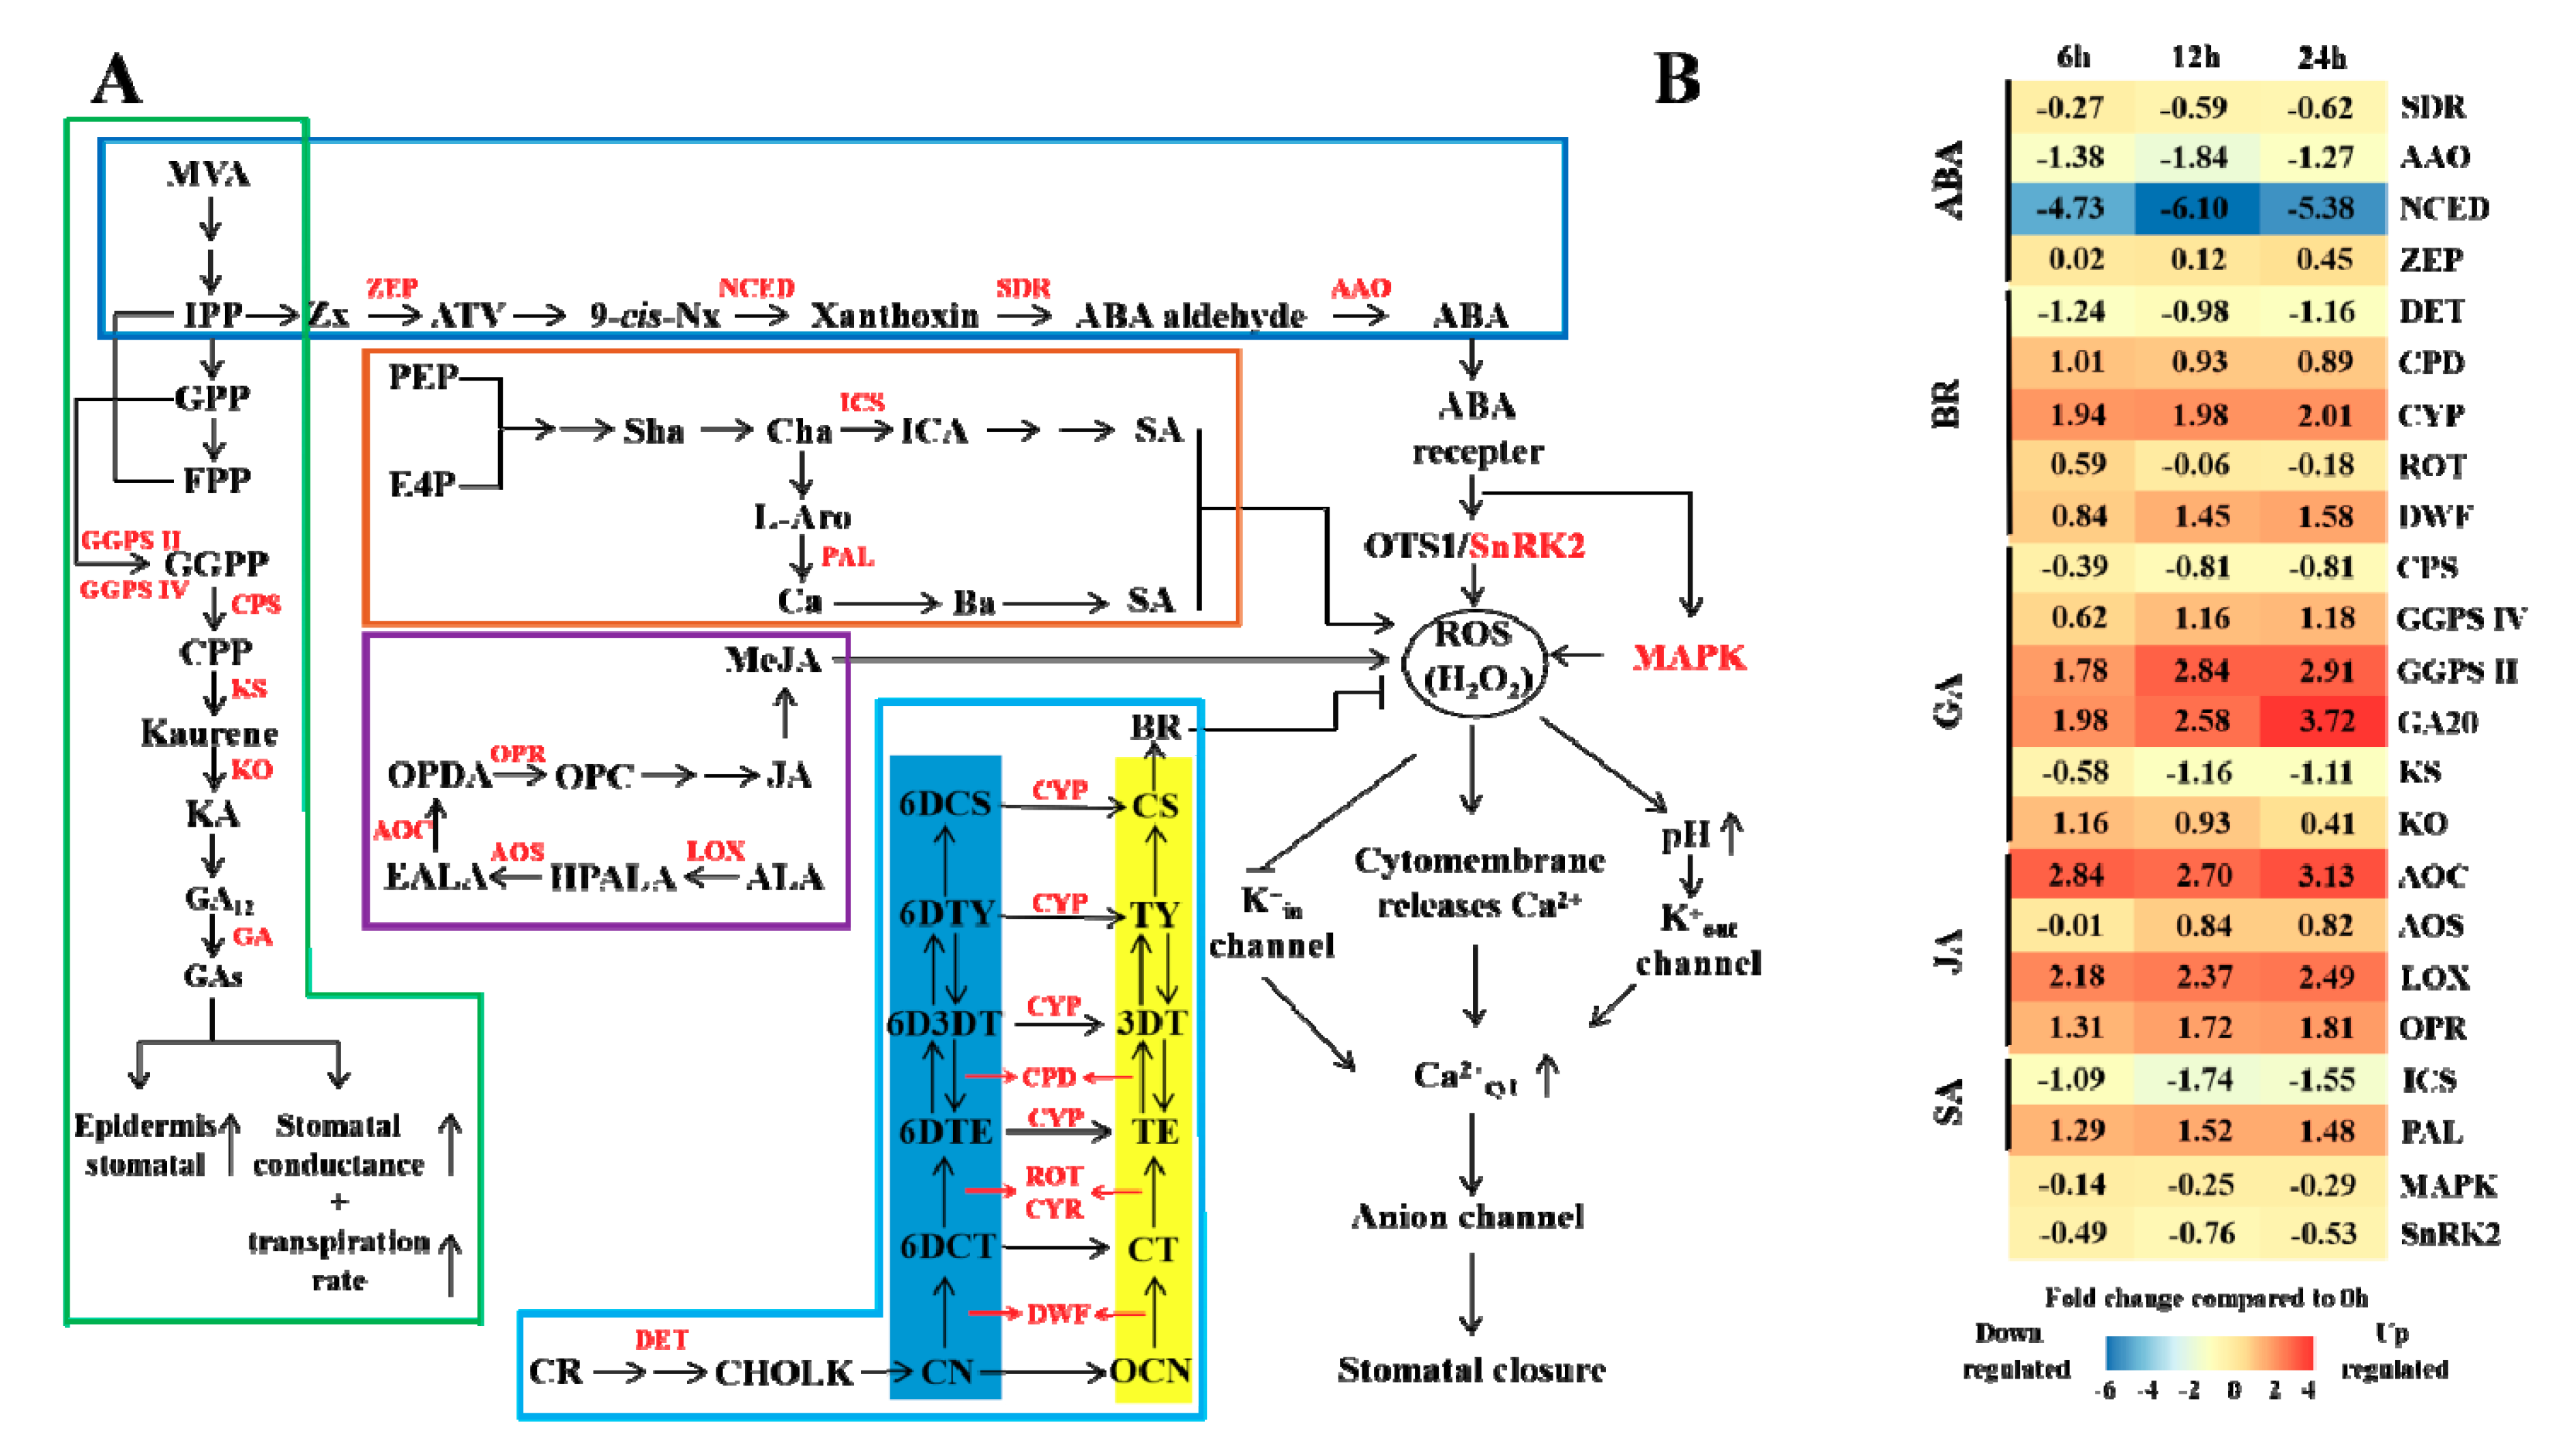
3.5. Hormone Regulation under Elevated CO2 Stress

Based on previous studies [30,31,32,33], combined with KEGG analysis results, the expression patterns of 5 plant hormones (ABA, GA, SA, BR and JA) and their corresponding synthesis genes under CO2 stress were analyzed in this study. In the ABA synthesis pathway, except for the expression of ZEP (zeaxanthin epoxidase) that was slightly up-regulated (no significant difference from CK), all other genes were down-regulated. Among them, NCED (9-cis-epoxycarotenoid dioxygenase) decreased most obviously (Figure 4B). and the log2 fold changes in expression compared to CK decreased 4.73, 6.10 and 5.38 times at 6 h, 12 h and 24 h, respectively.
On the other hand, the genes expression pattern of the other four hormones showed an increasing trend under CO2 stress. The key enzyme in the GA metabolic pathway is geranyl geranyl pyrophosphate (GGPS), which catalyzes the synthesis of geranylgeranyl pyrophosphate (GGPP) from isopentenyl pyrophosphate (IPP), geranyl pyrophosphate (GPP) and farnesyl pyrophosphate (FPP). Under CO2 stress, GGPS expression increased continuously with time (Figure 4B).
As shown in Figure 4A, SA can be synthesized via two routes, by isochorismic acid (ICA) and by cinnamic acid (Ca), benzoic acid (Ba), etc. The specific genes involved in the first pathway have not yet been thoroughly studied [34], while the second pathway has been well researched. Under CO2 stress, PAL expression continued to increase, reaching a peak at 12 h and then stabilizing (there was no significant difference between 24 h and 12 h). Due to the expression pattern of PAL, we speculated that the pathway used for SA synthesis in Masson pine under CO2 stress was mainly the second pathway.
The BR synthesis pathways include early (Figure 4A, yellow block) and advanced (blue block) C-6 synthetic pathways [35]. Intermediate metabolites in the advanced pathway could be converted to corresponding metabolites in the early pathway. However, at the upstream pathway, the conversion efficiency was not very high because the expression levels of ROT (C-23 hydroxylase) was down-regulated with increasing treatment time. In contrast, downstream of the pathway, due to the increase in CYP expression (Figure 4B), BR might be synthesized through the early pathway. Overall, both metabolic pathways showed increased efficiency under CO2 stress (Figure 4B).
All genes in the JA (MeJA) synthetic pathway were up-regulated under CO2 stress. Among them, AOC (allene oxide synthase) was the most significantly up-regulated. At 6 h, the relative expression level of AOC was 2.84 times that of CK and then increased, and may continue to increase with increased treatment time. Within 24 h, the expression of AOC was far higher than that of the other genes in the pathway (Figure 4B). It could be speculated that AOC might be a key gene involved in the induction of JA production in Masson pine under high CO2 concentrations.

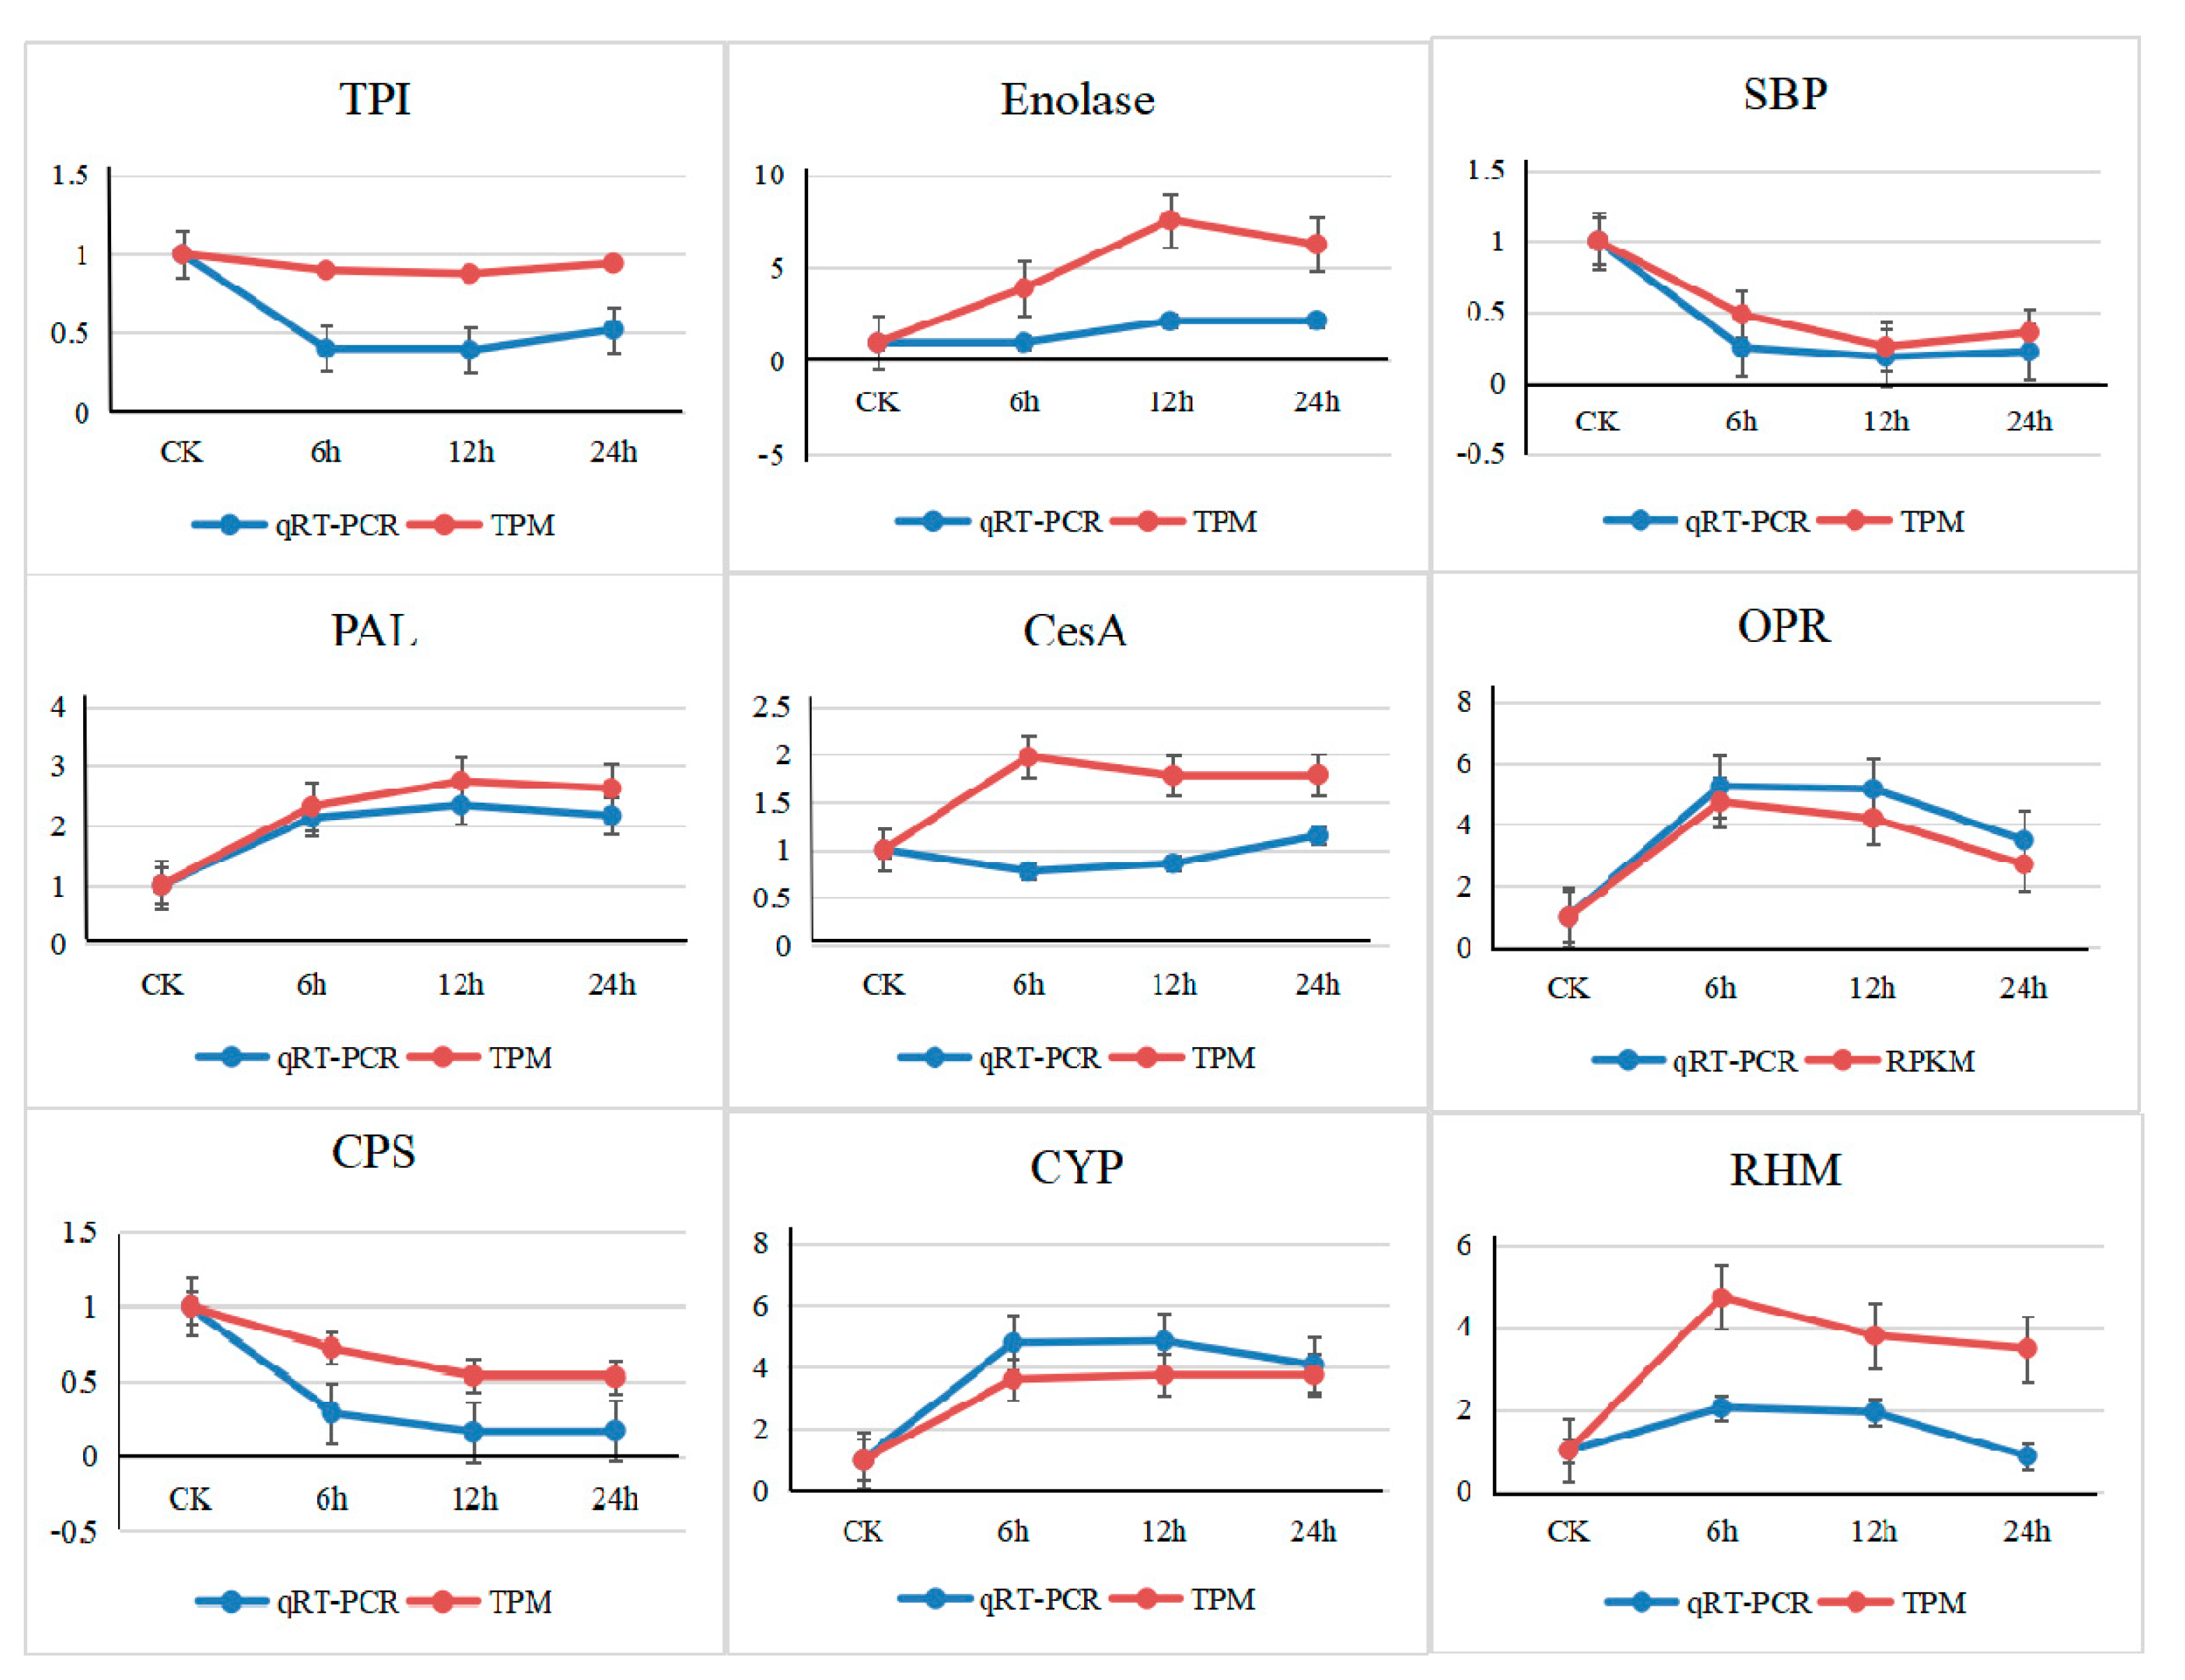
3.6. Validation by Quantitative Real-Time PCR

To verify the reliability of the transcriptome data, nine genes showing significant up- or down-regulation in the stressed seedlings were randomly chosen for qRT-PCR analysis (Figure 5). Among them, PAL showed constitutively up-regulated expression, and CYP increased at first and reached maximum expression at 6 h, after which there was no significant change. Compared with CK, 6 h, 12 h and 24 h CO2 treatments had up-regulated levels of RHM and OPR, and the relative expression levels of these genes were higher at 6 h than at 12 h and 24 h. On the other hand, enolase had the same trend as RHM and OPR, except that the maximum value appeared at 12 h. CPS and SBP showed constitutively down-regulated expression, and TPI (triose-phosphate isomerase) showed a trend of first decline and then increase. Among all genes, the qRT-PCR results of 6 genes (CYP, CPS, OPR, PAL, SBP and TPI) were very close to the RNA-seq (via the TPM algorithm) results. The expression trend of RHM and enolase was similar to that of RNA-seq, but the fold change in qRT-PCR expression was lower than that in the RNA-seq data. The qRT-PCR results of CesA were quite different compared with the RNA-seq results. In general, the RNA-seq data were similar to the gene expression trend shown by qRT-PCR analysis, indicating that the results of RNA-seq analysis were effective.

4. Discussion

4.1. Effects of Elevated CO2 on Masson Pine Energy Metabolism

The results of this study showed that in the major energy metabolism pathways of Masson pine, the expression levels of most genes involved in photosynthesis, including light and dark reactions, showed a significant downward trend under CO2 stress. We speculate the main cause of this phenomenon should be the decrease in the expression of Rubisco, which is a key enzyme in photosynthetic carbon assimilation, directly affecting the photosynthetic efficiency of Masson pine [36]. Combined with the up-regulated of key genes in the carbohydrate metabolism during the same period (Figure 3B), it leads to the activation of its signaling pathway, which inhibits the expression of RbcS (Rubisco small subunit) and other photosynthesis-related protein-coding genes through hexokinase transmission, thereby affecting the photosynthetic efficiency [37].
Significantly, previous studies [38,39] have shown the expression of Rubisco will show an up-regulated trend under the high CO2 treatment condition. But the results of this experiment are the opposite. This may be because the expression of carbon sequestration gene is greatly affected by the leaf age [40]. The photosynthetic acclimation of coniferous leaves in one-year needles under high CO2 treatment was more obvious than that in mature coniferous leaves [41]. According to the experimental results, the expression of each gene in photosynthesis showed a downward trend when the sample was analyzed at the shortest detection time (6 h). Therefore, we speculate the photosynthetic acclimation should be completed within 6 h.
However, in other energy metabolism pathways of Masson pine, the expression levels of various genes under high CO2 stress generally showed an upward trend. Fukayama et al. [42] obtained similar results in an experiment on the effect of CO2 on rice, but the difference in gene expression was inferior to our study, possibly because rice belongs to herbage, and the adaptability of rice to CO2 stress is higher than that of Masson pine. Previous studies found that a high concentration of CO2 promoted the production of a large amount of sucrose in leaves, and the increase in sucrose concentration induces the expansion of glycolytic flux in plants and simultaneously increases the distribution of carbon in the organic acid and TCA cycles, thereby regulating the increase in related gene expression [43].

4.2. Effects of Elevated CO2 on Masson Pine Carbohydrate and Cell Wall Component Synthesis

In photosynthetic cells, fixed carbon eventually transforms into sucrose and starch. These compounds are the main form of carbohydrate transport and storage in advanced plants. SPS, SUS and INV are considered to be the key genes in the sucrose synthesis pathway [44]. The results of our experiment suggest that there were no significant differences in SPS and SUS levels between the CK and different treatments, while INV showed an increased difference. This result suggested that, sucrose produced by photosynthesis was more likely to be decomposed into glucose-6-phosphate (G-6-P) and fructose-6-phosphate (F-6-P), and then participated in subsequent reactions is the main metabolic direction of sucrose under high CO2 stress. Van et al. [45] found that INV was significantly up-regulated and SUS was relatively inhibited in mature leaves of in vitro tomato plantlets with high CO2 stress under the condition of providing exogenous sucrose (3%). In addition, other studies also showed that the expression of INV and the contents of glucose and fructose in leaves increased under cold, NaCl, PEG and other stress conditions, which showed similar phenomena to CO2 stress conditions [46,47].
In the starch synthesis pathway, three different starch-formed synthetases (GBSS, SSS and SBE) are the key regulatory enzymes. In this study, the expression level of GBSS were significantly higher than that of SBE and SSS under high CO2 stress. GBSS generates a branchless linear glucan starch chain (amylose) by specific binding to starch granules, which is necessary for the production of amylose [48]. Due to the high expression of GBSS, we suspected that, amylose was more inclined to synthesize under high CO2 stress in Masson pine. The similar results were confirmed in Cui [49] study. He found that the CO2 stress could significantly improve the activity of GBSS in winter wheat, resulting in a large amount of amylose production, and the expression level increased first and then decreased, which was similar to this experiment.

4.3. Effects of Elevated CO2 on Masson Pine Cell Wall Component Synthesis

The plant cell wall is mainly composed of polysaccharides, which are the largest storage place for photosynthetic carbon fixation [50]. The synthesis of cell wall components is a highly complex process involving multiple enzymes and metabolic intermediates [29]. The major components of the cell wall, such as cellulose, hemicellulose, and pectin, require a variety of ribose compounds, most of which rely on UDP-Glc derivatization (Figure 3A) [29,51]. For the genes regulating UDP-Glc to produce hemicellulose and pectin precursor derivatives, the expression levels of GMD and RHM were higher than those of others. Due to the increased expression of RHM and GMD under CO2 stress, we speculate that their corresponding products (UDP-Rha and GDP-Fuc) were the main components of cell wall precursors at this stage. However, there is still no unified conclusion on its specific process of influence. Sufficient long-term research and evidence to fully and thoroughly understand the mechanism are required.

4.4. Effects of Elevated CO2 on Masson Pine Hormones and Stomatal Regulation

In this study, the results showed that except ZEP, the expression of each gene in the ABA synthesis pathway tended to decrease with prolonged CO2 treatment time, especially NCED. The catalysis of 9-cis-neoxanthin to Xanthoxin by NCED is a key step in the ABA metabolic pathway in plastids [52].Therefore, a decrease in the expression of NCED seriously affects the expression of other genes in the ABA metabolic pathway, which in turn affects ABA accumulation in the cell [53]. Previous studies have shown that ABA is greatly affected by BR when regulating stomatal opening and guard cell physiological states [54]. Elevated CO2 led to a sharp increase in the expression of key genes in the BR metabolic pathway, such as CYP, which would inhibite ABA from binding to ABI (a kind of serine/threonine protein phosphatase), thereby weakening the effect and signal transmission of ABA [55].
For other hormones, the key genes in their synthetic pathway increased to varying degrees at the same stage. Among them, the expression of GGPS, the key gene of GA synthesis, continued to up-regulate with prolonged stress. Studies have shown that GA can divide plant hypocotyl epidermal cells, promote stomatal formation, regulate stomatal density [56], so as to maintain stomatal conductance and the transpiration rate under the condition of elevated CO2 concentration. On the other hand, according to our result, the key gene in the JA and SA synthetic pathway, including AOC, LOX and PAL, remained at a high expression level with prolonged stress. It indicated that the reaction proceeded in the direction of JA and SA synthesis, which would cause stomatal closure [57,58,59].
In general, although previous studies have shown that ABA is the most important hormone to control stomatal switching in plants, in Masson pine under CO2 stress, the expression level of each gene in the ABA synthesis pathway was basically inhibited. However, this did not affect stomatal closure in Masson pine because the genes regulated other hormones that promote stomatal formation or induce its closure were general up-regulated in the same environment.

5. Conclusions

The effect of rising CO2 concentrations on plants is known, however, little research has been done on Masson pine. In this study, we tried to explore the molecular response of Masson pine under high CO2 stress. The results showed that, the genes expression would generally decrease in photosynthesis pathway (light reaction and Calvin cycle), and generally increase in other energy metabolic pathways, including TCA, EMP and PPP. At the same time, Increased CO2 concentration could also promote the gene expression in cell wall precursor synthesis pathway. In addition, CO2 stress inhibited the genes expression in the ABA synthesis pathway, but increased in other hormones synthesis pathway (including BR, GA, SA and MeJA), which might regulate stomatal density and stomatal closure. As the first report on the high-throughput sequencing of CO2 tolerant Masson pine, this study should provide novel insights into CO2 tolerance genes and be a valuable molecular basis for study in Masson pine.

Author Contributions

Conceptualization, F.W. and K.J.; software, P.Z. and J.L.; investigation, W.F., N.L. and X.S.; resources, B.Z. and N.L.; writing—original draft preparation, F.W. and X.S.; writing—review and editing, F.W. and K.J.; visualization, F.W., P.Z. and J.L.

Funding

This research was funded by the National Key R&D Program of China (2017YFD0600304) and the Priority Academic Program Development of Jiangsu Higher Education Institutions (PAPD).

Acknowledgments

We would like to thank Major biotechnology corporation (Shanghai, China) for assistance with sequencing services.

Conflicts of Interest

The authors declare no conflict of interest. The funders had no role in the design of the study; in the collection, analyses, or interpretation of data; in the writing of the manuscript, or in the decision to publish the results.

Appendix A

Table A1. Primers used in this study.
Primer Sequence (5′→3′)
RHMForwardTACGAATAGTCTCTGGCTTGTGAG
ReverseTCTGGTTGTGTCCTTGACCTAATA
CYPForwardTCTATGGTGATCACTGGAGAAAGA
ReverseGATGAGAGAATGGTTGAGAATGTG
CPSForwardTACTCGGTGTTATAAGTGCAGCTC
ReverseCATGTAGCCCTTGACACAAAATAG
OPRForwardTACGATACGGGAACAACTACTGAA
ReverseTCGAGCTCTAAAAACTGAGGAGAT
PALForwardGAAGCCTGAGTTTACAGATCCATT
ReverseCGTAAACCACTTCAATCACTTCAC
CesAForwardGGAAGGCTGTACTTTATCCTTCAA
ReverseATGCAAGACCAGATACAAGAGACA
SBPForwardTACCAGCCCAATAACAATAACCAC
ReverseCTCTCATCCACGAAGCTAATAACC
TPIForwardCCCTCTGCCACTTTCTTTATGTC
ReverseTCTAAGACTTCCTCACTTCTCCG
EnolaseForwardAAGAGCTGCAAGGTAAAGTCTGTT
ReverseTCTGATTCACCTTCAGCAGTAAAG
qRT-PCR-RHMForwardCCACATCCTCACAGTAGAGATAGC
ReverseCCGGTGATTACTACCAGAGGTAAC
qRT-PCR-CYPForwardAGGCCCTTCCTCAGAGGTTATCT
ReverseCCGGAGTTGGTACTAGTCTTGGTA
qRT-PCR-CPSForwardGTCTAGAGCGGTTCACTCAGAT
ReverseCCTCTCTCCAACTATCACTGTGTC
qRT-PCR-OPRForwardGGTACCGTTCTTACTGGTTTGAGG
ReverseGATCCTGTAGTTGGCTACACAGAC
qRT-PCR-PALForwardCCCTCAGGTGGAGATTATCAG
ReverseCCTCCATGTAGAGCTTTGTCTC
qRT-PCR-CesAForwardCCTGTACGGAGTAAGTTTGGTG
ReverseACCAGTGGAGGTAGATATGCTG
qRT-PCR-SBPForwardCTACAGAGATAGGAGAGGGGAAAC
ReverseCTCCTGTGTATCGGAGTGTGTACT
qRT-PCR-TPIForwardCCTCCCACTTCTACTAGGGTTT
ReverseACCAGCCAGGAGTAGTTAAGAGTG
qRT-PCR-EnolaseForwardGGCCAGACAGATTATAGACAGC
ReverseCTCTCATCTCTAGGGCCTCATA
Table A2. Abbreviation in this study.
Abbr.Full NameAbbr.Full Name
PSPhotosystemLECLight Harvesting Complex
PCPlastocyaninRuBPRibulose-1,5-Bisphosphate
3-PG3-Phosphoglycerate1,3-DPG1,3-Diphosphoglycerate
PGAL3-PhosphoglyceraldehydeDHAPDihydroxy-Acetone Phosphate
FBPFructose-1,6-DiphosphateF-6-PFructose-6-Phosphate
E-4-PErythrose 4-PhosphateSBPSedoheptulose-1,7-Diphosphate
S-7-PSedoheptulose-7-PhosphateR-5-PRibose-5-Phosphate
Ru-5-PRibulose-1,5-PhosphateXu-5-PXylulose-5-Phosphate
6-PG6-Phosphogluconate6-PG-LGluconolactone-6-Phosphate
G-6-PGlucose-6-Phosphate2-PG2-Phosphoglycerate
PEPPhosphoenolpyruvic acidEPEnolpyruvic Acid
PyrPyruvic AcidAcCoAAcetyl CoA
ICLIsocitric AcidKGAα-Ketoglutaric Acid
SUASuccinate AcidH2MAMalic Acid
OAAOxaloacetic AcidRCARubisco Activase
PGKPhosphoglycerate KinaseGAPDGlyceraldehyde-3-Phosphate Dehydrogenase
TPITriose-Phosphate IsomeraseTRATransaldolase
FBPaseFructose-1,6-BisphosphataseTKLTransketolase
RPIRibulose Phosphate IsomeraseSBPaseSedoheptulose-1,7-Bisphosphatase
RPKPhosphoribulokinaseRPERibulose Phosphate Epimerase
6-PGDH6-Phosphogluconate DehydrogenaseG-6-PDGlucose-6-Phosphate-Dehydrogenase
G-6-PaseGlucose-6-PhosphataseHKHexokinase
PKPyruvate KinasePGAMPhosphoglycerate Mutase
CSCitrate SynthaseICDIsocitrate Dehydrogenase
OGDCα-Ketoglutarate DehydrogenaseSDHSuccinate Dehydrogenase
MDHMalate DehydrogenaseTPTriose Phosphate
ADP-GlcAdenosine Diphosphate GlucoseUDP-GlcUridine Diphosphate Glucose
M-6-PMannose-6-PhosphateM-1-PMannose-1-Phosphate
GDP-ManGuanosine Diphosphate MannoseGDP-FucGuanosine Diphosphate Fucose
UDP-RhaUridine Diphosphate RhamnoseUDP-GalUridine Diphosphate Galacturonate
UDP-GlcAUridine Diphosphate GlucuronateUDP-XylUridine Diphosphate Xylose
UDP-ApiUridine Diphosphate ApioseUDP-ArapUridine Diphosphate Arabinose, Pyranose form
UDP-ArafUridine Diphosphate, Furanose formFDAFructose-Bisphosphate Aldolase
GPIPhosphoglucose IsomerasePGMPhosphoglucomutase
SPStarch PhosphorylaseAGPAdenosine Diphosphoglucose Pyrophosphorylase
SSSSoluble Starch SynthaseGBSSGranule-bound Starch Synthase
SBEStarch Branching EnzymeUGPUDP-Glucose Pyrophosphorylase
CesACellulose Synthase Catalytic SubunitCslCellulose Synthase
MPIPhosphomannose IsomerasePMMPhosphomannomutase
MGPMannose-1-Phosphate GuanylyltransferaseGMDGDP-Mannose 4,6-Dehydratase
INVInvertasecwINVCell Wall Invertase
SPSSucrose-Phosphate SynthaseSUSSucrose Synthase
RHMRhamnose Biosynthetic EnzymeUGEUDP-Glucose 4-Epimerase
UGDUDP-Glc DehydrogenaseUXS/AXSUDP-Glucuronate Decarboxylases
UAEUDP-Arabinose 4-EpimeraseUAMUDP-Arabinose Mutase
ABAAbscisic AcidGAGibberellin
SASalicylic AcidJAJasmonate
BRBrassinolideMVAMevalonic Acid
IPPIsopentenyl PyrophosphateZxZeaxanthin
ATVAll-trans Violaxanthin9-cis-Nx9-cis-Neoxanthin
GPPGeranyl- PyrophosphateFPPFarnesyl Pyrophosphate
GGPPGeranylgeranyl PyrophosphateCPPCuban Pyrophosphate
KAKaurenoic AcidShaShikimic Acid
ChaChorismic acidICAIsochorismic Acid
L-AroL-ArogenateCaCinnamic Acid
BaBenzoic AcidALALinolenic Acid
HPALA13-Hydrogen Peroxide Linolenic AcidEALA12,13-Epoxylinolenic Acid
OPDA12-Oxophytodienoic AcidCRCampesterol
CHOLKCholesten-3-KetoneCNCampestanol
OCN6-OxocampestanolCTCathasterone
6DCT6-DeoxycathasteroneTETeasterone
6DTE6-Deoxyteasterone3DT3-Dehydrocathasterone
6D3DT6-Deoxy-3-DehydrocathasteroneTYTyphasterol
6DTY6-DeoxytyphasterolCSCastasterone
6DCS6-DeoxycastasteroneOTS1Open Stomata 1
SnRK2Sucrose Non-fermenting 1-related KinaseMAPKMitogen Activated Protein Kinase
ZEPZeaxanthin EpoxidaseNCED9-cis-Epoxycarotenoid Dioxygenase
SDRShort-chain Dehydrogenase/reductaseAAOABA Aldehyde Oxidase
ICSIsochorismate SynthasePALPhenylalanine Ammonialyase
GGPSGeranylgeranylpyrophosphateCPSCopalyl Pyrophosphate Synthase
KSKaurene SynthaseKOKaurene Oxidase
GAGibberellin OxidaseLOXLipoxygenase
AOSAllene Oxide SynthaseAOCAllene Oxide Cyclase
OPR12-Oxophytodienoate ReductaseDWFTrans-Cinnamate 4-Hydroxylase
ROTC-23 HydroxylaseCPDCoumarate-3-Hydroxylase

References

  1. Liu, Y.H.; Wang, H.J.; Zhang, X.Q. The background of climate change, diplomatic and political games. In Climate Change and Forest Carbon in China; Li, T.Y., Lin, H., Eds.; China Meteorological Press: Beijing, China, 2014; pp. 9–14. [Google Scholar]
  2. GCP. Carbon Budget. Available online: http://www.globalcarbonproject.org/carbonbudget (accessed on 6 July 2019).
  3. Yue, J.W. Dynamics, Potential and Mechanism of Carbon Sequestration in Major Forest Types in Gansu Province, China. Ph.D. Thesis, University of Chinese Academy of Sciences, Beijing, China, 2018. [Google Scholar]
  4. Urban, O. Physiological Impacts of Elevated CO2 Concentration Ranging from Molecular to Whole Plant Responses. Photosynthetica 2003, 41, 9–20. [Google Scholar] [CrossRef]
  5. Chen, G.Y.; Yong, Z.H. Photosynthetic Acclimation in Rice Leaves to Free-air CO2 Enrichment Related to Both Ribulose-1,5-bisphosphate Carboxylation Limitation and Ribulose-1,5-bisphosphate Regeneration Limitation. Plant Cell Physiol. 2005, 46, 1036–1045. [Google Scholar] [CrossRef] [PubMed]
  6. Ainsworth, E.A.; Rogers, A. The response of photosynthesis and stomatal conductance to rising [CO2]: Mechanisms and environmental interactions. Plant Cell Environ. 2007, 30, 258–270. [Google Scholar] [CrossRef] [PubMed]
  7. Ashraf, M.; Akram, N.A.; Arteca, R.N. The Physiological, Biochemical and Molecular Roles of Brassinosteroids and Salicylic Acid in Plant Processes and Salt Tolerance. Crit. Rev. Plant Sci. 2010, 29, 162–190. [Google Scholar] [CrossRef]
  8. Pan, C.Z.; Zhang, H.; Ma, Q.M.; Fan, F.J. Role of ethylene biosynthesis and signaling in elevated CO2-induced heat stress response in tomato. Planta 2019, 250, 563–572. [Google Scholar] [CrossRef] [PubMed]
  9. Romero, I.; Alegria, C.E.; Pradena, A.G. WRKY transcription factors in the response of table grapes (cv. Autumn Royal) to high CO2 levels and low temperature. Postharvest Biol. Technol. 2018, 150, 42–51. [Google Scholar]
  10. Zou, X.L.; Shen, Q.J.X.; Neuman, D. An ABA inducible WRKY gene integrates responses of creosote bush (Larrea tridentata) to elevated CO2 and abiotic stresses. Plant Sci. 2007, 172, 997–1004. [Google Scholar] [CrossRef]
  11. Ni, Z.X.; Ye, Y.J.; Bai, T.D.; Xu, M.; Xu, L.A. Complete Chloroplast Genome of Pinus massoniana (Pinaceae): Gene Rearrangements, Loss of ndh Genes, and Short Inverted Repeats Contraction, Expansion. Molecules 2017, 22, 1528. [Google Scholar] [CrossRef]
  12. Guo, Y. Changes in Total Stand Biomass of Pinus Massoniana Forests and Its Response to Age Class Structure in Hunan Province, China. Master’s, Thesis, Central South University of Forestry and Technology, Hunan, China, 2015. [Google Scholar]
  13. Justine, M.F.; Yang, W.Q.; Wu, F.Z.; Khan, M.N. Dynamics of biomass and carbon sequestration across a chronosequence of Masson pine plantations. J. Geophys. Res. Biogeosci. 2017, 122, 578–591. [Google Scholar] [CrossRef]
  14. Elias, M.; Potvin, C. Assessing inter-and intra-specific variation in trunk carbon concentration for 32 neotropical tree species. Can. J. For. Res. 2003, 33, 1039–1045. [Google Scholar] [CrossRef]
  15. Banerjee, S.; Siemianowski, O.; Liu, M.L.; Lind, K.R. Stress response to CO2 deprivation by Arabidopsis thaliana in plant cultures. PLoS ONE 2019, 14, e0212462. [Google Scholar] [CrossRef] [PubMed]
  16. Kumar, A.; Castellano, I.; Patti, F.P. Molecular response of Sargassum vulgare to acidification at volcanic CO2 vents: Insights from de novo transcriptomic analysis. Mol. Ecol. 2017, 26, 2276–2290. [Google Scholar] [CrossRef] [PubMed]
  17. De Souza, A.P.; Cocuron, J.C.; Garcia, A.C.; Alonso, A.P.; Buckeridge, M.S. Changes in Whole-Plant Metabolism during the Grain-Filling Stage in Sorghum Grown under Elevated CO2 and Drought. Plant Physiol. 2015, 169, 1755–1765. [Google Scholar] [CrossRef] [PubMed]
  18. Martin, M. Cutadapt removes adapter sequences from high-throughput sequencing reads. EMBnet J. 2011, 17, 10–12. [Google Scholar] [CrossRef]
  19. Haas, B.J.; Papanicolaou, A.; Yassour, M.; Grabherr, M.; Blood, P.D.; Bowden, J.; Couger, M.B.; Eccles, D.; Li, B.; Lieber, M.; et al. De novo transcript sequence reconstruction from RNA-seq using the Trinity platform for reference generation and analysis. Nat. Protoc. 2013, 8, 1494–1512. [Google Scholar] [CrossRef] [PubMed]
  20. Smith-Unna, R.; Boursnell, C.; Patro, R.; Hibberd, J.M.; Kelly, S. TransRate: Reference-free quality assessment of de novo transcriptome assemblies. Genome Res. 2016, 26, 1134–1144. [Google Scholar] [CrossRef] [PubMed]
  21. Simão, F.A.; Waterhouse, R.M.; Ioannidis, P. BUSCO: Assessing genome assembly and annotation completeness with single-copy orthologs. Bioinformatics 2015, 31, 3210–3212. [Google Scholar] [CrossRef]
  22. Li, B.; Dewey, C.N. RSEM: Accurate transcript quantification from RNA-Seq data with or without a reference genome. BMC Bioinform. 2011, 12, 323. [Google Scholar] [CrossRef]
  23. Wang, L.K.; Feng, Z.X.; Wang, X.; Wang, X.W.; Zhang, X.G. DEGseq: An R package for identifying differentially expressed genes from RNA-seq data. Bioinformatics 2010, 26, 136–138. [Google Scholar] [CrossRef]
  24. Anders, S.; Huber, W. Differential expression analysis for sequence count data. Genome Biol. 2010, 11, R106. [Google Scholar] [CrossRef]
  25. Zhu, P.; Ma, Y.; Zhu, L.; Chen, Y.; Li, R.; Ji, K. Selection of Suitable Reference Genes in Pinus massoniana Lamb. Under Different Abiotic Stresses for qPCR Normalization. Forests 2019, 10, 632. [Google Scholar] [CrossRef]
  26. Fan, F.H.; Wang, Q.H.; Wen, X.P.; Ding, G.J. Transcriptome-wide identification and expression profiling of Pinus massoniana MYB transcription factors responding to phosphorus deficiency. J. For. Res. 2019, 20. [Google Scholar] [CrossRef]
  27. Du, M.F.; Ding, G.J.; Cai, Q. The Transcriptomic Responses of Pinus massoniana to Drought Stress. Forests 2018, 9, 326. [Google Scholar] [CrossRef]
  28. Sarka, E.; Dvoracek, V. Biosynthesis of waxy starch-a review. Plant Soil Environ. 2017, 63, 335–341. [Google Scholar]
  29. Verbancic, J.; Lunn, J.E.; Stitt, M.; Persson, S. Carbon Supply and the Regulation of Cell Wall Synthesis. Mol. Plant 2018, 11, 75–94. [Google Scholar] [CrossRef]
  30. Bashar, K.K.; Tareq, M.Z.; Amin, M.R.; Honi, U. Phytohormone-Mediated Stomatal Response, Escape and Quiescence Strategies in Plants under Flooding Stress. Agronomy 2019, 9, 43. [Google Scholar] [CrossRef]
  31. Huang, H.; Liu, B.; Liu, L.Y.; Song, S.S. Jasmonate action in plant growth and development. J. Exp. Bot. 2017, 68, 1349–1359. [Google Scholar] [CrossRef] [Green Version]
  32. Ha, Y.M.; Shang, Y.; Yang, D.; Nam, K.H. Brassinosteroid reduces ABA accumulation leading to the inhibition of ABA-induced stomatal closure. Biochem. Biophys. Res. Commun. 2018, 504, 143–148. [Google Scholar] [CrossRef]
  33. Miura, K.; Tada, Y. Regulation of water, salinity, and cold stress responses by salicylic acid. Front. Plant Sci. 2014, 5, 4. [Google Scholar] [CrossRef] [Green Version]
  34. Hernandez-Ruiz, J.; Arnao, M.B. Relationship of Melatonin and Salicylic Acid in Biotic/Abiotic Plant Stress Responses. Agronomy 2018, 8, 33. [Google Scholar] [CrossRef]
  35. Zhao, B.L.; Li, J. Regulation of Brassinosteroid Biosynthesis and Inactivation. J. Integra. Plant Biol. 2012, 54, 746–759. [Google Scholar] [CrossRef] [PubMed]
  36. Xie, H.; Fan, G.Z.; Jin, Y.H.; Dong, L.; Deng, F.H. Progress of Research on Photosynthetic Acclimation of Plant to Elevated Atmospheric CO2. Rev. China Agric. Sci. Technol. 2006, 8, 29–34. [Google Scholar]
  37. Drake, B.G.; Gonzalez-Meler, M.A.; Long, S.P. More Efficient Plants: A Consequence of Rising Atmospheric CO2. Ann. Rev. Plant Biol. 1997, 48, 609–639. [Google Scholar] [CrossRef] [PubMed]
  38. Sreeharsha, R.V.; Mudalkar, S.; Sengupta, D.; Unnikrishnan, D.K.; Reddy, A.R. Mitigation of drought-induced oxidative damage by enhanced carbon assimilation and an efficient antioxidative metabolism under high CO2 environment in pigeonpea (Cajanus cajan L.). Photosynth. Res. 2019, 139, 425–439. [Google Scholar] [CrossRef] [PubMed]
  39. Xu, M.Y. Effect of Elevated CO2 on Photosynthetic Characteristics and Molecular Mechanism in Deyeuxia Angustifolia. Ph.D. Thesis, Northeast Agricultural University, Harbin, China, 2015. [Google Scholar]
  40. Xu, S.; Chen, W.; He, X.Y.; Huang, Y.Q.; Gao, J.Y.; Zhao, Y.; Li, B. Research advance in effect of elevated CO2 on eco-physiology of trees. Acta Ecol. Sin. 2015, 35, 2452–2460. [Google Scholar]
  41. Turnbull, M.H.; Tissue, D.T.; Griffin, K.L.; Rogers, G.N.D.; Whitehead, D. Photosynthetic acclimation to long-term exposure to elevated CO2 concentration in Pinus radiata D. Don is related to age of needles. Plant Cell Environ. 1998, 21, 1019–1028. [Google Scholar] [CrossRef]
  42. Fukayama, H.; Sugino, M.; Fukuda, T. Gene expression profiling of rice grown in free air CO2 enrichment (FACE) and elevated soil temperature. Field Crops Res. 2011, 121, 195–199. [Google Scholar] [CrossRef]
  43. Sicher, R. Combined effects of CO2 enrichment and elevated growth temperatures on metabolites in soybean leaflets: Evidence for dynamic changes of TCA cycle intermediates. Planta 2013, 238, 369–380. [Google Scholar] [CrossRef]
  44. Liu, L.X.; Shen, F.F.; Lu, H.C.; Han, O.D.; Liu, Y.G. Research Advance on Sucrose Phosphate Synthase in Sucrose Metabolism. Mol. Plant Breed. 2005, 3, 275–281. [Google Scholar]
  45. Van Le, Q.U.Y.; Samson, G.U.Y.; Desjardins, Y. Opposite effects of exogenous sucrose on growth, photosynthesis and carbon metabolism of in vitro plantlets of tomato (L. Esculentum Mill.) grown under two levels of irradiances and CO2 concentration. J. Plant Physiol. 2001, 158, 599–605. [Google Scholar] [CrossRef]
  46. Qian, W.; Yue, C.; Wang, Y.; Cao, H.; Li, N.; Wang, L.; Hao, X.; Wang, X.; Xiao, B.; Yang, Y. Identification of the invertase gene family (INVs) in tea plant and their expression analysis under abiotic stress. Plant Cell Rep. 2016, 35, 2269–2283. [Google Scholar] [CrossRef] [PubMed]
  47. Yue, C.; Cao, H.L.; Wang, L.; Zhou, Y.H.; Huang, Y.T.; Hao, X.Y.; Wang, Y.C.; Wang, B.; Yang, Y.J.; Wang, X.C. Effects of cold acclimation on sugar metabolism and sugar-related gene expression in tea plant during the winter season. Plant Mol. Biol. 2015, 88, 591–608. [Google Scholar] [CrossRef] [PubMed]
  48. Tetlow, I.J. Understanding storage starch biosynthesis in plants: A means to quality improvement. Can. J. Bot. 2006, 84, 1167–1185. [Google Scholar] [CrossRef]
  49. Cui, H. Effects of CO2 Concentration and Nitrogen Application on Grain Yield, Quality Formation and Their Physiology Mechanism in Winter Wheat. Master’s Thesis, Nanjing Agricultural University, Nanjing, China, 2011. [Google Scholar]
  50. Anderson, C.T.; Wallace, I.S. Illuminating the wall: Using click chemistry to image pectins in Arabidopsis cell walls. Plant Signal. Behav. 2012, 7, 661–663. [Google Scholar] [CrossRef] [PubMed]
  51. Diez, M.D.A.; Peiru, S.; Demonte, A.M.; Gramajo, H.; Iglesias, A.A. Characterization of Recombinant UDP-and ADP-Glucose Pyrophosphorylases and Glycogen Synthase to Elucidate Glucose-1-Phosphate Partitioning into Oligo- and Polysaccharides in Streptomyces coelicolor. J. Bacteriol. 2012, 194, 1485–1493. [Google Scholar] [CrossRef] [PubMed]
  52. Hwang, S.G.; Chen, H.C.; Huang, W.Y.; Chu, Y.C.; Shii, C.T.; Cheng, W.H. Ectopic expression of rice OsNCED3 in Arabidopsis increases ABA level and alters leaf morphology. Plant Sci. 2010, 178, 12–22. [Google Scholar] [CrossRef]
  53. De Souza, A.M.S.; Batista, V.G.L.; Pinheiro, M.P.N.; Suassuna, J.F.; de Lima, L.M.; Fernandes, P.D. Expression of NCED gene in colored cotton genotypes subjected to water stress. Rev. Bras. Eng. Agric. Ambient. 2016, 20, 692–696. [Google Scholar] [CrossRef]
  54. Haubrick, L.L.; Torsethaugen, G.; Assmann, S.M. Effect of brassinolide, alone and in concert with abscisic acid, on control of stomatal aperture and potassium currents of Vicia faba guard cell protoplasts. Physiol. Plant. 2006, 128, 134–143. [Google Scholar] [CrossRef]
  55. Hu, Y.R.; Yu, D.Q. BRASSINOSTEROID INSENSITIVE2 Interacts with ABSCISIC ACID INSENSITIVE5 to Mediate the Antagonism of Brassinosteroids to Abscisic Acid during Seed Germination in Arabidopsis. Plant Cell 2014, 26, 4394–4408. [Google Scholar] [CrossRef]
  56. Barton, C.V.M.; Duursma, R.A.; Medlyn, B.E.; Ellsworth, D.S. Effects of elevated atmospheric [CO2] on instantaneous transpiration efficiency at leaf and canopy scales in Eucalyptus saligna. Glob. Chang. Biol. 2012, 18, 585–595. [Google Scholar] [CrossRef]
  57. Gao, C.J.; Xia, X.J.; Shi, K.; Zhou, Y.H.; Yu, J.Q. Response of Stomata to Global Climate Changes and the Underlying Regulation Mechanism of Stress Responses. Plant Physiol. J. 2012, 48, 19–28. [Google Scholar]
  58. Islam, M.M.; Munemasa, S.; Hossain, M.A.; Nakamura, Y.; Mori, I.C.; Murata, Y. Roles of AtTPC1, Vacuolar Two Pore Channel 1, in Arabidopsis Stomatal Closure. Plant Cell Physiol. 2010, 51, 302–311. [Google Scholar] [CrossRef] [PubMed]
  59. Wang, L.J.; Fan, L.; Loescher, W.; Duan, W.; Liu, G.J. Salicylic acid alleviates decreases in photosynthesis under heat stress and accelerates recovery in grapevine leaves. BMC Plant Biol. 2010, 10, 34. [Google Scholar] [CrossRef] [PubMed]
Figure 1. Differential gene expression in seedlings under high CO2 stress. (A) Venn diagram of differentially expressed genes. (B) Statistical map of differentially expressed genes between different comparisons. Red and blue represent up- and down-regulated expression, respectively. (CE) The top 20 pathways in the KEGG enrichment analysis of CK compared with the 6 h, 12 h and 24 h treatments, respectively. CK: 0 h or control check group.
Genes 10 00804 g001
Figure 2. Influence of high CO2 concentration on energy metabolism. (A) The main energy pathways in plants. Black, orange, blue and green arrows represent photosynthesis, the Embden-Meyerhof-Parnas (EMP) pathway, the pentose phosphate (PPP) pathway and the tricarboxylic acid (TCA) cycle, respectively. The different enzymes are shown in red font. (B) Expression changes in the genes involved in metabolic pathways in response to stress. White indicates no change, red up-regulation, and blue down-regulation in each treatment, as shown in the color bar for a log2 fold change scale. The abbreviations in the figure are shown in Table A2 from Appendix A.
Genes 10 00804 g002
Figure 3. Influence of high CO2 concentration on sucrose, starch and cell wall components. (A) The sucrose, starch and cell wall component biosynthesis pathways according to Evžen [28] and Jana [29]. The blue, purple and green rectangles represent the cytosol, chloroplast and Golgi, respectively. The different enzymes are shown in red font. (B) Expression changes in the genes involved in metabolic pathways in response to stress. White indicates no change, red up-regulation, and blue down-regulation in each treatment, as shown in the color bar for a log2 fold change scale. The abbreviations in the figure are shown in Table A2 from Appendix A.
Genes 10 00804 g003
Figure 4. Influence of high CO2 concentration on hormone and stomatal regulation. (A) The hormone biosynthesis pathways and stomatal regulation mechanism according to Zhao [35]. The mazarine, green, brown, purple and wathet frame represents ABA, GA, SA, JA and BR synthetic pathways, respectively. The blue and yellow block represents advanced and early C-6 oxidation pathway in BR biosynthesis, respectively. The different enzymes are shown in red font. Sharp and T-shaped arrows indicate positive and negative regulation, respectively. (B) Expression changes in the genes involved in metabolic pathways in response to stress. White indicates no change, red up-regulation, and blue down-regulation in each treatment, as shown in the color bar for a log2 fold change scale. The abbreviations in the figure are shown in Table A2 from Appendix A.
Genes 10 00804 g004
Figure 5. The expression changes in the 9 randomly selected genes were determined using quantitative real-time PCR (qRT-PCR) results and sequencing data. The x-axis represents different processing times, and the y-axis represents changes in gene expression under CO2 stress. The data show the fold change in the expression of each gene under high CO2 relative to control conditions. Error bars represent standard deviations. Red indicates the RNA-sequencing results under the TPM (transcripts per million reads) algorithm, and blue indicates the qRT-PCR results.
Genes 10 00804 g005
Table 1. Summary of sequencing data quality control.
CK6 h12 h24 h
Raw reads49,314,29947,459,32245,980,03660,876,932
Raw bases7,446,459,1997,166,357,7236,942,985,4369,192,416,732
Clean reads48,795,57146,976,13445,496,76060,205,674
Clean bases7,292,383,1787,017,302,4636,802,876,2219,000,454,730
Error rate (%)0.020.020.030.03
Mapped reads16,879,02716,459,24915,859,34021,108,414
Mapped ratio (%)0.690.700.700.70
GC content (%)47.4746.7446.2446.32
Q20 (%)98.1298.2098.0697.86
Q30 (%)94.0494.2293.8693.40
Table 2. Length distribution and software evaluation of unigenes and transcripts.
TypeTranscriptUnigenes
<500 bp61,69648,592
501~1000 bp37,58622,267
1001~2000 bp25,99412,887
>2000 bp15,5878,678
Total140,86392,424
Min length (bp)201201
Max length (bp)15,49115,491
Mean length (bp)891935
N50 (bp)14631550
TransRate score0.200450.30498
BUSCO score77.7%74.2%

