Biological Network Approaches and Applications in Rare Disease Studies


Abstract
:1. Introduction
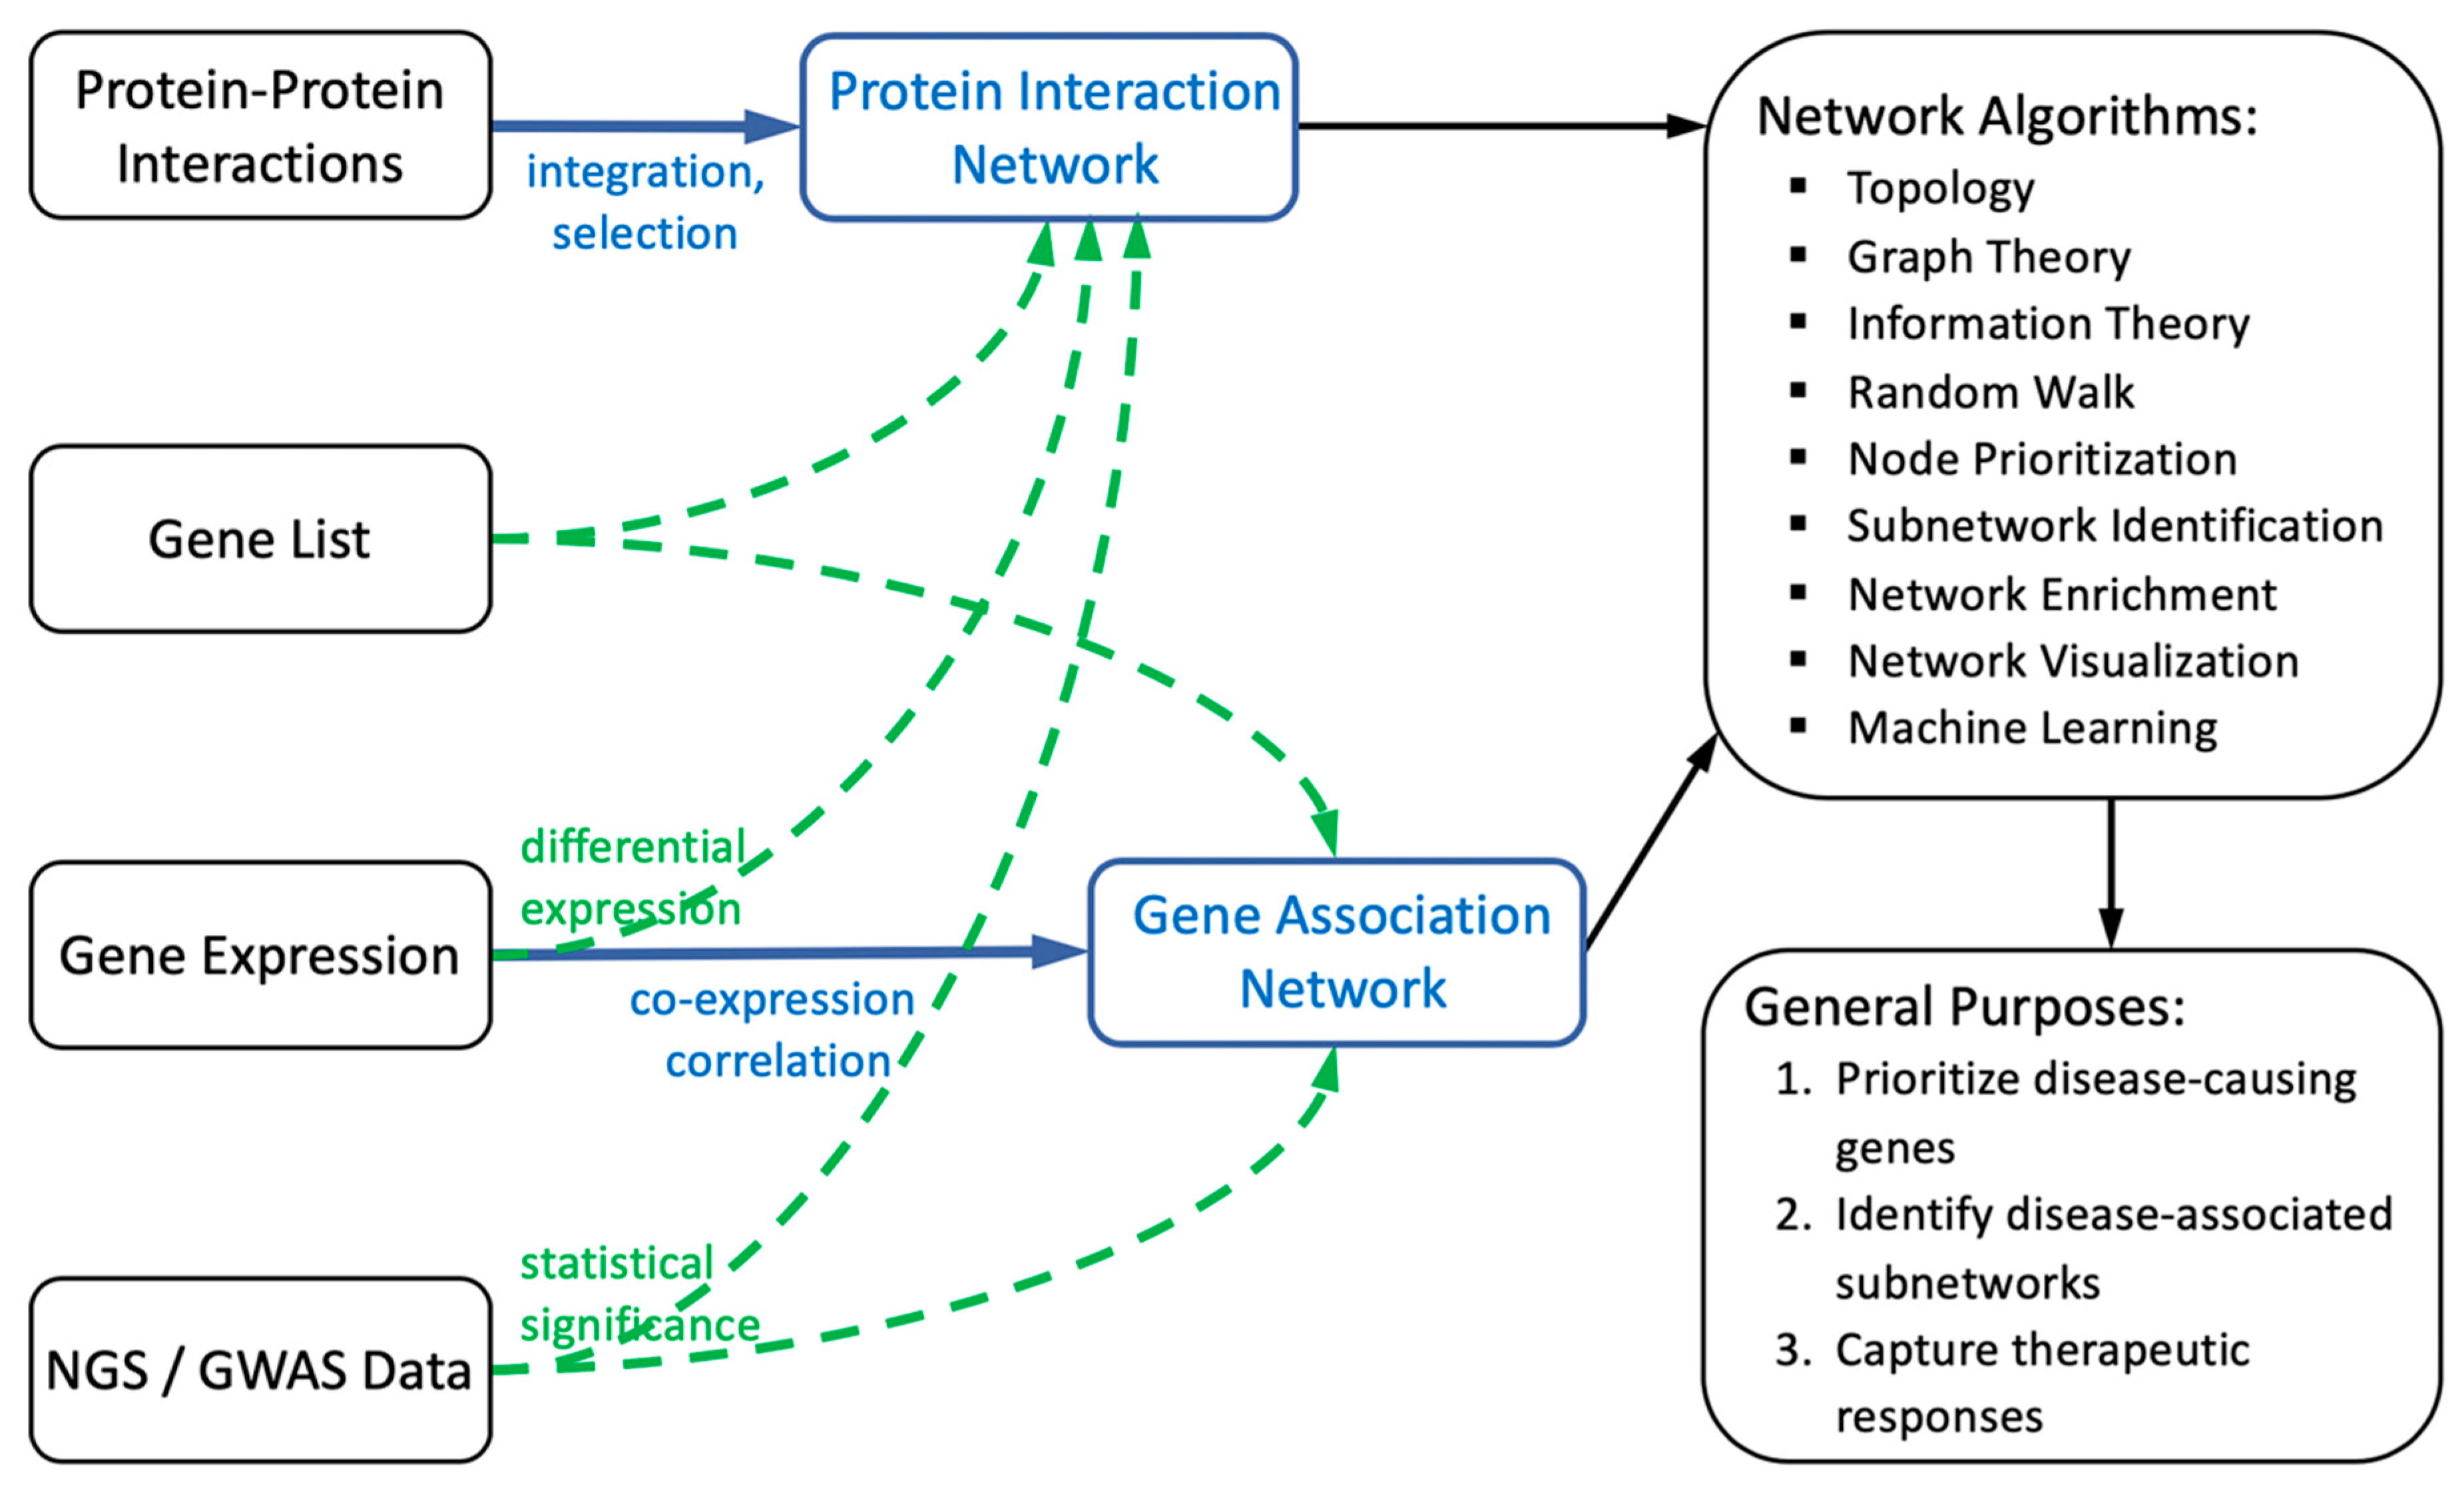
2. General Framework of Biological Networks
2.1. Construction of Biological Networks
2.1.1. Protein Interaction-Based Network Construction
2.1.2. Gene Correlation/Association-Based Network Construction
2.2. Computations of Biological Networks
2.2.1. Topological Properties
2.2.2. Node Prioritization
2.2.3. Subnetwork Identification
2.3. Additional Resources to Assist the Biological Network-Based Studies
3. Applications of Biological Networks in Studying Rare Diseases
3.1. Congenital Hyperinsulinism
3.2. Systemic Sclerosis
3.3. HGC and Its Application to Herpes Simplex Virus Encephalitis
3.4. Vertex-Similarity and Its Application to 172 Rare Diseases
3.5. DIGNiFI and Its Application to 128 Rare Diseases
4. Discussion and Conclusions
Author Contributions
Funding
Acknowledgments
Conflicts of Interest
References
- Barabasi, A.L.; Oltvai, Z.N. Network biology: Understanding the cell’s functional organization. Nat. Rev. Genet. 2004, 5, 101–113. [Google Scholar] [CrossRef]
- Ma’ayan, A. Introduction to network analysis in systems biology. Sci. Signal 2011, 4, 5. [Google Scholar] [CrossRef]
- Barabasi, A.L.; Gulbahce, N.; Loscalzo, J. Network medicine: A network-based approach to human disease. Nat. Rev. Genet. 2011, 12, 56–68. [Google Scholar] [CrossRef]
- Menche, J.; Sharma, A.; Kitsak, M.; Ghiassian, S.D.; Vidal, M.; Loscalzo, J.; Barabasi, A.L. Disease networks. Uncovering disease-disease relationships through the incomplete interactome. Science 2015, 347, 1257601. [Google Scholar] [CrossRef] [PubMed]
- Hopkins, A.L. Network pharmacology: The next paradigm in drug discovery. Nat. Chem. Biol. 2008, 4, 682–690. [Google Scholar] [CrossRef] [PubMed]
- Yildirim, M.A.; Goh, K.I.; Cusick, M.E.; Barabasi, A.L.; Vidal, M. Drug-target network. Nat. Biotechnol. 2007, 25, 1119–1126. [Google Scholar] [CrossRef] [PubMed]
- Magger, O.; Waldman, Y.Y.; Ruppin, E.; Sharan, R. Enhancing the prioritization of disease-causing genes through tissue specific protein interaction networks. PLoS Comput. Biol. 2012, 8, e1002690. [Google Scholar] [CrossRef] [PubMed]
- Kohler, S.; Bauer, S.; Horn, D.; Robinson, P.N. Walking the interactome for prioritization of candidate disease genes. Am. J. Hum. Genet. 2008, 82, 949–958. [Google Scholar] [CrossRef] [PubMed]
- Jia, P.; Zheng, S.; Long, J.; Zheng, W.; Zhao, Z. DmGWAS: Dense module searching for genome-wide association studies in protein-protein interaction networks. Bioinformatics 2011, 27, 95–102. [Google Scholar] [CrossRef]
- Oughtred, R.; Stark, C.; Breitkreutz, B.J.; Rust, J.; Boucher, L.; Chang, C.; Kolas, N.; O’Donnell, L.; Leung, G.; McAdam, R.; et al. The BioGRID interaction database: 2019 update. Nucleic Acids Res. 2019, 47, D529–D541. [Google Scholar] [CrossRef]
- Orchard, S.; Ammari, M.; Aranda, B.; Breuza, L.; Briganti, L.; Broackes-Carter, F.; Campbell, N.H.; Chavali, G.; Chen, C.; del-Toro, N.; et al. The MIntAct project—IntAct as a common curation platform for 11 molecular interaction databases. Nucleic Acids Res. 2014, 42, D358–D363. [Google Scholar] [CrossRef] [PubMed]
- Szklarczyk, D.; Gable, A.L.; Lyon, D.; Junge, A.; Wyder, S.; Huerta-Cepas, J.; Simonovic, M.; Doncheva, N.T.; Morris, J.H.; Bork, P.; et al. STRING v11: Protein-protein association networks with increased coverage, supporting functional discovery in genome-wide experimental datasets. Nucleic Acids Res. 2019, 47, D607–D613. [Google Scholar] [CrossRef] [PubMed]
- Alanis-Lobato, G.; Andrade-Navarro, M.A.; Schaefer, M.H. HIPPIE v2.0: Enhancing meaningfulness and reliability of protein-protein interaction networks. Nucleic Acids Res. 2017, 45, D408–D414. [Google Scholar] [CrossRef] [PubMed]
- Keshava Prasad, T.S.; Goel, R.; Kandasamy, K.; Keerthikumar, S.; Kumar, S.; Mathivanan, S.; Telikicherla, D.; Raju, R.; Shafreen, B.; Venugopal, A.; et al. Human protein reference database—2009 update. Nucleic Acids Res. 2009, 37, D767–D772. [Google Scholar] [CrossRef] [PubMed]
- Bossi, A.; Lehner, B. Tissue specificity and the human protein interaction network. Mol. Syst. Biol. 2009, 5, 260. [Google Scholar] [CrossRef]
- Lopes, T.J.; Schaefer, M.; Shoemaker, J.; Matsuoka, Y.; Fontaine, J.F.; Neumann, G.; Andrade-Navarro, M.A.; Kawaoka, Y.; Kitano, H. Tissue-specific subnetworks and characteristics of publicly available human protein interaction databases. Bioinformatics 2011, 27, 2414–2421. [Google Scholar] [CrossRef] [Green Version]
- Kitsak, M.; Sharma, A.; Menche, J.; Guney, E.; Ghiassian, S.D.; Loscalzo, J.; Barabasi, A.L. Tissue specificity of human disease module. Sci. Rep. 2016, 6, 35241. [Google Scholar] [CrossRef]
- Guan, Y.; Gorenshteyn, D.; Burmeister, M.; Wong, A.K.; Schimenti, J.C.; Handel, M.A.; Bult, C.J.; Hibbs, M.A.; Troyanskaya, O.G. Tissue-specific functional networks for prioritizing phenotype and disease genes. PLoS Comput. Biol. 2012, 8, e1002694. [Google Scholar] [CrossRef]
- Basha, O.; Barshir, R.; Sharon, M.; Lerman, E.; Kirson, B.F.; Hekselman, I.; Yeger-Lotem, E. The TissueNet v.2 database: A quantitative view of protein-protein interactions across human tissues. Nucleic Acids Res. 2017, 45, D427–D431. [Google Scholar] [CrossRef]
- Greene, C.S.; Krishnan, A.; Wong, A.K.; Ricciotti, E.; Zelaya, R.A.; Himmelstein, D.S.; Zhang, R.; Hartmann, B.M.; Zaslavsky, E.; Sealfon, S.C.; et al. Understanding multicellular function and disease with human tissue-specific networks. Nat. Genet. 2015, 47, 569–576. [Google Scholar] [CrossRef] [Green Version]
- Kotlyar, M.; Pastrello, C.; Malik, Z.; Jurisica, I. IID 2018 update: Context-specific physical protein-protein interactions in human, model organisms and domesticated species. Nucleic Acids Res. 2019, 47, D581–D589. [Google Scholar] [CrossRef] [PubMed]
- Zhang, P. TISPIN: TIssue-Specific Protein Interaction Networks. Available online: http://bidd2.nus.edu.sg/TISPIN/ (accessed on 11 October 2019).
- Dezso, Z.; Nikolsky, Y.; Sviridov, E.; Shi, W.; Serebriyskaya, T.; Dosymbekov, D.; Bugrim, A.; Rakhmatulin, E.; Brennan, R.J.; Guryanov, A.; et al. A comprehensive functional analysis of tissue specificity of human gene expression. BMC Biol. 2008, 6, 49. [Google Scholar] [CrossRef] [PubMed]
- Pinto, J.P.; Machado, R.S.; Xavier, J.M.; Futschik, M.E. Targeting molecular networks for drug research. Front. Genet. 2014, 5, 160. [Google Scholar] [CrossRef] [PubMed] [Green Version]
- Isik, Z.; Baldow, C.; Cannistraci, C.V.; Schroeder, M. Drug target prioritization by perturbed gene expression and network information. Sci. Rep. 2015, 5, 17417. [Google Scholar] [CrossRef] [PubMed]
- Langfelder, P.; Horvath, S. WGCNA: An R package for weighted correlation network analysis. BMC Bioinf. 2008, 9, 559. [Google Scholar] [CrossRef] [PubMed]
- Needham, C.J.; Bradford, J.R.; Bulpitt, A.J.; Westhead, D.R. A primer on learning in Bayesian networks for computational biology. PLoS Comput. Biol. 2007, 3, e129. [Google Scholar] [CrossRef] [PubMed]
- Ni, Y.; Muller, P.; Wei, L.; Ji, Y. Bayesian graphical models for computational network biology. BMC Bioinf. 2018, 19, 63. [Google Scholar] [CrossRef]
- Mousavian, Z.; Kavousi, K.; Masoudi-Nejad, A. Information theory in systems biology. Part I: Gene regulatory and metabolic networks. Semin. Cell Dev. Biol. 2016, 51, 3–13. [Google Scholar] [CrossRef]
- Mousavian, Z.; Diaz, J.; Masoudi-Nejad, A. Information theory in systems biology. Part II: Protein-protein interaction and signaling networks. Semin. Cell Dev. Biol. 2016, 51, 14–23. [Google Scholar] [CrossRef]
- Cancer Genome Atlas Research Network; Weinstein, J.N.; Collisson, E.A.; Mills, G.B.; Shaw, K.R.; Ozenberger, B.A.; Ellrott, K.; Shmulevich, I.; Sander, C.; Stuart, J.M. The cancer genome atlas pan-cancer analysis project. Nat. Genet. 2013, 45, 1113–1120. [Google Scholar] [CrossRef]
- Consortium, G.T. The genotype-tissue expression (GTEx) project. Nat. Genet. 2013, 45, 580–585. [Google Scholar]
- Leinonen, R.; Sugawara, H.; Shumway, M.; International nucleotide sequence database, C. The sequence read archive. Nucleic Acids Res. 2011, 39, D19–D21. [Google Scholar] [CrossRef] [PubMed]
- Barrett, T.; Wilhite, S.E.; Ledoux, P.; Evangelista, C.; Kim, I.F.; Tomashevsky, M.; Marshall, K.A.; Phillippy, K.H.; Sherman, P.M.; Holko, M.; et al. NCBI GEO: Archive for functional genomics data sets—Update. Nucleic Acids Res. 2013, 41, D991–D995. [Google Scholar] [CrossRef] [PubMed]
- Athar, A.; Fullgrabe, A.; George, N.; Iqbal, H.; Huerta, L.; Ali, A.; Snow, C.; Fonseca, N.A.; Petryszak, R.; Papatheodorou, I.; et al. ArrayExpress update—From bulk to single-cell expression data. Nucleic Acids Res. 2019, 47, D711–D715. [Google Scholar] [CrossRef] [PubMed]
- Uhlen, M.; Fagerberg, L.; Hallstrom, B.M.; Lindskog, C.; Oksvold, P.; Mardinoglu, A.; Sivertsson, A.; Kampf, C.; Sjostedt, E.; Asplund, A.; et al. Proteomics. Tissue-based map of the human proteome. Science 2015, 347, 1260419. [Google Scholar] [CrossRef]
- Freeman, L.C. A set of measures of centrality based on betweenness. Sociometry 1977, 40, 35–41. [Google Scholar] [CrossRef]
- Holland, P.W.; Leinhardt, S. Transtivity in structural models of small groups. Small Group Res. 1971, 2, 107–124. [Google Scholar]
- Langville, A.N.; Meyer, C.D. Google’s PageRank and Beyond: The Science of Search Engine Rankings; Princeton University Press: Princeton, NJ, USA, 2006. [Google Scholar]
- Zhang, P.; Tao, L.; Zeng, X.; Qin, C.; Chen, S.; Zhu, F.; Li, Z.; Jiang, Y.; Chen, W.; Chen, Y.Z. A protein network descriptor server and its use in studying protein, disease, metabolic and drug targeted networks. Brief Bioinf. 2017, 18, 1057–1070. [Google Scholar] [CrossRef]
- Watts, D.J.; Strogatz, S.H. Collective dynamics of ‘small-world’ networks. Nature 1998, 393, 440–442. [Google Scholar] [CrossRef]
- Stelzl, U.; Worm, U.; Lalowski, M.; Haenig, C.; Birchmeier, W.; Lehrach, H.; Wanker, E.E. A human protein-protein interaction network: A resource for annotating the proteome. Cell 2005, 122, 957–968. [Google Scholar] [CrossRef]
- Newman, M.E.J. A measure of betweenness centrality based on random walks. Soc. Netw. 2003, 27. [Google Scholar] [CrossRef]
- Ozgur, A.; Vu, T.; Erkan, G.; Radev, D.R. Identifying gene-disease associations using centrality on a literature mined gene-interaction network. Bioinformatics 2008, 24, i277–i285. [Google Scholar] [CrossRef] [PubMed]
- Harrold, J.M.; Ramanathan, M.; Mager, D.E. Network-based approaches in drug discovery and early development. Clin. Pharmacol. Ther. 2013, 94, 651–658. [Google Scholar] [CrossRef] [PubMed]
- Goh, K.I.; Cusick, M.E.; Valle, D.; Childs, B.; Vidal, M.; Barabasi, A.L. The human disease network. Proc. Natl. Acad. Sci. USA 2007, 104, 8685–8690. [Google Scholar] [CrossRef] [PubMed] [Green Version]
- Brandes, U. A faster algorithm for betweenness centrality. J. Math. Sociol. 2001, 25, 163–177. [Google Scholar] [CrossRef]
- Banky, D.; Ivan, G.; Grolmusz, V. Equal opportunity for low-degree network nodes: A PageRank-based method for protein target identification in metabolic graphs. PLoS ONE 2013, 8, e54204. [Google Scholar] [CrossRef]
- Winter, C.; Kristiansen, G.; Kersting, S.; Roy, J.; Aust, D.; Knosel, T.; Rummele, P.; Jahnke, B.; Hentrich, V.; Ruckert, F.; et al. Google goes cancer: Improving outcome prediction for cancer patients by network-based ranking of marker genes. PLoS Comput. Biol. 2012, 8, e1002511. [Google Scholar] [CrossRef]
- Dong, J.; Horvath, S. Understanding network concepts in modules. BMC Syst. Biol. 2007, 1, 24. [Google Scholar] [CrossRef]
- Ma, H.W.; Zeng, A.P. The connectivity structure, giant strong component and centrality of metabolic networks. Bioinformatics 2003, 19, 1423–1430. [Google Scholar] [CrossRef] [Green Version]
- Latora, V.; Marchiori, M. Efficient behavior of small-world networks. Phys. Rev. Lett. 2001, 87, 198701. [Google Scholar] [CrossRef]
- Rubinov, M.; Sporns, O. Complex network measures of brain connectivity: Uses and interpretations. Neuroimage 2010, 52, 1059–1069. [Google Scholar] [CrossRef] [PubMed]
- Zhang, P.; Tao, L.; Zeng, X.; Qin, C.; Chen, S.Y.; Zhu, F.; Yang, S.Y.; Li, Z.R.; Chen, W.P.; Chen, Y.Z. PROFEAT update: A protein features web server with added facility to compute network descriptors for studying omics-derived networks. J. Mol. Biol. 2017, 429, 416–425. [Google Scholar] [CrossRef] [PubMed]
- Hagberg, A.A.; Schult, D.A.; Swart, P.J. Exploring Network Structure, Dynamics, and Function Using Network. In Proceedings of the 7th Python in Science Conference, Pasadena, CA, USA, 19–24 August 2018; pp. 11–15. [Google Scholar]
- Gabor Csardi, T.N. The igraph software package for complex network research. InterJ. Complex Syst. 2006, 1695, 1–9. [Google Scholar]
- Mueller, L.A.; Kugler, K.G.; Dander, A.; Graber, A.; Dehmer, M. QuACN: An R package for analyzing complex biological networks quantitatively. Bioinformatics 2011, 27, 140–141. [Google Scholar] [CrossRef] [PubMed]
- Nitsch, D.; Tranchevent, L.C.; Goncalves, J.P.; Vogt, J.K.; Madeira, S.C.; Moreau, Y. PINTA: A web server for network-based gene prioritization from expression data. Nucleic Acids Res. 2011, 39, W334–W338. [Google Scholar] [CrossRef] [PubMed]
- Lek, M.; Karczewski, K.J.; Minikel, E.V.; Samocha, K.E.; Banks, E.; Fennell, T.; O’Donnell-Luria, A.H.; Ware, J.S.; Hill, A.J.; Cummings, B.B.; et al. Exome Aggregation, C. Analysis of protein-coding genetic variation in 60,706 humans. Nature 2016, 536, 285–291. [Google Scholar] [CrossRef]
- Clarke, L.; Fairley, S.; Zheng-Bradley, X.; Streeter, I.; Perry, E.; Lowy, E.; Tasse, A.M.; Flicek, P. The international Genome sample resource (IGSR): A worldwide collection of genome variation incorporating the 1000 genomes project data. Nucleic Acids Res. 2017, 45, D854–D859. [Google Scholar] [CrossRef]
- Rentzsch, P.; Witten, D.; Cooper, G.M.; Shendure, J.; Kircher, M. CADD: Predicting the deleteriousness of variants throughout the human genome. Nucleic Acids Res. 2019, 47, D886–D894. [Google Scholar] [CrossRef]
- Adzhubei, I.A.; Schmidt, S.; Peshkin, L.; Ramensky, V.E.; Gerasimova, A.; Bork, P.; Kondrashov, A.S.; Sunyaev, S.R. A method and server for predicting damaging missense mutations. Nat. Methods 2010, 7, 248–249. [Google Scholar] [CrossRef] [Green Version]
- Zhang, P.; Bigio, B.; Rapaport, F.; Zhang, S.Y.; Casanova, J.L.; Abel, L.; Boisson, B.; Itan, Y. PopViz: A webserver for visualizing minor allele frequencies and damage prediction scores of human genetic variations. Bioinformatics 2018, 34, 4307–4309. [Google Scholar] [CrossRef]
- Erten, S.; Bebek, G.; Koyuturk, M. Vavien: An algorithm for prioritizing candidate disease genes based on topological similarity of proteins in interaction networks. J. Comput. Biol. 2011, 18, 1561–1574. [Google Scholar] [CrossRef] [PubMed]
- Vanunu, O.; Magger, O.; Ruppin, E.; Shlomi, T.; Sharan, R. Associating genes and protein complexes with disease via network propagation. PLoS Comput. Biol. 2010, 6, e1000641. [Google Scholar] [CrossRef] [PubMed]
- Newman, M.E. Modularity and community structure in networks. Proc. Natl. Acad. Sci. USA 2006, 103, 8577–8582. [Google Scholar] [CrossRef] [PubMed] [Green Version]
- Pedersen, H.K.; Gudmundsdottir, V.; Brunak, S. Pancreatic islet protein complexes and their dysregulation in type 2 diabetes. Front. Genet. 2017, 8, 43. [Google Scholar] [CrossRef]
- Nepusz, T.; Yu, H.; Paccanaro, A. Detecting overlapping protein complexes in protein-protein interaction networks. Nat. Methods 2012, 9, 471–472. [Google Scholar] [CrossRef] [PubMed]
- Calvano, S.E.; Xiao, W.; Richards, D.R.; Felciano, R.M.; Baker, H.V.; Cho, R.J.; Chen, R.O.; Brownstein, B.H.; Cobb, J.P.; Tschoeke, S.K.; et al. Host response to injury large scale: A network-based analysis of systemic inflammation in humans. Nature 2005, 437, 1032–1037. [Google Scholar] [CrossRef] [PubMed]
- Jia, P.; Wang, L.; Fanous, A.H.; Pato, C.N.; Edwards, T.L.; International Schizophrenia Community; Zhao, Z. Network-assisted investigation of combined causal signals from genome-wide association studies in schizophrenia. PLoS Comput. Biol. 2012, 8, e1002587. [Google Scholar] [CrossRef]
- Fabregat, A.; Jupe, S.; Matthews, L.; Sidiropoulos, K.; Gillespie, M.; Garapati, P.; Haw, R.; Jassal, B.; Korninger, F.; May, B.; et al. The reactome pathway knowledgebase. Nucleic Acids Res. 2018, 46, D649–D655. [Google Scholar] [CrossRef]
- Kanehisa, M.; Furumichi, M.; Tanabe, M.; Sato, Y.; Morishima, K. KEGG: New perspectives on genomes, pathways, diseases and drugs. Nucleic Acids Res. 2017, 45, D353–D361. [Google Scholar] [CrossRef]
- The Gene Ontology Community. The gene ontology resource: 20 years and still going strong. Nucleic Acids Res. 2019, 47, D330–D338. [Google Scholar] [CrossRef]
- Encode Project Consortium. An integrated encyclopedia of DNA elements in the human genome. Nature 2012, 489, 57–74. [Google Scholar] [CrossRef] [PubMed]
- Lizio, M.; Harshbarger, J.; Abugessaisa, I.; Noguchi, S.; Kondo, A.; Severin, J.; Mungall, C.; Arenillas, D.; Mathelier, A.; Medvedeva, Y.A.; et al. Update of the FANTOM web resource: High resolution transcriptome of diverse cell types in mammals. Nucleic Acids Res. 2017, 45, D737–D743. [Google Scholar] [CrossRef] [PubMed]
- Kohler, S.; Vasilevsky, N.A.; Engelstad, M.; Foster, E.; McMurry, J.; Ayme, S.; Baynam, G.; Bello, S.M.; Boerkoel, C.F.; Boycott, K.M.; et al. The human phenotype ontology in 2017. Nucleic Acids Res. 2017, 45, D865–D876. [Google Scholar] [CrossRef]
- Amberger, J.S.; Bocchini, C.A.; Schiettecatte, F.; Scott, A.F.; Hamosh, A. OMIM.org: Online mendelian inheritance in man (OMIM(R)), an online catalog of human genes and genetic disorders. Nucleic Acids Res. 2015, 43, D789–D798. [Google Scholar] [CrossRef] [PubMed]
- Rath, A.; Olry, A.; Dhombres, F.; Brandt, M.M.; Urbero, B.; Ayme, S. Representation of rare diseases in health information systems: The Orphanet approach to serve a wide range of end users. Hum. Mutat. 2012, 33, 803–808. [Google Scholar] [CrossRef]
- Rubinstein, W.S.; Maglott, D.R.; Lee, J.M.; Kattman, B.L.; Malheiro, A.J.; Ovetsky, M.; Hem, V.; Gorelenkov, V.; Song, G.; Wallin, C.; et al. The NIH genetic testing registry: A new, centralized database of genetic tests to enable access to comprehensive information and improve transparency. Nucleic Acids Res. 2013, 41, D925–D935. [Google Scholar] [CrossRef]
- Yang, H.; Robinson, P.N.; Wang, K. Phenolyzer: Phenotype-based prioritization of candidate genes for human diseases. Nat. Methods 2015, 12, 841–843. [Google Scholar] [CrossRef]
- Li, Y.H.; Yu, C.Y.; Li, X.X.; Zhang, P.; Tang, J.; Yang, Q.; Fu, T.; Zhang, X.; Cui, X.; Tu, G.; et al. Therapeutic target database update 2018: Enriched resource for facilitating bench-to-clinic research of targeted therapeutics. Nucleic Acids Res. 2018, 46, D1121–D1127. [Google Scholar]
- Wishart, D.S.; Feunang, Y.D.; Guo, A.C.; Lo, E.J.; Marcu, A.; Grant, J.R.; Sajed, T.; Johnson, D.; Li, C.; Sayeeda, Z.; et al. DrugBank 5.0: A major update to the DrugBank database for 2018. Nucleic Acids Res. 2018, 46, D1074–D1082. [Google Scholar] [CrossRef]
- Okada, Y.; Wu, D.; Trynka, G.; Raj, T.; Terao, C.; Ikari, K.; Kochi, Y.; Ohmura, K.; Suzuki, A.; Yoshida, S.; et al. Genetics of rheumatoid arthritis contributes to biology and drug discovery. Nature 2014, 506, 376–381. [Google Scholar] [CrossRef]
- Lin, J.R.; Zhang, Q.; Cai, Y.; Morrow, B.E.; Zhang, Z.D. Integrated rare variant-based risk gene prioritization in disease case-control sequencing studies. PLoS Genet. 2017, 13, e1007142. [Google Scholar] [CrossRef] [PubMed]
- Smith, C.M.; Hayamizu, T.F.; Finger, J.H.; Bello, S.M.; McCright, I.J.; Xu, J.; Baldarelli, R.M.; Beal, J.S.; Campbell, J.; Corbani, L.E.; et al. The mouse gene expression database (GXD): 2019 update. Nucleic Acids Res. 2019, 47, D774–D779. [Google Scholar] [CrossRef] [PubMed]
- Bult, C.J.; Blake, J.A.; Smith, C.L.; Kadin, J.A.; Richardson, J.E. Mouse Genome Database (MGD) 2019. Nucleic Acids Res. 2019, 47, D801–D806. [Google Scholar] [CrossRef] [PubMed]
- Shannon, P.; Markiel, A.; Ozier, O.; Baliga, N.; Wang, J.; Ramage, D.; Amin, N.; Schwikowski, B.; Ideker, T. Cytoscape: A software environment for integrated models of biomolecular interaction networks. Genome Res. 2003, 13, 2498–2504. [Google Scholar] [CrossRef]
- Bastian, M.; Heymann, S.; Jacomy, M. Gephi: An Open Source Software for Exploring and Manipulating Networks. In Proceedings of the 3rd International AAAI Conference on Weblogs and Social Media, San Jose, CA, USA, 17–20 May 2009. [Google Scholar]
- Djebbari, A.; Ali, M.; Otasek, D.; Kotlyar, M.; Fortney, K.; Wong, S.; Hrvojic, A.; Jurisica, I. NAViGaTOR: Large scalable and interactive navigation and analysis of large graphs. Internet Math. 2011, 7, 314–347. [Google Scholar] [CrossRef]
- Wu, J.; Vallenius, T.; Ovaska, K.; Westermarck, J.; Makela, T.P.; Hautaniemi, S. Integrated network analysis platform for protein-protein interactions. Nat. Methods 2009, 6, 75–77. [Google Scholar] [CrossRef]
- Reimand, J.; Tooming, L.; Peterson, H.; Adler, P.; Vilo, J. GraphWeb: Mining heterogeneous biological networks for gene modules with functional significance. Nucleic Acids Res. 2008, 36, W452–W459. [Google Scholar] [CrossRef]
- Genetic and Rare Disease Information Center (GARD). About Rare Diseases. Available online: https://rarediseases.info.nih.gov/diseases/pages/31/faqs-about-rare-diseases (accessed on 11 October 2019).
- Zhao, M.; Wei, D.Q. Rare diseases: Drug discovery and informatics resource. Interdiscip. Sci. 2018, 10, 195–204. [Google Scholar] [CrossRef]
- Stevens, A.; Cosgrove, K.E.; Padidela, R.; Skae, M.S.; Clayton, P.E.; Banerjee, I.; Dunne, M.J. Can network biology unravel the aetiology of congenital hyperinsulinism? Orphanet J. Rare Dis. 2013, 8, 21. [Google Scholar] [CrossRef]
- Taroni, J.N.; Greene, C.S.; Martyanov, V.; Wood, T.A.; Christmann, R.B.; Farber, H.W.; Lafyatis, R.A.; Denton, C.P.; Hinchcliff, M.E.; Pioli, P.A.; et al. A novel multi-network approach reveals tissue-specific cellular modulators of fibrosis in systemic sclerosis. Genome Med. 2017, 9, 27. [Google Scholar] [CrossRef]
- Itan, Y.; Zhang, S.Y.; Vogt, G.; Abhyankar, A.; Herman, M.; Nitschke, P.; Fried, D.; Quintana-Murci, L.; Abel, L.; Casanova, J.L. The human gene connectome as a map of short cuts for morbid allele discovery. Proc. Natl. Acad. Sci. USA 2013, 110, 5558–5563. [Google Scholar] [CrossRef] [PubMed] [Green Version]
- Zhu, C.; Kushwaha, A.; Berman, K.; Jegga, A.G. A vertex similarity-based framework to discover and rank orphan disease-related genes. BMC Syst. Biol. 2012, 6, S8. [Google Scholar] [CrossRef] [PubMed]
- Liu, X.; Yang, Z.; Lin, H.; Simmons, M.; Lu, Z. DIGNiFI: Discovering causative genes for orphan diseases using protein-protein interaction networks. BMC Syst. Biol. 2017, 11, 23. [Google Scholar] [CrossRef] [PubMed]
- James, C.; Kapoor, R.R.; Ismail, D.; Hussain, K. The genetic basis of congenital hyperinsulinism. J. Med. Genet. 2009, 46, 289–299. [Google Scholar] [CrossRef]
- Xu, A.; Cheng, J.; Sheng, H.; Wen, Z.; Lin, Y.; Zhou, Z.; Zeng, C.; Shao, Y.; Li, C.; Liu, L.; et al. Clinical management and gene mutation analysis of children with congenital hyperinsulinism in South China. J. Clin. Res. Pediatr. Endocrinol. 2019. [Google Scholar] [CrossRef]
- Horvath, S.; Dong, J. Geometric interpretation of gene coexpression network analysis. PLoS Comput. Biol. 2008, 4, e1000117. [Google Scholar] [CrossRef]
- Mahoney, J.M.; Taroni, J.; Martyanov, V.; Wood, T.A.; Greene, C.S.; Pioli, P.A.; Hinchcliff, M.E.; Whitfield, M.L. Systems level analysis of systemic sclerosis shows a network of immune and profibrotic pathways connected with genetic polymorphisms. PLoS Comput. Biol. 2015, 11, e1004005. [Google Scholar] [CrossRef]
- Zhang, S.Y.; Jouanguy, E.; Ugolini, S.; Smahi, A.; Elain, G.; Romero, P.; Segal, D.; Sancho-Shimizu, V.; Lorenzo, L.; Puel, A.; et al. TLR3 deficiency in patients with herpes simplex encephalitis. Science 2007, 317, 1522–1527. [Google Scholar] [CrossRef]
- Alcais, A.; Quintana-Murci, L.; Thaler, D.S.; Schurr, E.; Abel, L.; Casanova, J.L. Life-threatening infectious diseases of childhood: Single-gene inborn errors of immunity? Ann. N. Y. Acad. Sci. 2010, 1214, 18–33. [Google Scholar] [CrossRef]
- Sancho-Shimizu, V.; Perez de Diego, R.; Jouanguy, E.; Zhang, S.Y.; Casanova, J.L. Inborn errors of anti-viral interferon immunity in humans. Curr. Opin. Virol. 2011, 1, 487–496. [Google Scholar] [CrossRef] [Green Version]
- Casrouge, A.; Zhang, S.Y.; Eidenschenk, C.; Jouanguy, E.; Puel, A.; Yang, K.; Alcais, A.; Picard, C.; Mahfoufi, N.; Nicolas, N.; et al. Herpes simplex virus encephalitis in human UNC-93B deficiency. Science 2006, 314, 308–312. [Google Scholar] [CrossRef] [PubMed]
- Itan, Y.; Casanova, J.L. Novel primary immunodeficiency candidate genes predicted by the human gene connectome. Front. Immunol. 2015, 6, 142. [Google Scholar] [CrossRef] [PubMed]
- Alfarano, C.; Andrade, C.E.; Anthony, K.; Bahroos, N.; Bajec, M.; Bantoft, K.; Betel, D.; Bobechko, B.; Boutilier, K.; Burgess, E.; et al. The biomolecular interaction network database and related tools 2005 update. Nucleic Acids Res. 2005, 33, D418–D424. [Google Scholar] [CrossRef] [PubMed]
- Rual, J.F.; Venkatesan, K.; Hao, T.; Hirozane-Kishikawa, T.; Dricot, A.; Li, N.; Berriz, G.F.; Gibbons, F.D.; Dreze, M.; Ayivi-Guedehoussou, N.; et al. Towards a proteome-scale map of the human protein-protein interaction network. Nature 2005, 437, 1173–1178. [Google Scholar] [CrossRef] [PubMed]
- Ramani, A.K.; Bunescu, R.C.; Mooney, R.J.; Marcotte, E.M. Consolidating the set of known human protein-protein interactions in preparation for large-scale mapping of the human interactome. Genome Biol. 2005, 6, R40. [Google Scholar] [CrossRef] [PubMed]
- Hu, J.X.; Thomas, C.E.; Brunak, S. Network biology concepts in complex disease comorbidities. Nat. Rev. Genet. 2016, 17, 615–629. [Google Scholar] [CrossRef]
- Yan, J.; Risacher, S.L.; Shen, L.; Saykin, A.J. Network approaches to systems biology analysis of complex disease: Integrative methods for multi-omics data. Brief. Bioinf. 2018, 19, 1370–1381. [Google Scholar] [CrossRef]
- Cho, D.Y.; Kim, Y.A.; Przytycka, T.M. Chapter 5: Network biology approach to complex diseases. PLoS Comput. Biol. 2012, 8, e1002820. [Google Scholar] [CrossRef]

| Global PPI databases | ||||
| Database | Type of Interaction | Number of Interactions | Number of Genes/Proteins | |
| BioGRID [10] | Physical | 371,513 | 23,795 | |
| IntAct [11] | Physical | 379,393 | 25,643 | |
| STRING [12] | Physical, association, text-mining | 11,759,455 | 19,567 | |
| HIPPE [13] | Physical | 273,900 | 17,000 | |
| HPRD [14] | Physical | 41,327 | 30,047 | |
| Tissue/cell-type-specific PPI databases | ||||
| Database | Type of Interaction | Number of Tissues/Cell-Types | Number of Interactions | Number of Genes/Proteins |
| TissueNet [19] | Physical | 40 | 243,706 | 17,283 |
| GIANT [20] | Physical, co-expression | 144 | n.a. | n.a. |
| IID [21] | Physical, predicted | 26 | 975,877 | 19,250 |
| TISPIN [22] | Physical | 53 | 128,579 | 13,123 |
| Level | Topological Property | Computational Equation | Graph Theory Explanation | Biological Implication |
|---|---|---|---|---|
| Local | Clustering coefficient [41] | , degi is the number of interacting partners of a node, and ei is the number of links among all neighbors of a given node. | Measures the tendency of a node to form a group with the neighboring nodes. | Used to analyze the organizational properties of human protein networks [42], and to validate the association of a drug with existing proteins in the drug-target network [6]. |
| Local | Closeness centrality [43] | , Dij is the shortest path length from node i to j, and N is the number of nodes in the network. | Measures how fast information can spread from a given gene to the other reachable genes. | These centralities have been used to prioritize disease candidate genes [44], identify important genes in drug discovery [45], and shed light on disease-disease relationships [46]. |
| Local | Betweenness centrality [47] | , σst(i) is the number of shortest paths from s to t passing through gene i, and σst is the number of shortest paths from s to t. | Indicates the number of times a given node serves as a linking bridge on the shortest path between any other two nodes. | |
| Local | PageRank centrality [39] | Initializes each node’s centrality to an equal probability value 1/N, then iteratively updates each node’s centrality by a damping factor d, the number of neighbors, and the neighbors’ centrality. It stops when PageRank centrality converges. | Gauges the importance of a given node by considering both the number of connections of the nodes, and the importance of the connected nodes. | PageRank centrality has been used to identify protein targets in metabolic networks [48], and candidate marker genes for prognosis prediction in patients with pancreatic cancer [49]. |
| Global | Connectivity centralization [50] | , E is the number of edges in the network. | Distinguishes highly connected networks or decentralized networks. | Used in studies of the structural differences between metabolic networks [51]. |
| Global | Heterogeneity [50] | . | Measures the variation of the connectivity distribution. | Reflects the tendency of a network to have hub genes [50]. |
| Global | Global efficiency [52] | Represents the information exchange efficiency across the entire network or a defined subnetwork. | Used to describe the brain neuro-connectivity [53]. |
| Application/Method | Source of Network | Algorithm | Results |
|---|---|---|---|
| Congenital hyperinsulinism [94] | PPI network (BioGRID) | Graph-partitioning for subnetwork identification. | Identified the nine known disease-causing genes that are functionally diverse and clustered together in a core subnetwork. |
| Systemic sclerosis [95] | Gene co-expression network | Consensus clustering and differential network analysis for subnetwork identification. | Identified common pathogenic signature in four tissues of systemic sclerosis patients, and identified a distinct disease process in the lung. |
| HGC [96] | Gene association network (STRING) | Shortest path distance, distance distribution, and statistical significance. | Identified 20 of the 21 known disease-causing genes of herpes simplex virus encephalitis, and further used to identify the disease-causing genes of primary immunodeficiency diseases, which were experimentally validated. |
| Vertex Similarity [97] | PPI network (3 papers, HPRD, BIND, Reactome) | Pairwise similarity by an edge-weighted and neighbor-considered equation for connected nodes, or a shortest-path-based equation for disconnected nodes. | Developed the Vertex Similarity method to identify and rank orphan disease candidate genes of 172 rare diseases based on the known disease-causing genes in the protein interaction network. |
| DIGNiFI [98] | PPI network (HPRD) | Pairwise similarity by measuring local direct neighbor connectivity, and global network feature by a random walk algorithm. | Developed DIGNiFI method to discover causative genes in orphan diseases of 128 rare diseases, and suggested the use of GO terms and protein domains to refine PPI networks. |
© 2019 by the authors. Licensee MDPI, Basel, Switzerland. This article is an open access article distributed under the terms and conditions of the Creative Commons Attribution (CC BY) license (http://creativecommons.org/licenses/by/4.0/).
Share and Cite
Zhang, P.; Itan, Y. Biological Network Approaches and Applications in Rare Disease Studies. Genes 2019, 10, 797. https://doi.org/10.3390/genes10100797
Zhang P, Itan Y. Biological Network Approaches and Applications in Rare Disease Studies. Genes. 2019; 10(10):797. https://doi.org/10.3390/genes10100797
Chicago/Turabian StyleZhang, Peng, and Yuval Itan. 2019. "Biological Network Approaches and Applications in Rare Disease Studies" Genes 10, no. 10: 797. https://doi.org/10.3390/genes10100797
APA StyleZhang, P., & Itan, Y. (2019). Biological Network Approaches and Applications in Rare Disease Studies. Genes, 10(10), 797. https://doi.org/10.3390/genes10100797