Review

Transcriptional Networks of Microglia in Alzheimer’s Disease and Insights into Pathogenesis

Programme in Cardiovascular and Metabolic Disorders, Duke-NUS Medical School, 8 College Road, 69857 Singapore, Singapore
*
Author to whom correspondence should be addressed.
Genes 2019, 10(10), 798; https://doi.org/10.3390/genes10100798
Submission received: 30 August 2019 / Revised: 30 September 2019 / Accepted: 11 October 2019 / Published: 12 October 2019
(This article belongs to the Special Issue Current Advances in Network Biology for Disease Understanding)

Abstract

:
Microglia, the main immune cells of the central nervous system, are increasingly implicated in Alzheimer’s disease (AD). Manifold transcriptomic studies in the brain have not only highlighted microglia’s role in AD pathogenesis, but also mapped crucial pathological processes and identified new therapeutic targets. An important component of many of these transcriptomic studies is the investigation of gene expression networks in AD brain, which has provided important new insights into how coordinated gene regulatory programs in microglia (and other cell types) underlie AD pathogenesis. Given the rapid technological advancements in transcriptional profiling, spanning from microarrays to single-cell RNA sequencing (scRNA-seq), tools used for mapping gene expression networks have evolved to keep pace with the unique features of each transcriptomic platform. In this article, we review the trajectory of transcriptomic network analyses in AD from brain to microglia, highlighting the corresponding methodological developments. Lastly, we discuss examples of how transcriptional network analysis provides new insights into AD mechanisms and pathogenesis.

1. Introduction: The Role of Microglia in Alzheimer’s Disease

Alzheimer’s disease (AD) is a devastating neurodegenerative disease associated with cognitive decline, memory deficits, and loss of executive function while accounting for 50% to 75% of dementia cases [1]. It is increasingly prevalent and typified by the accumulation of extracellular amyloid structures and intracellular tau fibrils [2,3]. Neuropathologically, AD is associated with accumulation of amyloid structures starting in the neocortex before spreading to the allocortex and eventually the cerebellum [4]. Despite having known pathological correlates, AD is a complex multifactorial disease influenced by cardiovascular risk factors [5] and biopsychosocial variables such as education attainment [6], socio-economic status [7], and level of physical activity [8,9]. Nevertheless, a majority of basic research, translational, and clinical efforts hinge on the amyloid cascade hypothesis [10,11] which posits that amyloid build-up in vulnerable brain regions triggers a wave of downstream molecular events, ultimately leading to the manifestation of AD symptoms. Such events include the recruitment of microglia, further seeding of amyloid, neurofibrillary accumulation, and neuronal loss [12]. Therefore, withholding the amyloid cascade is widely adopted as a pharmaceutical strategy [3]. Unsurprisingly, microglia, the main phagocytes of the central nervous system (CNS) [13], have been intensively studied in the context of AD pathogenesis [14,15,16,17].
Microglia are the immune sentinels of the CNS, and they maintain homeostasis by clearing debris, pruning synapses, and interacting with other brain cell types [13]. In addition to AD, microglia’s neuroinflammatory role has been implicated in Parkinson’s disease [18], multiple sclerosis [19], and stroke [20]. However, the specific role of microglia in AD pathogenesis remains to be mechanistically resolved [21]. On one hand, microglia phagocytose amyloid and protect neurons from amyloid toxicity [18,22]. On the other, they release pro-inflammatory mediators which cause neuronal damage [23] and can potentially exacerbate inflammation by interacting with other cell types [24]. The latter could depend on the chronicity of inflammation [25]. During acute inflammation instigated by amyloid build-up, microglia serve a beneficial role by surrounding neurons and limiting neuronal exposure to amyloid [18,22]. Normally, acute inflammation is followed by a resolution phase through microglia’s anti-inflammatory action [26]. In AD, amyloid build-up remains, resulting in continuous insult to the brain parenchyma [26]. This chronic inflammation driven by microglia’s release of cytokines and reactive oxygen species (ROS) causes loss of synapses through dysfunctional microglia pruning [27]. Inflammation can also be modulated by age and, compared to young brains, old brains have leaky blood–brain barrier (BBB) which allow infiltration of pro-inflammatory monocytes [26]. In old brains, there is also a higher number of activated microglia due to chronic inflammation, further supporting that age is a major risk factor for AD [26]. In addition, Cribbs et al. found that immune-related genes are dysregulated with aging and AD [28], while co-culturing old microglia with media from young microglia has been found to be potentially sufficient for re-establishing normal microglia proliferation and function [29].
Microglia’s role in AD pathogenesis is highly complex and most likely depends on contextual factors such as disease chronicity of inflammation [25], cognitive reserve [30,31], and presence of comorbidities [26,27]. Despite this complexity, there are clear genetic and molecular underpinnings for microglia’s key role in AD. For example, the Triggering Receptor Expressed on Myeloid Cells 2 (TREM2) gene has been identified as a key player for microglia function in AD pathology [32,33,34], where TREM2 loss of function is associated with increased amyloid burden [35] and exacerbated neuronal loss [36]. Genome-Wide Association Studies (GWAS) for late-onset Alzheimer’s disease (LOAD) identified the TREM2 missense variant R47H [37,38,39], which was also associated with impaired microglia function [40,41]. Apolipoprotein E (APOE), which is the most common AD risk gene, is also related to increased immune cell activation [26]. In particular, the gene isoform associated with the greatest AD risk, APOE4, is associated with greater inflammation in response to a pro-inflammatory stimulus [42]. Significantly, the genetic/functional interaction between APOE and TREM2 genes is needed for microglia to switch from a “homeostatic” state to a “neurodegenerative” state [26]. A role for gene–gene interactions in AD is further supported by Tansey et al. who found that genetic risk for AD is enriched in microglia gene networks, i.e., multiple interacting genes in microglia [43]. In particular, DNA binding motifs for SPI1 and MEF2, which are both important regulators of microglia function, are associated with several AD risk genes that interact within a complex gene network [43]. Therefore, gene network analysis of microglia in homeostasis and disease has been proposed to clarify the functional role and specific contribution of multiple gene targets to AD pathogenesis.

2. Transcriptomic Networks to Understand Functional Gene-Gene Interactions in AD

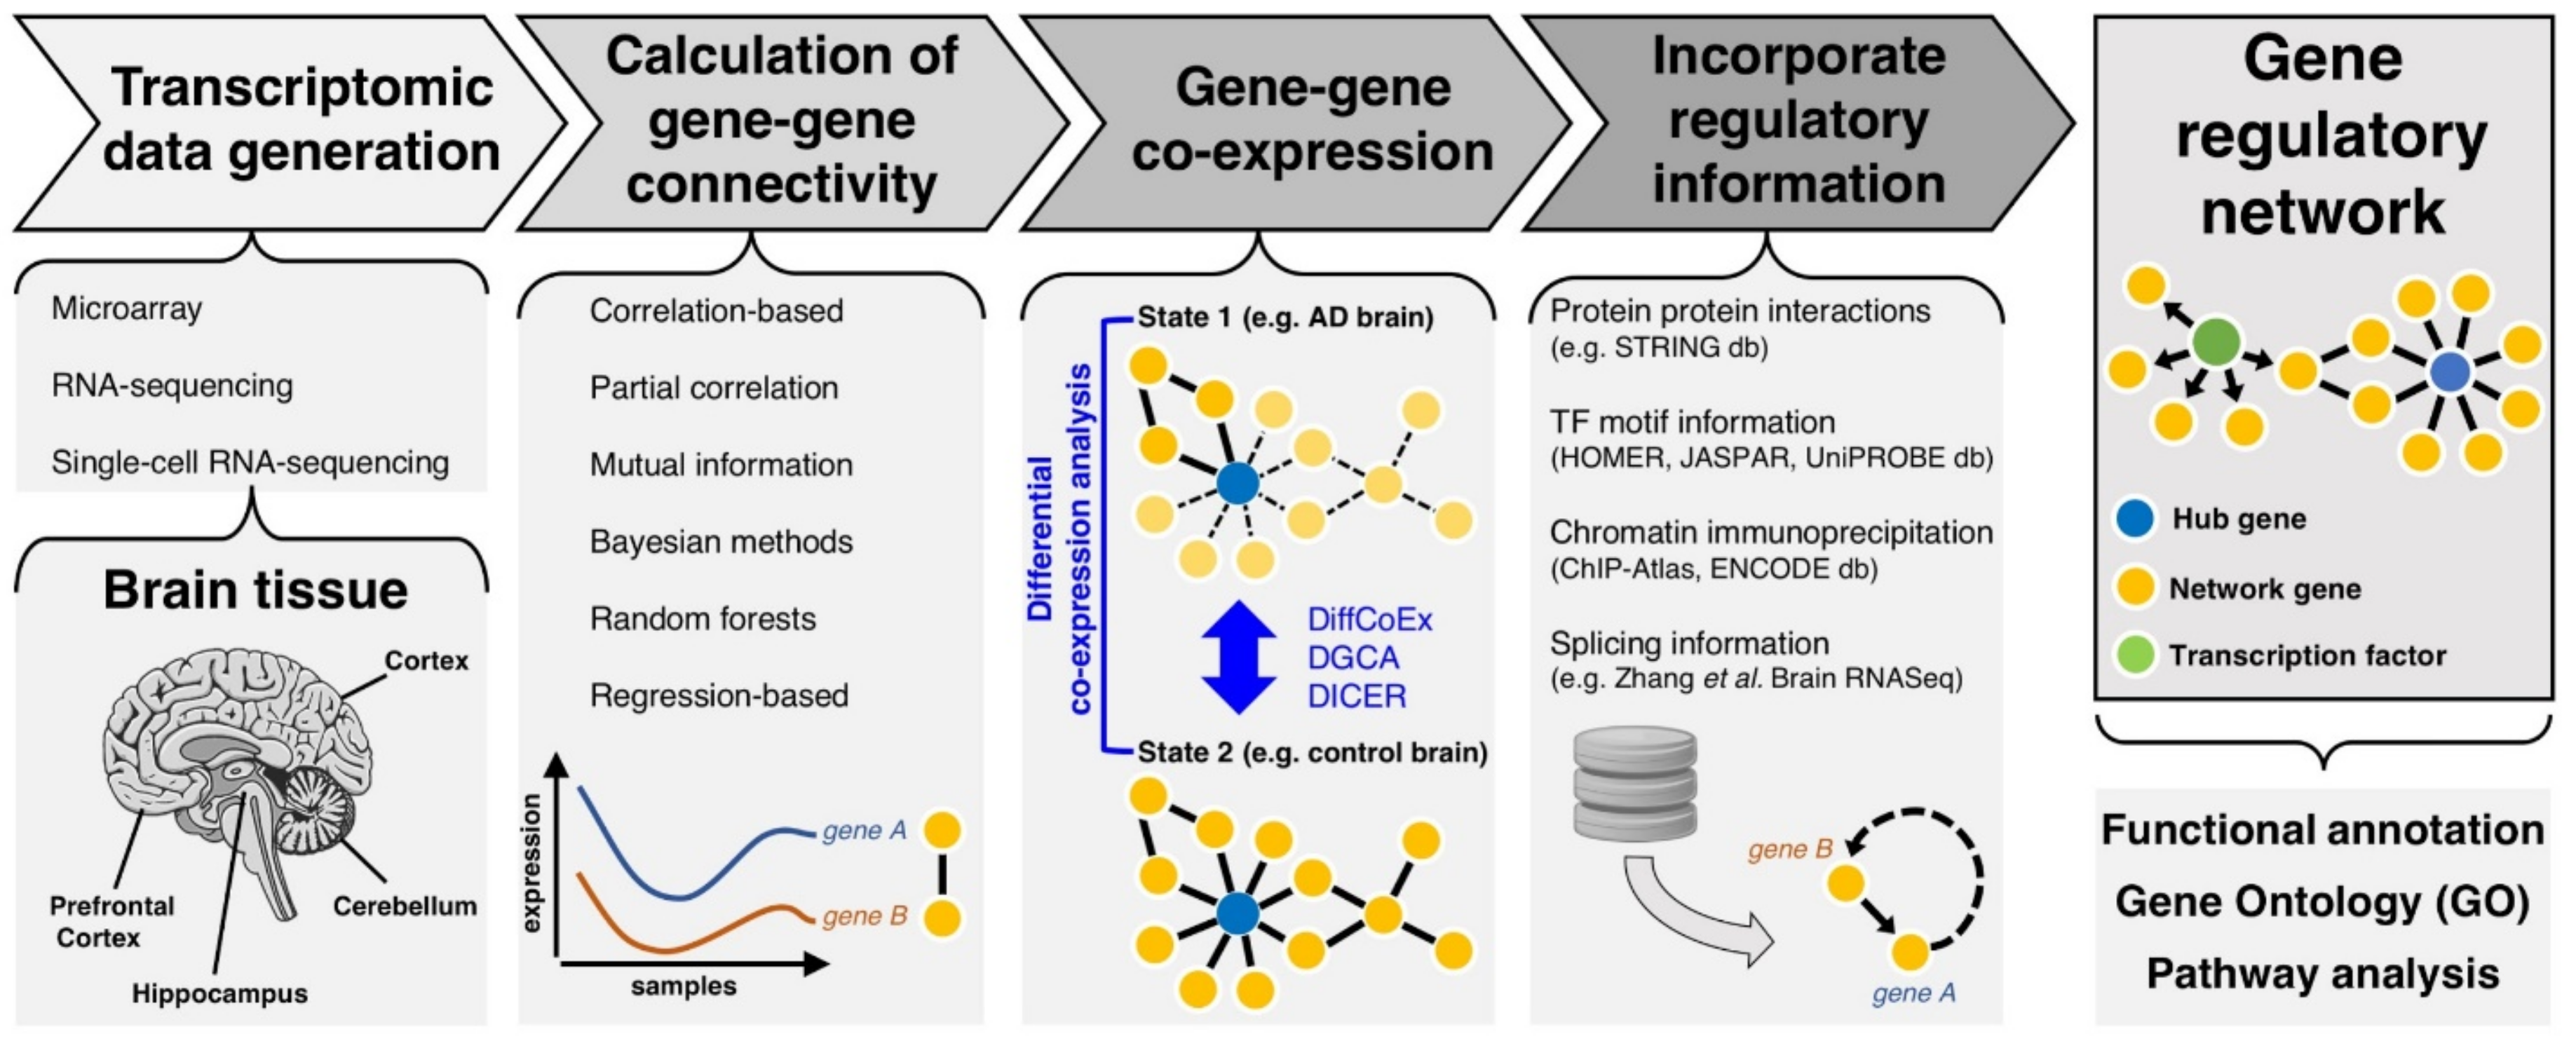
2.1. Primers of Transcriptional Gene Networks

In its essence, network biology provides a means to describe a biological process as the complex interplay between underlying cellular events at different levels, including (but not limited to) genomics, transcriptomic, and proteomic. This kind of description offers several advantages over reductionist approaches. First, it allows us to integrate at the systems-level the high-content “-omics” data, which are now increasingly accessible to the scientific community, to provide high-level mechanistic understanding of genotype-phenotype relationships in disease [44]. Second, network biology provides a platform for not only “describing” a phenomenon, which traditional molecular biology does well, but also “predicting” (and sometimes quantifying) systems-wise outcomes resulting from different perturbations, e.g., genetic mutations and inflammatory insult [44]. In the context of transcriptional data, analysis of gene networks not only identifies concurrently expressed (or co-expressed) genes (i.e., a gene co-expression network), but can also aid the biological interpretation of apparently disconnected genes dysregulated in disease, which are typically detected as differentially expressed (DE) between disease and control samples. Individual DE genes can form a coherent gene network, which can be functionally annotated (e.g., using Gene Ontology (GO), http://geneontology.org/) to inform specific biological processes and molecular pathways dysregulated in disease.
Generally speaking, a gene network consists of a graph representation of genes (represented as nodes) and their functional interactions (represented as edges). However, it is important to distinguish a gene network from a gene “signature” (also referred to as transcriptional signature). A gene signature refers to a combined group of genes with a characteristic pattern of gene expression in a cell/tissue—for example a set of dysregulated genes (e.g., identified by differential expression analysis between disease and healthy states). In contrast, a network describes a set of interconnected genes (which may or may not be DE) alongside their functional interaction by means of some measure of gene–gene connectivity. This gene–gene connectivity can be quantified in a population sample based on different approaches (Figure 1), for example these include correlation analysis, mutual information (MI) [45,46,47], Bayesian methods [48], random forest [49], and regression-based methods [50]. The relative advantages and disadvantages of each approach are reviewed elsewhere [51,52].
In transcriptomic network analysis, the gene–gene connectivity is typically quantified as gene co-expression. Specifically, co-expression quantifies the extent to which two genes are expressed (or silenced) together in a given context (e.g., tissue, disease, during development or in response to molecular/environmental perturbation). In its more simple assessment, gene co-expression can be calculated using either Pearson or Spearman correlation of the genes’ expression profile in the population sample (e.g., in a cohort of AD patient brains). Therefore, correlation-based co-expression networks (also known as “relevance networks”) result in undirected network graphs, which simply represent gene–gene connections and where the specific action (activation or repression) of a gene on another is not assessed and represented in the network [53]. A related but distinct approach used to assess gene co-expression is Graphical Gaussian Models (GGMs). GGMs employ partial correlations, which measure the extent of linearity between two genes’ expression profiles in the context when the variability attributed to a third gene(s) expression profile is removed [54]. Briefly, GGMs are constructed by estimation of the inverse covariance matrix [55], which describes the “conditional dependence” between every two gene expression profiles. This enables the identification of direct gene–gene relationships or “conditional independence networks”, which have been found to reflect better biological network structures compared to “relevance networks” [56]. In the next section, we will elaborate on co-expression network analysis in disease and review gene networks studies in AD, mentioning a few seminal studies based on gene signature analysis.

2.2. From Gene Co-Expression to Regulatory Networks in Disease

In the context of transcriptional gene network analysis, it is also important to distinguish “co-expression” from “co-regulation” because co-expressed genes are neither co-regulated nor necessarily share the same regulatory mechanism. For example, using over 600 microarray experiments on S. cerevisiae, Allocco et al. showed that the correlation (r) between any two genes’ expression profile must be over r = 0.84 in order to have a 50% chance of sharing the same regulation by a given transcription factor [57]. Thus, beyond identifying strong correlation between genes’ expression profiles, construction of co-regulation networks requires incorporation of additional regulatory information, which can be provided, for instance, by transcription factor (TF) binding analysis either using in silico databases [58], or including splicing information [59] or chromatin immunoprecipitation (ChIP) data [60]. For example, Ding et al. incorporated protein interactions and TF binding motif data to construct gene regulatory networks, identifying ATF1 (Activating Transcription Factor 1), which regulates microglia anti-inflammatory action in AD through the cell surface marker CXCR4 [61,62]. To infer gene co-regulation networks, Vargas et al. employed Algorithm for the Reconstruction of Accurate Cellular Networks (ARACNE), which not only infers gene networks but also identifies targets of transcription factors [63,64]. Rather than using correlation-based metrics, ARACNE utilizes MI which informs on how much information one variable (e.g., gene expression profile) carries with regards to another variable [63]. Specifically, MI might be advantageous in network inference over correlation-based metrics because it does not assume linear interactions and indeed can capture nonlinear relationships between genes [45], and it is less influenced by experimental errors [65].
Another important nuance is that gene co-expression alone does not necessarily capture changes in the pathological process, highlighting the utility of differential co-expression analysis in disease. Generally speaking, differential co-expression identifies discrete gene sets whose co-expression patterns vary (or are altered) across conditions, e.g., between disease and healthy states. There are three levels of differential co-expression analysis, which relate to changes to the network topology, gene module, and specific gene-pairs [66]. Network topology embraces key global measures of the network structure, such as the node degree distribution, network clustering coefficient, and average path length [66]. For example, the node degree distribution is the number of edges attached to a node, reflecting a node’s degree of connectivity [66]. Gene modules refers to coherent sets of genes, typically detected to be co-expressed through clustering the genes’ expression profile and then applying some thresholding procedure (for instance, thresholding the whole gene expression correlation matrix to extract smaller gene modules therein). Lastly, gene-pair level analysis zoom into specific gene–gene relationship and corresponding molecular mechanism, e.g., TF and its target genes. Practically, for each level previously described, differential co-expression accounts for (and test) two possible scenarios: (i) Genes are similarly co-expressed but DE between disease and healthy states, (ii) genes are differentially co-expressed but not DE between disease and healthy states. One commonly used approach for the module level analysis, DiffCoEx, for example, measures both intra-module and inter-module differential co-expression [67], while DICER incorporates a probabilistic score for identification of differentially co-expressed gene modules in case-control gene expression data [68].
These approaches for differential co-expression analysis can allow the identification of gene networks or gene modules that are perturbed in disease (Figure 1). For example, Wang and Liu [69] performed differential co-expression analysis in 6 brain regions—entorhinal cortex, hippocampus, medial temporal gyrus, posterior cingulate cortex, superior frontal gyrus, and primary visual cortex, identifying a gene cluster with NPIPA1 (Nuclear pore complex-interacting protein family member A1) as a “hub gene”. A “hub gene” is a central node in the network with a significantly higher number of connected edges compared to other nodes [70]. Biologically, a “hub gene” could represent a TF or a key signaling molecule with many downstream regulated genes. Similarly, Meng and Mei performed differential co-expression analysis on 1,667 human brain samples to uncover a core network of 97 dysregulated genes in AD, including transcription factors FLI1, NOTCH2, and STAT3 [71]. Notably, FLI1 is known to interact with RUNX1, which is a master regulator for an age-dependent microglia gene co-expression module [72], while NOTCH2 and STAT3 are both involved in microglia activation [73,74]. Therefore, differential co-expression in the brain can unmask gene networks and key “hub genes” therein, such as TFs, which are not only associated with the disease state but also perturbed along the AD trajectory.

3. Advancements in Transcriptomics and Gene Network Analysis

3.1. Assessing the Transcriptome

The central dogma of molecular genetics posits that RNA serves a messenger role between DNA sequence and protein function/activity, describing the flow of biological information encoded in the DNA from the nucleus to the cytoplasm and/or extracellular space through transcription. Therefore, transcript information (i.e., transcript relative abundance, dysregulation, and localization) can be used to inform cellular processes, feedback mechanisms to external stimuli, and pathological changes, providing insights into the biological state of the cell or tissue sample. Transcriptomic studies of multiple transcripts started with Sanger sequencing techniques such as expressed sequence tags (ESTs) and serial and cap analysis of gene expression (SAGE/CAGE) [75]. In 1995, the novel combination of sequencing, nanofabrication, and fluorescent tagging, gave way to develop the first microarray chip which utilize probes for the corresponding nucleotide sequences, subsequent hybridization, and measurement of fluorescence, which enabled the quantification of gene expression for thousands of genes simultaneously [75,76]. Subsequently, development of higher throughput sequencing methods, namely massive parallel sequencing, also known as deep sequencing or Next Generation Sequencing (NGS), set the stage for RNA-sequencing (RNA-seq), which are able to capture multiple transcripts concurrently without the use of pre-defined reference probes [75].

3.2. Microarray-Based Network Analyses in AD

Despite important limitations, such as low dynamic range, and need for a priori knowledge of reference transcript sequences [75], microarrays can provide useful transcriptomic information in AD. In 2004, Blalock et al. studied hippocampal gene expression using 31 separate microarrays for each patient’s tissue sample [77]. This adequately powered study leveraged correlation-based gene network analysis to identify cell growth, differentiation, and tumor suppressors processes to be dysregulated in early AD pathogenesis. Several microarray-based studies have been also utilized to disentangle gene networks in various brain regions, such as the hippocampus [77,78,79,80], superior frontal gyrus [80,81], and the entorhinal cortex [80], highlighting additional biological processes, e.g., inflammation, calcium signaling, and cell proliferation [77]. Most of these pioneer studies used traditional methods for inferring gene–gene interactions, ranging from cluster analysis [78] to gene network topology analysis [82].
In rodents, Uddin and Singh conducted a meta-analysis in the context of age-associated spatial learning impairment (ASLI) [83], a process which is associated with early AD [84] and hippocampal volume loss in mice, and with the AD risk gene isoform Apoe4 [85]. ASLI-associated gene networks were derived using Ingenuity Pathway Analysis (IPA) software (http://www.ingenuity.com), which allowed to uncover biological processes such as cell signaling, neuronal growth, and synaptic processes in rat learning impairment [83]. In a subsequent study, Uddin and Singh compared gene networks between young (learning unimpaired) and aged (predominantly learning impaired) brains [86], using Weighted Gene Co-expression Network Analysis (WGCNA) [87]—a widely used method to identify gene co-expression patterns, which are summarized as “modules” of highly correlated genes. Within the inferred modules, “hub genes” such as Camk1g, Cdk5r1, Dlg3, Kcnab2, and Mapk1 were identified, and these have been found to be associated with AD, ion signaling, learning, and memory [86]. Thus, multiple human and animal microarray studies consistently highlighted relevant biological processes such as inflammation, neuronal signaling, and developmental processes as important themes associated with AD and comorbidities.
WGCNA was also used in an early seminal microarray co-expression study of the CA1 hippocampal region for 31 individuals ranging from healthy to severe AD [88]. 9 out of 12 modules were linked to disease progression. Of which, these modules were enriched for processes such as immune response and white matter. Significantly, when comparing AD and aging, two modules—one enriched for mitochondrial processes and the other enriched for synaptic plasticity—were preserved. However, it is important to note that many of these networks uncovered by WGCNA using microarray are cell type specific rather than process specific. This is because of the inherent whole-tissue nature of microarray data. Therefore, while WGCNA might allow us to investigate how genes are co-expressed in specific cell types, it might not be informative when it comes to how genes are co-regulated within a specific cell type.
Microarray-based network studies in mice have also provided new insights into AD pathogenesis and on the role played by specific cell types in the brain. Miller et al. investigated and showed conservation of gene co-expression networks across mice and human brains [89]. However, amongst the glial cells, microglia exhibit the greatest inter-species difference [89]. Another analysis across humans and AD mouse models, specifically 3xTg-AD and amyloid precursor protein (App)NL-G-G/NL-G-G mice, showed an association between neuroinflammation and amyloidosis with multiple AD risk genes expressed in microglia [89,90]. Integrating human microarrays with mice microglia RNA-sequencing data (see next section), Mukherjee et al. performed a meta-analysis of gene networks using WGCNA in context of human aging and neurodegeneration, and mice aging [91,92]. Relevant “hub genes” have been identified in these network studies, including TYROBP, PTPRC, and ITGB2 in humans, and Trem2 in mice [91,92]. These findings not only highlight the conservation of AD risk genes across humans and mice, but also reinforce the critical regulatory role of TREM2/TYROBP interaction axis in microglia [36,93]. In addition, Mukherjee et al. confirmed conservation of gene networks across species by performing a module preservation analysis [91,92]. A module preservation statistic quantitates the extent to which the module is conserved (and detectable) across datasets. Therefore, in Mukherjee et al. a greater preservation statistic score would indicate conservation of particular gene network across species, in this case between mice and humans. Such an approach not only allowed inter-species comparisons, but also inter-experiment comparisons of gene networks, which are especially useful in the integration of multiple microarray experiments.
Highlighting the fundamental role and interplay between epigenomic and transcriptional regulation, microarray analysis on fluorescence-activated cell sorting (FACS)-sorted microglia identified histone deacetylases (HDACs), Hdac1 and Hdac2, as key regulators of microglia homeostasis and development [94]. Other epigenetic elements, such as DNA methylation, acetylation, and chromatin structural states, can influence gene activity without changing the underlying DNA sequence [95]. Focusing on post-transcriptional gene regulation, miRNA microarray-based studies have also uncovered the role of miR-124 in microglia activation [96,97] and regulation of anti-inflammatory action and the peroxisome proliferator-activated receptor-gamma (PPARƔ) pathway [96]. Overall, even in the light of the subsequent advancements of transcriptomic sequencing technologies (see next section), microarray-based transcriptional network analyses have provided valuable new information on genes and functional regulatory processes in AD brain, and concurrent insights into the key role of microglia cells in AD pathogenesis.

3.3. RNA-Seq-Based Studies in AD

RNA-sequencing involves high-throughput sequencing of multifold RNA transcripts at once. Compared to microarray chips, RNA-seq has a much greater dynamic range, sensitivity, specificity, and does not require a priori knowledge of reference transcripts, allowing investigation and discovery of novel transcripts and splicing variants [75]. Starting from the latter, as reviewed by van Dam et al., exon-specific expression could be used to build gene co-splicing networks, [98], which can reduce bias that comes from a “splicing-naive” co-expression analysis [99]. This is especially important because gene splice variants can have different functions and impact splicing regulatory gene-modules [100]. Raj et al. investigated mRNA splicing in the dorsolateral prefrontal cortex (DLPFC) from 450 individuals to create a database of splicing quantitative trait loci or sQTLs (i.e., DNA sequence variants such as single nucleotide polymorphisms—SNPs—that affect the splicing of a gene transcript) [101]. On top of constructing co-splicing gene networks, Raj et al. found significant mRNA splicing dysfunction associated with aging brain, again highlighting the importance of studying information outside coding regions by RNA-seq in AD. In particular, known AD risk genes such as CLU, PICALM, and PTK2B were found to have unique splicing mechanisms [101], where CLU is a binding partner of TREM2, aiding microglial uptake of amyloid [102]. Furthermore, RNA-seq allows investigation of novel long intergenic noncoding RNAs (lincRNAs), which not only represent another layer of transcriptomic information, but are increasingly implicated in AD. Several studies now support the direct contribution of lincRNAs to AD pathogenesis by regulation of key functional processes, including neurogenesis, synaptic dysfunction, amyloid beta accumulation and neuroinflammation—reviewed in [103].
Importantly, Mostafavi et al. [104] used bulk RNA-sequencing from 478 individuals to derive networks of aging human frontal cortices. These networks were first constructed by calculating gene co-expression followed by linking the co-expression modules with AD traits using Bayesian analysis. This module-trait network (MTN) approach discovered networks associated with amyloid burden and cognitive impairment. In particular, the microglia-enriched module was associated with age, suggesting the importance of aging as a risk factor for AD pathogenesis. With respect to microglia, Zhang et al. created a mouse transcriptomic and splicing database of glia cells [105]. Notable examples of the genes identified as differentially spliced in microglia include Clstn1 and App [105]. CLSTN1 (Calsyntenin 1) is known to play an important role in AD pathogenesis by regulating axonal transport of APP and subsequently production of amyloid [106]. Coupled with proteomics analysis, Johnson et al. used RNA-seq analysis in AD and control DLPFC to create a library of translated peptides, which was then analyzed for alternative splicing events [107]. Corroborating Raj et al. findings [101], PTK2B and PICALM were found to have many alternatively spliced isoforms, and splicing events were clustered in specific networks [107]. PICALM is a clathrin adaptor protein important for clearance of amyloid [108] while PTK2B is important for microglia (and other immune cells) activity [109]. With regards to lincRNAs, Magistri et al. conducted directional RNA-seq, which retains strand information to ascertain whether a transcript-associated read is from the positive or negative strand, on 4 LOAD and 4 control individuals, revealing upregulation 89 lincRNAs in AD with 72 of them not being previously reported [110]. Interestingly, upregulation of some lincRNAs in AD was specific to particular brain regions, whereas other lincRNAs were similarly expressed in cerebellum from AD patients and controls. Given the increasingly recognized role of lincRNAs in microglia phagocytosis [111], detailed mechanistic investigations of lincRNAs’ function in microglia is expected to provide additional and valuable insights into AD pathogenesis, beyond the role played by coding RNA transcripts.
Moving away from amyloid pathology in AD, Litvinchuk et al. analyzed RNA-seq data generated in human parahippocampal gyrus and hippocampus from control and tauopathy mouse model PS19 (an AD model initially developed to study immunotherapeutic targeting of tau pathology) [112,113]. Analysis of DE genes and integration with the TRANScription FACtor (TRANSFAC) database were used to pinpoint a dysregulated immune gene network in AD pathogenesis [112]. The C3-C3ar signaling was identified to underlie this network, which is also associated with viral-induced synapse loss [114], reactive astrocytes in AD mouse models [115], and synapse loss [116]. Importantly, the C3ar gene network contains Spi1, Trem2, and Ms4a6a, which mirrors the role of these genes in mouse models of amyloid build-up, suggesting a shared microglia response to tau and amyloid pathology. Of note, the signal transducer and activator of transcription 3 (Stat3), which might contribute to microglia activation [74,117], is a downstream target of the C3ar signaling network, and the downregulation of its downstream network ameliorates tau pathology [112]. Similarly, Wang et al. performed RNA-seq analysis in another murine model of tauopathy, rTg4510 [118] and found other members of the STAT protein family (Stat1, Stat6), and Rela to be mediating NF-kβ and cytokine during earlier stages of tau pathology [118]. Other microarray-based studies in the same rTg4510 mouse model corroborated the role of mediators of cellular immunity (STATs) and inflammation in AD pathogenesis [119].
Unsurprisingly, the development of RNA-seq (and its increasingly lower costs) was paralleled by a decline in popularity of microarrays [75]. Nonetheless, information obtained from the combined analysis of both RNA-seq and microarray datasets can be useful, especially given that both platforms provide a high throughput assessment of the transcriptome (but still RNA-seq studies are more expensive than microarray studies). For example, Zhang et al. constructed transcriptional networks from 1,647 postmortem brain tissues from LOAD patients and control individuals [120]. Zhang et al. utilized Bayesian inference to derive a microglia immune-module associated with clinical covariates relevant to AD [120]. Specifically, for the prefrontal cortex, 5 functional gene networks were found in the immune-module, related to (i) complement genes, (ii) cytokines, (iii) the Fc receptor system, (iv) the major histocompatibility complex, and (v) the toll-like receptor (TLR) signaling [120]—all of these pertain to the microglia’s role in amyloid phagocytosis, inflammatory signaling, and synaptic pruning [27]. Importantly, Zhang and colleagues associated increased network activity with AD severity, and showed TYROBP is a key regulator in a microglia module controlling phagocytosis [120], further implicating the TREM2/TYROBP signaling axis in disease pathogenesis. Although Zhang et al. also found common microglia regulators acting in different brain regions, analysis of discrete brain regions across the adult lifespan of the mouse, revealed that microglia have distinct region-dependent transcriptional identities [121], therefore suggesting the intriguing possibility of region- or context-specific regulators of microglia function in AD.
Transcriptomic data can also be integrated with “-omic” data sets outside proteomics. Novelly, Readhead et al. [122] integrated human transcriptomic data with proteomic, histopathological, and virome data to build multiscale networks in late onset AD (LOAD). The method of choice implemented here is probability causal network (PCN) analysis. Interestingly, Readhead et al. unveiled AD networks that are associated with viral activity, suggesting a role for viral infection in AD pathogenesis. Specifically, viral activity has been linked to APP metabolism with the involvement of various amyloid-related genes like APBB2, BIN1, and BACE1, which has been shown to be activated by the human herpesvirus 6A (HHV-6A). Overall, this demonstrates network analysis to be a powerful tool to integrate transcriptomic data with unconventional datasets (in this case the LOAD virome) for uncovering new insights into AD pathogenesis.

3.4. Single-Cell RNA-Sequencing (scRNA-sequencing) in AD

The advent of scRNA-seq technology has revolutionized transcriptomic analysis, especially in the context of development and disease. A key advantage of scRNA-seq is its ability to obtain cellular transcriptomes, allowing investigation of individual cells’ expression signature and detection of rare cell populations, including “intermediate” cell states [123,124,125]. Variants of scRNA-seq experimental designs come from the choice of platform (droplet-based vs well-based), extent of transcript coverage (full length vs 5’/3’ tagging), and additional features such as cell hashing, combinatorial barcoding, and isolation of nuclei-only RNA [124]. In conventional bulk RNA-seq analysis (i.e., in large populations of cells), the transcriptomic information is derived from a mixture of all cell types within the tissue sampled. Therefore, bulk RNA-seq cannot disentangle the confounding effect of changes in cell type proportion across samples [123]. This is further complicated by the stochastic nature of gene expression and cell type heterogeneity in complex tissues. On the other hand, scRNA-seq data has typically greater noise, level of dropouts (reflecting transcripts that failed to be detected due to technical limitations), low cell-capture efficiency, and technical variability compared to more established bulk RNA-seq [123,124,125]. Such limitations will be ameliorated and, despite these, scRNA-seq offers unprecedented resolution in elucidating cellular transcriptomics, which is increasingly helpful for interrogation of a tissue as complex and heterogeneous as the brain in AD.
Given the unique nature of scRNA-seq data mentioned above, computational tools and methods used in bulk RNA-seq analysis cannot be readily transferred to and implemented for scRNA-seq data analysis. For example, the high dropout rate in scRNA-seq data can result in many undetected transcripts, which require the implementation of specific statistical models (e.g., negative binomial model with zero inflation) for accurate handling of this kind of “missing” data [126]. As for DE analysis in single-cell data, gene network inference from scRNA-seq data is therefore substantially different from data generated by microarray or bulk RNA-seq. The primary, distinctive advantage of scRNA-seq is the ability to assess complete transcriptomes in high number of cells (typically in the order of thousands of cells), where each cell can theoretically be treated as an individual sample-replicate [127]. Therefore, this additional level of biological variability and information entails more complex descriptions of gene co-expression networks [127]. Todorov et al. delineated three main network outputs from scRNA-seq data—differential, dynamic, and profile-specific [127]. Briefly, differential network output relates to networks derived from differential expression analysis between specific cell groups, e.g., between microglia and neurons [128]. Dynamic network output leverages on “pseudotime”, which is a scRNA-seq-specific analysis that allow to order cells by their gene expression profile(s), reflecting either a biological trajectory such as developmental time-points or varying cellular states (e.g., control vs stimulated) [129]. The network activity is subsequently mapped across this pseudotime trajectory, yielding a dynamic network output [127,130,131]. Profile-specific network outputs relate to individual networks that are unique to a distinctive expression profile, which could be derived from a specific cell type/group (e.g., microglia-specific), an a priori cell group of interest (e.g., cells from disease brain), or from individual cells (e.g., dopaminergic neurons) [127,132].
Single cell RNA-seq network analysis in AD mouse models, while still in its infancy, have already yielded new insights into the role of microglia in AD pathogenesis. For instance, Keren-Shaul et al. identified a Trem2-dependent microglial signature termed the damage-associated microglia (DAM) which is conserved across aging, AD, and amyotrophic lateral sclerosis (ALS) [133], supporting the key role of Trem2 that was hitherto suggested by microarray-based and RNA-seq analyses [120]. Subsequently, Rangaraju et al. further dissected the DAM signature separately into pro-inflammatory and anti-inflammatory modules using WGCNA, and posited that the correlation of pro-inflammatory DAM component with neuropathology might account for the damaging role of DAM [62]. Knocking out Trem2 in 5xFAD mice causes dampening of both pro- and anti-inflammatory networks [120]. Liu et al. described an anti-inflammatory Trem2 network encompassing known AD risk genes such as SPI1, MS4A6A, and CD33, which responds to amyloid build-up [134]. Therefore, it has also been suggested that the activation of this anti-inflammatory gene network can occur in response to amyloid build-up as a protective mechanism. Conversely, activation of pro-inflammatory networks might exacerbate AD pathology by releasing cytokines and by pruning of synapses. To further investigate the key regulatory of Trem2, Iacono et al. employed a novel correlation measure tailored to analyze single-cell data correlation metrics to infer regulatory networks [135]. Comparing microglia cells from different disease stages and with different Trem2 “dosage” (i.e., Trem2+/+ vs Trem2-/-), Iacono et al. observed that AD gene networks have fewer connections compared to healthy controls, showing extensive rewiring of regulatory networks in AD microglia. In particular, genes that lost connectivity within the network significantly overlap with Trem2-dependent genes in monocytes [135], suggesting that Trem2 might be important in restricting AD pathogenesis. Figure 2 summarizes key findings of the role of Trem2 in microglia with respect to AD pathogenesis.
Specific to single cell transcriptomics, Single Cell Regulatory Network Inference and Clustering (SCENIC) is a scRNA-seq profile-specific network inference method which uses a random forest classifier to identify TFs followed by TF binding motif enrichment analysis to link downstream TF-targets [132]. Therefore, SCENIC leverages also on DNA sequence (i.e., TF binding sites) analysis to reconstruct regulatory networks. Aibar et al. employed SCENIC on scRNA-seq data consisting of 3005 brain cells isolated from hippocampus and cortices of juveniles mice, and identified many key network regulators in microglia such as PU.1/Ets family of TFs, Nfkb, Irf, and AP-1/Maf [132,137]. Interestingly, in comparison with published microglia “activation” gene signatures in AD [138], the SCENIC-inferred microglia network was found to be strongly upregulated in AD pathogenesis [132]. Similarly, using SCENIC on the mouse single cell atlas, Suo et al. identified an immune gene network consisting of Mafb, Irf2, and Nfkb1 to be highly expressed in microglia [139]. In particular, MAFB is a critical microglia master regulator involved in microglia development and immune regulation in humans [136]. Importantly, scRNA-seq also allows for transcriptomic interrogation of rare cell populations which otherwise would not be accessible by either microarray and bulk RNA-seq. For example, Tay et al. performed scRNA-seq of microglia from a mouse model of unilateral facial nerve axotomy, which recapitulates acute neurodegeneration, and found that microglia regulatory profiles are preserved between acute and chronic neurodegeneration [140]. Some conserved transcriptional profiles include genes regulating antigen presentation, response to interferons, TGFβ signaling, and cell migration [140]. Hammon et al. further investigated microglia transcriptomic changes not only in pathology, but across the trajectory from young to old mice, thereby modelling aging, which is an established risk factor in AD [141]. At least 9 microglia subpopulations were identified along the mouse lifespan, and, intriguingly, genes activated during disease were likely also expressed in development [141]. Therefore, scRNA-seq unravels rare microglia sub-populations in different stages of aging and AD pathogenesis, providing a new opening to the study of neurodegeneration in terms of its acute, chronic, and resolution stages.
Most scRNA-seq studies of AD have been carried out in mice which primarily model familiar AD and, being based in rodents, these are unlikely to reproduce accurately “human brain aging” as the major AD risk factor. Recently, Mathys et al. performed snRNA-seq on post-mortem prefrontal cortices from 48 individuals with different degrees of AD pathology [142] and utilized self-organizing maps (SOMs) to identify gene sets associated with various clinical phenotypes [142]. SOMs are unsupervised neural networks used to cluster noisy data (such as scRNA-seq data) and group related genes into discrete gene networks and modules [143]. In Mathys et al., the gene modules were also termed “gene-trait correlation modules” because they correlate with various pathological or clinical traits such as neurofibrillary tangle burden/density, amyloid levels, and global cognitive function. In particular, two gene-trait correlation modules (termed M6 and M7) were highlighted as these were positively correlated with microglia and pathological traits, and contained AD risk factors such as APOE, TREM2, MEF2C, and PICALM. The M7 gene module was also enriched for genes related to immune processes and amyloid clearance [142]. Importantly, Mathys et al. also investigated sex-specific effects in AD at the single cell level, revealing transcriptional responses that were substantially different between sexes in several cell types (e.g., oligodendrocytes). This exemplifies how scRNA-seq and transcriptomic network analysis can be integrated with clinical and pathological phenotypes in humans to reveal molecular and cellular changes in the activity of specific networks and genes in AD pathogenesis.
Despite the intrinsic differences between microarray, RNA-seq, and scRNA-seq, integrating transcriptomic data from all technologies can be useful. For example, Patir et al. combined analyses of 15 datasets generated using the 3 platforms in order to derive a “core” human microglia gene network [144]. The microglia network was constructed using network analysis tool Graphia Professional [145], which involves the generation of a gene co-expression network and the derivation of gene clusters by Markov clustering algorithm. Overall, 249 genes, including known microglia markers CD68, P2RY12, and TMEM119 were found within a core transcriptional network, which was conserved across species (human and mouse), platforms, and brain regions [143]. In addition, Patir et al. found that microglia numbers change accordingly with different levels of inflammation and age-related atrophy, reflecting known region-dependent alterations in AD. For example, the vulnerable superior frontal gyrus showed a substantial increase in microglia numbers, while the relatively AD-resistant post-central gyrus exhibited little change in microglia numbers. Furthermore, co-expression network analysis further refined 165 microglia-associated genes (MAGs), which were not inside the “core” gene network, and found that these MAGs were enriched in lipid regulation, showing that microglia are implicated not only in inflammation, but also in metabolic homeostasis in the context of AD [144]. This study illustrates how the unbiased identification of different networks can provide insights into distinct and specific molecular processes and pathways, which are otherwise difficult to disentangle from the analysis of transcriptional signatures and DE genes alone.
Similarly, Friedman et al. performed a meta-analysis of CNS myeloid cells across 69 conditions including mouse models of neurodegeneration, aging, ischemia, infection, and tumor proliferation, identifying various gene modules related to neurodegeneration and interferon-related processes [146]. These co-regulated gene modules were derived by performing DE and hierarchical clustering analysis, starting from a common set of genes commonly expressed across all conditions tested. The key neurodegeneration gene module included 4 transcription factors—Bhlhe40, Rxrg, Hif1a, and Mitf. Other studies have implicated Hif1a in AD pathogenesis [25,147]. In particular, Baik et al. posited that microglia activation requires Hif1a to switch on glycolysis, while chronic neurodegeneration results in the microglia metabolic breakdown [25,147]. The neurodegeneration module also contains cathepsins, which reflect lysosomal activity and Apoe, the key risk gene for AD [146]. In addition, this module was also detected in the P301L genetic model of tauopathy, suggesting the importance of microglia not only for amyloid pathology, but for tau pathology. A summary of the key biological insights into AD pathology by transcriptional network analysis which have been discussed here, is reported in Table 1.

4. Further Applications of Transcriptomic Gene Networks in AD

Typically, transcriptional gene networks provide information of biological processes associated with the disease trajectory in a given tissue or cell-type. These networks could also elucidate AD pathogenesis and potentially be used to suggest drug targets. This inference is boosted by additional integration with orthogonal “-omics” datasets and/or sources of biological information (e.g., curated knowledge-based databases, functional gene ontologies and annotations, and drug transcriptional-perturbation responses database).For example, Vargas et al. incorporated the identified gene regulatory networks with the Connectivity Map Analysis (CMap) database, and identified drugs capable of perturbing gene networks in AD, showing the utility of gene network analysis for drug repositioning [64]. Briefly, CMap contains a transcriptomic database of drug-induced cell perturbations, providing a reference for comparison with specific disease-associated gene signatures and networks [149]. This allows identification of drugs which might potentially exacerbate or reverse the input gene signature/network. Vargas et al. used published gene expression profile data (Gene Expression Omnibus (GEO) database, https://www.ncbi.nlm.nih.gov/geo) and employed the ARACNe algorithm to identify TF-driven regulatory networks in human hippocampus, which were further connected to disease using AD case-control studies. These TF-driven regulatory networks were used to predict drugs by CMap, which yielded six FDA-approved drugs (Cefuroxime, Cyproterone, Dydrogesterone, Metrizamide, Trimethadione, and Vorinostat) predicted to potentially counteract AD pathogenesis. In particular, Vorinostat is a histone deacetylase inhibitor (HDACi) which has not only been shown to protect against amyloid toxicity [150], but is also currently under clinical trial for memory improvement (www.clinicaltrials.gov). With regards to microglia in particular, vorinostat can inhibit the release of cytokines after exposure to lipopolysaccharide, which is a gram-negative endotoxin and pro-inflammatory stimulus [151]. This corroborates findings of independent high throughput drug screenings, which showed that vorinostat can reduce PU.1 expression in human microglia [152], potentially limiting neuroinflammation and retarding AD pathogenesis. In addition, Vargas et al. identified the AD master regulator PARK2, which has been shown to be associated with NLRP3 inflammasome activation in microglia [153], and further incorporated CMap data to discover drugs capable of perturbing identified networks, highlighting the utility of gene network analysis in drug repositioning.
Following the central dogma of molecular genetics, the flow of information from mRNA to protein is influenced and regulated at multiple levels, including translation, splicing, and polypeptide processing. Therefore, proteomics data has been widely used to further refine networks inferred from transcriptomic analyses. For example, Canchi et al. integrated mRNA expression profiles from prefrontal cortices from 414 AD and control individuals with brain tissue-specific protein interactomes [154]. This was achieved by cross-matching the many differentially expressed genes between AD and controls with the Genome-Scale Integrated Analysis of Networks in Tissue (GIANT)—a database of human tissue-specific networks [155]. This allowed Canchi et al. to find downregulation of synaptic signaling, metabolism, cell survival and proliferation, and immune responses, and an upregulation of several novel processes including small guanosine-triphosphate (GTPase) signaling. The authors further discovered EGR3, TGIF1, SP1, and BPTF as TFs associated with AD pathogenesis. EGR3 and EGR1 have been implicated in short-term memory [136] and maintenance of long-term potentiation (LTP) respectively [156]. Importantly, EGR3 was not previously associated with AD and, thereby, Canchi et al. exemplified the utility of integrating proteomic and transcriptomic data to suggest new TFs involved in AD pathogenesis. Similarly, Marttinen et al. combined microarray and phosphoproteomic data from human temporal cortices in a “multi-omics” approach and identified mitochondrial and synaptic dysfunction as the earliest pathological processes occurring in AD pathogenesis [157]. This approach allowed for the reconstruction of the protein–protein interaction (PPI) networks which uncovered relationships between diverse biological processes altered at the different stages of AD pathogenesis, and revealed increase in kinase activities in AD, involving as CDK5, GSK3β, PRKACA, PKN1, and MAPK12.
Overall, network analysis aids in the investigation of complex diseases like AD by moving away from a reductionist approach. By interrogating the interplay of genes, network analysis not only implicates the key genes driving various pathological processes in AD, but also provides a compendium of target genes for possible therapeutic perturbation. Furthermore, network analysis can further be refined to discover cellular subtype-specific networks and incorporate molecular information. For example, Roussarie et al. [158] made use of bacTRAP and human genomics data to understand context-specific neuronal networks in AD. A key development in the future would be the integration and utilization of the wealth of networks in AD literature. This “harmonization” of network information would be useful in interpreting networks in different mouse models, translating findings from mice to humans, and dissecting networks built from different stages of AD pathogenesis.

5. Concluding Remarks

During the last decade, transcriptomic network analyses have demonstrated the microglia’s functional role in inflammation [133], synaptic pruning [159], neuronal damage [160], metabolic changes [161], and amyloid clearance in AD [162]. After the pioneer microarray-based transcriptomic studies, followed by improved RNA-seq-based studies, scRNA-seq has provided the most significant breakthrough in the field. This relates to the opportunity of high-content and cell-resolved transcriptomic analyses in otherwise complex and heterogeneous tissues—which has been crucial to decode pathological processes occurring in specific cell populations in the AD brain. Integration of auxiliary regulatory information at single cell level aided a more robust inference of gene regulatory networks underlying AD pathogenesis, which further highlighted the primary role played by microglia as well as their interplay with other resident brain cells [24,163,164]. Moving forward, spatially and temporally resolved scRNA-seq analyses of microglia gene networks are likely to provide further elucidation of region-specific microglia networks and altered networks’ dynamics associated with AD pathogenesis. This is especially important given the association between the spread and load of AD pathological correlates (β-amyloid and tau) across different brain structures with AD severity. In the meanwhile, researchers have the opportunity to take advantage of increasingly available single cell transcriptomic data (e.g., https://www.humancellatlas.org, http://portal.brain-map.org/ ), and integrate these with orthogonal “-omics” data types (e.g., scATAC-seq, scChIP–seq, scTHS-seq, scDNA-methylation profiling, scProteomics, scMitochondrial DNA-seq) for accurate network construction at single-cell resolution. This development of “multimodal” (or “multi-omics”) profiling strategies at the single cell level will likely prompt the development of innovative statistical and computational approaches to analyze all these data types in a unified framework [165]. The expectation here is to move beyond the transcriptome-centric gene network view of AD and acquire a comprehensive multi-layered representation of the cell’s dynamic state during disease progression and in pathogenesis.

Author Contributions

G.C. and E.P. contributed equally to the review.

Funding

This research received no external funding.

Conflicts of Interest

The authors declare no conflict of interest

References

  1. Lane, C.A.; Hardy, J.; Schott, J.M. Alzheimer’s disease. Eur. J. Neurol. 2018, 25, 59–70. [Google Scholar] [CrossRef] [PubMed]
  2. Jack, C.R.; Bennett, D.A.; Blennow, K.; Carrillo, M.C.; Dunn, B.; Haeberlein, S.B.; Holtzman, D.M.; Jagust, W.; Jessen, F.; Karlawish, J.; et al. NIA-AA Research Framework: Toward a biological definition of Alzheimer’s disease. Alzheimer Dementia 2018, 14, 535–562. [Google Scholar] [CrossRef] [PubMed]
  3. Panza, F.; Lozupone, M.; Logroscino, G.; Imbimbo, B.P. A critical appraisal of amyloid-β-targeting therapies for Alzheimer disease. Nat. Rev. Neurol. 2019, 15, 73–88. [Google Scholar] [CrossRef] [PubMed]
  4. Jagust, W. Imaging the evolution and pathophysiology of Alzheimer disease. Nat. Rev. Neurosci. 2018, 19, 687–700. [Google Scholar] [CrossRef] [PubMed]
  5. Qiu, C.; Kivipelto, M.; von Strauss, E. Epidemiology of Alzheimer’s disease: Occurrence, determinants, and strategies toward intervention. Dialogues Clin. Neurosci. 2009, 11, 111–128. [Google Scholar]
  6. Sharp, E.S.; Gatz, M. Relationship between education and dementia: An updated systematic review. Alzheimer Dis. Assoc. Disord. 2011, 25, 289–304. [Google Scholar] [CrossRef]
  7. Chen, N.-C.; Liang, C.-K.; Yin, C.-H.; Lin, Y.-T.; Lee, C.-C.; Chen, C.-L. Effects of Socioeconomic Status on Alzheimer Disease Mortality in Taiwan. Am. J. Geriatr. Psychiatry 2019. [Google Scholar] [CrossRef]
  8. Jia, R.-X.; Liang, J.-H.; Xu, Y.; Wang, Y.-Q. Effects of physical activity and exercise on the cognitive function of patients with Alzheimer disease: A meta-analysis. BMC Geriatr. 2019, 19, 181. [Google Scholar] [CrossRef]
  9. Larson, E.B.; Wang, L. Exercise, Aging, and Alzheimer Disease. Alzheimer Dis. Assoc. Dis. 2004, 18, 54–56. [Google Scholar] [CrossRef]
  10. Nalivaeva, N.N.; Turner, A.J. Targeting amyloid clearance in Alzheimer’s disease as a therapeutic strategy. Br. J. Pharmacol. 2019, 176. [Google Scholar] [CrossRef]
  11. Pinheiro, L.; Faustino, C. Therapeutic Strategies Targeting Amyloid-β in Alzheimer’s Disease. Curr. Alzheimer Res. 2019, 16, 418–452. [Google Scholar] [CrossRef] [PubMed]
  12. Ricciarelli, R.; Fedele, E. The Amyloid Cascade Hypothesis in Alzheimer’s Disease: It’s Time to Change Our Mind. Curr. Neuropharmacol. 2017, 15, 926–935. [Google Scholar] [CrossRef] [PubMed]
  13. Wolf, S.A.; Boddeke, H.W.G.; Kettenmann, H. Microglia in Physiology and Disease. Ann. Rev. Physiol. 2017, 79, 619–643. [Google Scholar] [CrossRef] [PubMed]
  14. Wood, P.L. Microglia: Roles of Microglia in Chronic Neurodegenerative Diseases. In Neuroinflammation; Humana Press: Totowa, NJ, USA, 2003; pp. 3–27. [Google Scholar]
  15. Cherry, J.D.; Olschowka, J.A.; O’Banion, M. Neuroinflammation and M2 microglia: The good, the bad, and the inflamed. J. Neuroinflamm. 2014, 11, 98. [Google Scholar] [CrossRef] [PubMed]
  16. Sala Frigerio, C.; Wolfs, L.; Fattorelli, N.; Thrupp, N.; Voytyuk, I.; Schmidt, I.; Mancuso, R.; Chen, W.-T.; Woodbury, M.E.; Srivastava, G.; et al. The Major Risk Factors for Alzheimer’s Disease: Age, Sex, and Genes Modulate the Microglia Response to Aβ Plaques. Cell Rep. 2019, 27, 1293–1306.e6. [Google Scholar] [CrossRef]
  17. Rajendran, L.; Paolicelli, R.C. Microglia-Mediated Synapse Loss in Alzheimer’s Disease. J. Neurosci. 2018, 38, 2911–2919. [Google Scholar] [CrossRef]
  18. Kim, Y.S.; Joh, T.H. Microglia, major player in the brain inflammation: Their roles in the pathogenesis of Parkinson’s disease. Exp. Mol. Med. 2006, 38, 333–347. [Google Scholar] [CrossRef]
  19. Mishra, M.K.; Wee Yong, V. Macrophages and Microglia in Experimental Autoimmune Encephalomyelitis and Multiple Sclerosis. Mult. Scler. Immunol. 2013. [Google Scholar] [CrossRef]
  20. Zhang, S. Microglial activation after ischaemic stroke. Stroke Vasc. Neurol. 2019, 4, 71–74. [Google Scholar] [CrossRef] [Green Version]
  21. Santiago, A.R.; Bernardino, L.; Agudo-Barriuso, M.; Gonçalves, J. Microglia in Health and Disease: A Double-Edged Sword. Mediators Inflamm. 2017, 2017, 7034143. [Google Scholar] [CrossRef] [PubMed]
  22. Hansen, D.V.; Hanson, J.E.; Sheng, M. Microglia in Alzheimer’s disease. J. Cell Biol. 2018, 217, 459–472. [Google Scholar] [CrossRef] [PubMed]
  23. Edwards, F.A. A Unifying Hypothesis for Alzheimer’s Disease: From Plaques to Neurodegeneration. Trends Neurosci. 2019, 42, 310–322. [Google Scholar] [CrossRef] [PubMed]
  24. Rothhammer, V.; Borucki, D.M.; Tjon, E.C.; Takenaka, M.C.; Chao, C.-C.; Ardura-Fabregat, A.; de Lima, K.A.; Gutiérrez-Vázquez, C.; Hewson, P.; Staszewski, O.; et al. Microglial control of astrocytes in response to microbial metabolites. Nature 2018, 557, 724–728. [Google Scholar] [CrossRef]
  25. Wendeln, A.-C.; Degenhardt, K.; Kaurani, L.; Gertig, M.; Ulas, T.; Jain, G.; Wagner, J.; Häsler, L.M.; Wild, K.; Skodras, A.; et al. Innate immune memory in the brain shapes neurological disease hallmarks. Nature 2018, 556, 332–338. [Google Scholar] [CrossRef]
  26. Newcombe, E.A.; Camats-Perna, J.; Silva, M.L.; Valmas, N.; Huat, T.J.; Medeiros, R. Inflammation: The link between comorbidities, genetics, and Alzheimer’s disease. J. Neuroinflamm. 2018, 15, 276. [Google Scholar] [CrossRef]
  27. Katsumoto, A.; Takeuchi, H.; Takahashi, K.; Tanaka, F. Microglia in Alzheimer’s Disease: Risk Factors and Inflammation. Front. Neurol. 2018, 9, 978. [Google Scholar] [CrossRef]
  28. Cribbs, D.H.; Berchtold, N.C.; Perreau, V.; Coleman, P.D.; Rogers, J.; Tenner, A.J.; Cotman, C.W. Extensive innate immune gene activation accompanies brain aging, increasing vulnerability to cognitive decline and neurodegeneration: A microarray study. J. Neuroinflamm. 2012, 9, 179. [Google Scholar] [CrossRef]
  29. Daria, A.; Colombo, A.; Llovera, G.; Hampel, H.; Willem, M.; Liesz, A.; Haass, C.; Tahirovic, S. Young microglia restore amyloid plaque clearance of aged microglia. EMBO J. 2017, 36, 583–603. [Google Scholar] [CrossRef]
  30. Stern, Y. Cognitive reserve in ageing and Alzheimer’s disease. Lancet Neurol. 2012, 11, 1006–1012. [Google Scholar] [CrossRef]
  31. Esiri, M.M.; Chance, S.A. Cognitive reserve, cortical plasticity and resistance to Alzheimer’s disease. Alzheimers Res. Ther. 2012, 4, 7. [Google Scholar] [CrossRef] [PubMed]
  32. Garcia-Reitboeck, P.; Phillips, A.; Piers, T.M.; Villegas-Llerena, C.; Butler, M.; Mallach, A.; Rodrigues, C.; Arber, C.E.; Heslegrave, A.; Zetterberg, H.; et al. Human Induced Pluripotent Stem Cell-Derived Microglia-Like Cells Harboring TREM2 Missense Mutations Show Specific Deficits in Phagocytosis. Cell Rep. 2018, 24, 2300–2311. [Google Scholar] [CrossRef] [PubMed] [Green Version]
  33. Griciuc, A.; Patel, S.; Federico, A.N.; Choi, S.H.; Innes, B.J.; Oram, M.K.; Cereghetti, G.; McGinty, D.; Anselmo, A.; Sadreyev, R.I.; et al. TREM2 Acts Downstream of CD33 in Modulating Microglial Pathology in Alzheimer’s Disease. Neuron 2019, 103, 820–835. [Google Scholar] [CrossRef] [PubMed]
  34. Nizami, S.; Hall-Roberts, H.; Warrier, S.; Cowley, S.A.; Di Daniel, E. Microglial inflammation and phagocytosis in Alzheimer’s disease: Potential therapeutic targets. Br. J. Pharmacol. 2019, 176. [Google Scholar] [CrossRef] [PubMed]
  35. Parhizkar, S.; Arzberger, T.; Brendel, M.; Kleinberger, G.; Deussing, M.; Focke, C.; Nuscher, B.; Xiong, M.; Ghasemigharagoz, A.; Katzmarski, N.; et al. Loss of TREM2 function increases amyloid seeding but reduces plaque-associated ApoE. Nat. Neurosci. 2019, 22, 191–204. [Google Scholar] [CrossRef] [PubMed]
  36. Linnartz-Gerlach, B.; Bodea, L.-G.; Klaus, C.; Ginolhac, A.; Halder, R.; Sinkkonen, L.; Walter, J.; Colonna, M.; Neumann, H. TREM2 triggers microglial density and age-related neuronal loss. Glia 2019, 67, 539–550. [Google Scholar] [CrossRef] [PubMed]
  37. Carmona, S.; Zahs, K.; Wu, E.; Dakin, K.; Bras, J.; Guerreiro, R. The role of TREM2 in Alzheimer’s disease and other neurodegenerative disorders. Lancet Neurol. 2018, 17, 721–730. [Google Scholar] [CrossRef]
  38. Jonsson, T.; Stefansson, H.; Steinberg, S.; Jonsdottir, I.; Jonsson, P.V.; Snaedal, J.; Bjornsson, S.; Huttenlocher, J.; Levey, A.I.; Lah, J.J.; et al. Variant of TREM2 associated with the risk of Alzheimer’s disease. N. Engl. J. Med. 2013, 368, 107–116. [Google Scholar] [CrossRef]
  39. Guerreiro, R.; Wojtas, A.; Bras, J.; Carrasquillo, M.; Rogaeva, E.; Majounie, E.; Cruchaga, C.; Sassi, C.; Kauwe, J.S.K.; Younkin, S.; et al. TREM2 variants in Alzheimer’s disease. N. Engl. J. Med. 2013, 368, 117–127. [Google Scholar] [CrossRef]
  40. Zhou, Y.; Ulland, T.K.; Colonna, M. TREM2-Dependent Effects on Microglia in Alzheimer’s Disease. Front. Aging Neurosci. 2018, 10, 202. [Google Scholar] [CrossRef]
  41. Yuan, P.; Condello, C.; Keene, C.D.; Wang, Y.; Bird, T.D.; Paul, S.M.; Luo, W.; Colonna, M.; Baddeley, D.; Grutzendler, J. TREM2 Haplodeficiency in Mice and Humans Impairs the Microglia Barrier Function Leading to Decreased Amyloid Compaction and Severe Axonal Dystrophy. Neuron 2016, 90, 724–739. [Google Scholar] [CrossRef] [PubMed] [Green Version]
  42. Lynch, J.R.; Tang, W.; Wang, H.; Vitek, M.P.; Bennett, E.R.; Sullivan, P.M.; Warner, D.S.; Laskowitz, D.T. APOE Genotype and an ApoE-mimetic Peptide Modify the Systemic and Central Nervous System Inflammatory Response. J. Biol. Chem. 2003, 278, 48529–48533. [Google Scholar] [CrossRef] [PubMed] [Green Version]
  43. Tansey, K.E.; Cameron, D.; Hill, M.J. Genetic risk for Alzheimer’s disease is concentrated in specific macrophage and microglial transcriptional networks. Genome Med. 2018, 10, 14. [Google Scholar] [CrossRef] [PubMed]
  44. Way, J.C.; Silver, P.A. Systems engineering without an engineer: Why we need systems biology. Complexity 2007, 13, 22–29. [Google Scholar] [CrossRef]
  45. Faith, J.J.; Hayete, B.; Thaden, J.T.; Mogno, I.; Wierzbowski, J.; Cottarel, G.; Kasif, S.; Collins, J.J.; Gardner, T.S. Large-scale mapping and validation of Escherichia coli transcriptional regulation from a compendium of expression profiles. PLoS Biol. 2007, 5, e8. [Google Scholar] [CrossRef] [PubMed]
  46. Meyer, P.E.; Kontos, K.; Lafitte, F.; Bontempi, G. Information-Theoretic Inference of Large Transcriptional Regulatory Networks. EURASIP J. Bioinform. Syst. Biol. 2007, 2007, 1–9. [Google Scholar] [CrossRef] [Green Version]
  47. Altay, G.; Emmert-Streib, F. Inferring the conservative causal core of gene regulatory networks. BMC Syst. Biol. 2010, 4, 132. [Google Scholar] [CrossRef]
  48. Tamada, Y.; Shimamura, T.; Yamaguchi, R.; Imoto, S.; Nagasaki, M.; Miyano, S. Sign: Large-scale gene network estimation environment for high performance computing. Genome Inform. 2011, 25, 40–52. [Google Scholar]
  49. Huynh-Thu, V.A.; Irrthum, A.; Wehenkel, L.; Geurts, P. Inferring regulatory networks from expression data using tree-based methods. PLoS ONE 2010, 5, e12776. [Google Scholar] [CrossRef]
  50. Haury, A.-C.; Mordelet, F.; Vera-Licona, P.; Vert, J.-P. TIGRESS: Trustful Inference of Gene Regulation using Stability Selection. BMC Syst. Biol. 2012, 6, 145. [Google Scholar] [CrossRef]
  51. Delgado, F.M.; Gómez-Vela, F. Computational methods for Gene Regulatory Networks reconstruction and analysis: A review. Artif. Intell. Med. 2019, 95, 133–145. [Google Scholar] [CrossRef] [PubMed]
  52. Thompson, D.; Regev, A.; Roy, S. Comparative analysis of gene regulatory networks: From network reconstruction to evolution. Annu. Rev. Cell Dev. Biol. 2015, 31, 399–428. [Google Scholar] [CrossRef] [PubMed]
  53. Tieri, P.; Farina, L.; Petti, M.; Astolfi, L.; Paci, P.; Castiglione, F. Network Inference and Reconstruction in Bioinformatics. Encycl. Bioinform. Comput. Biol. 2019, 805–813. [Google Scholar] [CrossRef]
  54. Schäfer, J.; Strimmer, K. An empirical Bayes approach to inferring large-scale gene association networks. Bioinformatics 2005, 21, 754–764. [Google Scholar] [CrossRef] [PubMed]
  55. Kim, S.; Jhong, J.-H.; Lee, J.; Koo, J.-Y.; Lee, B.; Han, S. Node-Structured Integrative Gaussian Graphical Model Guided by Pathway Information. Comput. Math. Methods Med. 2017, 2017, 8520480. [Google Scholar] [CrossRef]
  56. Villa-Vialaneix, N.; Liaubet, L.; Laurent, T.; Cherel, P.; Gamot, A.; SanCristobal, M. The structure of a gene co-expression network reveals biological functions underlying eQTLs. PLoS ONE 2013, 8, e60045. [Google Scholar] [CrossRef]
  57. Allocco, D.J.; Kohane, I.S.; Butte, A.J. Quantifying the relationship between co-expression, co-regulation and gene function. BMC Bioinform. 2004, 5, 18. [Google Scholar] [CrossRef]
  58. Josyula, N.; Andersen, M.E.; Kaminski, N.; Dere, E.; Zacharewski, T.R.; Bhattacharya, S. Gene Coregulation and Coexpression in the Aryl Hydrocarbon Receptor-mediated Transcriptional Regulatory Network in the Mouse Liver. bioRxiv 2018, 260018. [Google Scholar] [CrossRef] [Green Version]
  59. Saha, A.; Kim, Y.; Gewirtz, A.D.H.; Jo, B.; Gao, C.; McDowell, I.C. GTEx Consortium; Engelhardt, B.E.; Battle, A. Co-expression networks reveal the tissue-specific regulation of transcription and splicing. Genome Res. 2017, 27, 1843–1858. [Google Scholar] [CrossRef]
  60. Yeung, K.Y.; Medvedovic, M.; Bumgarner, R.E. From co-expression to co-regulation: How many microarray experiments do we need? Genome Biol. 2004, 5, R48. [Google Scholar] [CrossRef]
  61. Ding, J.; Kong, W.; Mou, X.; Wang, S. Construction of Transcriptional Regulatory Network of Alzheimer’s Disease Based on PANDA Algorithm. Interdiscip. Sci. Comput. Life Sci. 2019, 11, 226–236. [Google Scholar] [CrossRef] [PubMed]
  62. Rangaraju, S.; Dammer, E.B.; Raza, S.A.; Rathakrishnan, P.; Xiao, H.; Gao, T.; Duong, D.M.; Pennington, M.W.; Lah, J.J.; Seyfried, N.T.; et al. Identification and therapeutic modulation of a pro-inflammatory subset of disease-associated-microglia in Alzheimer’s disease. Mol. Neurodegener. 2018, 13, 24. [Google Scholar] [CrossRef] [PubMed]
  63. Margolin, A.A.; Nemenman, I.; Basso, K.; Wiggins, C.; Stolovitzky, G.; Dalla Favera, R.; Califano, A. ARACNE: An algorithm for the reconstruction of gene regulatory networks in a mammalian cellular context. BMC Bioinform. 2006, 7, S7. [Google Scholar] [CrossRef] [PubMed]
  64. Vargas, D.M.; De Bastiani, M.A.; Zimmer, E.R.; Klamt, F. Alzheimer’s disease master regulators analysis: Search for potential molecular targets and drug repositioning candidates. Alzheimer Res. Ther. 2018, 10, 59. [Google Scholar] [CrossRef] [PubMed]
  65. Chumakov, S.; Ballesteros, E.; Rodriguez Sanchez, J.E.; Chavez, A.; Zhang, M.; Pettit, B.M.; Fofanov, Y. Using Mutual Information to Discover Temporal Patterns in Gene Expression Data. Med. Phys. Mex. Symp. Med. Phys. 2006, 854, 25–30. [Google Scholar] [PubMed] [Green Version]
  66. Liu, B.-H. Differential Coexpression Network Analysis for Gene Expression Data. Methods Mol. Biol. 2018, 1754, 155–165. [Google Scholar]
  67. Tesson, B.M.; Breitling, R.; Jansen, R.C. DiffCoEx: A simple and sensitive method to find differentially coexpressed gene modules. BMC Bioinform. 2010, 11, 497. [Google Scholar] [CrossRef]
  68. Amar, D.; Safer, H.; Shamir, R. Dissection of regulatory networks that are altered in disease via differential co-expression. PLoS Comput. Biol. 2013, 9, e1002955. [Google Scholar] [CrossRef]
  69. Wang, L.; Liu, Z.-P. Detecting Diagnostic Biomarkers of Alzheimer’s Disease by Integrating Gene Expression Data in Six Brain Regions. Front. Genet. 2019, 10, 157. [Google Scholar] [CrossRef]
  70. Yu, D.; Lim, J.; Wang, X.; Liang, F.; Xiao, G. Enhanced construction of gene regulatory networks using hub gene information. BMC Bioinform. 2017, 18, 186. [Google Scholar] [CrossRef]
  71. Meng, G.; Mei, H. Transcriptional Dysregulation Study Reveals a Core Network Involving the Progression of Alzheimer’s Disease. Front. Aging Neurosci. 2019, 11, 101. [Google Scholar] [CrossRef]
  72. Wehrspaun, C.C.; Haerty, W.; Ponting, C.P. Microglia recapitulate a hematopoietic master regulator network in the aging human frontal cortex. Neurobiol. Aging 2015, 36, 2443-e9. [Google Scholar] [CrossRef]
  73. Yao, L.; Kan, E.M.; Kaur, C.; Dheen, S.T.; Hao, A.; Lu, J.; Ling, E.-A. Notch-1 signaling regulates microglia activation via NF-κB pathway after hypoxic exposure in vivo and in vitro. PLoS ONE 2013, 8, e78439. [Google Scholar] [CrossRef]
  74. Yang, X.; He, G.; Hao, Y.; Chen, C.; Li, M.; Wang, Y.; Zhang, G.; Yu, Z. The role of the JAK2-STAT3 pathway in pro-inflammatory responses of EMF-stimulated N9 microglial cells. J. Neuroinflamm. 2010, 7, 54. [Google Scholar] [CrossRef]
  75. Lowe, R.; Shirley, N.; Bleackley, M.; Dolan, S.; Shafee, T. Transcriptomics technologies. PLoS Comput. Biol. 2017, 13, e1005457. [Google Scholar] [CrossRef]
  76. Schena, M.; Shalon, D.; Davis, R.W.; Brown, P.O. Quantitative monitoring of gene expression patterns with a complementary DNA microarray. Science 1995, 270, 467–470. [Google Scholar] [CrossRef]
  77. Blalock, E.M.; Buechel, H.M.; Popovic, J.; Geddes, J.W.; Landfield, P.W. Microarray analyses of laser-captured hippocampus reveal distinct gray and white matter signatures associated with incipient Alzheimer’s disease. J. Chem. Neuroanat. 2011, 42, 118–126. [Google Scholar] [CrossRef]
  78. Colangelo, V.; Schurr, J.; Ball, M.J.; Pelaez, R.P.; Bazan, N.G.; Lukiw, W.J. Gene expression profiling of 12633 genes in Alzheimer hippocampal CA1: Transcription and neurotrophic factor down-regulation and up-regulation of apoptotic and pro-inflammatory signaling. J. Neurosci. Res. 2002, 70, 462–473. [Google Scholar] [CrossRef]
  79. Ginsberg, S.D.; Hemby, S.E.; Lee, V.M.; Eberwine, J.H.; Trojanowski, J.Q. Expression profile of transcripts in Alzheimer’s disease tangle-bearing CA1 neurons. Ann. Neurol. 2000, 48, 77–87. [Google Scholar] [CrossRef]
  80. Liang, W.S.; Dunckley, T.; Beach, T.G.; Grover, A.; Mastroeni, D.; Ramsey, K.; Caselli, R.J.; Kukull, W.A.; McKeel, D.; Morris, J.C.; et al. Altered neuronal gene expression in brain regions differentially affected by Alzheimer’s disease: A reference data set. Physiol. Genom. 2008, 33, 240–256. [Google Scholar] [CrossRef]
  81. Yao, P.J.; Zhu, M.; Pyun, E.I.; Brooks, A.I.; Therianos, S.; Meyers, V.E.; Coleman, P.D. Defects in expression of genes related to synaptic vesicle traffickingin frontal cortex of Alzheimer’s disease. Neurobiol. Dis. 2003, 12, 97–109. [Google Scholar] [CrossRef]
  82. Chandrasekaran, S.; Bonchev, D. Network Topology Analysis of Post-Mortem Brain Microarrays Identifies More Alzheimer’s Related Genes and MicroRNAs and Points to Novel Routes for Fighting with the Disease. PLoS ONE 2016, 11, e0144052. [Google Scholar] [CrossRef] [PubMed]
  83. Uddin, R.K.; Singh, S.M. Hippocampal gene expression meta-analysis identifies aging and age-associated spatial learning impairment (ASLI) genes and pathways. PLoS ONE 2013, 8, e69768. [Google Scholar] [CrossRef]
  84. Allison, S.L.; Fagan, A.M.; Morris, J.C.; Head, D. Spatial Navigation in Preclinical Alzheimer’s Disease. J. Alzheimer Dis. 2016, 52, 77–90. [Google Scholar] [CrossRef]
  85. Yin, J.-X.; Turner, G.H.; Lin, H.-J.; Coons, S.W.; Shi, J. Deficits in spatial learning and memory is associated with hippocampal volume loss in aged apolipoprotein E4 mice. J. Alzheimers Dis. 2011, 27, 89–98. [Google Scholar] [CrossRef]
  86. Uddin, R.; Singh, S.M. Gene Network Construction from Microarray Data Identifies a Key Network Module and Several Candidate Hub Genes in Age-Associated Spatial Learning Impairment. Front. Syst. Neurosci. 2017, 11, 75. [Google Scholar] [CrossRef]
  87. Langfelder, P.; Horvath, S. WGCNA: An R package for weighted correlation network analysis. BMC Bioinform. 2008, 9, 559. [Google Scholar] [CrossRef]
  88. Miller, J.A.; Oldham, M.C.; Geschwind, D.H. A systems level analysis of transcriptional changes in Alzheimer’s disease and normal aging. J. Neurosci. 2008, 28, 1410–1420. [Google Scholar] [CrossRef]
  89. Miller, J.A.; Horvath, S.; Geschwind, D.H. Divergence of human and mouse brain transcriptome highlights Alzheimer disease pathways. Proc. Natl. Acad. Sci. USA 2010, 107, 12698–12703. [Google Scholar] [CrossRef] [Green Version]
  90. Castillo, E.; Leon, J.; Mazzei, G.; Abolhassani, N.; Haruyama, N.; Saito, T.; Saido, T.; Hokama, M.; Iwaki, T.; Ohara, T.; et al. Comparative profiling of cortical gene expression in Alzheimer’s disease patients and mouse models demonstrates a link between amyloidosis and neuroinflammation. Sci. Rep. 2017, 7, 17762. [Google Scholar] [CrossRef]
  91. Mukherjee, S.; Klaus, C.; Pricop-Jeckstadt, M.; Miller, J.A.; Struebing, F.L. A Microglial Signature Directing Human Aging and Neurodegeneration-Related Gene Networks. Front. Neurosci. 2019, 13, 2. [Google Scholar] [CrossRef]
  92. Langfelder, P.; Luo, R.; Oldham, M.C.; Horvath, S. Is my network module preserved and reproducible? PLoS Comput. Biol. 2011, 7, e1001057. [Google Scholar] [CrossRef]
  93. Haure-Mirande, J.-V.; Audrain, M.; Fanutza, T.; Kim, S.H.; Klein, W.L.; Glabe, C.; Readhead, B.; Dudley, J.T.; Blitzer, R.D.; Wang, M.; et al. Deficiency of TYROBP, an adapter protein for TREM2 and CR3 receptors, is neuroprotective in a mouse model of early Alzheimer’s pathology. Acta Neuropathol. 2017, 134, 769–788. [Google Scholar] [CrossRef]
  94. Datta, M.; Staszewski, O.; Raschi, E.; Frosch, M.; Hagemeyer, N.; Tay, T.L.; Blank, T.; Kreutzfeldt, M.; Merkler, D.; Ziegler-Waldkirch, S.; et al. Histone Deacetylases 1 and 2 Regulate Microglia Function during Development, Homeostasis, and Neurodegeneration in a Context-Dependent Manner. Immunity 2018, 48, 514–529. [Google Scholar] [CrossRef]
  95. Cavalli, G.; Heard, E. Advances in epigenetics link genetics to the environment and disease. Nature 2019, 571, 489–499. [Google Scholar] [CrossRef] [Green Version]
  96. Freilich, R.W.; Woodbury, M.E.; Ikezu, T. Integrated expression profiles of mRNA and miRNA in polarized primary murine microglia. PLoS ONE 2013, 8, e79416. [Google Scholar] [CrossRef]
  97. Butovsky, O.; Jedrychowski, M.P.; Moore, C.S.; Cialic, R.; Lanser, A.J.; Gabriely, G.; Koeglsperger, T.; Dake, B.; Wu, P.M.; Doykan, C.E.; et al. Identification of a unique TGF-β-dependent molecular and functional signature in microglia. Nat. Neurosci. 2014, 17, 131–143. [Google Scholar] [CrossRef]
  98. Van Dam, S.; Võsa, U.; van der Graaf, A.; Franke, L.; de Magalhães, J.P. Gene co-expression analysis for functional classification and gene-disease predictions. Brief. Bioinform. 2018, 19, 575–592. [Google Scholar] [CrossRef]
  99. Iancu, O.D.; Colville, A.; Oberbeck, D.; Darakjian, P.; McWeeney, S.K.; Hitzemann, R. Cosplicing network analysis of mammalian brain RNA-Seq data utilizing WGCNA and Mantel correlations. Front. Genet. 2015, 6, 174. [Google Scholar] [CrossRef]
  100. Dai, C.; Li, W.; Liu, J.; Zhou, X.J. Integrating many co-splicing networks to reconstruct splicing regulatory modules. BMC Syst. Biol. 2012, 6, S17. [Google Scholar] [CrossRef]
  101. Raj, T.; Li, Y.I.; Wong, G.; Humphrey, J.; Wang, M.; Ramdhani, S.; Wang, Y.-C.; Ng, B.; Gupta, I.; Haroutunian, V.; et al. Integrative transcriptome analyses of the aging brain implicate altered splicing in Alzheimer’s disease susceptibility. Nat. Genet. 2018, 50, 1584–1592. [Google Scholar] [CrossRef] [PubMed]
  102. Yeh, F.L.; Wang, Y.; Tom, I.; Gonzalez, L.C.; Sheng, M. TREM2 Binds to Apolipoproteins, Including APOE and CLU/APOJ, and Thereby Facilitates Uptake of Amyloid-Beta by Microglia. Neuron 2016, 91, 328–340. [Google Scholar] [CrossRef] [PubMed]
  103. Kim, Y.-K.; Song, J. The Role of Long Noncoding RNAs in Diabetic Alzheimer’s Disease. J. Clin. Med. Res. 2018, 7, 461. [Google Scholar] [CrossRef]
  104. Mostafavi, S.; Gaiteri, C.; Sullivan, S.E.; White, C.C.; Tasaki, S.; Xu, J.; Taga, M.; Klein, H.-U.; Patrick, E.; Komashko, V.; et al. A molecular network of the aging human brain provides insights into the pathology and cognitive decline of Alzheimer’s disease. Nat. Neurosci. 2018, 21, 811–819. [Google Scholar] [CrossRef]
  105. Zhang, Y.; Chen, K.; Sloan, S.A.; Bennett, M.L.; Scholze, A.R.; O’Keeffe, S.; Phatnani, H.P.; Guarnieri, P.; Caneda, C.; Ruderisch, N.; et al. An RNA-sequencing transcriptome and splicing database of glia, neurons, and vascular cells of the cerebral cortex. J. Neurosci. 2014, 34, 11929–11947. [Google Scholar] [CrossRef] [PubMed]
  106. Vagnoni, A.; Perkinton, M.S.; Gray, E.H.; Francis, P.T.; Noble, W.; Miller, C.C.J. Calsyntenin-1 mediates axonal transport of the amyloid precursor protein and regulates Aβ production. Hum. Mol. Genet. 2012, 21, 2845–2854. [Google Scholar] [CrossRef]
  107. Johnson, E.C.B.; Dammer, E.B.; Duong, D.M.; Yin, L.; Thambisetty, M.; Troncoso, J.C.; Lah, J.J.; Levey, A.I.; Seyfried, N.T. Deep proteomic network analysis of Alzheimer’s disease brain reveals alterations in RNA binding proteins and RNA splicing associated with disease. Mol. Neurodegener. 2018, 13, 52. [Google Scholar] [CrossRef] [PubMed]
  108. Zhao, Z.; Sagare, A.P.; Ma, Q.; Halliday, M.R.; Kong, P.; Kisler, K.; Winkler, E.A.; Ramanathan, A.; Kanekiyo, T.; Bu, G.; et al. Central role for PICALM in amyloid-β blood-brain barrier transcytosis and clearance. Nat. Neurosci. 2015, 18, 978–987. [Google Scholar] [CrossRef]
  109. Wes, P.D.; Holtman, I.R.; Boddeke, E.W.G.M.; Möller, T.; Eggen, B.J.L. Next generation transcriptomics and genomics elucidate biological complexity of microglia in health and disease. Glia 2016, 64, 197–213. [Google Scholar] [CrossRef] [PubMed]
  110. Magistri, M.; Velmeshev, D.; Makhmutova, M.; Faghihi, M.A. Transcriptomics Profiling of Alzheimer’s Disease Reveal Neurovascular Defects, Altered Amyloid-β Homeostasis, and Deregulated Expression of Long Noncoding RNAs. J. Alzheimer Dis. 2015, 48, 647–665. [Google Scholar] [CrossRef]
  111. Hu, G.; Liao, K.; Niu, F.; Yang, L.; Dallon, B.W.; Callen, S.; Tian, C.; Shu, J.; Cui, J.; Sun, Z.; et al. Astrocyte EV-Induced lincRNA-Cox2 Regulates Microglial Phagocytosis: Implications for Morphine-Mediated Neurodegeneration. Mol. Ther. Nucl. Acids 2018, 13, 450–463. [Google Scholar] [CrossRef] [PubMed] [Green Version]
  112. Litvinchuk, A.; Wan, Y.-W.; Swartzlander, D.B.; Chen, F.; Cole, A.; Propson, N.E.; Wang, Q.; Zhang, B.; Liu, Z.; Zheng, H. Complement C3aR Inactivation Attenuates Tau Pathology and Reverses an Immune Network Deregulated in Tauopathy Models and Alzheimer’s Disease. Neuron 2018, 100, 1337–1353. [Google Scholar] [CrossRef] [PubMed]
  113. Yoshiyama, Y.; Higuchi, M.; Zhang, B.; Huang, S.-M.; Iwata, N.; Saido, T.C.; Maeda, J.; Suhara, T.; Trojanowski, J.Q.-Y.; Lee, V.M. Synapse Loss and Microglial Activation Precede Tangles in a P301S Tauopathy Mouse Model. Neuron 2007, 53, 337–351. [Google Scholar] [CrossRef] [PubMed] [Green Version]
  114. Vasek, M.J.; Garber, C.; Dorsey, D.; Durrant, D.M.; Bollman, B.; Soung, A.; Yu, J.; Perez-Torres, C.; Frouin, A.; Wilton, D.K.; et al. A complement-microglial axis drives synapse loss during virus-induced memory impairment. Nature 2016, 534, 538–543. [Google Scholar] [CrossRef]
  115. Lian, H.; Litvinchuk, A.; Chiang, A.C.-A.; Aithmitti, N.; Jankowsky, J.L.; Zheng, H. Astrocyte-Microglia Cross Talk through Complement Activation Modulates Amyloid Pathology in Mouse Models of Alzheimer’s Disease. J. Neurosci. 2016, 36, 577–589. [Google Scholar] [CrossRef] [PubMed]
  116. Xiong, C.; Liu, J.; Lin, D.; Zhang, J.; Terrando, N.; Wu, A. Complement activation contributes to perioperative neurocognitive disorders in mice. J. Neuroinflamm. 2018, 15, 254. [Google Scholar] [CrossRef]
  117. Hao, Y.; Yang, X.; Chen, C.; Yuan, W.; Wang, X.; Li, M.; Yu, Z. STAT3 signalling pathway is involved in the activation of microglia induced by 2.45 GHz electromagnetic fields. Int. J. Radiat. Biol. 2010, 86, 27–36. [Google Scholar] [CrossRef]
  118. Wang, H.; Li, Y.; Ryder, J.W.; Hole, J.T.; Ebert, P.J.; Airey, D.C.; Qian, H.-R.; Logsdon, B.; Fisher, A.; Ahmed, Z.; et al. Genome-wide RNAseq study of the molecular mechanisms underlying microglia activation in response to pathological tau perturbation in the rTg4510 tau transgenic animal model. Mol. Neurodegener. 2018, 13, 65. [Google Scholar] [CrossRef]
  119. Wes, P.D.; Easton, A.; Corradi, J.; Barten, D.M.; Devidze, N.; DeCarr, L.B.; Truong, A.; He, A.; Barrezueta, N.X.; Polson, C.; et al. Tau Overexpression Impacts a Neuroinflammation Gene Expression Network Perturbed in Alzheimer’s Disease. PLoS ONE 2014, 9, e106050. [Google Scholar] [CrossRef]
  120. Zhang, B.; Gaiteri, C.; Bodea, L.-G.; Wang, Z.; McElwee, J.; Podtelezhnikov, A.A.; Zhang, C.; Xie, T.; Tran, L.; Dobrin, R.; et al. Integrated Systems Approach Identifies Genetic Nodes and Networks in Late-Onset Alzheimer’s Disease. Cell 2013, 153, 707–720. [Google Scholar] [CrossRef]
  121. Grabert, K.; Michoel, T.; Karavolos, M.H.; Clohisey, S.; Baillie, J.K.; Stevens, M.P.; Freeman, T.C.; Summers, K.M.; McColl, B.W. Microglial brain region-dependent diversity and selective regional sensitivities to aging. Nat. Neurosci. 2016, 19, 504–516. [Google Scholar] [CrossRef]
  122. Readhead, B.; Haure-Mirande, J.-V.; Funk, C.C.; Richards, M.A.; Shannon, P.; Haroutunian, V.; Sano, M.; Liang, W.S.; Beckmann, N.D.; Price, N.D.; et al. Multiscale Analysis of Independent Alzheimer’s Cohorts Finds Disruption of Molecular, Genetic, and Clinical Networks by Human Herpesvirus. Neuron 2018, 99, 64–82. [Google Scholar] [CrossRef]
  123. Chen, G.; Ning, B.; Shi, T. Single-Cell RNA-Seq Technologies and Related Computational Data Analysis. Front. Genet. 2019, 10, 317. [Google Scholar] [CrossRef]
  124. Birnbaum, K.D. Power in Numbers: Single-Cell RNA-Seq Strategies to Dissect Complex Tissues. Annu. Rev. Genet. 2018, 52, 203–221. [Google Scholar] [CrossRef]
  125. Luecken, M.D.; Theis, F.J. Current best practices in single-cell RNA-seq analysis: A tutorial. Mol. Syst. Biol. 2019, 15, e8746. [Google Scholar] [CrossRef]
  126. Eraslan, G.; Simon, L.M.; Mircea, M.; Mueller, N.S.; Theis, F.J. Single-cell RNA-seq denoising using a deep count autoencoder. Nat. Commun. 2019, 10, 390. [Google Scholar] [CrossRef]
  127. Todorov, H.; Cannoodt, R.; Saelens, W.; Saeys, Y. Network Inference from Single-Cell Transcriptomic Data. Methods Mol. Biol. 2019, 1883, 235–249. [Google Scholar]
  128. Xu, R.; Nettleton, D.; Nordman, D.J. Case-Specific Random Forests. J. Comput. Graph. Stat. 2016, 25, 49–65. [Google Scholar] [CrossRef]
  129. Saelens, W.; Cannoodt, R.; Todorov, H.; Saeys, Y. A comparison of single-cell trajectory inference methods. Nat. Biotechnol. 2019, 37, 547–554. [Google Scholar] [CrossRef]
  130. Matsumoto, H.; Kiryu, H.; Furusawa, C.; Ko, M.S.H.; Ko, S.B.H.; Gouda, N.; Hayashi, T.; Nikaido, I. SCODE: An efficient regulatory network inference algorithm from single-cell RNA-Seq during differentiation. Bioinformatics 2017, 33, 2314–2321. [Google Scholar] [CrossRef]
  131. Lummertz da Rocha, E.; Rowe, R.G.; Lundin, V.; Malleshaiah, M.; Jha, D.K.; Rambo, C.R.; Li, H.; North, T.E.; Collins, J.J.; Daley, G.Q. Reconstruction of complex single-cell trajectories using CellRouter. Nat. Commun. 2018, 9, 892. [Google Scholar] [CrossRef]
  132. Aibar, S.; González-Blas, C.B.; Moerman, T.; Huynh-Thu, V.A.; Imrichova, H.; Hulselmans, G.; Rambow, F.; Marine, J.-C.; Geurts, P.; Aerts, J.; et al. SCENIC: Single-cell regulatory network inference and clustering. Nat. Methods 2017, 14, 1083–1086. [Google Scholar] [CrossRef]
  133. Keren-Shaul, H.; Spinrad, A.; Weiner, A.; Matcovitch-Natan, O.; Dvir-Szternfeld, R.; Ulland, T.K.; David, E.; Baruch, K.; Lara-Astaiso, D.; Toth, B.; et al. A Unique Microglia Type Associated with Restricting Development of Alzheimer’s Disease. Cell 2017, 169, 1276–1290. [Google Scholar] [CrossRef]
  134. Liu, W.; Taso, O.; Wang, R.; Garcia-Reitboeck, P.; Andrews, W.D.; Piers, T.M.; Pocock, J.M.; Cummings, D.M.; Hardy, J.; Edwards, F.A.; et al. Trem2 promotes anti-inflammatory responses in microglia and is suppressed under pro-inflammatory conditions. bioRxiv 2018, 449884. [Google Scholar]
  135. Iacono, G.; Massoni-Badosa, R.; Heyn, H. Single-cell transcriptomics unveils gene regulatory network plasticity. Genome Biol. 2019, 20, 110. [Google Scholar] [CrossRef] [Green Version]
  136. Matcovitch-Natan, O.; Winter, D.R.; Giladi, A.; Vargas Aguilar, S.; Spinrad, A.; Sarrazin, S.; Ben-Yehuda, H.; David, E.; Zelada Gonzalez, F.; Perrin, P.; et al. Microglia development follows a stepwise program to regulate brain homeostasis. Science 2016, 353, aad8670. [Google Scholar] [CrossRef]
  137. Zeisel, A.; Munoz-Manchado, A.B.; Codeluppi, S.; Lonnerberg, P.; La Manno, G.; Jureus, A.; Marques, S.; Munguba, H.; He, L.; Betsholtz, C.; et al. Cell types in the mouse cortex and hippocampus revealed by single-cell RNA-seq. Science 2015, 347, 1138–1142. [Google Scholar] [CrossRef]
  138. Gjoneska, E.; Pfenning, A.R.; Mathys, H.; Quon, G.; Kundaje, A.; Tsai, L.-H.; Kellis, M. Conserved epigenomic signals in mice and humans reveal immune basis of Alzheimer’s disease. Nature 2015, 518, 365–369. [Google Scholar] [CrossRef]
  139. Suo, S.; Zhu, Q.; Saadatpour, A.; Fei, L.; Guo, G.; Yuan, G.-C. Revealing the Critical Regulators of Cell Identity in the Mouse Cell Atlas. Cell Rep. 2018, 25, 1436–1445. [Google Scholar] [CrossRef]
  140. Tay, T.L.; Dautzenberg, J.; Grün, D.; Prinz, M. Unique microglia recovery population revealed by single-cell RNAseq following neurodegeneration. Acta Neuropathol. Commun. 2018, 6, 87. [Google Scholar] [CrossRef]
  141. Hammond, T.R.; Dufort, C.; Dissing-Olesen, L.; Giera, S.; Young, A.; Wysoker, A.; Walker, A.J.; Gergits, F.; Segel, M.; Nemesh, J.; et al. Single-Cell RNA Sequencing of Microglia throughout the Mouse Lifespan and in the Injured Brain Reveals Complex Cell-State Changes. Immunity 2019, 50, 253–271. [Google Scholar] [CrossRef]
  142. Mathys, H.; Davila-Velderrain, J.; Peng, Z.; Gao, F.; Mohammadi, S.; Young, J.Z.; Menon, M.; He, L.; Abdurrob, F.; Jiang, X.; et al. Single-cell transcriptomic analysis of Alzheimer’s disease. Nature 2019, 570, 332–337. [Google Scholar] [CrossRef]
  143. Chavez-Alvarez, R.; Chavoya, A.; Mendez-Vazquez, A. Discovery of possible gene relationships through the application of self-organizing maps to DNA microarray databases. PLoS ONE 2014, 9, e93233. [Google Scholar] [CrossRef]
  144. Patir, A.; Shih, B.; McColl, B.W.; Freeman, T.C. A core transcriptional signature of human microglia: Derivation and utility in describing region-dependent alterations associated with Alzheimer’s disease. Glia 2019, 67, 1240–1253. [Google Scholar] [CrossRef]
  145. Freeman, T.C.; Goldovsky, L.; Brosch, M.; van Dongen, S.; Mazière, P.; Grocock, R.J.; Freilich, S.; Thornton, J.; Enright, A.J. Construction, visualisation, and clustering of transcription networks from microarray expression data. PLoS Comput. Biol. 2007, 3, 2032–2042. [Google Scholar] [CrossRef]
  146. Friedman, B.A.; Srinivasan, K.; Ayalon, G.; Meilandt, W.J.; Lin, H.; Huntley, M.A.; Cao, Y.; Lee, S.-H.; Haddick, P.C.G.; Ngu, H.; et al. Diverse Brain Myeloid Expression Profiles Reveal Distinct Microglial Activation States and Aspects of Alzheimer’s Disease Not Evident in Mouse Models. Cell Rep. 2018, 22, 832–847. [Google Scholar] [CrossRef]
  147. Baik, S.H.; Kang, S.; Lee, W.; Choi, H.; Chung, S.; Kim, J.-I.; Mook-Jung, I. A Breakdown in Metabolic Reprogramming Causes Microglia Dysfunction in Alzheimer’s Disease. Cell Metab. 2019, 30, 493–507. [Google Scholar] [CrossRef]
  148. Li, T.; Kim, A.; Rosenbluh, J.; Horn, H.; Greenfeld, L.; An, D.; Zimmer, A.; Liberzon, A.; Bistline, J.; Natoli, T.; et al. GeNets: A unified web platform for network-based genomic analyses. Nat. Methods 2018, 15, 543–546. [Google Scholar] [CrossRef]
  149. Lamb, J.; Crawford, E.D.; Peck, D.; Modell, J.W.; Blat, I.C.; Wrobel, M.J.; Lerner, J.; Brunet, J.-P.; Subramanian, A.; Ross, K.N.; et al. The Connectivity Map: Using gene-expression signatures to connect small molecules, genes, and disease. Science 2006, 313, 1929–1935. [Google Scholar] [CrossRef]
  150. Kilgore, M.; Miller, C.A.; Fass, D.M.; Hennig, K.M.; Haggarty, S.J.; David Sweatt, J.; Rumbaugh, G. Inhibitors of Class 1 Histone Deacetylases Reverse Contextual Memory Deficits in a Mouse Model of Alzheimer’s Disease. Neuropsychopharmacology 2010, 35, 870–880. [Google Scholar] [CrossRef]
  151. Cheray, M.; Joseph, B. Epigenetics Control Microglia Plasticity. Front. Cell. Neurosci. 2018, 12, 243. [Google Scholar] [CrossRef] [PubMed] [Green Version]
  152. Rustenhoven, J.; Smith, A.M.; Smyth, L.C.; Jansson, D.; Scotter, E.L.; Swanson, M.E.V.; Aalderink, M.; Coppieters, N.; Narayan, P.; Handley, R.; et al. 1 regulates Alzheimer’s disease-associated genes in primary human microglia. Mol. Neurodegener. 2018, 13, 44. [Google Scholar] [CrossRef]
  153. Mouton-Liger, F.; Rosazza, T.; Sepulveda-Diaz, J.; Ieang, A.; Hassoun, S.-M.; Claire, E.; Mangone, G.; Brice, A.; Michel, P.P.; Corvol, J.-C.; et al. Parkin deficiency modulates NLRP3 inflammasome activation by attenuating an A20-dependent negative feedback loop. Glia 2018, 66, 1736–1751. [Google Scholar] [CrossRef] [PubMed] [Green Version]
  154. Canchi, S.; Raao, B.; Masliah, D.; Rosenthal, S.B.; Sasik, R.; Fisch, K.M.; De Jager, P.L.; Bennett, D.A.; Rissman, R.A. Integrating Gene and Protein Expression Reveals Perturbed Functional Networks in Alzheimer’s Disease. Cell Rep. 2019, 28, 1103–1116. [Google Scholar] [CrossRef]
  155. Greene, C.S.; Krishnan, A.; Wong, A.K.; Ricciotti, E.; Zelaya, R.A.; Himmelstein, D.S.; Zhang, R.; Hartmann, B.M.; Zaslavsky, E.; Sealfon, S.C.; et al. Understanding multicellular function and disease with human tissue-specific networks. Nat. Genet. 2015, 47, 569–576. [Google Scholar] [CrossRef] [PubMed] [Green Version]
  156. Duclot, F.; Kabbaj, M. The Role of Early Growth Response 1 (EGR1) in Brain Plasticity and Neuropsychiatric Disorders. Front. Behav. Neurosci. 2017, 11, 35. [Google Scholar] [CrossRef] [PubMed] [Green Version]
  157. Marttinen, M.; Paananen, J.; Neme, A.; Mitra, V.; Takalo, M.; Natunen, T.; Paldanius, K.M.A.; Mäkinen, P.; Bremang, M.; Kurki, M.I.; et al. A multiomic approach to characterize the temporal sequence in Alzheimer’s disease-related pathology. Neurobiol. Dis. 2019, 124, 454–468. [Google Scholar] [CrossRef]
  158. Roussarie, J.-P.; Yao, V.; Plautz, Z.; Kasturia, S.; Albornoz, C.; Schmidt, E.F.; Brichta, L.; Barnea-Cramer, A.; Heintz, N.; Hof, P.; et al. Selective neuronal vulnerability in Alzheimer’s disease: A network-based analysis. bioRxiv 2018, 499897. [Google Scholar]
  159. Hong, S.; Beja-Glasser, V.F.; Nfonoyim, B.M.; Frouin, A.; Li, S.; Ramakrishnan, S.; Merry, K.M.; Shi, Q.; Rosenthal, A.; Barres, B.A.; et al. Complement and microglia mediate early synapse loss in Alzheimer mouse models. Science 2016, 352, 712–716. [Google Scholar] [CrossRef] [Green Version]
  160. Floden, A.M.; Li, S.; Combs, C.K. Beta-amyloid-stimulated microglia induce neuron death via synergistic stimulation of tumor necrosis factor alpha and NMDA receptors. J. Neurosci. 2005, 25, 2566–2575. [Google Scholar] [CrossRef]
  161. Ulland, T.K.; Song, W.M.; Huang, S.C.-C.; Ulrich, J.D.; Sergushichev, A.; Beatty, W.L.; Loboda, A.A.; Zhou, Y.; Cairns, N.J.; Kambal, A.; et al. TREM2 Maintains Microglial Metabolic Fitness in Alzheimer’s Disease. Cell 2017, 170, 649–663. [Google Scholar] [CrossRef]
  162. Lee, C.Y.D.; Daniel Lee, C.Y.; Landreth, G.E. The role of microglia in amyloid clearance from the AD brain. J. Neural Transm. 2010, 117, 949–960. [Google Scholar] [CrossRef] [Green Version]
  163. Bernhardi, R.V.O.N.; Von Bernhardi, R.; Ramirez, G. Microglia–Astrocyte interaction in Alzheimer’s disease: Friends or foes for the nervous system? Biol. Res. 2001, 34, 123–128. [Google Scholar] [CrossRef]
  164. Szepesi, Z.; Manouchehrian, O.; Bachiller, S.; Deierborg, T. Bidirectional Microglia–Neuron Communication in Health and Disease. Front. Cell. Neurosci. 2018, 12, 323. [Google Scholar] [CrossRef]
  165. Stuart, T.; Satija, R. Integrative single-cell analysis. Nat. Rev. Genet. 2019, 20, 257–272. [Google Scholar] [CrossRef]
Figure 1. Schematic overview showing the workflow for gene network inference, from transcriptomic data generation to integration of regulatory information to assess gene regulatory networks.
Genes 10 00798 g001
Figure 2. Network representation of Triggering Receptor Expressed on Myeloid Cells 2 (TREM2) and its interacting partners in the context of the switch from homeostatic microglia to damage-associated microglia (DAM). Only representative genes are shown in the network. Hence, the genes included in this TREM2-network are neither comprehensive nor exhaustive of the processes, transcriptional networks or signature they belong to. However, several transcriptional gene network studies demonstrated the role of TREM2 at the center of a complex interplay between cellular processes (e.g., synapse loss and neuronal pruning) and multifold genetic and epigenetic regulators, which account for the dynamic nature and functions of microglia in AD. Representative genes shown are taken from Rangaraju et al. (2018) [62], Litvinchuk et al. (2018) [112], Keren-Shaul et al. (2017) [133], Matcovitch-Natan et al. (2016) [136], and Zhang et al. (2013) [120].
Genes 10 00798 g002
Table 1. Overview of the relevant biological insights into Alzheimer’s disease (AD) pathology obtained by transcriptional gene network analysis, which was performed using different transcriptomic technologies, species, tissue types and network inference approaches.
Insights into AD PathologyTechnologySpecies
- Tissue type
Network Inference MethodReferences
-Upregulation of neural signaling elements and pro-inflammatory elementsMicroarrayHuman
- Hippocampal CA1
Cluster analysis[78]
-CD4, DCN, and IL8 extracellular ligands linked to disease initiation
-Implication of miRNA-networks in AD pathogenesis
MicroarrayHuman
- Hippocampal CA1
- Entorhinal Cortex
Network Topology Analysis[82]
-PSEN1 is strongly associated with myelin proteins
-Conservation of modules for metabolism and synaptic plasticity conserved between AD and aging
MicroarrayHuman
- Hippocampal CA1
WGCNA[88]
-Apoe implicated as a general aging gene and associated with syndromic learning impairmentMicroarrayRat
- Hippocampus
Ingenuity Pathway Analysis (IPA)[83]
-Cdk5r1, Dlg3, Kcnab2, and Mapk1, and Camk1g identified as hub network genes and associated with ion signaling and learningMicroarrayRat
- Hippocampus
WGCNA[86]
-TYROBP, PTPRC, ITGB2, and Trem2 identified as “hub” genes in AD gene networks in humans and mice, respectively
-Conservation of genes across humans and mice AD
Microarray
RNA-Seq
Human
- Prefrontal Cortex
- Substantia Nigra
Mouse
- Hippocampus
WGCNA[91,92]
-Role of splicing quantitative trait loci and co-splicing gene networks in AD
-CLU, PICALM, and PTK2B show unique splicing mechanisms in AD
RNA-SeqHuman
- Dorsolateral Prefrontal Cortex
WGCNA
GeNets
[101,148]
-PARK2 associated with NLRP3 inflammasome in microglia activation
- 6 FDA-approved drugs (Cefuroxime, Cyproterone, Dydrogesterone, Metrizamide, Trimethadione, and Vorinostat) predicted to modulate microglia master regulators
MicroarrayHuman
- Hippocampus
ARACNE (Algorithm for the Reconstruction of Accurate Cellular Networks)[63,64]
-Role of splicing gene networks of microglia in AD, and identification of App and Clstn1 as differentially spliced
-Splicing occurs differentially across different cell types in AD brain
RNA-SeqMouse
- Cortex
WGCNA[105]
-Alternative exon-exon junction splicing in AD brainRNA-SeqHuman
- Dorsolateral Prefrontal Cortex
WGCNA[107]
-C3-C3ar signaling associated with viral-synapse loss and reactive astrocytes, and its downregulation reduces tau pathology
-Spi1, Trem2, and Ms4a6a part of C3ar gene network
RNA-SeqHuman
- Parahippocampal Gyrus
Mice
- Hippocampus
Correlation-based[112]
-TYROBP identified as a key regulator in a microglia module controlling phagocytosis
-Different brain regions have different regulators
-Functional gene networks identified for prefrontal cortex including complements and cytokine networks
RNA-SeqHuman
- Dorsolateral Prefrontal Cortex
- Visual Cortex
- Cerebellum
Module Differential Connectivity (MDC)
Causal probabilistic Bayesian
[120]
-Dissection of Damage-Associated Microglia(DAM) into pro-inflammatory and anti-inflammatory modulesMicroarray
Nanostring
Mouse
- Whole brain
WGCNA[62]
-Trem2 network becomes sparser with AD pathogenesis; specifically, genes that lost connectivity overlap with Trem1-dependent genes in monocytesscRNA-seqMouse
- Cortex
- Hippocampus
Correlation-based[135]
-Identification of master microglia gene regulators including PU.1/Ets family of TFs, Nfkb, Irf, and AP-1/Maf
-Microglia gene network upregulation in AD
scRNA-seqMouse
- Cortex
- Hippocampus
SCENIC (Single Cell Regulatory Network Inference and Clustering)[132]
-Identification of microglia immune network containing Mafb, Irf2, and Nfkb1scRNA-seqMouse
- Brain
SCENIC[139]
-APOE, TREM2, MEF2C, and PICALM implicated in microglia gene-trait correlation modulesscRNA-seqHuman
- Prefrontal Cortex
SOM (Self Organizing Maps)[142]

