Article

Comparison of the Whole-Plastome Sequence between the Bonin Islands Endemic Rubus boninensis and Its Close Relative, Rubus trifidus (Rosaceae), in the Southern Korean Peninsula

1
Department of Biology, Research Institute for Dok-do and Ulleung-do Island, School of Life Sciences, Kyungpook National University, 80 Daehak-ro, Buk-gu, Daegu, Gyeongsangbuk-do 41566, Korea
2
Department of Botany, Graduate School of Science, Kyoto University, Oiwake-cho, Kitashirakawa, Sakyo-ku, Kyoto 606-8502, Japan
3
Department of Biological Sciences, Sungkyunkwan University, 2066 Seobu-ro, Suwon, Gyeonggi-do 16419, Korea
*
Authors to whom correspondence should be addressed.
Genes 2019, 10(10), 774; https://doi.org/10.3390/genes10100774
Submission received: 20 August 2019 / Revised: 19 September 2019 / Accepted: 27 September 2019 / Published: 2 October 2019
(This article belongs to the Section Population and Evolutionary Genetics and Genomics)

Abstract

:
Rubus boninensis is a rare endemic species found on the Bonin Islands with a very restricted distribution. It is morphologically most closely related to Rubus trifidus, occurring widely in the southern Korean peninsula and Japan. This species pair provides a good example of anagenetic speciation on an oceanic island in the northwestern Pacific Ocean—R. trifidus as a continental progenitor and R. boninensis as an insular derivative species. In this study, we firstly characterized the complete plastome of R. boninensis and R. trifidus and compared this species pair to another anagenetically derived species pair (R. takesimensis–R. crataegifolius). The complete plastome of R. trifidus was 155,823 base pairs (bp) long, slightly longer (16 bp) than that of R. boninensis (155,807 bp). No structural or content rearrangements were found between the species pair. Eleven hotspot regions, including trnH/psbA, were identified between R. trifidus and R. boninensis. Phylogenetic analysis of 19 representative plastomes within the family Rosaceae suggested sister relationships between R. trifidus and R. boninensis, and between R. crataegifolius and R. takesimensis. The plastome resources generated by the present study will help elucidate plastome evolution and resolve phylogenetic relationships within highly complex and reticulated lineages of the genus Rubus.

1. Introduction

The Bonin Islands, also known as the Ogasawara Islands, consist of 25 small islands (>0.1 km2) and many islets scattered in the region of 24°14’–27°44’ N and 140°52’–142°15’ E, and are located approximately 1000 km directly south of the Japanese archipelago [1,2]. The Bonin Islands consist of two island groups, i.e., Ogasawara Group (Hahajima, Chichijima, and Mukojima) and Volcano Group (Kitaiwojima, Iwojima, and Minamiiwojima). The Ogasawara Group is a group of three aggregated islands, and are aligned from south to north, i.e., Hahajima, Chichijima, and Mukojima. Although they were formed during the Paleogene period, their uplift started in the Pleistocene epoch, exposing the landmass above the sea level before the middle Pleistocene epoch [3,4]. Therefore, organisms presumably started colonization from the late Pliocene to early Pleistocene epochs [5,6,7]. Of the 369 indigenous vascular plant species, approximately 40% of them are endemic to the Bonin Islands, originating from the surrounding continental regions, including southeastern Asia, Taiwan, and the Japanese mainland, primarily via allopatric speciation [8,9,10,11]. A recent study of Liparis hostifolia (Orchidaceae) also suggested that some endemic taxa likely originated from temperate East Asia, including Japan, Korean Peninsula, China, and Russia [12]. Furthermore, some endemic groups (e.g., land snail; genus Mandarina) have undergone accelerated morphological and ecological divergence during adaptive radiations within the archipelago [6,7]. The high plant endemism of the Bonin Islands makes this archipelago an ideal setting for investigating allopatric speciation and adaptive radiation.
Unlike the Ogasawara Group of the Bonin Islands, some islands in the northwestern Pacific Ocean, such as the Izu Islands, the Volcano Group of the Bonin Islands, and the Northern Marianas Islands, are considered geologically to be much younger. In particular, the Volcano Group of the Bonin Islands is a group of three islands (i.e., Kitaiwojima, Iwojima, and Minamiiwojima, aligned from north to south) situated south of the Ogasawara Group of the Bonin Islands and are geologically much younger, from an approximate age of 140,000 years for Kitaiwojima to 30,000 years for Minamiiwojima [13]. Based on the floristic surveys of Minamiiwojima, 135 vascular plant species have been recorded, nine of which are considered to be endemic to the Volcano Group of the Bonin Islands [12,14]. Approximately 70% of vascular plants are commonly distributed on two other islands of the Volcano group, and approximately 70% also occur on the Ogasawara Group of the Bonin Islands [15]. In addition, closely related congeneric vascular plant species often do not occur on the same Volcano Group Islands, suggesting rare additional speciation events within the islands and a primary role of geographical isolation for the origin of endemic species on the Volcano Islands [9,10,11]. Compared to other oceanic archipelagoes [16], the endemic species of the Bonin Islands (a total of 118 endemic species) presumably evolved via anagenetic speciation (53%) and the remaining (47%) by cladogenetic speciation.
Of the several woody representative genera of the family Rosaceae occurring on the Bonin Islands (i.e., Osteomeles, Photinia, Rhaphiolepis, and Rubus), the genus Rubus is of great interest, given its diversity and rarity on the islands. Three species of Rubus occur on the Bonin Islands: R. boninensis, R. nishimuranus, and R. nakaii. All but one species, R. nishimuranus (subgenus Idaeobatus), belong to the subgenus Anoplobatus. Rubus nakaii is one of the critically endangered (CR) species, with rare but wide distribution on the Bonin Islands, while R. nishimuranus is a common indigenous species. Rubus nakaii differs primarily from R. trifidus and R. boninensis by having a solitary nodding inflorescence or two flowers instead of an erect corymbose inflorescence [17,18]. Rubus trifidus occurs widely in the southern Korean peninsula and along the Pacific coastal area of the Japanese archipelago (Shikoku, Kyushu, and the northern range limit of Honshu-Aomori Prefecture). In particular, R. boninensis, the focus of our interest, is a rare endemic plant restricted to the Volcano Islands (Kitaiwojima and Minamiiwojima) and shows limited distribution in the Bonin Islands [18]. Owing to its narrow geographic distribution and poor documentation, very little information on the biology and evolutionary relationship of R. boninensis is known. Although the phylogenetic position of R. boninensis has never been formally determined, morphologically it is most closely related to R. trifidus. However, the former can be distinguished from the later based on a few diagnostic features, such as tri-lobed immature leaves, 3–5 cleft or simple leaves, glandular calyx tube and pedicels, and red drupelets at maturity [18,19]. Our global-scale phylogenetic framework of the genus Rubus [20] clearly demonstrated that R. trifidus is sister to R. boninensis, suggesting a relationship of a continental progenitor and anagenetically derived insular endemic species, respectively. However, as a precise continental source area (i.e., either Japanese archipelago or Korean peninsula, given its native distribution in these areas), the relationships among populations of R. trifidus and patterns of genetic diversity and differentiation of R. boninensis compared to that of R. trifidus (a putative continental progenitor) are yet to be determined.
Resembling the species pair R. boninensisR. trifidus as an example of anagenetic speciation found in the northwestern Pacific Ocean, a different pair of progenitor and derivative species via anagenetic speciation can be found on Ulleung Island in East Sea/Sea of Japan, located between the Korean peninsula and the Japanese archipelago. Rubus takesimensis (subgenus Idaeobatus) is the only endemic species of Rubus to Ulleung Island, which is an oceanic volcanic island with an estimated age of 1.8 Myr. Compared to its continental progenitor, R. crataegifolius, which occurs rather widely in northeastern Asia (China, Japan, Korea, and Russian Far East), R. takesimensis is characterized by a lack of prominent prickles (i.e., loss of defense mechanism) and an overall large status of plants (i.e., insular gigantism) as a response to release from selection pressure of herbivores and due to the fact of its moderate insular climatic setting, respectively. Ulleung Island is known for unusually high levels of anagenetic speciation (at least 88% of vascular endemic species), mainly driven by a lack of vegetation heterogeneity, younger island age, and low elevation [16]. Recently, we demonstrated a sister relationship between this continental progenitor (R. crataegifolius) and insular derivative (R. takesimensis) species pair and investigated the population genetic structure among them [20,21]. In addition, we compared the complete plastome sequences of R. crataegifolius and R. takesimensis and characterized their molecular evolution, identifying mutational hotspot regions [22]. The example of anagenetic speciation of Rubus found in East Sea/Sea of Japan, R. crataegifoliusR. takesimensis, and another example found in the northwestern Pacific Ocean, R. trifidusR. boninensis, could be an ideal system to investigate genome evolution of organelles during anagenetic speciation on ocean islands.
In this study, we determined two complete plastome sequences of the insular derivative, R. boninensis, and the continental progenitor, R. trifidus, in the northwestern Pacific Ocean, and compared them to two previously reported plastomes of an anagenetically derived species pair in the East Sea/Sea of Japan. This allowed us to characterize the plastome sequences of two anagenetically derived species in different oceanic islands and to reveal any molecular changes occurring during anagenetic speciation. In addition, we hoped to identify mutation hotspots in the plastomes of R. boninensis and R. trifidus belonging to subgenus Anoplabatus. Such plastome hotspot regions could then be utilized as efficient maternally inherited molecular markers for phylogeographic and population genetic study of the Rubus species belonging to subgenus Anoplabatus. Lastly, this study aimed to develop simple sequence repeat (SSR) markers based on R. boninensis to discriminate closely related congeneric species of Rubus. Taken together, the results of this comparative plastome study will shed new light on chloroplast genome structure and evolution of insular endemic species pairs during anagenetic speciation and contribute to the development of chloroplast markers based on mutation hotspot regions, thereby facilitating resolution of phylogenetic relationships among closely congeneric species of Rubus.

2. Materials and Methods

2.1. Plastome Sequencing and Annotation

Fresh leaves of a single plant of R. boninensis were collected from the Volcano Islands group in the Bonin Islands (i.e., Minamiiwojima), Japan (voucher specimen: KYO_Takayama17062202). Similarly, leaves of R. trifidus were collected from Yigidae, Busan, southern part of Korea peninsula (voucher specimen: KNU_Yigidae180513) and dried with silica gel before DNA extraction. Total DNA was isolated by using the DNeasy Plant Mini Kit (Qiagen, Carlsbad, CA, USA) and sequenced with an Illumina HiSeq 4000 (Illumina, Inc., San Diego, CA, USA), yielding 150 bp paired-end read length, at Macrogen Corporation (Seoul, Korea). A total of 22,273,138 and 43,891,068 paired-end reads were obtained for R. boninensis and R. trifidus, respectively, and assembled de novo using Velvet v. 1.2.10 with multiple k-mers [23]. The tRNAs were confirmed using with tRNAscan-SE [24]. Annotation was conducted using Geneious R10 [25] and the annotated plastome sequences were submitted to GenBank (accession numbers MH734123 and MK465682 for R. boninensis and R. trifidus, respectively). The annotated GenBank format sequence file was used to draw a circular map with OGDRAW program v1.2 [26].

2.2. Comparative Plastome Analysis

The complete plastomes of R. boninensis and R. trifidus were compared to those of two other Rubus species, R. crataegifolius (MG189543) and R. takesimensis (MH734123), using mVISTA [27] in Shuffle-LAGAN mode [28]. The four Rubus plastome sequences were aligned with MAFFT v. 7 [29] and adjusted manually with Geneious [25]. By using DnaSP v. 6.10 software [30], a sliding window analysis with a step size of 200 bp and window length of 800 bp was carried out to determine the nucleotide diversity (Pi) of the plastome. The codon usage frequency was calculated using MEGA7 [31] with relative synonymous codon usage (RSCU) value [32], which is a simple measure of non-uniform usage of synonymous codons in a coding sequence. The DNA code used by bacteria, archaea, prokaryotic viruses, and chloroplast proteins was used [33].

2.3. Tandem Repeat and Microsatellite Analysis

Microsatellite or SSR markers were identified in the plastome sequences by using MISA [34] with minimum repeat thresholds of ten for mononucleotide repeats, four for dinucleotide repeats, four for trinucleotide repeats, four for tetranucleotide repeats, four for pentanucleotide repeats, and three for hexanucleotide repeats [22].

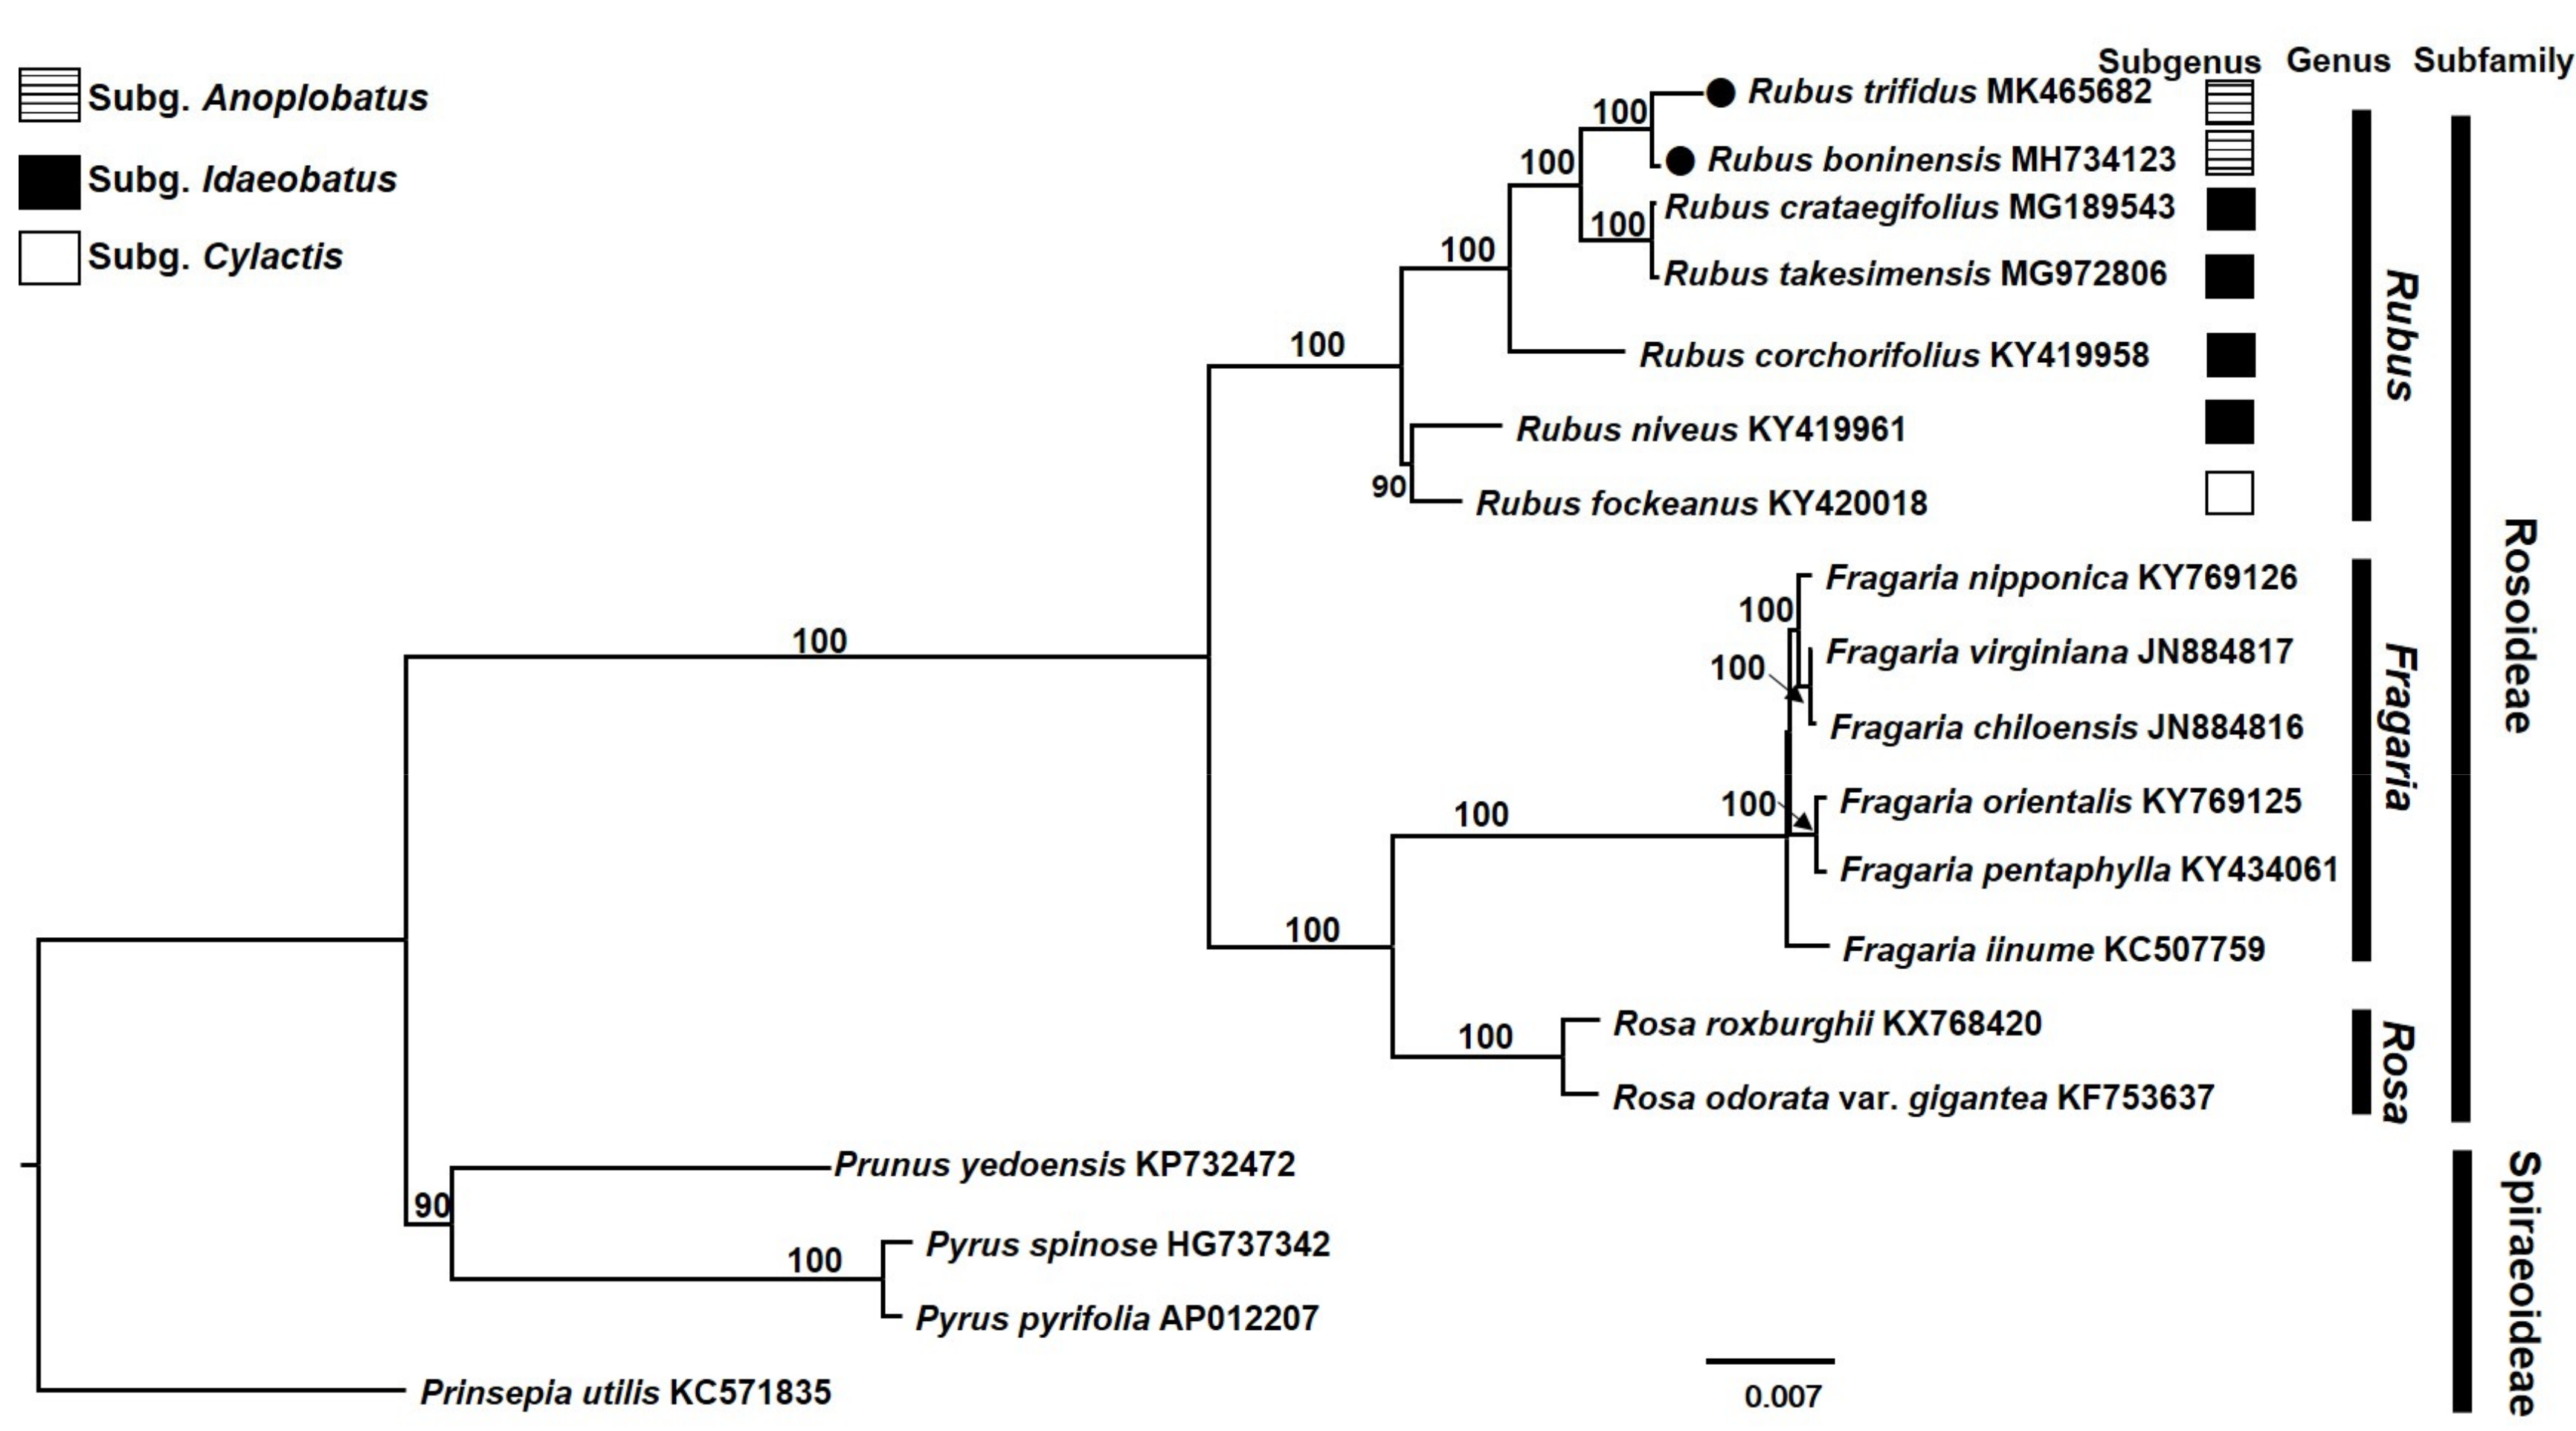
2.4. Phylogenetic Analysis

For the phylogenetic analysis, the complete plastome sequences of 18 representative species from the family Rosaceae (seven species from Rubus, including R. corchorifolius (KY419958), R. niveus (KY419961), and R. fockeanus (KY420018); six species from Fragaria; two species from Rosa; one species from Prunus; two species from Pyrus; and one species from Prinsepia) were aligned with MAFFT v. 7 [29] in Geneious [25]. Maximum likelihood (ML) analysis based on the best-fit model of TVM+F+R2 was conducted with IQ-TREE v. 1.4.2 [35]. Prinsepia utilis was used as an outgroup, and non-parametric bootstrap analysis was performed with 1000 replicates.

3. Results and Discussion

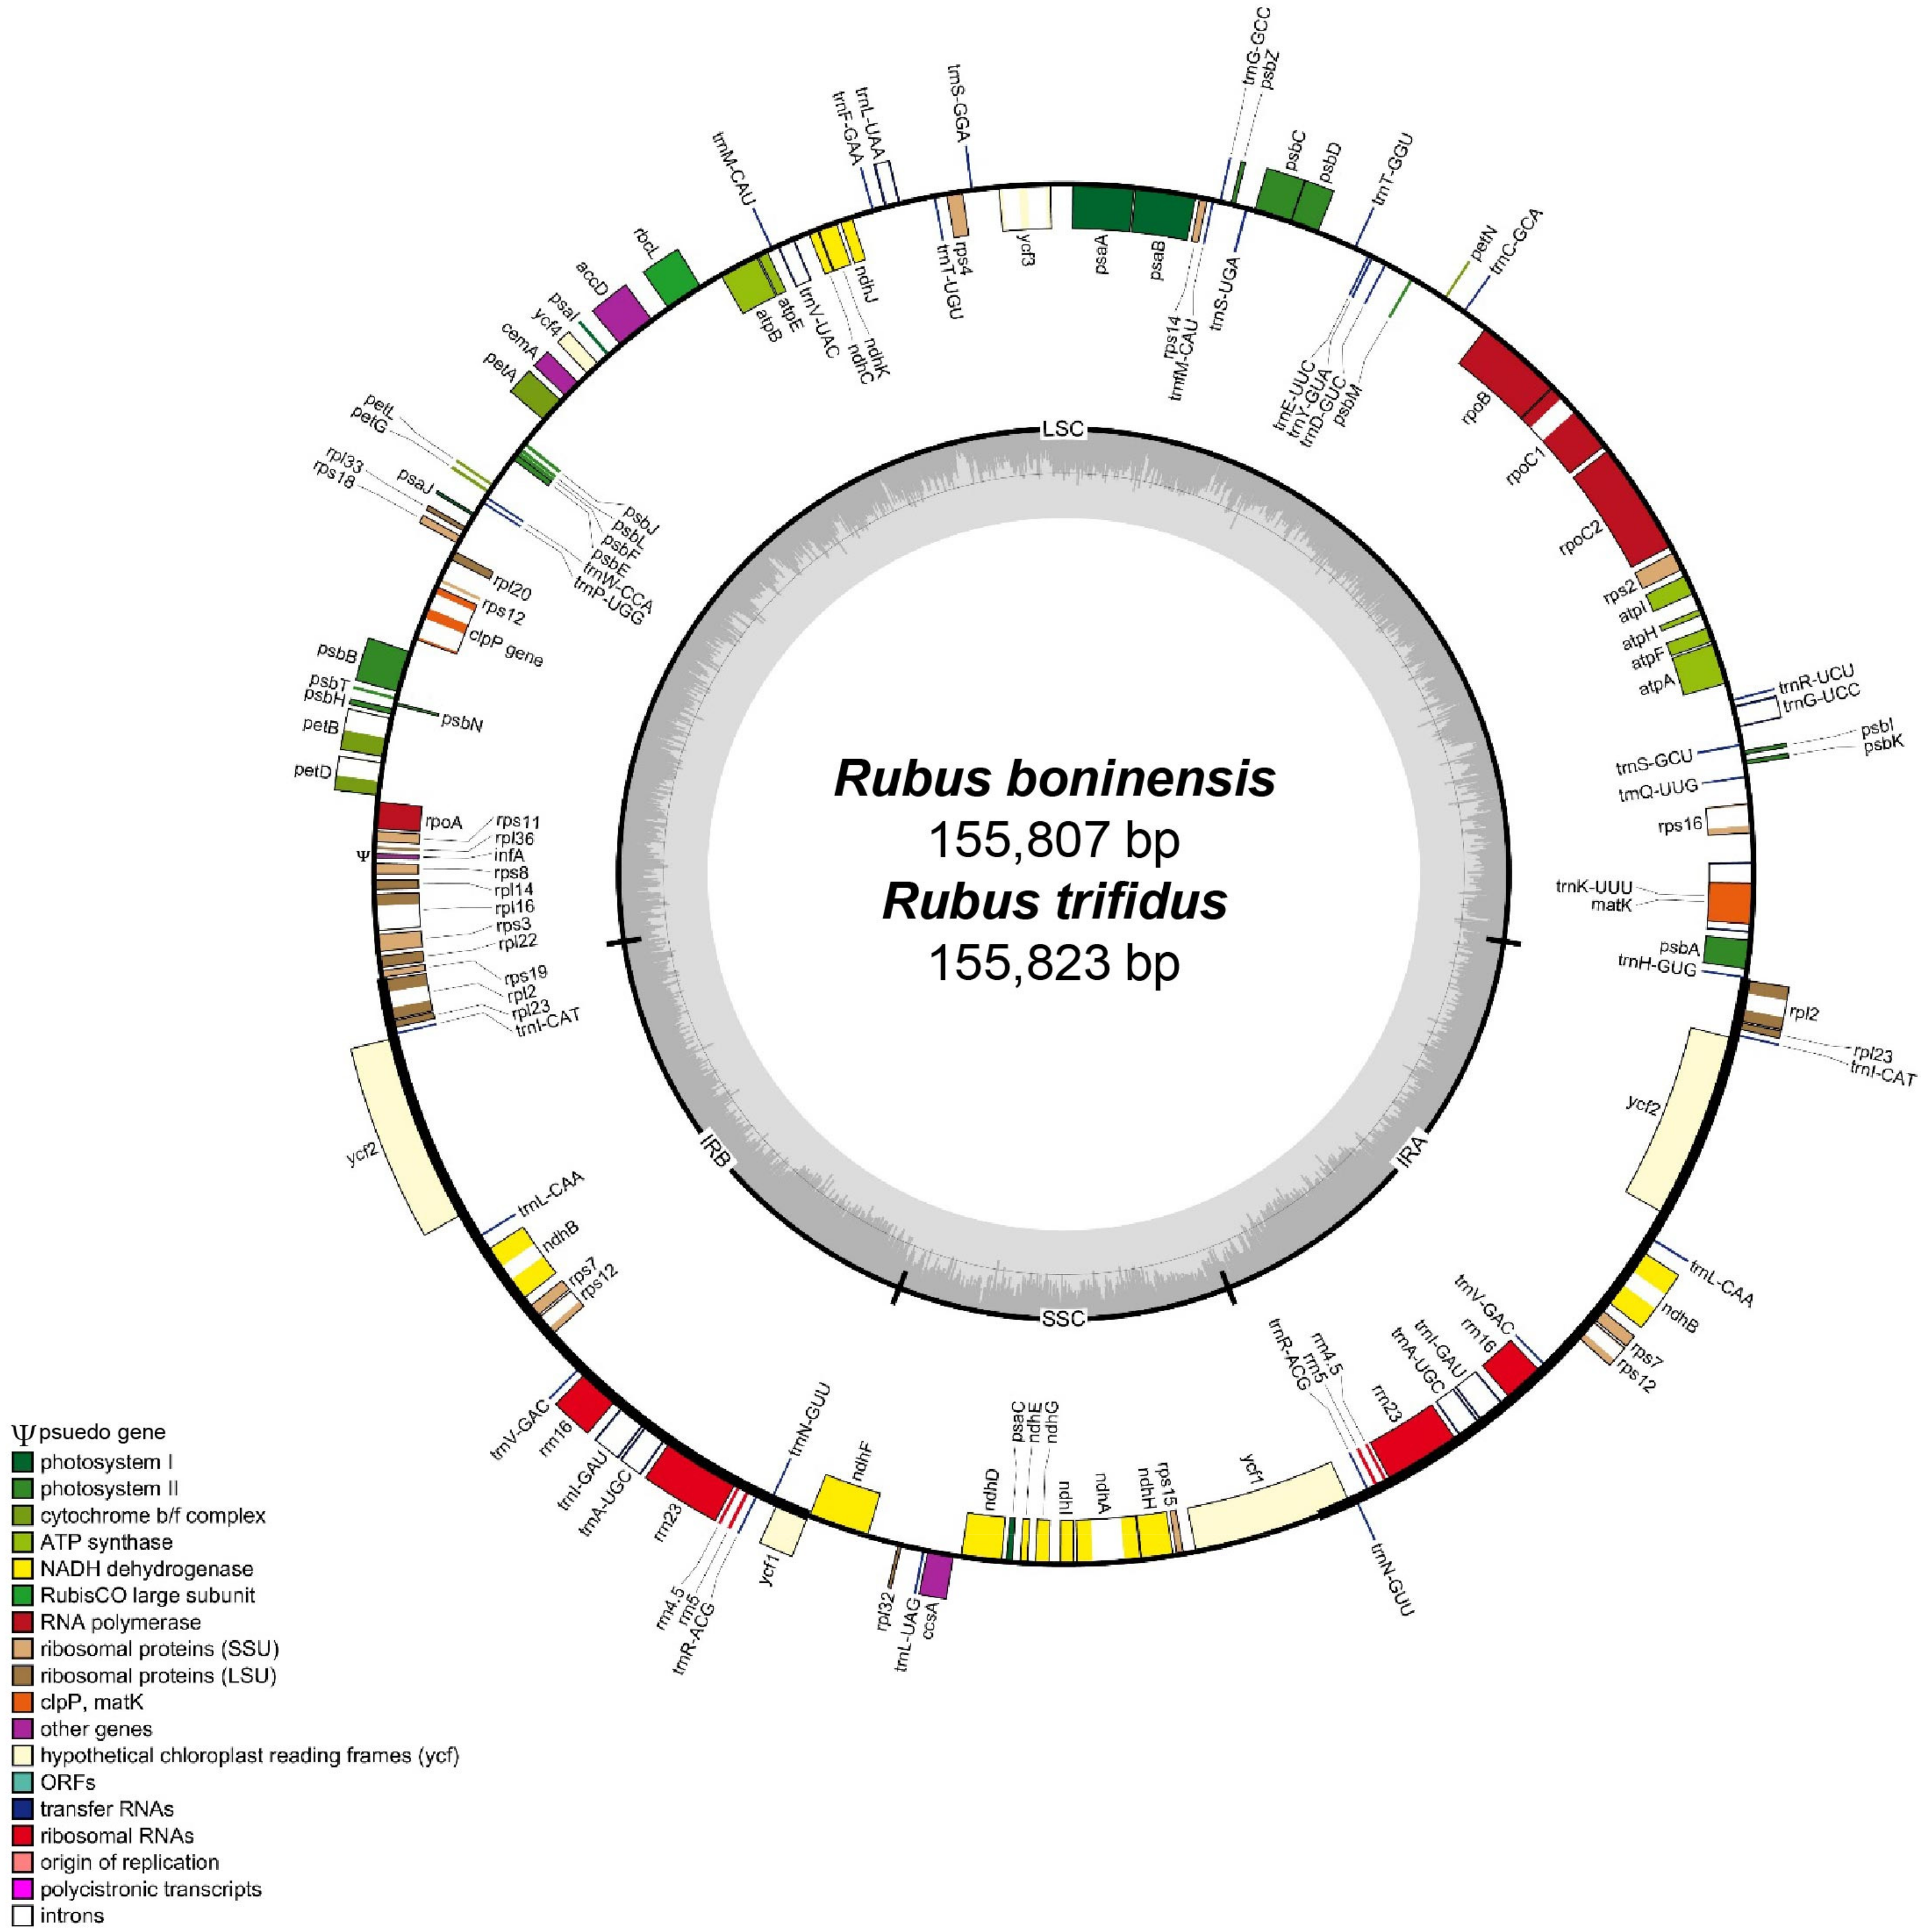
3.1. Genome Size and Features

The complete plastome sequence of R. boninensis was 155,807 bp long, with a large single copy (LSC) region of 85,438 bp, small single copy (SSC) region of 18,783 bp, and two inverted repeat (IR) regions of 25,793 bp. The R. trifidus plastome was 155,823 bp long, with a large single copy (LSC) region of 85,466 bp, small single copy (SSC) region of 18,759 bp, and two inverted repeat (IR) regions of 25,799 bp (Figure 1 and Table 1). The two plastomes of R. boninensis and R. trifidus contained 131 genes, including 84 protein-coding, 8 ribosomal RNA, and 37 transfer RNA genes. The overall guanine-cytosine (GC) content of both R. boninensis and R. trifidus was 37.1%.
In both the species, 17 genes were duplicated in the IR regions, including seven tRNA, four rRNA, and six protein-coding genes. Fifteen genes (ndhA, ndhB, petB, petD, rpl2, rpl16, rpoC1, rps12, rps16, trnA-UGC, trnG-UCC, trnI-GAU, trnK-UUU, trnL-UAA, and trnV-UAC) contained one intron, whereas clpP and ycf3 each contained two introns. Interestingly, the highly conserved group II intron of atpF was lost, as we have demonstrated in the case of R. crataegifolius and R. takesimensis [22]. It remains to be determined if loss of the atpF intron, which occurs frequently in the two genera, Rosa and Rubus, has also occurred in the other major lineages of Rosaceae and related Rosid families [22,36]. A partial ycf1 gene (1221 bp in both the species, R. boninensis and R. trifidus) was located at the IRb/SSC junction region, whereas the complete ycf1 gene was located in the IR region at the SSC/IRa junction. To reveal a hybrid origin of some endemic taxa of Rubus (subgenus Idaeobatus) in the Hawaiian Islands, Howarth et al., [37] successfully used the ndhF gene, which is known to have frameshift mutations and alterations on transcription termination due to the higher substitution rates, a wide range of insertion and deletion (indel) variations, and a high AT content [38]. Although the closely related Rosa section Synstylae showed frameshift mutations on the 3’ end of the ndhF gene [39], only nucleotide substitution and alteration on transcription were found in the four species of Rubus, without size variation (a total CDS length of 2244, which is the same as that of Rosa section Synstylae). The infA gene, which was located in the LSC region, became a pseudogene. The plastome sequence of the insular derived species, R. boninensis, was highly similar to that of the continental progenitor species, R. trifidus (99.6% sequence similarity; 155,355 bp identical sites), and the R. trifidus plastome sequence was just 16 bp longer than that of R. boninensis (Table 1). In case of the species pair in East Sea/Sea of Japan, the complete plastome sequences of R. takesimensis and R. crataegifolius were 99.8% similar (i.e., 155,537 bp identical sites); the R. takesimensis plastome was 46 bp longer than the R. crataegifolius plastome (a 28 bp extension in the LSC and a 18 bp extension in the SSC) [22].
The frequency of codon usage in R. boninensis and R. trifidus was calculated for their plastomes based on protein-coding genes and tRNA genes (Table 2). The codon usage bias (CUB) refers to differences in the frequency of occurrence of synonymous codons in coding DNA, and it has been demonstrated that CUBs could be manifested by maintaining a balance between mutational bias and natural selective forces [40,41]. Therefore, analysis and characterization of CUBs at the genomic scale can help elucidate molecular evolution and environmental adaptation [42]. Overall, we detected similar patterns in codon usage between R. boninensis and R. trifidus. Some exceptions included AUG codon usage of trnI-CAU, trnfM-CAU, and CAA codon usage of trnK-UUG in R. boninensis; and UAG and UCA codon usage of trnI-CAT and trnS-UGA, respectively, in R. trifidus. The frequency of codon usage of R. crataegifolius and R. takesimensis is also summarized in Table 3. When compared with the pair of R. boninensisR. trifidus, AUG (trnI-CAU, trnfM-CAU, and trnM-CAU), UCA (trnS-UGA), UAG (no usage), and CAA codon usage (trnQ-UUG) showed different patterns. The codon usage of two pairs of Rubus species (R. boninensisR. trifidus and R. crataegifoliusR. takesimensis) was biased toward a high RSCU values of U and A at the third codon usage, a similar phenomenon found in other angiosperm [43] and algal lineages [40].

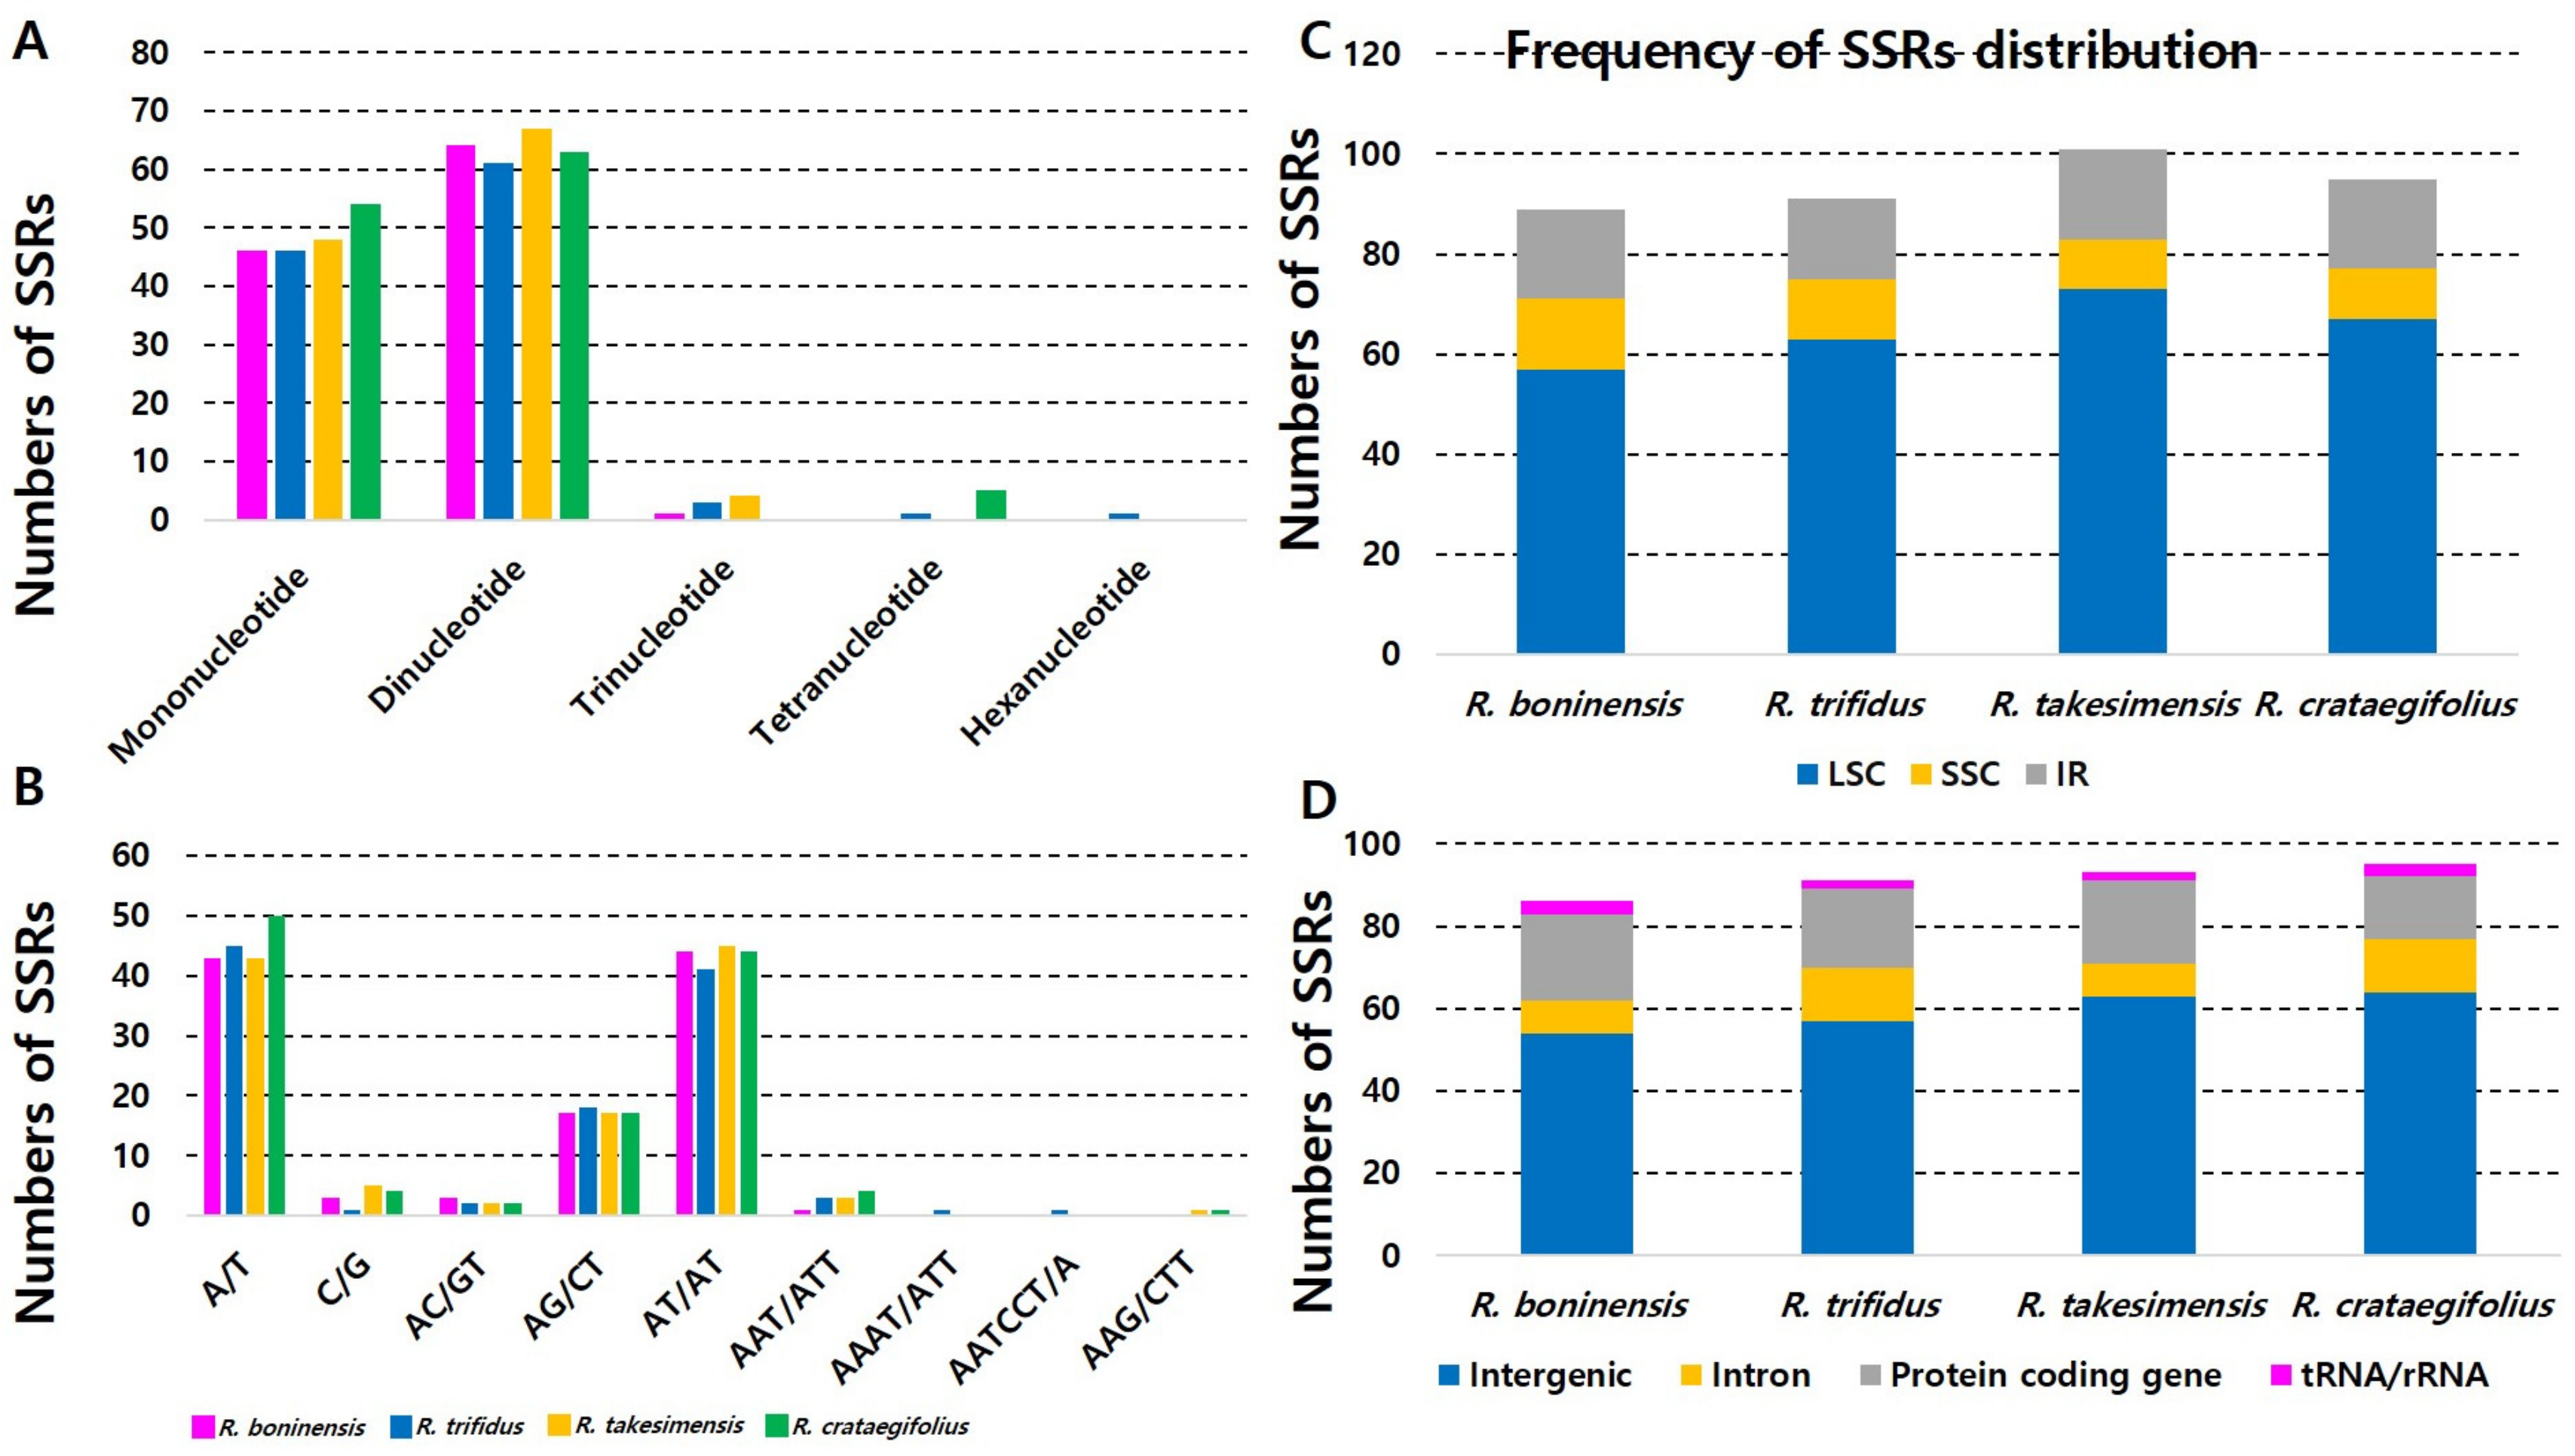
3.2. Analysis of Microsatellites

We found a nearly identical number of potential SSRs between the continental progenitor, R. trifidus (a total of 112 SSRs), and insular derived, R. boninensis, in the Bonin Islands (a total of 111 SSRs). Of a total of 86 unique consensus sequences (out of 111 copies) identified in R. boninensis, 57 (66.3%) were located in the LSC region, 11 in the SSC region (12.8%), and 18 (20.9%) in the two IR regions (Supplementary Table S1). Of a total of 91 unique consensus sequences (out of 112 copies) identified in R. trifidus, 63 (69.2%) were located in the LSC region, 12 in the SSC region (13.2%), and 16 (17.6%) in the two IR regions (Supplementary Table S2). Therefore, we found slight differences in the number of SSRs obtained between R. boninensis and R. trifidus. In addition, mononucleotide repeats were detected in 46 (41.4%) and 46 (41.1%) SSRs in R. boninensis and R. trifidus, respectively, while very low frequencies of 1 (0.9%) and 3 (2.7%) for trinucleotide repeats were found in R. boninensis and R. trifidus, respectively (Figure 2A).
No tetranucleotides, pentanucleotides, and hexanucleotides were found in R. boninensis; however, one tetranucleotide and one hexanucleotide repeat were identified in R. trifidus. The most common SSR motifs in the R. boninensis and R. trifidus plastomes were dinucleotide repeats; 64 (57.7%) and 61 (54.5%), respectively (Figure 2A). Regarding the location of SSRs, they were located in intergenic regions (54 (62.8%) and 57 (62.6%) in R. boninensis and R. trifidus, respectively), 8 (9.3%; R. boninensis) and 13 (14.3%; R. trifidus) in introns, and 21 (24.4%; R. boninensis) and 19 (20.9%; R. trifidus) in protein coding genes (Figure 2D). Besides, three SSRs (3.5%) were located in tRNA (trnS-UGA) and rRNA (23S rRNA) of R. boninensis, and two (2.2%) were located in 23S rRNA genes of R. trifidus. Moreover, 72.1% and 76.9% of the SSRs were located in intergenic and intron regions, respectively, whereas only 27.9% and 23.1% were distributed in the conserved gene regions of R. boninensis and R. trifidus, respectively (Figure 2D). To compare with previously reported SSRs of R. takesimensis of endemic species on Ulleung Island in East Sea/Sea of Japan, we also analyzed SSRs of R. crataegifolius, the continental progenitor, and found a slightly higher number of potential SSRs (a total of 122) for R. crataegifolius (Supplementary Table S3). Of a total of 95 unique consensus sequences (out of 122 copies) identified in R. crataegifolius, 67 (70.5%) were located in the LSC region, 10 in the SSC region (10.5%), and 18 (19%) in the two IR regions (Figure 2C). In addition, mononucleotide and trinucleotide repeats were detected in 54 (44.3%) and 5 (4.1%) SSRs, respectively (Figure 2A). The most common SSR motifs in the R. crataegifolius plastome were dinucleotide repeats (a total of 63; 51.6%); however, no tetranucleotides, pentanucleotides, and hexanucleotides were found (Figure 2A). Like other congeneric species, most of the SSRs (64 and 67.4%) were located in intergenic regions, while 13 (13.7%) were located in introns and 15 (15.8%) in protein coding genes. In addition, three (3.1%) SSRs were located in tRNA (trnS-UGA) and rRNA (23S rRNA) genes. When the insular derived species, R. takesimensis, and the continental progenitor, R. crataegifolius, were compared, R. crataegifolius showed a slightly higher number of SSRs in the intergenic region (64; 67.4%) and slightly lower number of SSRs in the intron region (13; 13.7%) (Figure 2D). The other characteristics of SSRs found in R. crataegifolius were similar to those of R. takesimensis. The pair of continental progenitor- and insular-derived species in the Bonin Island of the northwestern Pacific Ocean showed nearly identical numbers of SSRs between R. boninensis (a total of 111) and R. trifidus (a total of 112), with similar percentages located in the LSC region (R. boninensis and R. trifidus, 66.3% and 69.2%, respectively). Also, the insular-derived species of the Bonin and Ulleung Islands showed a slightly higher number of potential SSRs in the IR region (R. boninensis with 18 (20.9%) and R. takesimensis with 20 (19.8%)) than that of the continental progenitors (R. trifidus with 16 (17.6%) and R. crataegifolius with 18 (19.4%)). Lastly, the protein coding genes also showed similar patterns: R. boninensis with 21 (24.4%) and R. takesimensis with 20 (19.8%) versus R. trifidus with 19 (20.9%) and R. crataegifolius with 15 (15.8%) (Figure 2).
Compared to the three recently reported plastomes of Rosa section Synstylae [39] and other members of Rosoideae (i.e., Fragaria × ananassa [44], Rosa chinensis var. spontanea [45]), with similar motif search parameter settings, the total numbers of SSR motifs found in the four Rubus species (R. boninensis (n = 111) and R. trifidus (n = 112) in subgenus Anoplobatus; R. crataegifolius (n = 122) and R. takesimensis (n = 116) in subgenus Idaeobatus) were significantly higher than that in Rosa section Synstylae (n = 87), Fragaria × ananassa (n = 61), and Rosa chinensis var. spontanea (n = 58). Furthermore, the number of dinucleotide repeats was significantly higher in the four Rubus species (51.6%–57.8%; n = 61–67) than in Rosa section Synstylae (12.6%; n = 11) and Rosa chinensis var. spontanea (11.8%; n = 10). Also, the highest proportions of mononucleotides motifs were found in nine species of Malus chloroplast genomes, with the total number of chloroplast SSR (cpSSRs) ranging from 94 to 101 [46]. Therefore, it is yet to be ascertained whether the conserved SSR motifs found in the four Rubus species of subgenus Anoplobatus and Idaeobatus in this study can also be found in other major lineages of Rubus, such as subgenus Malachobatus and Rubus. The locations of SSR motifs and A/T abundance found in R. boninensis, R. trifidus, and R. crataegifolius (Figure 2B) were consistent with other members of Rosaceae [39,44,45,46,47]. As the utility of cpSSRs has been proven to be valuable in various plant lineages (e.g., Glycine, [48]; Pinus, [49]; Triticum, [50]; Abies, [51]; Cucumis, [52]), we believe that the cpSSR markers developed in this study can be useful for complex studies at both the population and specific level of members of subgenus Anoplobatus and Idaeobatus.

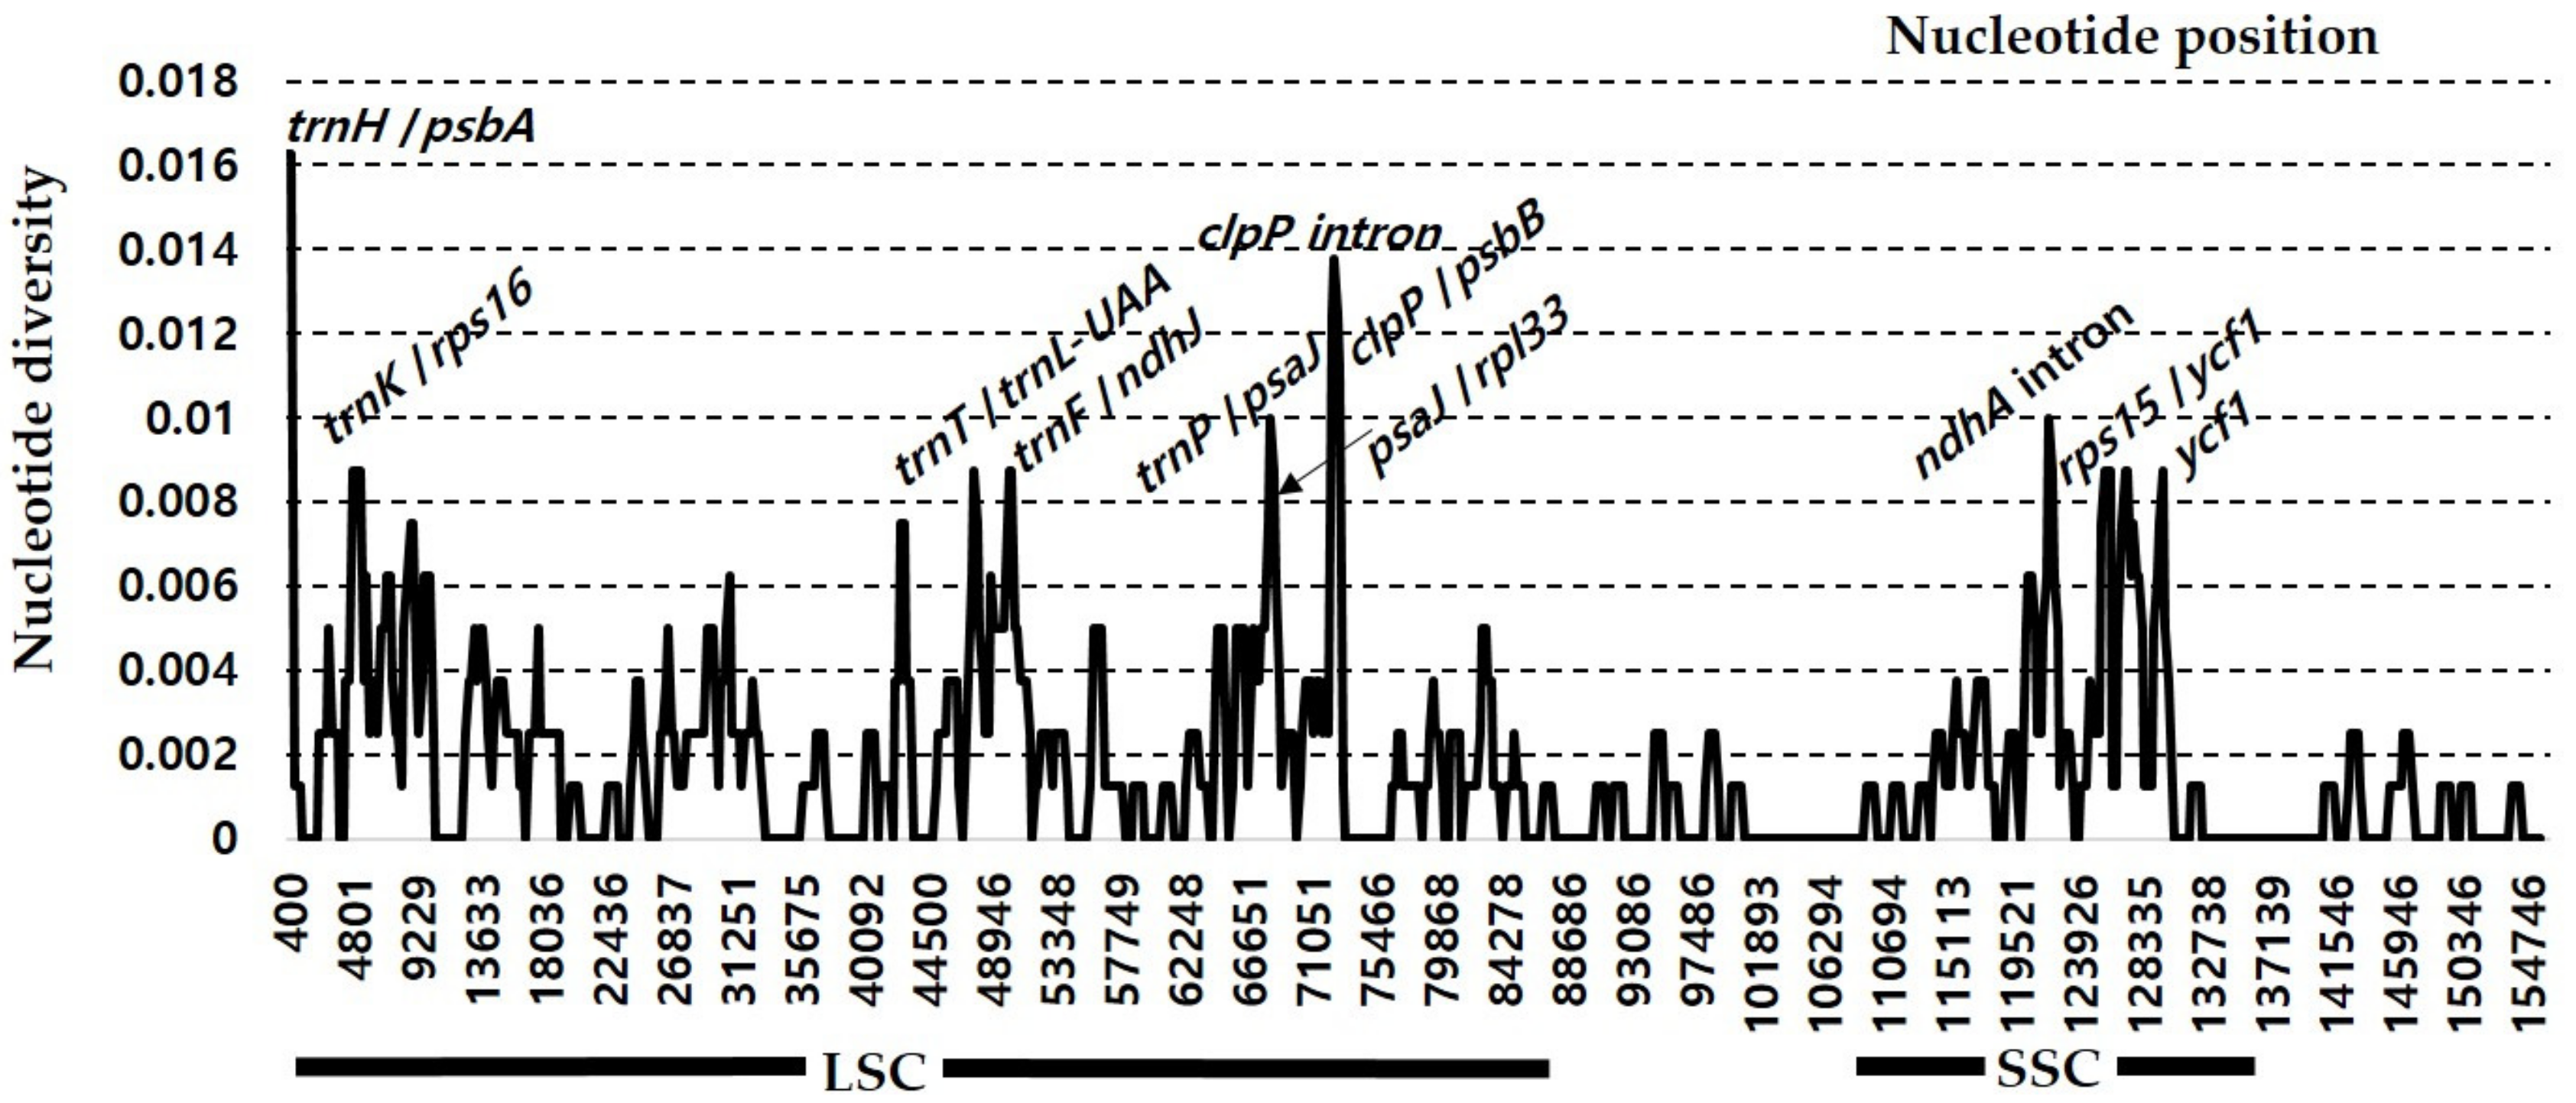
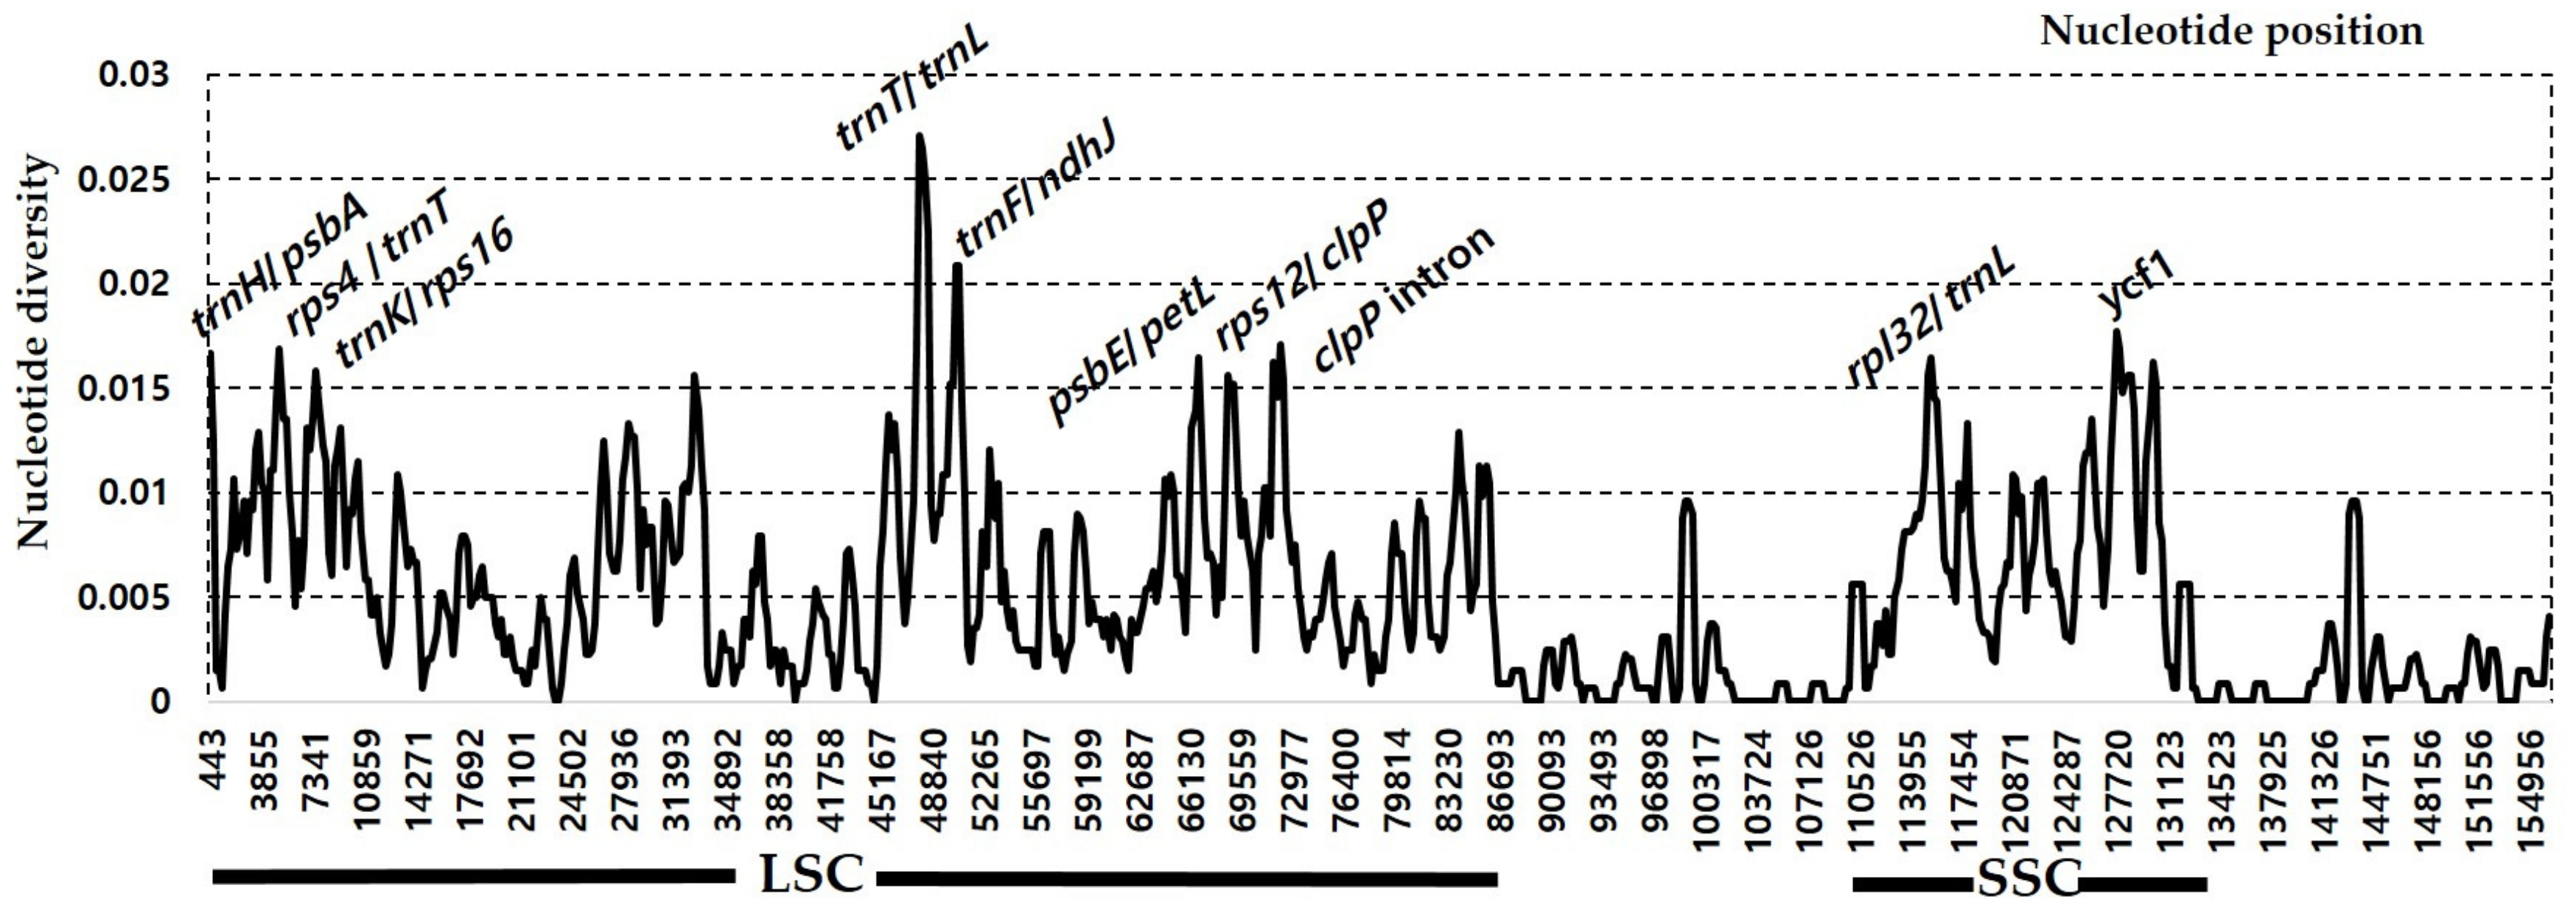
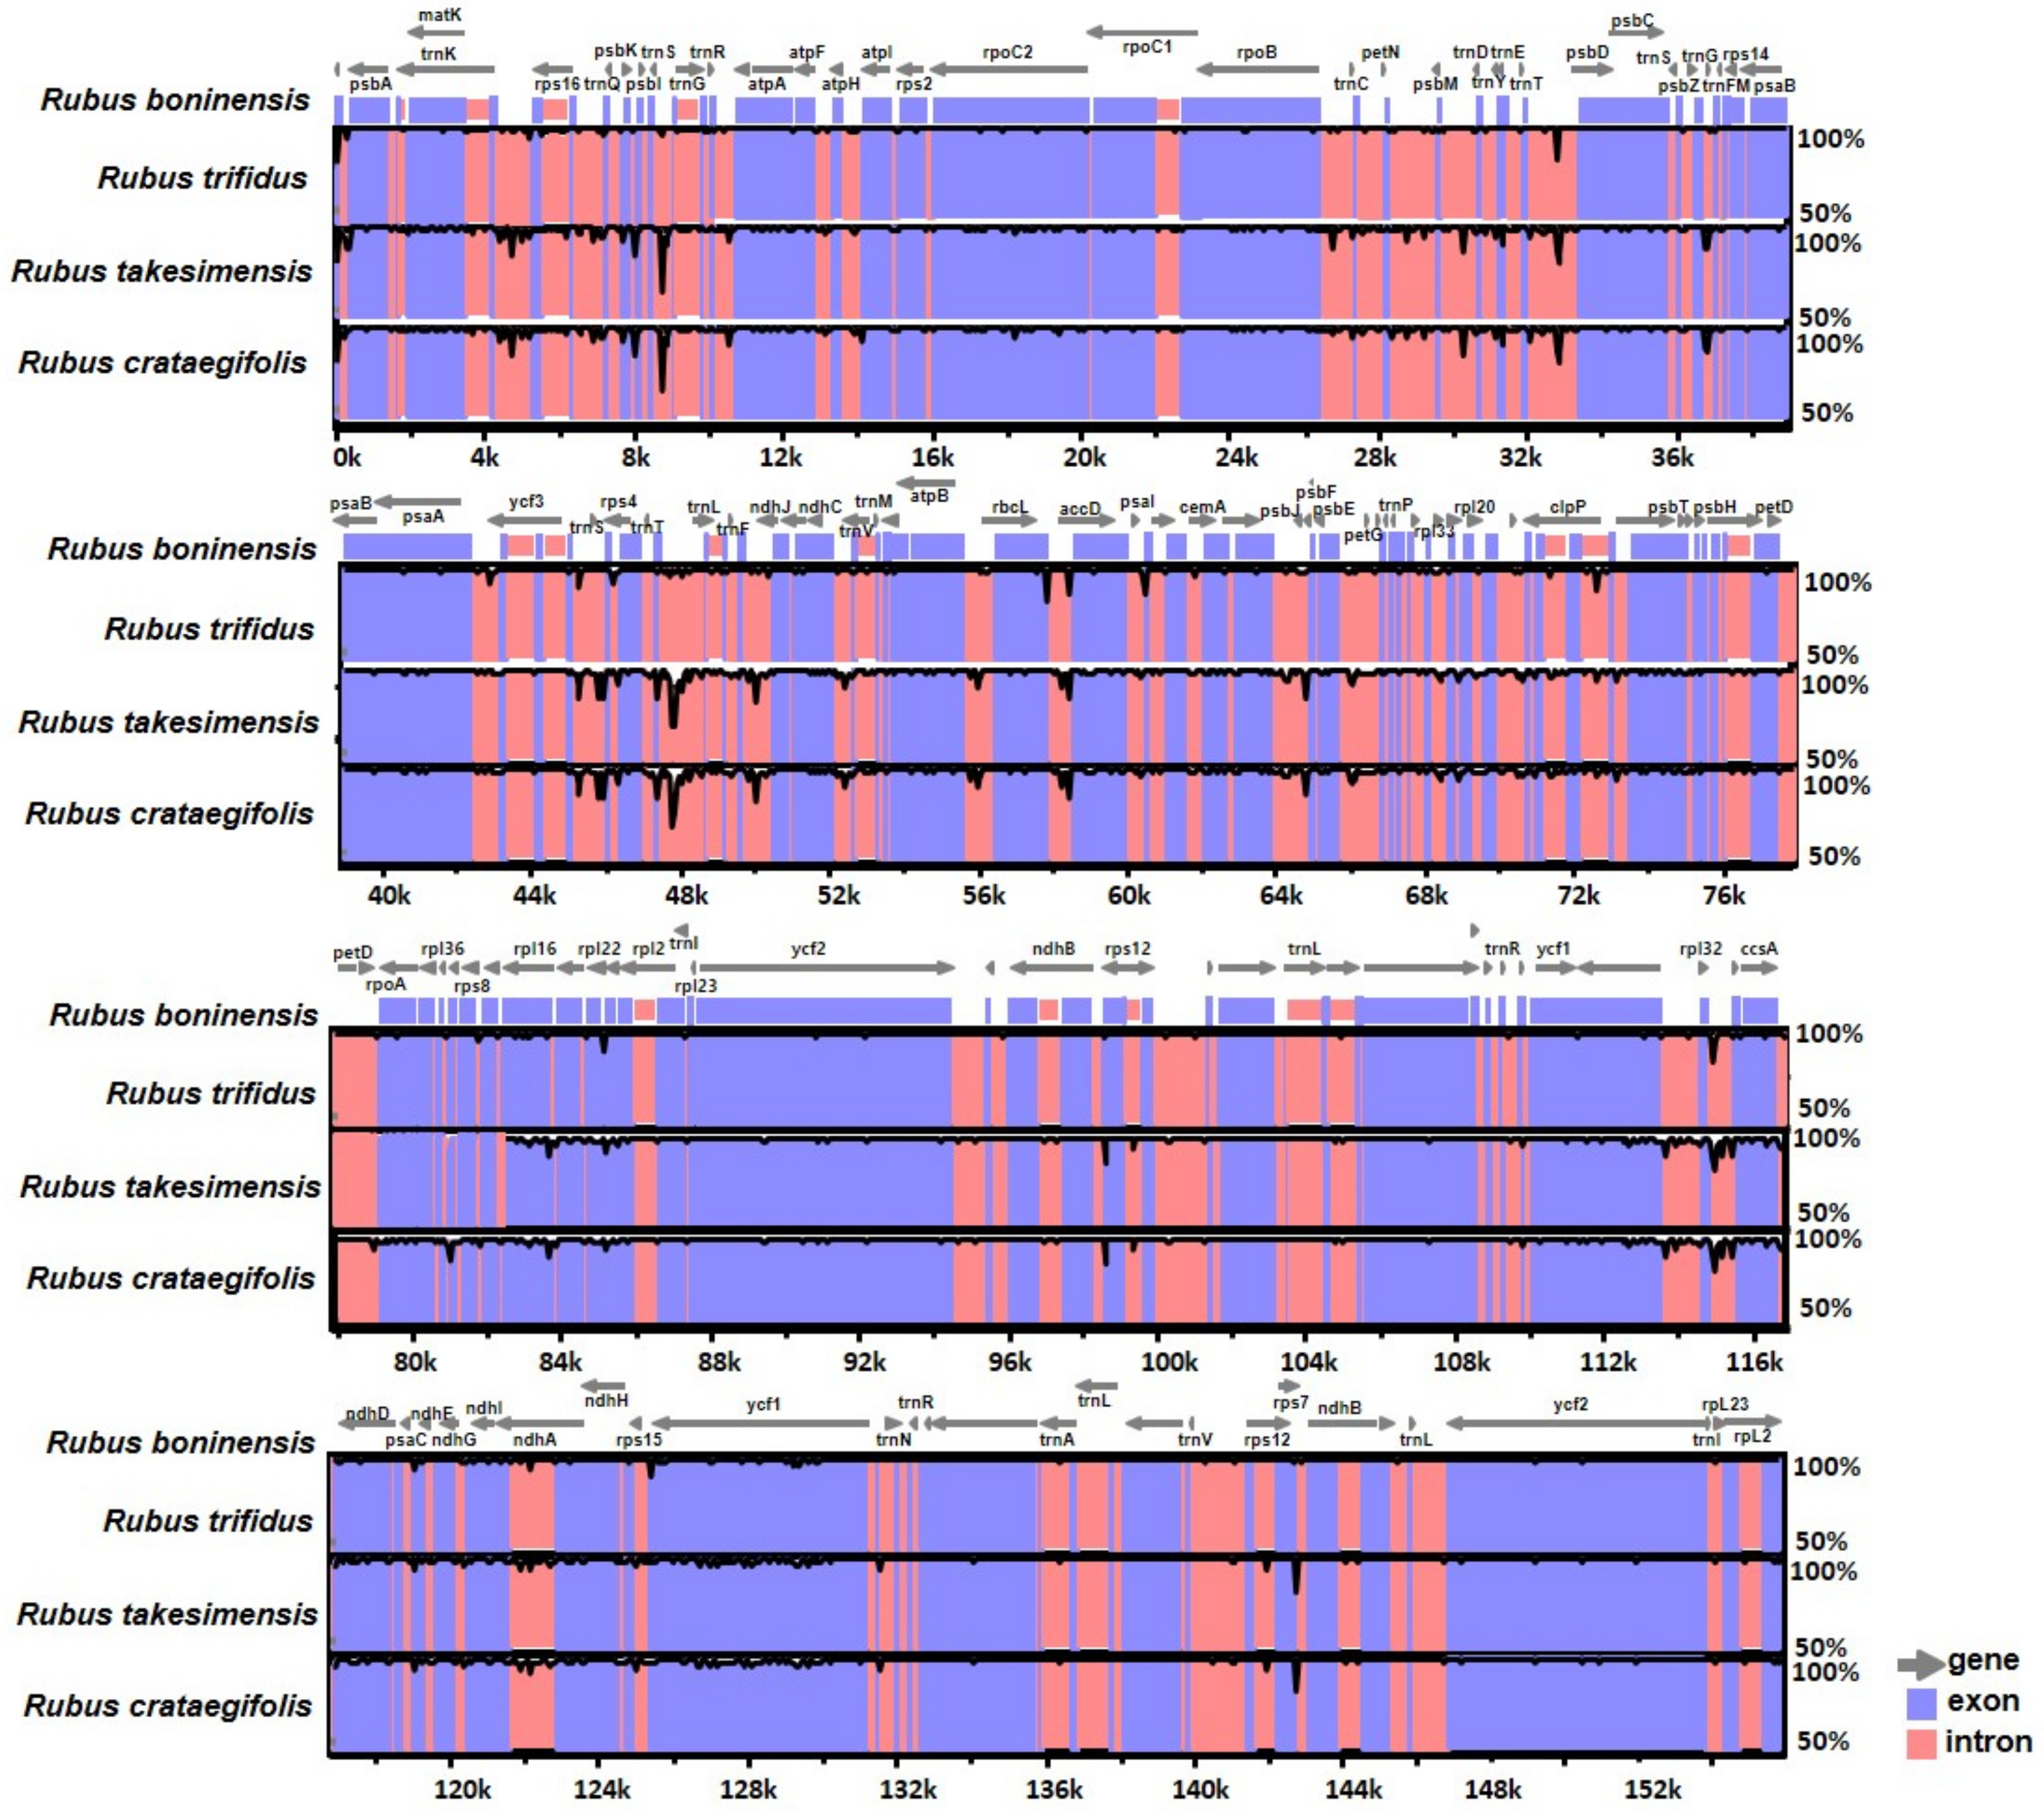
3.3. Comparative Analysis of Genome Structure

The complete plastome sequences of R. boninensis, R. trifidus, R. takesimensis, and R. crataegifolius were plotted by using mVISTA analysis, based on the annotated R. boninensis plastome as a reference (Figure 3). As expected, we found that the LSC region was the most divergent and the two IR regions were highly conserved, and also that the non-coding regions were more divergent and variable than the coding regions. In addition, the R. boninensis plastome was most similar (i.e., 99.6% sequence similarity; 155,355 bp identical sites) to the R. trifidus plastome, which belongs to the same subgenus, Anoplobatus, and least similar (98.6% sequence similarity; 154,123 bp identical sites) to the plastome of R. takesimensis, which belongs to a different subgenus, Idaeobatus.
The sliding window analysis conducted by using DnaSP revealed highly variable regions in the insular endemic taxa and progenitor pairs of Rubus chloroplast genome (Figure 4). When the insular derivative, R. boninensis, and the continental progenitor, R. trifidus, were compared, the average value of nucleotide diversity (Pi) over the entire cp genome was 0.002. The most variable region was the trnH/psbA intergenic region with a Pi value of 0.016. Also, the highly variable regions included ten other intergenic regions, i.e., clpP intron1 (Pi = 0.01375), clpP/psbB (Pi = 0.01125), trnP/psaJ (Pi = 0.01), ndhA intron (Pi = 0.01), trnK/rps16 (Pi = 0.00875), trnT/trnL-UAA (Pi = 0.00875), trnF/ndhJ (Pi = 0.00875), psaJ/rpl33 (Pi = 0.00875), rps15/ycf1 (Pi = 0.00875), and one genic region ycf1 (Pi = 0.00875). Therefore, these 11 regions, including trnH/psbA, will be good candidate organelle markers to make phylogenetic inference and carry out phylogeographic studies of Rubus subgenus Anoplobatus. In the four Rubus plastid genomes including species pair (R. crataegifolius and R. takesimensis) in subgenus Idaeobatus, we found more than two times (i.e., 0.005) the average nucleotide diversity (Pi) over the entire cp genome compared to that in the species pair (R. boninensis and R. trifidus) in subgenus Anoplobatus. The most variable region in the four Rubus plastomes was the trnT/trnL intergenic region with a Pi value of 0.027, which was much higher than that in the R. boninensisR. trifidus species pair (Figure 5). Also, highly variable regions included seven other intergenic regions, i.e., trnF/ndhJ (Pi = 0.02083), trnK/rps16 (Pi =0.01688), psbE/petL (Pi = 0.01646), rpl32/trnL (Pi = 0.01646), trnH/psbA (Pi = 0.01667), rps4/trnT (Pi = 0.01667), and rps12/clpP (Pi = 0.01625), one intron region clpP intron2 (Pi = 0.01708), and one genic region ycf1 (Pi = 0.01771). Thus, a total 10 highly variable regions with Pi values of greater than 0.016 were identified in the four Rubus plastid genomes (Figure 5). Based on the above results, the nine variable regions including trnT/trnL, may serve to resolve phylogenetic relationships between subgenus Anoplobatus and subgenus Idaeodobatus. Our earlier study [22] identified six hotspot regions in the comparative analysis of Rubus subgenus Idaeobatus and subgenus Cylactis-trnL/trnF, rps16/trnQ, ndhD/psaC, trnK/rps16, trnQ/psbK, and trnM/psaC with high Pi values > 0.03. When a previous study [22] on Rubus for the identification of variable regions across the complete chloroplast genome is considered, the trnK/rps16 intergenic region was a common hotspot region within genus Rubus (subgenus Anoplobatus, Idaeobatus, and Cylactis). Although two genic (psbA and atpA) and five intergenic (trnQ/rps16, ndhC/trnV, trnR/atpA, ndhF/rpl32, and psbM/trnD) hotspot regions were reported in Prunus [53] and Pyrus [54], respectively; three other conventional barcoding genic regions (i.e., rbcL, matK, and rpoC1) have been used widely as standard markers for species identification in Rosaceae [55]. Based on three Pyrus chloroplast genome sequences, four hotspot regions (i.e., petN-psbM, psbM-trnD, rps4-trnT-trnL, and psaI-ycf4) with an average Pi value as 0.00054 were suggested as effective makers for phylogeny and conservation genetics in the genus Pyrus [56]. In nine Malus chloroplast genomes, some divergence in intergenic spacer and introns was found, including trnK/rps16, trnT/trnL, and clpP introns and coding regions (matK, rpoA, ndhF, and ycf1) [46]. In Rosa section Synstylae, closely related taxa in the same subfamily Rosoideae as Rubus, Jeon and Kim [39] found six highly variable regions with Pi value of >0.006: psbI-trnS-trnG, 5’matK-trnK, rps16-trnG, rpoB-trnC, rps4-trnT, and ycf1. It is interesting to notice that, compared to the Pi value of four Rubus species, Rosa species showed substantially lower nucleotide diversity, with the highest Pi value of 0.01313 and very few mutations in their chloroplast genomes. Also, we found that clpP intron, rps4/trnT, trnK/rps16, trnT/trnL, and ycf1 represent common hotspots in both Rubus and other Rosaceae. Therefore, in summary, we identified several highly variable plastome regions within genus Rubus subgenus Anoplobatus (clpP/psbB, trnP/psaJ, ndhA intron, trnF/ndhJ, psaJ/rpl33, and rps15/ycf1) and genus Rubus (trnF/ndhJ, psbE/petL, rpl32/trnL, and rps12/clpP). In conjunction with nuclear markers, these highly variable regions, as effective maternally inherited markers, can be applied to explore the highly complex evolutionary history of these groups.

3.4. Phylogenetic Analysis

Maximum likelihood analysis of complete cp genome sequences, which included 19 representative members of the family Rosaceae, was carried out based on the best-fit model of TVM+F+R2. Of a total of 170,274 aligned nucleotide bases, 149,000 (87.5%) were constant and 21,274 (12.5%) were variable sites, with 8273 (4.9%) parsimony-informative sites. The ML tree supported the monophyly of Rubus and the sister relationship between the continental progenitor, R. trifidus, and R. boninensis in the Bonin Islands of the northwestern Pacific Ocean in subgenus Anoplobatus, and also between the continental progenitor, R. crataegifolius, and the insular derivative, R. takesimensis in the East Sea/Sea of Japan in subgenus Idaeobatus (Figure 6). The complete chloroplast genome sequences provided full resolutions within Rubus, with high support values (all but one 100% BS support). The ML tree also provided evidence that the currently delimited subgenus Idaeobatus is not monophyletic. Given the lack of sufficient resolution and insufficient support for relationships of interest within Rubus [57,58,59,60,61], phylogenomic study (or phylogenetic study based on hotspot regions identified in this study) within the genus will shed new light on the disentangling of complex evolutionary events within the genus. Furthermore, inferences based on large-scale phylogenetic frameworks and our understanding of trait evolution within Rosaceae should benefit from phylogenomic approaches based upon whole-plastome sequencing [62,63].

4. Conclusions

The complete plastome sequences of the insular derived R. boninensis, a rare plant endemic to the Bonin Islands in the northwestern Pacific Ocean and R. trifidus, a continental progenitor, were determined. Their plastome sequences were compared to those of R. crataegifolius, the continental progenitor and R. takesimensis, the insular derivative on Ulleung Island in East Sea/Sea of Japan. These species pairs represent parallel plastome systems in two different subgenera of Rubus, Anoplobatus and Idaeobatus, providing insights into plastid genome evolution during anagenetic speciation. Both infA pseudogenization and atpF intron loss were observed in the two species pairs. The relative synonymous codon usage of genus Rubus was biased toward high RSCU values of U and A at the third codon. Several mutation hotspot regions for the R. boninensisR. trifidus species pair included trnH/psbA, clpP intron1, clpP/psbB, trnP/psaJ, ndhA intron, trnK/rps16, trnT/trnL, trnF/ndhJ, psaJ/rpl33, rps15/ycf1, and ycf1. Based on four complete plastome sequences of Rubus, ten highly variable regions, including trnT/trnL, trnF/ndhJ, clpP intron2, trnK/rps16, psbE/petL, rpl32/trnL, trnH/psbA, rps4/trnT, rps12/clpP, and ycf1 were detected. The application of these markers will be a powerful tool for barcoding and for cultivar and germplasm identifications for economically important Rubus and related genera in Rosaceae. In addition to the identification of hotspot regions, we also identified cpSSRs for our four species of interest. We found a higher number of SSRs for the continental progenitor species R. crataegifolius and R. trifidus than for the insular derived species R. boninensis and R. takesimensis. The most common SSR motifs in the four Rubus species were dinucleotide repeats; however, such repeats were not found in other Rosaceae genera (e.g., Malus and Rosa). The location of SSRs motifs and A/T abundance detected from four Rubus species were consistent with other members of Rosaceae. The phylogenetic analysis confirmed the evolution of two anagenetically derived insular species from their continental progenitors. Additional studies using multiple samples from continental and island species based on highly variable plastome markers found in this study can ultimately confirm such progenitor–derivative relationships and help us better understand the anagenetic speciation of island endemics. In addition, the phylogenomic analysis of complete plastome sequences will be an effective tool to infer phylogenetic relationships within Rubus and to establish infra-familial classifications within Rosaceae.

Supplementary Materials

The following are available online at https://www.mdpi.com/2073-4425/10/10/774/s1, Table S1: Distribution, length, and location of repeat sequences in the plastome sequence of Rubus boninensis in the Bonin Islands, Table S2: Distribution, length, and location of repeat sequences in the complete plastome sequence of Rubus trifidus from the southern Korean peninsula, Table S3: Distribution, length, and location of repeat sequences in the Rubus crataegifolius plastome sequence.

Author Contributions

J.Y., S.-C.K. and J.-H.P. conceived and designed the experiments. J.Y. generated and analyzed the data. K.T. collected the samples. J.Y. wrote the draft of the manuscript and S.-C.K. revised it. All authors read and approved the final manuscript.

Funding

This work was supported by the Basic Science Research Program through the National Research Foundation of Korea (NRF), which is funded by the Ministry of Education (2016R1A6A1A0511910 & 2019R1A2C1011221) to J.-H.P. and J.Y.Y., and by JSPS KAKENHI (JP17H04609) and Showa Seitoku Memorial Foundation to K.T. The fieldwork in the Volcano Islands was carried out cooperatively by Tokyo Metropolitan Government, Japan Broadcasting Corporation (NHK), and Tokyo Metropolitan University.

Conflicts of Interest

The authors declare no conflict of interest.

References

  1. Asami, S. Topography and geology in the Bonin Islands. In The Nature of the Bonin Islands; Tutama, T., Asami, S., Eds.; Hirokawa Shoten: Tokyo, Japan, 1970; pp. 91–108. (In Japanese) [Google Scholar]
  2. Toyoda, T. Flora of Bonin Islands (Enlarged & Revised); Aboc-sha: Kamakura, Japan, 2003; pp. 340–346. (In Japanese) [Google Scholar]
  3. Kaizuka, S. Geology and geomorphology of the Bonin Islands. Bull. Ogasawara Res. 1977, 1, 29–34. [Google Scholar]
  4. Imaizumi, T.; Tamura, T. Geomorphology of the Chichijima and Hahajima islands. Bull. Ogasawara Res. 1984, 8, 3–11. [Google Scholar]
  5. Ito, M. Origin and evolution of endemic plants of the Bonin (Ogasawara) Islands. Res. Pop. Ecol. 1988, 40, 205–212. [Google Scholar] [CrossRef]
  6. Chiba, S. Accelerated evolution of land snails Mandarina in the oceanic Bonin Islands: Evidence from mitochondrial DNA sequences. Evolution 1999, 53, 460–471. [Google Scholar] [CrossRef] [PubMed]
  7. Chiba, S. Ecological diversity and speciation in land snails of the genus Mandarina from the Bonin Islands. Popul. Ecol. 2002, 44, 179–187. [Google Scholar] [CrossRef]
  8. Kobayashi, S. A list of the vascular plants occurring in the Ogasawara (Bonin) Islands. Ogasawara Res. 1978, 1, 1–33. [Google Scholar]
  9. Yamazaki, T. The floristic position of the Bonin Islands plants. In Illustrated Book of the Bonin Islands Plants; Toyoda, T., Ed.; Aboc-sha: Kamakura, Japan, 1981; pp. 303–308. (In Japanese) [Google Scholar]
  10. Shimizu, Y. Forest structures, composition, and distribution on a Pacific island, with reference to ecological release and speciation. Pac. Sci. 1991, 45, 28–49. [Google Scholar]
  11. Takayama, K.; Ohi-toma, T.; Kudoh, H.; Kato, H. Origin and diversification of Hibiscus glaber, species endemic to the oceanic Bonin Islands, revealed by chloroplast DNA polymorphism. Mol. Ecol. 2005, 14, 1059–1071. [Google Scholar] [CrossRef]
  12. Takayama, K.; Tsutsumi, C.; Kawaguchi, D.; Kato, H.; Yukawa, T. Rediscovery of Liparis hostifolia in Minami-Iwo-To Island of the Bonin (Ogasawara) Islands, Japan and molecular identification using the herbarium specimen collected more than 100 years ago. Acta Phytotax. Geobot. 2019, in press. [Google Scholar]
  13. Nakano, S.; Matsumoto, A.; Ohta, Y.; Nakamura, H.; Furukawa, R. K-Ar ages of volcanic rocks from Kita-Iwo-To and Minami-Iwo-To Islands. In Proceedings of the Japan Geoscience Union Annual Meeting, Chiba, Japan, 16–21 May 2009; pp. V160–P012. [Google Scholar]
  14. Fujita, T.; Takayama, K.; Shumiya, T.; Kato, H. Vascular Flora of Minami-Iwo-To Island. Ogasawara Res. 2008, 33, 49–62. [Google Scholar]
  15. Ohba, H. The Higher Plant Flora of Minami-Iwojima Island (Ins. San Augustino), the Volcano Group of Islands, Japan; Wildlife Research Center: Minami-Iwojima no Shizen, Japan, 1983; pp. 61–143, (In Japanese with English summary). [Google Scholar]
  16. Stuessy, T.F.; Jakubowsky, G.; Gomez, R.S.; Pfosser, M.; Schlüter, P.M.; Fer, T.; Sun, B.-Y.; Kato, H. Anagenetic evolution in island plants. J. Biogeogr. 2006, 33, 1259–1265. [Google Scholar] [CrossRef]
  17. Tuyama, T. Plantae Boninenses Novae vel Criticae. IX. Bot. Mag. 1937, 51, 131. [Google Scholar]
  18. Ohba, H.; Boufford, D.E.; Iwatsuki, K. Flora of Japan. IIb; Kodansha: Tokyo, Japan, 2001; p. 155. [Google Scholar]
  19. Koidzumi, G. Conspectus rosacearum japonicarum. J. Coll. Sci. Imp. Univ. Tokyo 1913, 34, 113. [Google Scholar]
  20. Yang, J.Y.; Pak, J.-H.; Maki, M.; Kim, S.-C. Multiple origins and the population genetic structure of Rubus takesimensis (Rosaceae) on Ulleung Island: Implication for the genetic consequences of anagenetic speciation. PLoS ONE 2019, 14, e0222707. [Google Scholar] [CrossRef] [PubMed]
  21. Lee, W.; Yang, J.Y.; Jung, K.-S.; Pak, J.-H.; Maki, M.; Kim, S.-C. Chloroplast DNA assessment of anagenetic speciation in Rubus takesimensis (Rosaceae) on Ulleung Island, Korea. J. Plant Biol. 2017, 60, 163–174. [Google Scholar] [CrossRef]
  22. Yang, J.Y.; Pak, J.-H.; Kim, S.-C. The complete plastome sequence of Rubus takesimensis endemic to Ulleung Island, Korea: Insights into molecular evolution of anagenetically derived species in Rubus (Rosaceae). GENE 2018, 668, 221–228. [Google Scholar] [CrossRef]
  23. Zerbino, D.R.; Birney, E. Velvet: Algorithms for de novo short read assembly using de Bruijn graphs. Genome Res. 2008, 18, 821–829. [Google Scholar] [CrossRef] [PubMed] [Green Version]
  24. Lowe, T.M.; Eddy, S.R. tRNAscan-SE: A program for improved detection of transfer RNA genes in genomic sequence. Nucleic Acids Res. 1997, 25, 955–964. [Google Scholar] [CrossRef]
  25. Kearse, M.; Moir, R.; Wilson, A.; Stones-Havas, S.; Cheung, M.; Sturrock, S.; Buxton, S.; Cooper, A.; Markowitz, S.; Duran, C.; et al. Geneious Basic: An integrated and extendable desktop software platform for the organization and analysis of sequence data. Bioinformatics 2012, 28, 1647–1649. [Google Scholar] [CrossRef]
  26. Lohse, M.; Drechsel, O.; Bock, R. Organellar genome DRAW (OGDRAW): A tool for the easy generation of high-quality custom graphical maps of plastid and mitochondrial genomes. Curr. Genet. 2009, 25, 1451–1452. [Google Scholar]
  27. Frazer, K.A.; Pachter, L.; Poliakov, A.; Rubin, E.M.; Dubchak, I. VISTA: Computational tools for comparative genomics. Nucleic Acids Res 2014, 32, W273–W279. [Google Scholar] [CrossRef] [PubMed]
  28. Brudno, M.; Malde, S.; Poliakov, A.; Do, C.B.; Couronne, O.; Dubchak, I.; Batzoglou, S. Glocal alignment: Finding rearrangements during alignment. Bioinformatics 2003, 19, i54–i62. [Google Scholar] [CrossRef] [PubMed]
  29. Katoh, K.; Standley, D.M. MAFFT multiple sequence alignment software v7: Improvements in performance and usability. Mol. Biol. Evol 2013, 30, 772–780. [Google Scholar] [CrossRef] [PubMed]
  30. Rozas, J.; Ferrer-Mata, A.; Sánchez-DelBarrio, J.C.; Guirao-Rico, S.; Librado, P.; Ramos-Onsins, S.E.; Sánchez-Gracia, A. DnaSP v6: DNA sequence polymorphism analysis of large datasets. Mol. Biol. Evol. 2017, 34, 3299–3302. [Google Scholar] [CrossRef]
  31. Kumar, S.; Stecher, G.; Tamura, K. MEGA7: Molecular evolutionary genetics analysis v7.0 for bigger datasets. Mol. Biol. Evol. 2016, 33, 1870–1874. [Google Scholar] [CrossRef]
  32. Sharp, P.M.; Li, W.H. An evolutionary perspective on synonymous codon usage in unicellular organisms. J. Mol. Evol. 1986, 24, 28–38. [Google Scholar] [CrossRef]
  33. Kozak, M. Comparison of initiation of protein synthesis in procaryotes, eucaryotes, and organelles. Microbiol. Rev. 1983, 47, 1–45. [Google Scholar]
  34. Thiel, T.; Michalek, W.; Varshney, R.K.; Graner, A. Exploiting EST databases for the development and characterization of gene-derived SSR-markers in barley (Hordeum vulgare L.). Theor. Appl. Genet. 2003, 106, 411–422. [Google Scholar] [CrossRef]
  35. Nguyen, L.-T.; Schmidt, H.A.; von Haeseler, A.; Minh, B.Q. IQ-TREE: A fast and effective stochastic algorithm for estimating maximum-likelihood phylogenies. Mol. Biol. Evol. 2015, 32, 268–274. [Google Scholar] [CrossRef]
  36. Daniell, H.; Wardack, K.J.; Kanagaraj, A.; Lee, S.-B.; Saski, C.; Jansen, R.K. The complete nucleotide sequence of the cassava (Manihot esculenta) chloroplast genome and the evolution of atpF in Malpighiales: RNA editing and multiple losses of a group II intron. Theor. Appl. Genet. 2008, 116, 723–737. [Google Scholar] [CrossRef]
  37. Howarth, D.G.; Gardner, D.E.; Morden, C.W. Phylogeny of Rubus subgenus Idaeobatus (Rosaceae) and its implications toward colonization of the Hawaiian Islands. Syst. Bot. 1997, 22, 433–441. [Google Scholar] [CrossRef]
  38. Kim, K.J.; Jansen, R.K. ndhF sequence evolution and the major clades in the sunflower family. Proc. Natl. Acad. Sci. USA 1995, 92, 10379–10383. [Google Scholar] [CrossRef] [PubMed]
  39. Jeon, J.H.; Kim, S.-C. Comparative analysis of the complete chloroplast genome sequences of three closely related East-Asian wild Roses (Rosa sect. Synstylae; Rosaceae). GENES 2019, 10, 23. [Google Scholar] [CrossRef] [PubMed]
  40. Morton, B.R. Selection on the codon bias of chloroplast and cyanelle genes in different plant and algal lineages. J. Mol. Evol. 1998, 46, 449–459. [Google Scholar] [CrossRef] [PubMed]
  41. Gu, W.; Zhou, T.; Ma, J.; Sun, X.; Lu, Z. The relationship between synonymous codon usage and protein structure in Escherichia coli and Homo sapiens. Biosystems 2004, 73, 89–97. [Google Scholar] [CrossRef] [PubMed]
  42. Nie, X.; Deng, P.; Feng, K.; Liu, P.; Du, X.; You, F.M.; Song, W. Comparative analysis of codon usage patterns in chloroplast genomes of the Asteraceae family. Plant Mol. Biol. Rep. 2014, 32, 828–840. [Google Scholar] [CrossRef]
  43. Ravi, V.; Khurana, J.P.; Tyagi, A.K.; Khurana, P. An update chloroplast genomes. Plant Syst. Evol. 2008, 271, 101–122. [Google Scholar] [CrossRef]
  44. Cheng, H.; Li, J.; Zhang, H.; Cai, B.; Gao, Z.; Qiao, Y.; Mi, L. The complete chloroplast genome sequence of strawberry (Fragaria× ananassa Duch.) and comparison with related species of Rosaceae. PeerJ. 2017, 5, e3919. [Google Scholar] [CrossRef] [PubMed]
  45. Jian, H.-Y.; Zhang, Y.-H.; Yan, H.-J.; Qiu, X.-Q.; Wang, Q.-G.; Li, S.-B.; Zhang, S.-D. The complete chloroplast genome of a key ancestor of modern roses, Rosa chinensis var. spontanea, and a comparison with congeneric species. Molecules 2018, 23, 389. [Google Scholar]
  46. Zhang, X.; Rong, C.; Qin, L.; Mo, C.; Fan, L.; Yan, J.; Zhang, M. Complete chloroplast genome sequence of Malus hupehensis: Genome structure, comparative analysis, and phylogenetic relationships. Molecules 2018, 23, 2917. [Google Scholar] [CrossRef] [PubMed]
  47. Gichira, A.W.; Li, Z.; Saina, J.K.; Long, Z.; Hu, G.; Gituru, R.W.; Wang, Q.; Chen, J. The complete chloroplast genome sequence of an endemic monotypic genus Hagenia (Rosaceae): Structural comparative analysis, gene content and microsatellite detection. PeerJ. 2017, 5, e2846. [Google Scholar] [CrossRef] [PubMed]
  48. Powell, W.; Morgante, M.; Andre, C.; McNicol, J.W.; Machray, G.C.; Doyle, J.J.; Tingey, S.V.; Rafalski, J.A. Hypervariable microsatellites provide a general source of polymorphic DNA markers for the chloroplast genome. Curr. Biol. 1995, 5, 1023–1029. [Google Scholar] [CrossRef] [Green Version]
  49. Provan, J.; Soranzo, N.; Wilson, N.J.; McNicol, J.W.; Forrest, G.I.; Cottrell, J.; Powell, W. Gene-Pool variation in Caledonian and European Scots pine (Pinus sylvestris L.) revealed by chloroplast simple sequence repeats. Proc. R. Soc. Lond. Biol. Sci. 1998, 265, 1697–1705. [Google Scholar] [CrossRef] [PubMed]
  50. Ishii, T.; Mori, N.; Ogihara, Y. Evaluation of allelic diversity at chloroplast microsatellite loci among common wheat and its ancestral species. Theor. Appl. Genet. 2001, 103, 896–904. [Google Scholar] [CrossRef]
  51. Vendramin, G.G.; Degen, B.; Petit, R.J.; Anzidei, M.; Madaghiele, A.; Ziegenhagen, B. High level of variation at Abies alba chloroplast microsatellite loci in Europe. Mol. Ecol. 1999, 8, 1117–1126. [Google Scholar] [CrossRef] [PubMed]
  52. Chung, S.M.; Staub, J.E.; Chen, J.F. Molecular phylogeny of Cucumis species as revealed by consensus chloroplast SSR marker length and sequence variation. Genome 2006, 49, 219–229. [Google Scholar] [CrossRef]
  53. Katayama, H.; Uematsu, C. Structural analysis of chloroplast DNA in Prunus (Rosaceae): Evolution, genetic diversity and unequal mutations. Theor. Appl. Genet. 2005, 111, 1430–1439. [Google Scholar] [CrossRef] [PubMed]
  54. Korotkova, N.; Nauheumer, L.; Ter-Voskanyan, H.; Allgaier, M.; Borsch, T. Variability Among the most rapidly evolving plastid genomic region is lineage-specific: Implication of pairwise genome comparisons in Pyrus (Rosaceae) and other angiosperms for marker choice. PLoS ONE 2014, 9, e112998. [Google Scholar] [CrossRef]
  55. Panga, X.; Songa, J.; Zhua, Y.; Xub, H.; Huanga, L.; Chena, S. Applying plant DNAbarcodes for Rosaceae species identification. Cladistics 2011, 27, 165–170. [Google Scholar] [CrossRef]
  56. Li, W.; Lu, Y.; Xie, X.; Li, B.; Han, Y.; Sun, T.; Xian, Y.; Yang, H.; Liu, K. Development of chloroplast genomic resources for Pyrus hopeiensis (Rosaceae). Conserv. Genet. Resour. 2018, 10, 511–513. [Google Scholar] [CrossRef]
  57. Alice, L.A.; Campbell, C.S. Phylogeny of Rubus (Rosaceae) based on nuclear ribosomal DNA internal transcribed spacer region sequences. Am. J. Bot. 1999, 86, 81–97. [Google Scholar] [CrossRef] [PubMed]
  58. Morton, B.R. The role of context-dependent mutations in generating compositional and codon usage bias in grass chloroplast DNA. J. Mol. Evol. 2003, 56, 616–629. [Google Scholar] [CrossRef] [PubMed]
  59. Yang, J.Y.; Pak, H.-H. Phylogeny of Korean Rubus (Rosaceae) based on ITS (nrDNA) and trnL/F intergenic region (cpDNA). J. Plant Biol. 2006, 49, 44–54. [Google Scholar] [CrossRef]
  60. Yang, J.Y.; Yoon, H.-S.; Pak, J.-H. Phylogeny of Korean Rubus (Rosaceae) based on the second intron of the LEAFY gene. Can. J. Plant Sci. 2012, 92, 461–472. [Google Scholar] [CrossRef]
  61. Wang, Y.; Chen, Q.; Chen, T.; Tang, H.; Liu, L.; Wang, X. Phylogenetic insights into Chinese Rubus (Rosaceae) from multiple chloroplast and nuclear DNAs. Front. Plant Sci. 2016, 7, 968. [Google Scholar] [CrossRef] [PubMed]
  62. Potter, D.; Eriksson, T.; Evans, R.C.; Oh, S.; Smedmark, J.E.E.; Morgan, D.R.; Kerr, M.; Robertson, K.R.; Arsenault, M.; Dickinson, T.A.; et al. Phylogeny and classification of Rosaceae. Pl. Syst. Evol. 2007, 266, 5–43. [Google Scholar] [CrossRef]
  63. Xiang, Y.; Huang, C.-H.; Hu, Y.; Wen, J.; Li, S.; Yi, T.; Chen, H.; Xiang, J.; Ma, H. Evolution of Rosaceae fruit types based on nuclear phylogeny in the context of geological times and genome duplication. Mol. Biol. Evol. 2016, 34, 262–281. [Google Scholar] [CrossRef] [PubMed]
Figure 1. The complete plastome map of R. boninensis and R. trifidus. The genes located outside of the circle are transcribed clockwise, while those located inside are transcribed counterclockwise. The gray bar area in the inner circle denotes the guanine-cytosine (GC) content of the genome, whereas the lighter gray area indicates the adenosine-thymine (AT) content of the genome. Large single copy, small single copy, and inverted repeat are indicated with LSC, SSC, and IR, respectively. Ψ indicates pseudogenes.
Genes 10 00774 g001
Figure 2. Analyses of repeated sequences in four Rubus plastome sequences. (A) Numbers of three repeat types; (B) numbers of identified SSRs motifs in different repeat class types; (C) frequency of repeat types in LSC, SSC, and IR regions; (D) frequency of repeat types in intergenic, intron, protein coding region, and tRNA/rRNA.
Genes 10 00774 g002
Figure 3. Visualization of alignment of four Rubus species’ chloroplast genome sequences. The VISTA-based identity plots show the sequence identity of four chloroplast genomes with reference to R. boninensis. Vertical scale indicates the percent identity from 50% to 100%. Coding and non-coding regions are in blue and pink, respectively. Gray arrows above the alignment indicate the position and direction of each gene.
Genes 10 00774 g003
Figure 4. Sliding window analysis of the whole chloroplast genomes of R. boninensis and R. trifidus.
Genes 10 00774 g004
Figure 5. Sliding window analysis of the whole chloroplast genomes of four Rubus species (R. boninensis, R. trifidus, R. crataegifolius, and R. takesimensis).
Genes 10 00774 g005
Figure 6. The maximum-likelihood (ML) tree inferred from 19 representative species of Rosaceae. The bootstrap value based on 1000 replicates is shown for each node.
Genes 10 00774 g006
Table 1. Summary of the characteristics of R. boninensis and R. trifidus chloroplast genomes.
TaxaR. boninensisR. trifidus
Accession NumberMH734123MK465682
Total cpDNA size (bp)/GC content (%)155,807/37.1155,823/37.1
LSC size (bp)/GC content (%)85,438/34.985,466/35.0
IR size (bp)/GC content (%)25,793/42.825,799/42.8
SSC size (bp)/GC content (%)18,783/31.018,759/31.0
Number of genes131131
Number of protein-coding genes8484
Number of tRNA genes3737
Number of rRNA genes88
Number of duplicated genes1717
LSC: Large single copy region, IR: Inverted repeat, SSC: Small single copy region.
Table 2. Codon usage and codon–anticodon recognition pattern for tRNA in R. boninensis and R. trifidus cp genome. Species abbreviations, BON and TRF, represent R. boninensis and R. trifidus, respectively.
CodonAmino AcidCount
BON/TRF
RSCU
BON/TRF
tRNA
BON/TRF
CodonAmino AcidCount
BON/TRF
RSCU
BON/TRF
tRNA
BON/TRF
UUUF986/9851.31 UCUS561/5541.68/1.67
UUCF5140.69trnF-GAAUCCS3431.03trnS-GGA
UUAL882/8871.92/1.93trnL-UAAUCAS382/3801.15- / trnS-UGA
UUGL550/5521.2trnL-CAAUCGS200/2040.6
CUUL592/5901.29 CCUP408/4091.5
CUCL185/1380.4 CCCP212/2130.78
CUAL356/3550.78/0.77trnL-UAGCCAP304/3001.12/1.1trnP-UGG
CUGL185/1860.4/0.41 CCGP1640.6
AUUI1118/11141.48 ACUT523/5251.57
AUCI4350.58trnI-GAUACCT2540.76/0.78trnT-GGU
AUAI711/7030.94 ACAT406/4071.22trnT-UGU
AUGM619/6201trnI-CAU, trnfM-CAU/trnfM-CAUACGT1480.44
GUUV5181.45 GCUA6301.8/1.81
GUCV169/1670.47trnV-GACGCCA2190.63
GUAV5431.52trnV-UACGCAA387/3841.11trnA-UGC
GUGV202/2010.56 GCGA1620.46
UAUY768/7671.59 UGUC2291.53
UACY1960.41trnY-GUAUGCC710.47trnC-GCA
UAA*481.71/1.73 UGA*160.57/0.58
UAG*200.71/0.69-/trnI-CATUGGW454/4521trnW-CCA
CAUH486/4871.53 CGUR343/3441.3/1.31trnR-ACG
CACH151/1500.47trnH-GUGCGCR1040.39
CAAQ711/7131.54/1.55trnK-UUG -CGAR357/3581.36
CAGQ210/2090.46/0.45 CGGR116/1150.44
AAUN971/9681.52/1.51 AGUS390/3871.17/1.16
AACN310/3110.48/0.49trnN-GUUAGCS125/1260.37/0.38trnS-GCU
AAAK1083/10701.5/1.49trnK-UUUAGAR4821.83trnR-UCU
AAGK3620.5/0.51 AGGR1780.68
GAUD873/8741.62 GGUG581/5821.3
GACD203/2020.38trnD-GUCGGCG194/1930.43trnS-GCC
GAAE1020/10221.48/1.49trnE-UUCGGAG701/6991.57trnG-UCC
GAGE358/3540.52/0.51 GGGG313/3120.7
Asterisk (*) denotes stop codon. RSCU: Relative synonymous codon usage. Bold type denotes the exception of codon usage.
Table 3. Codon usage and codon–anticodon recognition pattern for tRNA in R. crataegifolius and R. takesimensis cp genome. Species abbreviations, CRA and TAK, represent R. crataegifolius and R. takesimensis, respectively.
CodonAmino AcidCount
CRA/TAK
RSCU
CRA/TAK
tRNA
CRA/TAK
CodonAmino AcidCount
CRA/TAK
RSCU
CRA/TAK
tRNA
CRA/TAK
UUUF980/9791.31 UCUS5571.68
UUCF5140.69trnF-GAAUCCS3451.04trnS-GGA
UUAL886/8871.93trnL-UAAUCAS3831.15trnS-UGA
UUGL557/5551.21trnL-CAAUCGS1980.6
CUUL593/5921.29 CCUP4121.52
CUCL1810.39 CCCP2110.78
CUAL363/3610.79trnL-UAGCCAP3031.11trnP-UGG
CUGL181/1820.39/0.4 CCGP1610.59
AUUI1105/11051.48 ACUT525/5231.57
AUCI4420.59trnI-GAUACCT2510.75trnT-GGU
AUAI6930.93 ACAT406/4081.22trnT-UGU
AUGM6171trnI-CAU, trnfM-CAU, trnM-CAUACGT152/1510.46/0.45
GUUV5191.45 GCUA6341.82
GUCV1720.48trnV-GACGCCA2180.63
GUAV536/5381.5/1.51trnV-UACGCAA377/3761.08trnA-UGC
GUGV201/2000.56 GCGA163/1640.47
UAUY7661.59 UGUC2291.53
UACY1950.41trnY-GUAUGCC700.47trnC-GCA
UAA*471.68 UGA*140.5
UAG*230.82 UGGW4511trnW-CCA
CAUH479/4771.52/1.51 CGUR3411.29trnR-ACG
CACH152/1540.48/0.49trnH-GUGCGCR105/1040.49/0.39
CAAQ7141.54trnQ-UUGCGAR362/3601.36
CAGQ2110.46 CGGR116/1170.44
AAUN9691.52 AGUS388/3871.17/1.16
AACN3070.48trnN-GUUAGCS124/1250.37trnS-GCU
AAAK1065/10661.5trnK-UUUAGAR486/4881.83/1.84trnR-UCU
AAGK353/3520.5 AGGR1820.69
GAUD8671.62 GGUG576/5771.29
GACD204/2050.38trnD-GUCGGCG198/1970.44trnS-GCC
GAAE10171.48trnE-UUCGGAG700/6971.57trnG-UCC
GAGE3580.52 GGGG311/3130.7
Asterisk (*) denotes stop codon. RSCU: Relative synonymous codon usage. Bold type denotes the exception of codon usage.

