Comparative Analysis of Developmental Transcriptome Maps of Arabidopsis thaliana and Solanum lycopersicum

Abstract
1. Introduction
2. Materials and Methods
2.1. Sample Collection
2.2. RNA Extraction
2.3. Library Preparation and Sequencing
2.4. Mapping
2.5. Splicing Analysis
2.6. Expression Analysis
2.7. Detection of Stably Expressed Genes
2.8. Gene Ontology Enrichment Analysis
2.9. Shannon Entropy
2.10. Pseudo-Euclidean Distance
- For each sample of Arabidopsis and Solanum, one of the biological replicates was randomly taken.
- For each pair of samples, the residuals of median-normalized TGR were calculated. In the case of a group of samples, the residuals were counted for all possible pairs of Arabidopsis and Solanum samples, and a minimum value of residuals was chosen.
- All residual values were summed, and a squared root of the sum was calculated to obtain the pseudo-Euclidean distance.
2.11. Orthology Assessment
2.12. Data Availability
3. Results and Discussion
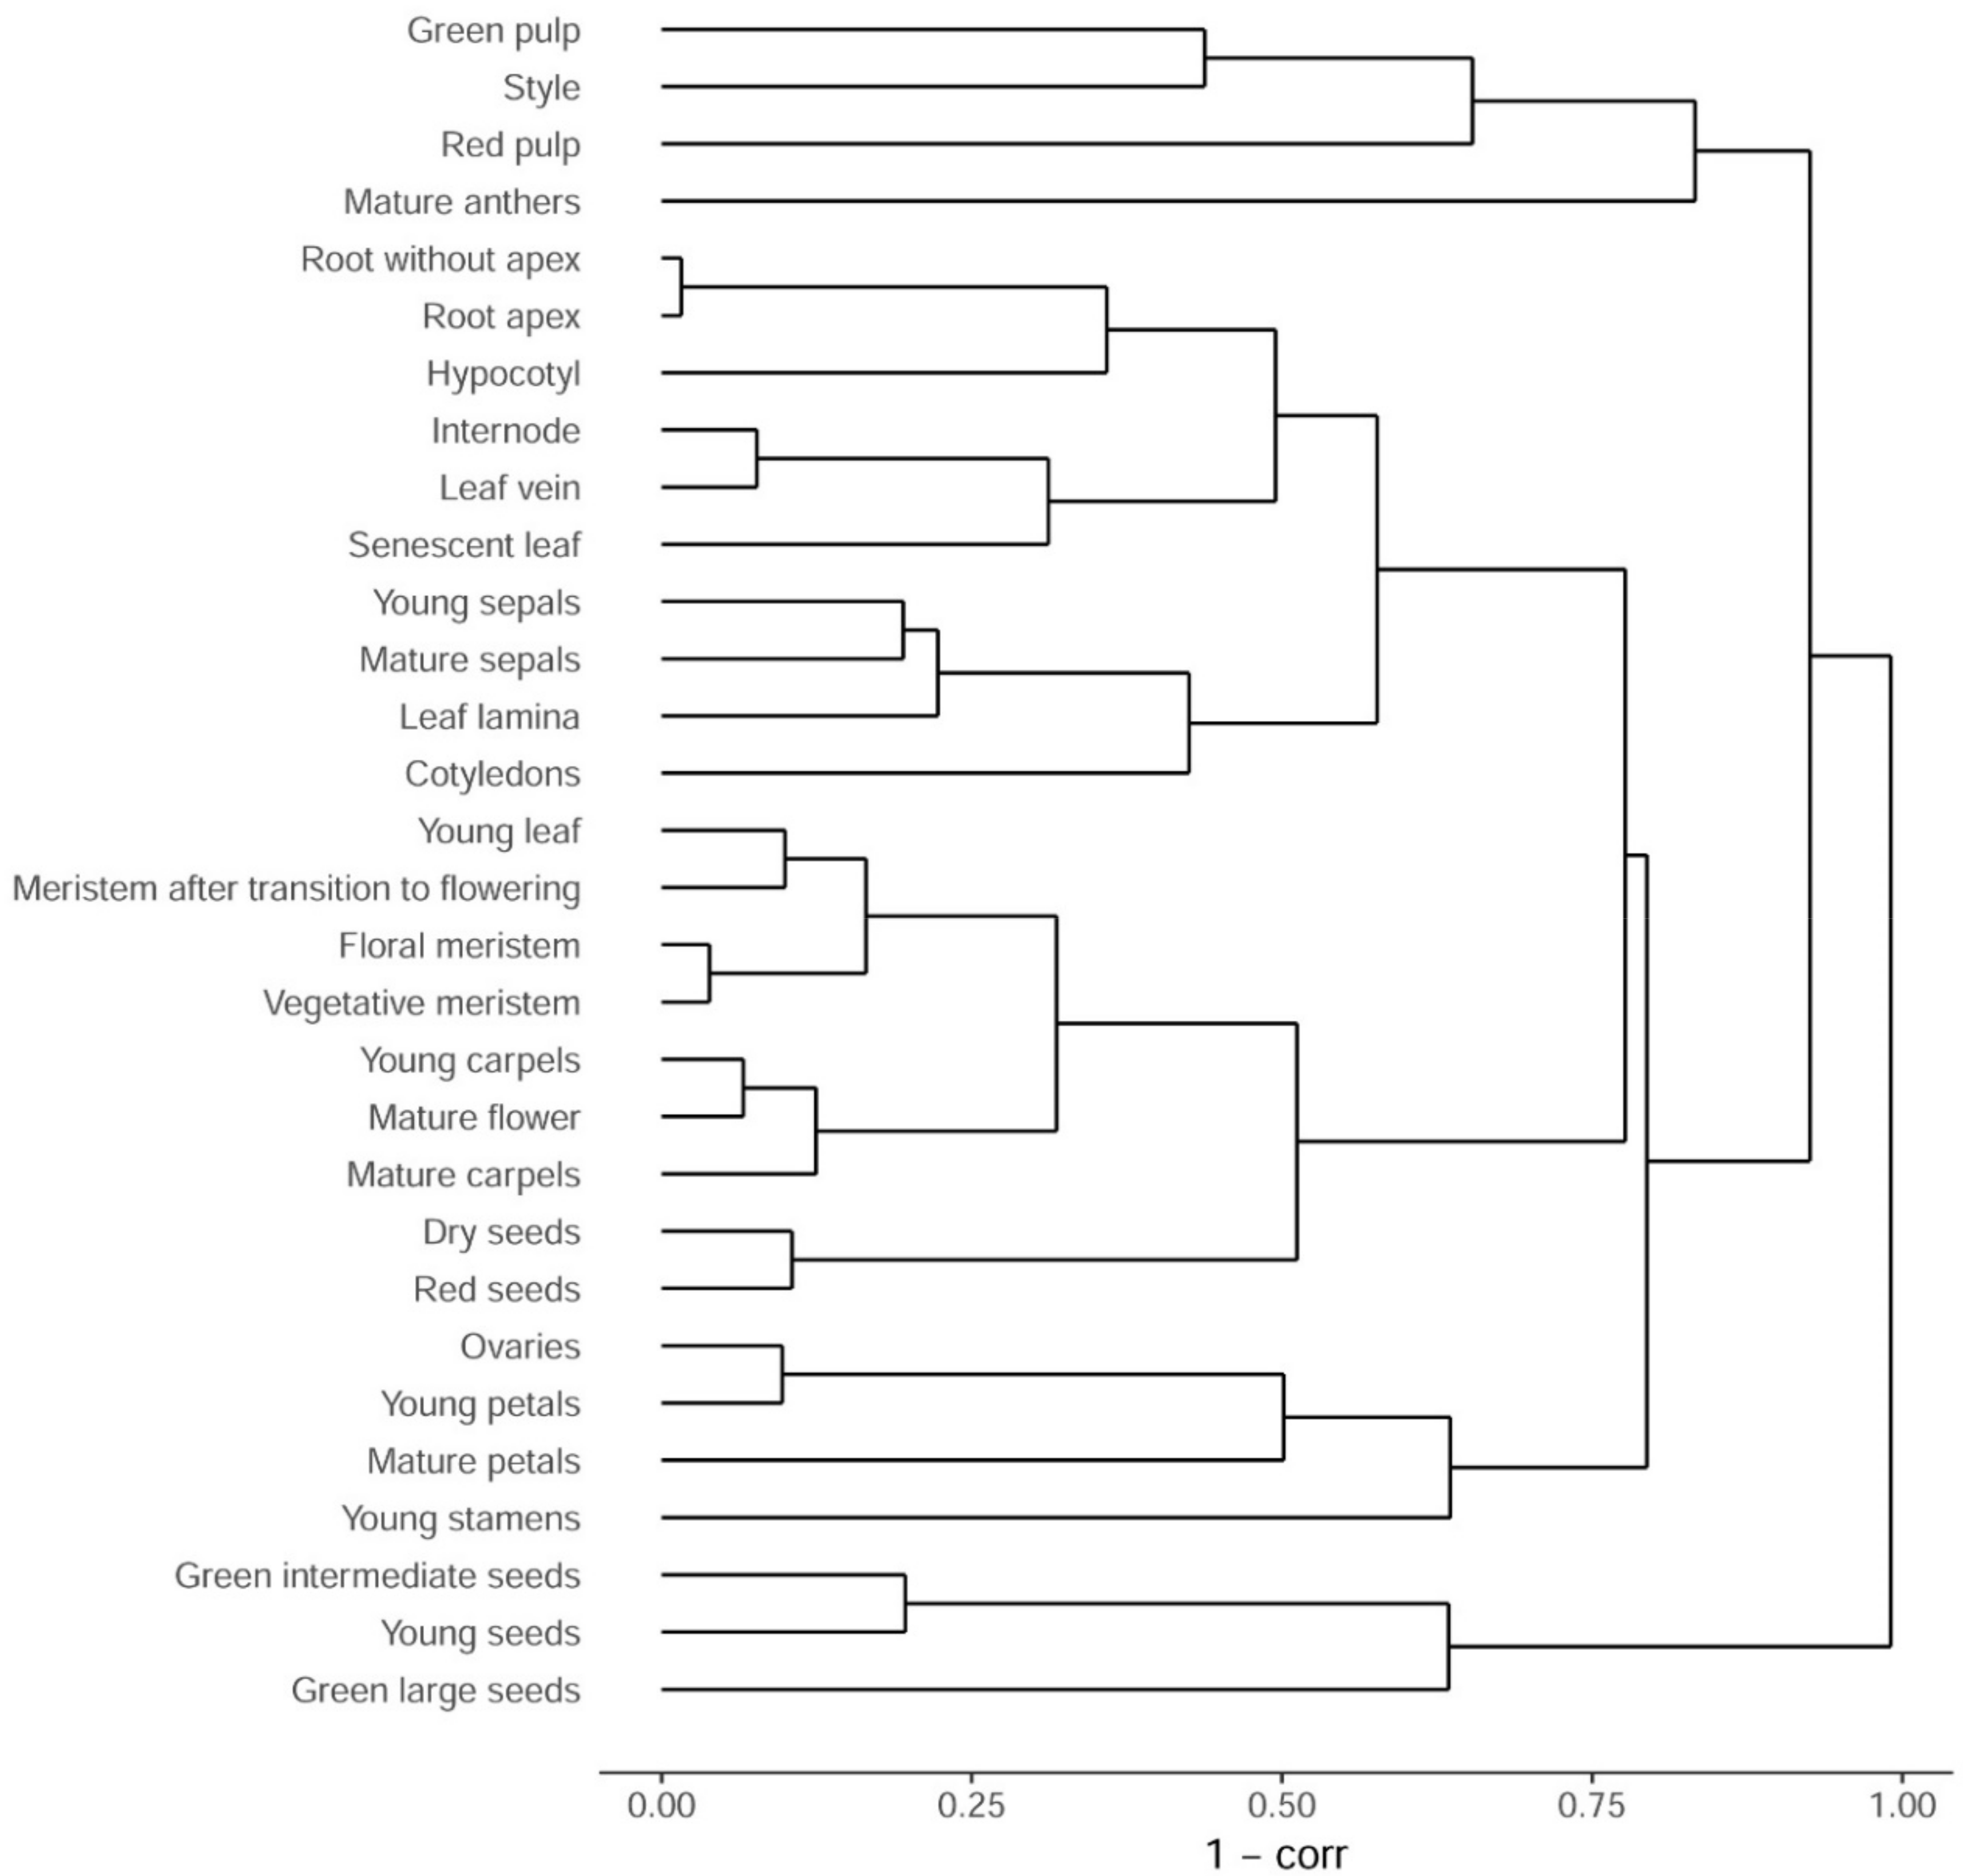
3.1. Sampling and Primary Analysis
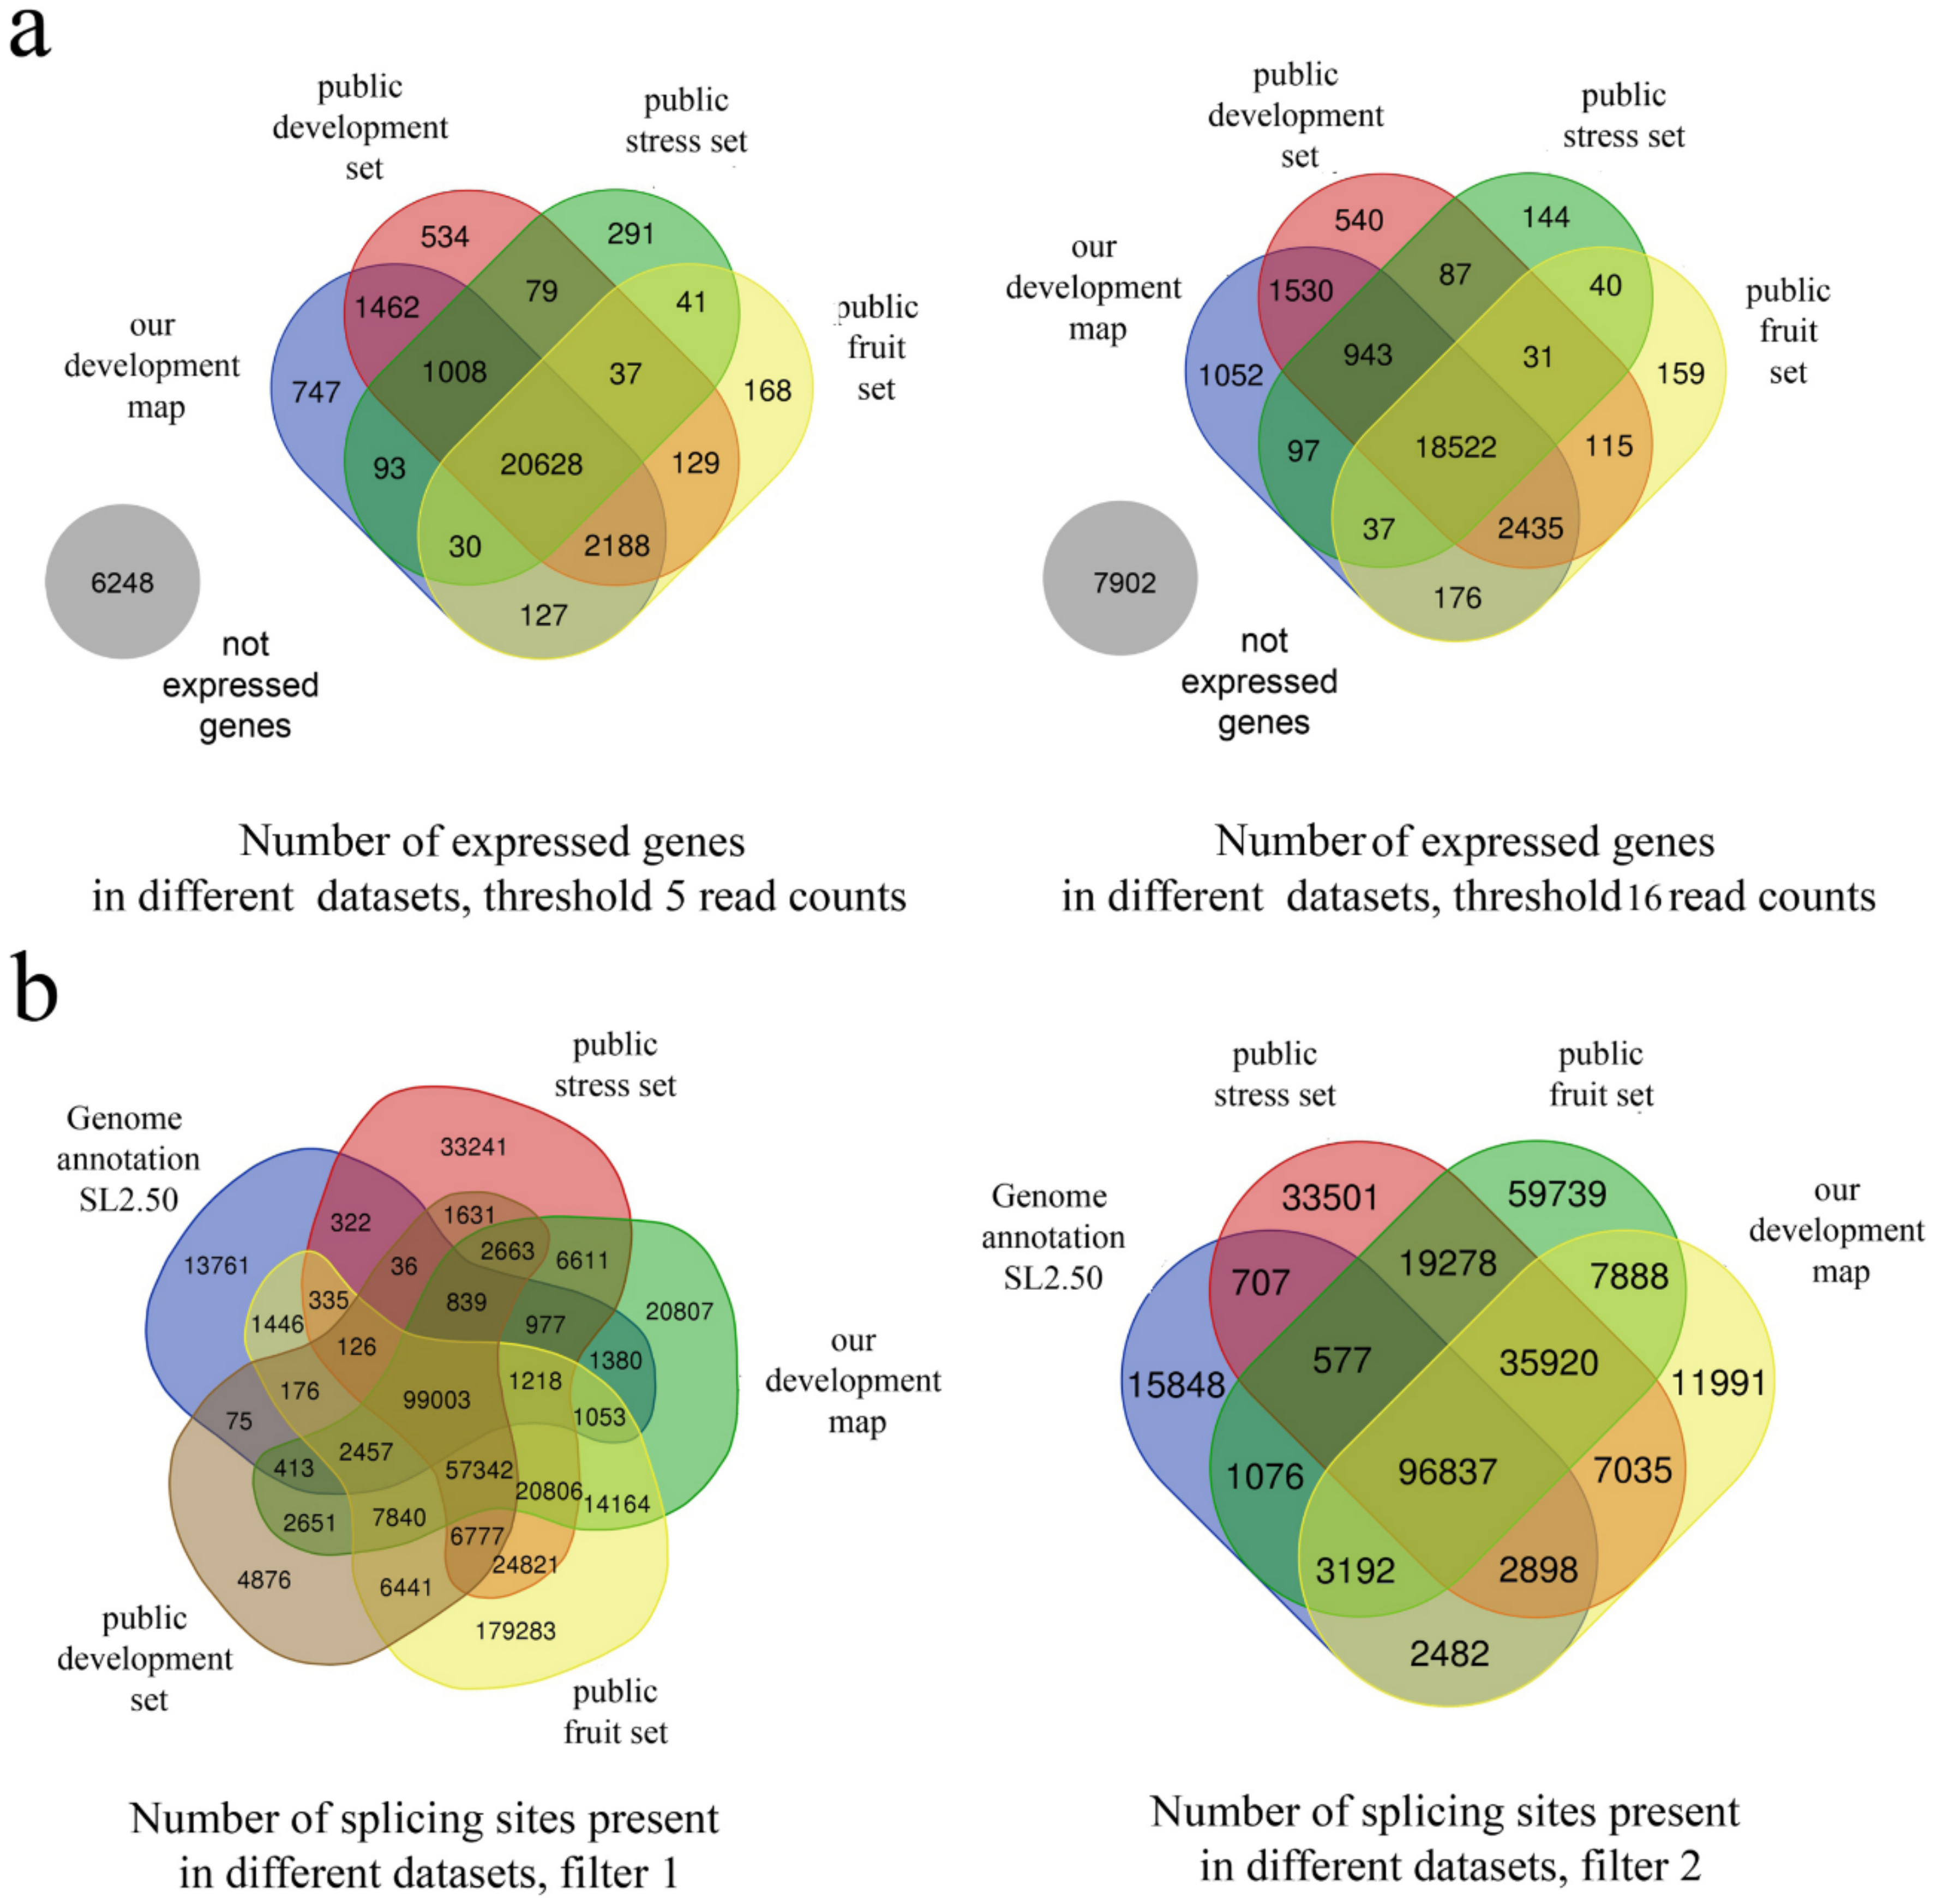
3.2. Comparison with Arabidopsis thaliana Transcriptome Map
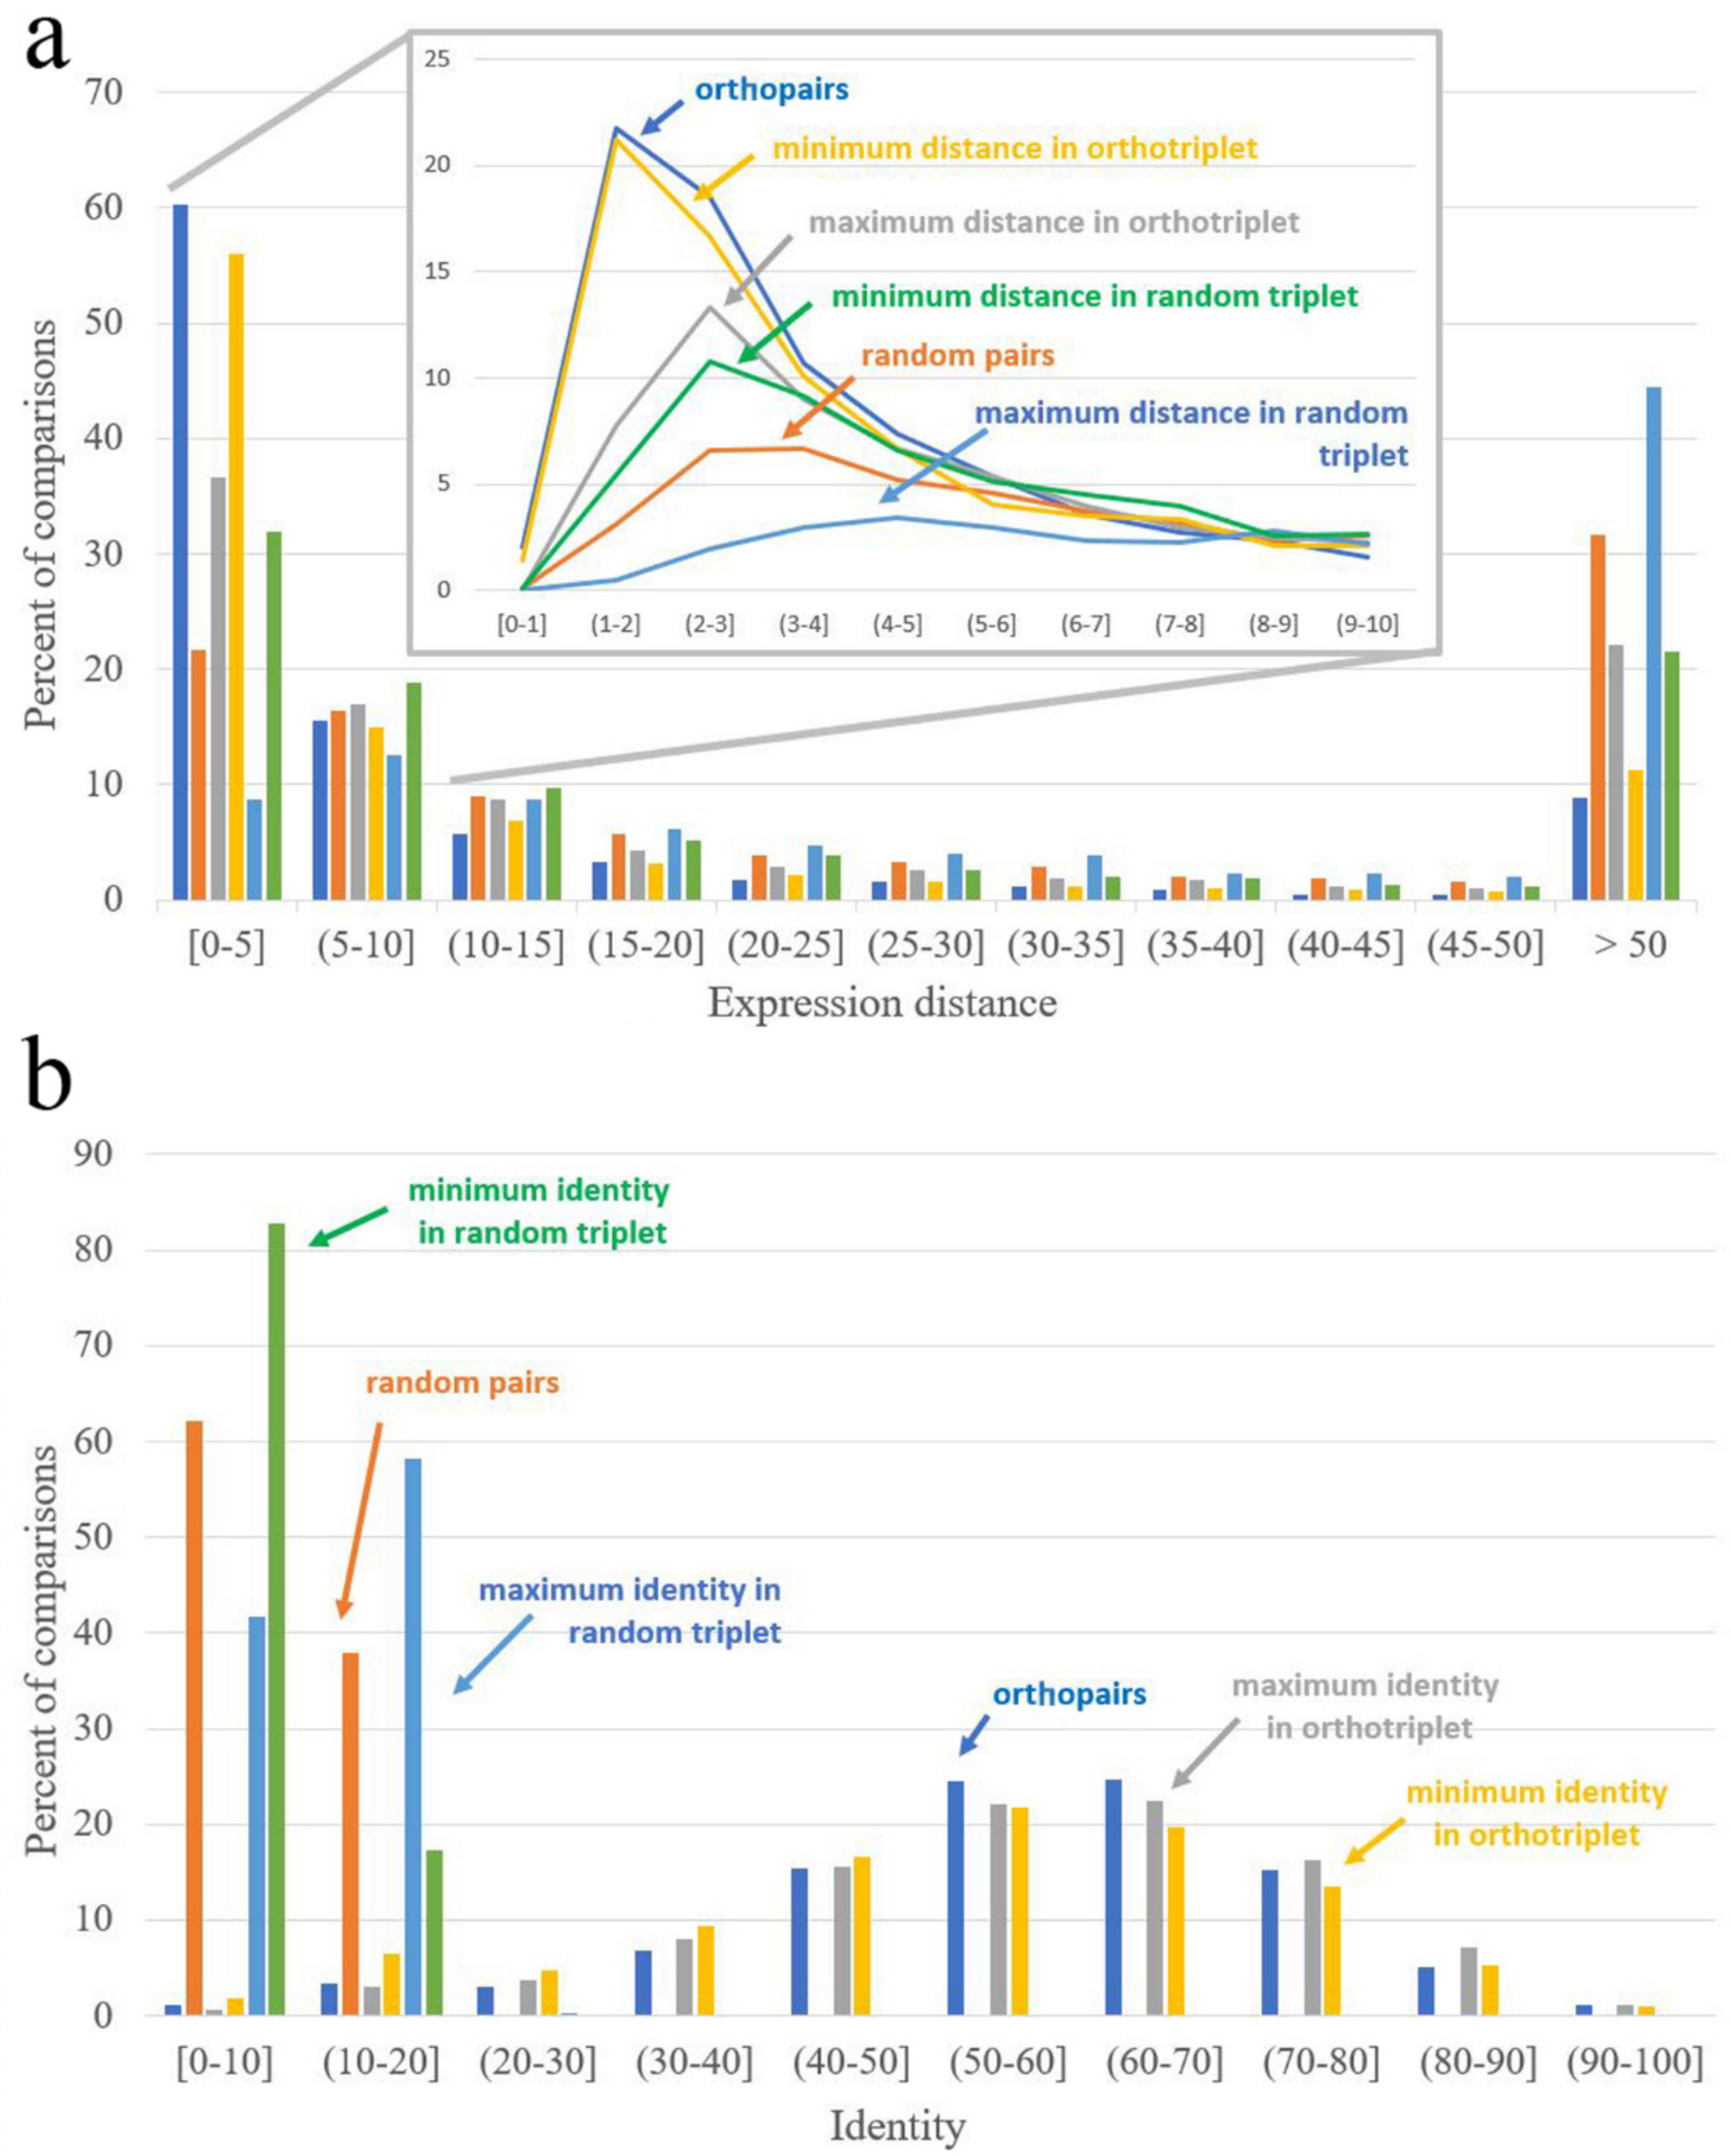
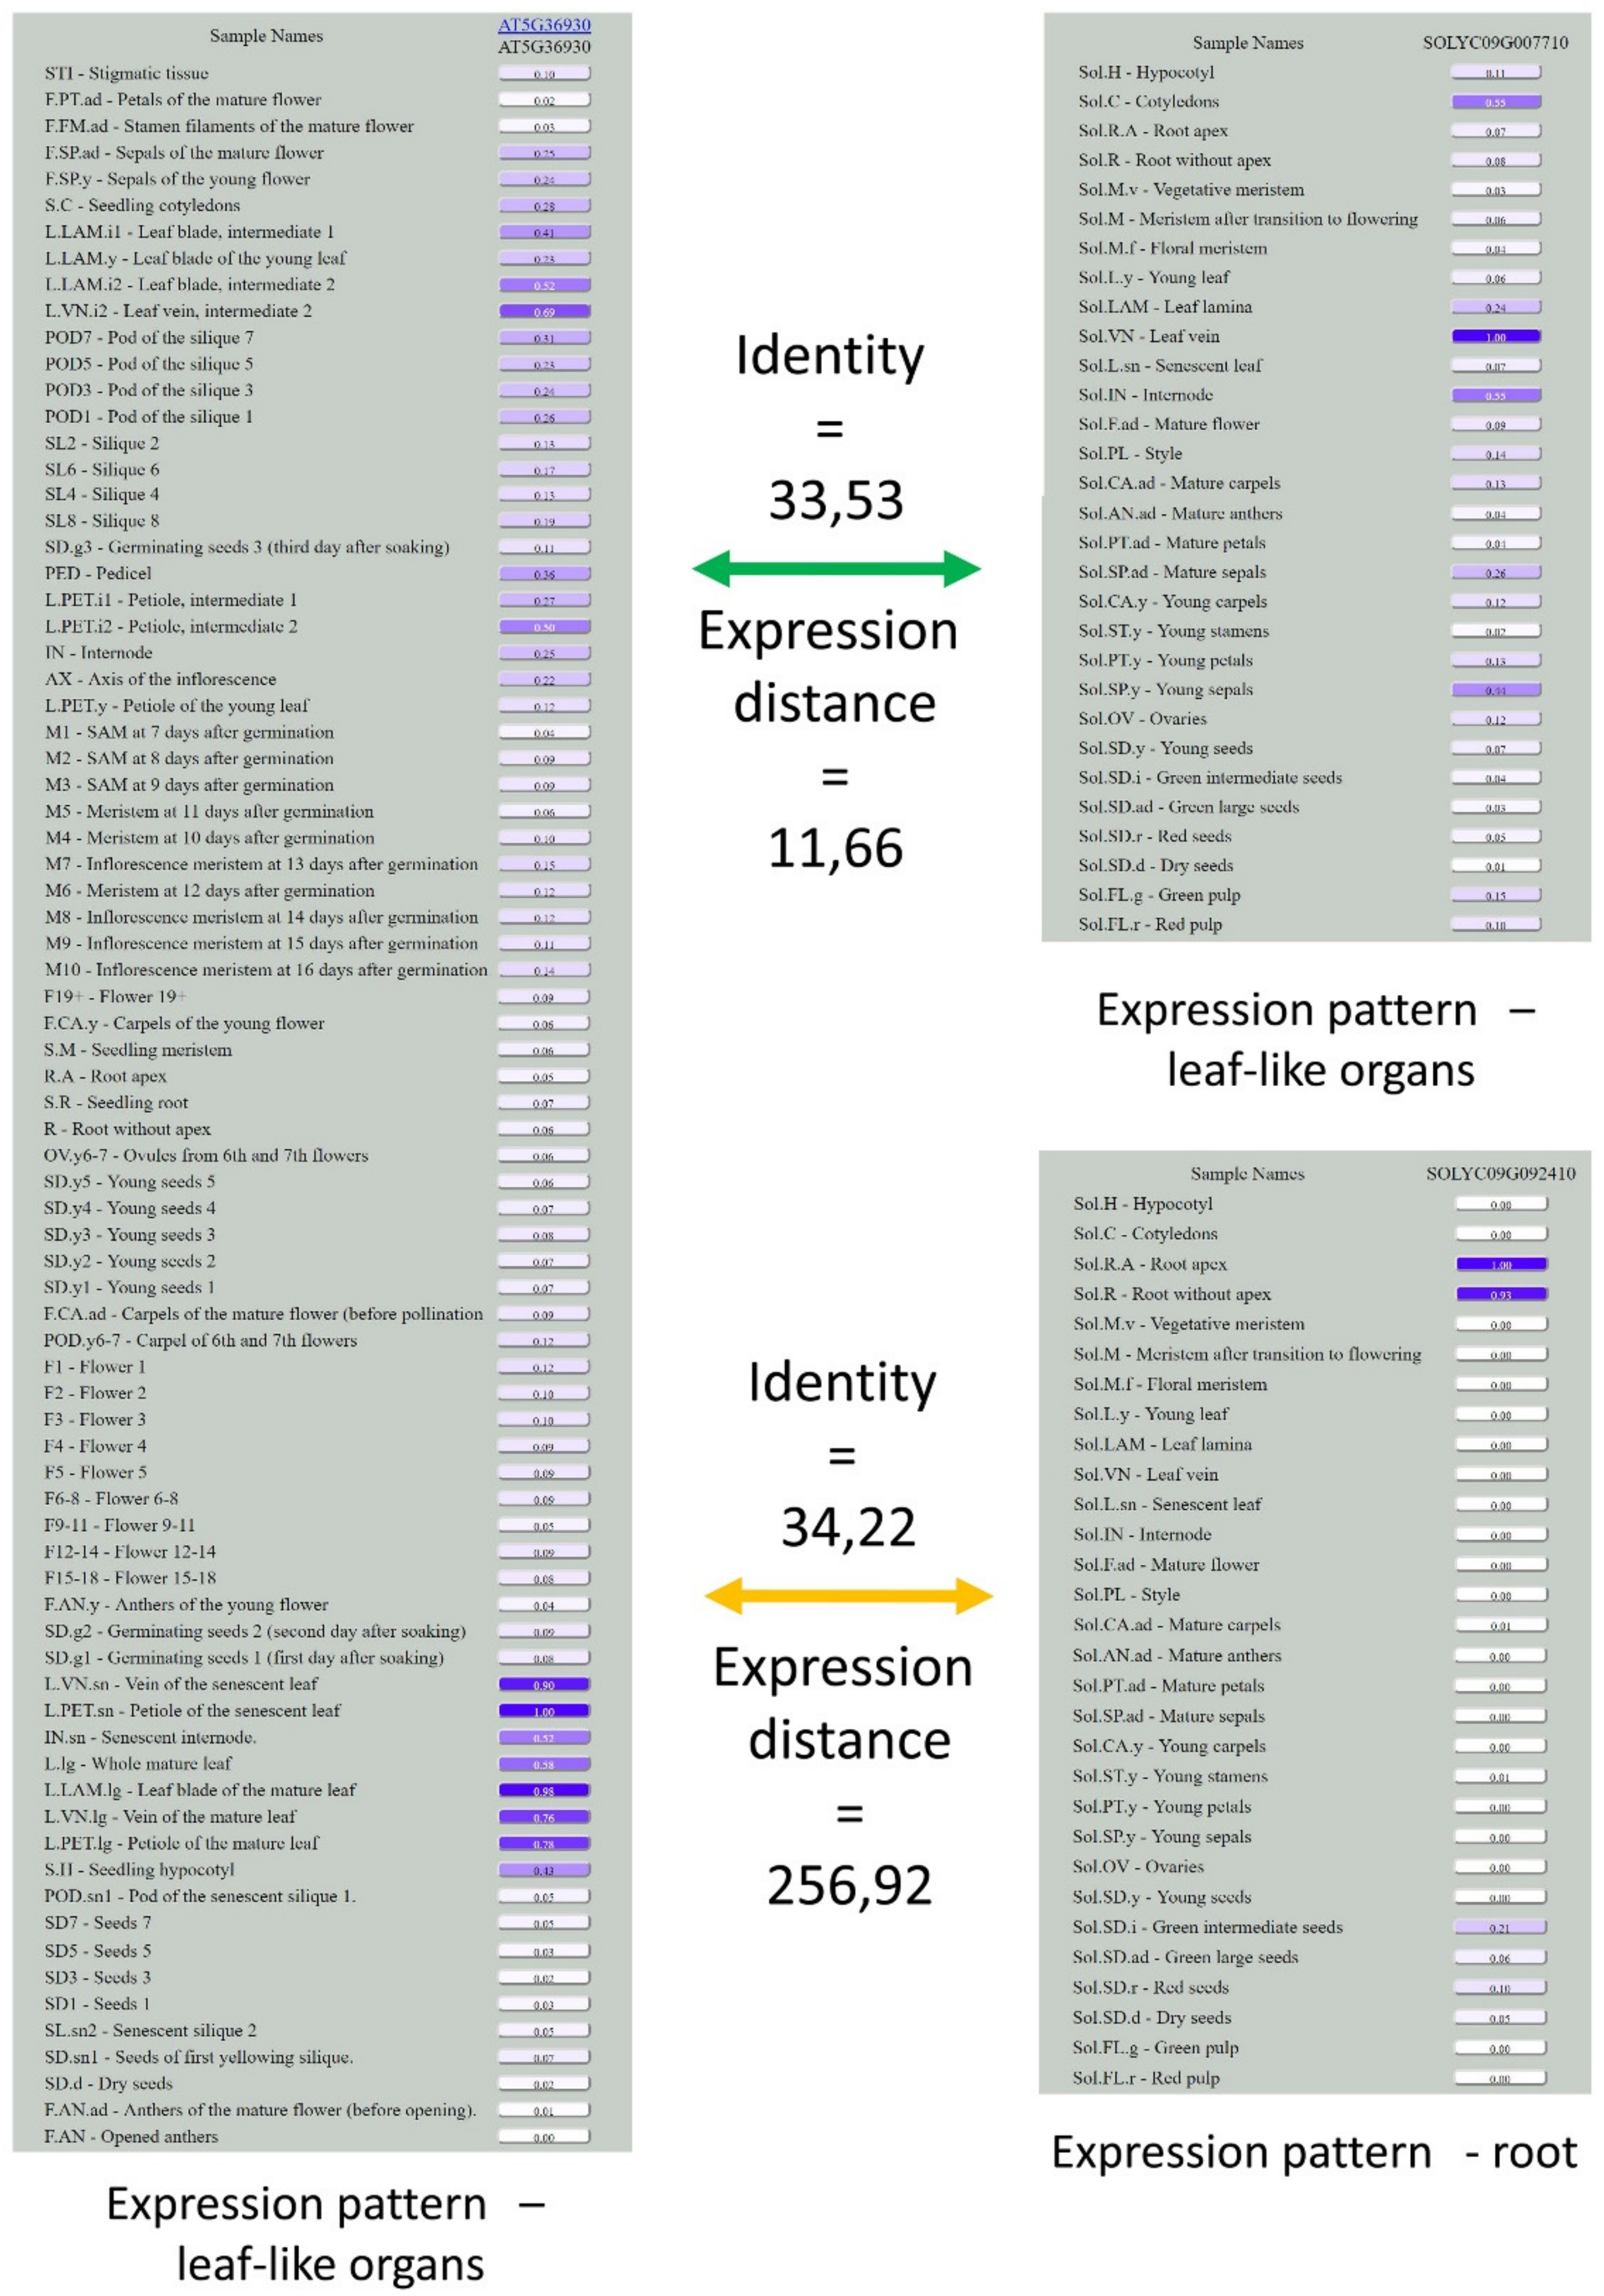
3.3. Analysis of Expression Patterns of Duplicated Genes
3.4. Integration of the Solanum Transcriptome Map into the Database TraVA
4. Conclusions
Supplementary Materials
Author Contributions
Funding
Acknowledgments
Conflicts of Interest
References
- Kyozuka, J.; Konishi, S.; Nemoto, K.; Izawa, T.; Shimamoto, K. Down-regulation of RFL, the FLO/LFY homolog of rice, accompanied with panicle branch initiation. Proc. Natl. Acad. Sci. USA 1998, 95, 1979–1982. [Google Scholar] [CrossRef] [PubMed]
- Kramer, E.M. Patterns of gene duplication and functional evolution during the diversification of the AGAMOUS subfamily of MADS box genes in angiosperms. Genetics 2004, 166, 1011–1023. [Google Scholar] [CrossRef] [PubMed]
- Klepikova, A.V.; Kasianov, A.S.; Gerasimov, E.S.; Logacheva, M.D.; Penin, A.A. A High-resolution map of the Arabidopsis thaliana developmental transcriptome based on RNA-seq profiling. Plant J. 2016, 88, 1058–1070. [Google Scholar] [CrossRef] [PubMed]
- FAO. Production of Tomatoes. FAOSTAT of the United Nations. 2016. Available online: http://www.fao.org/ (accessed on 9 November 2018).
- Bai, Y.; Lindhout, P. Domestication and breeding of tomatoes: What have we gained and what can we gain in the future? Ann. Bot. 2007, 100, 1085–1094. [Google Scholar] [CrossRef] [PubMed]
- Leale, G.; Baya, A.E.; Milone, D.H.; Granitto, P.M.; Stegmayer, G. Inferring unknown biological function by integration of GO annotations and gene expression data. IEEE/ACM Trans. Comput. Biol. Bioinform. 2018, 15, 168–180. [Google Scholar] [CrossRef] [PubMed]
- Wren, J.D. A global meta-analysis of microarray expression data to predict unknown gene functions and estimate the literature-data divide. Bioinformatics 2009, 25, 1694–1701. [Google Scholar] [CrossRef] [PubMed]
- Ma, M.; Liu, Z.L. Comparative transcriptome profiling analyses during the lag phase uncover YAP1, PDR1, PDR3, RPN4, and HSF1 as key regulatory genes in genomic adaptation to the lignocellulose derived inhibitor HMF for Saccharomyces cerevisiae. BMC Genomics 2010, 11, 660. [Google Scholar] [CrossRef] [PubMed]
- Zouine, M.; Maza, E.; Djari, A.; Lauvernier, M.; Frasse, P.; Smouni, A.; Pirrello, J.; Bouzayen, M. TomExpress, a unified tomato RNA-Seq platform for visualization of expression data, clustering and correlation networks. Plant J. 2017, 92, 727–735. [Google Scholar] [CrossRef]
- Fernandez-Pozo, N.; Zheng, Y.; Snyder, S.I.; Nicolas, P.; Shinozaki, Y.; Fei, Z.; Catala, C.; Giovannoni, J.J.; Rose, J.K.C.; Mueller, L.A. The tomato expression atlas. Bioinformatics 2017. [Google Scholar] [CrossRef]
- Pattison, R.J.; Csukasi, F.; Zheng, Y.; Fei, Z.; Van der Knaap, E.; Catala, C. Comprehensive tissue-specific transcriptome analysis reveals distinct regulatory programs during early tomato fruit development. Plant Physiol. 2015, 168, 1684–1701. [Google Scholar] [CrossRef]
- Shinozaki, Y.; Nicolas, P.; Fernandez-Pozo, N.; Ma, Q.; Evanich, D.J.; Shi, Y.; Xu, Y.; Zheng, Y.; Snyder, S.I.; Martin, L.B.B.; et al. High-resolution spatiotemporal transcriptome mapping of tomato fruit development and ripening. Nat. Commun. 2018, 9. [Google Scholar] [CrossRef]
- Cárdenas, P.D.; Sonawane, P.D.; Pollier, J.; Vanden Bossche, R.; Dewangan, V.; Weithorn, E.; Tal, L.; Meir, S.; Rogachev, I.; Malitsky, S.; et al. GAME9 regulates the biosynthesis of steroidal alkaloids and upstream isoprenoids in the plant mevalonate pathway. Nat. Commun. 2016, 7. [Google Scholar] [CrossRef]
- Bolger, A.M.; Lohse, M.; Usadel, B. Trimmomatic: A flexible trimmer for Illumina sequence data. Bioinformatics 2014, 30, 2114–2120. [Google Scholar] [CrossRef] [PubMed]
- Dobin, A.; Davis, C.A.; Schlesinger, F.; Drenkow, J.; Zaleski, C.; Jha, S.; Batut, P.; Chaisson, M.; Gingeras, T.R. STAR: Ultrafast universal RNA-seq aligner. Bioinformatics 2013, 29, 15–21. [Google Scholar] [CrossRef]
- Anders, S.; Huber, W. Differential expression analysis for sequence count data. Genome Biol. 2010, 11, R106. [Google Scholar] [CrossRef] [PubMed]
- Su, Z.; Łabaj, P.P.; Li, S.; Thierry-Mieg, J.; Thierry-Mieg, D.; Shi, W.; Wang, C.; Schroth, G.P.; Setterquist, R.A.; Thompson, J.F.; et al. A comprehensive assessment of RNA-seq accuracy, reproducibility and information content by the Sequencing Quality Control Consortium. Nat. Biotechnol. 2014, 32, 903–914. [Google Scholar] [CrossRef]
- Love, M.I.; Huber, W.; Anders, S. Moderated estimation of fold change and dispersion for RNA-seq data with DESeq2. Genome Biol. 2014, 15, 550. [Google Scholar] [CrossRef]
- Thomas, P.D. PANTHER: A library of protein families and subfamilies indexed by function. Genome Res. 2003, 13, 2129–2141. [Google Scholar] [CrossRef]
- Mi, H.; Muruganujan, A.; Thomas, P.D. PANTHER in 2013: Modeling the evolution of gene function, and other gene attributes, in the context of phylogenetic trees. Nucleic Acids Res. 2012, 41, D377–D386. [Google Scholar] [CrossRef]
- Schug, J.; Schuller, W.-P.; Kappen, C.; Salbaum, J.M.; Bucan, M.; Stoeckert, C.J. Promoter features related to tissue specificity as measured by Shannon entropy. Genome Biol. 2005, 6, R33. [Google Scholar] [CrossRef]
- Emms, D.; Kelly, S. OrthoFinder: solving fundamental biases in whole genome comparisons dramatically improves orthogroup inference accuracy. Genome Biol. 2015, 16, R157. [Google Scholar] [CrossRef] [PubMed]
- Xue, D.Q.; Chen, X.L.; Zhang, H.; Chai, X.F.; Jiang, J.B.; Xu, X.Y.; Li, J.F. Transcriptome analysis of the Cf-12-mediated resistance response to Cladosporium fulvum in tomato. Front. Plant Sci. 2017, 5, 2012. [Google Scholar] [CrossRef] [PubMed]
- Czechowski, T. Genome-wide identification and testing of superior reference genes for transcript normalization in Arabidopsis. Plant Physiol. 2005, 139, 5–17. [Google Scholar] [CrossRef] [PubMed]
- Gutierrez, L.; Mauriat, M.; Pelloux, J.; Bellini, C.; Van Wuytswinkel, O. Towards a systematic validation of references in real-time RT-PCR. Plant Cell 2008, 20, 1734–1735. [Google Scholar] [CrossRef] [PubMed]


| Without Filtering | Filter 1 (Identification in Two Samples) | Filter 2 (Identification in Two Replicates) | |
|---|---|---|---|
| Introns, total | 375,650 | 240,224 | 168,243 |
| Not annotated but found | 266,580 | 132,884 | 62,834 |
| Annotated but not found | 14,547 | 16,277 | 18,208 |
| Expression Distance Distance = 0 Corresponds to Identical Expression Patterns | Identity Identity = 100 Corresponds to Identical Sequences | ||
|---|---|---|---|
| Orthopairs | 3.68 | Orthopairs | 58.48 |
| Random pairs | 17.42 | Random pairs | 8.40 |
| Minimal distance in interspecific pairs from ortho-triplets | 4.12 | Maximal identity in interspecific pairs from ortho-triplets | 58.78 |
| Maximal distance in interspecific pairs from ortho-triplets | 8.52 | Minimal identity in interspecific pairs from ortho-triplets | 55.01 |
| Minimal distance in interspecific pairs from random triplets | 9.76 | Maximal identity in interspecific pairs from random triplets | 10.96 |
| Maximal distance in interspecific pairs from random triplets | 37.64 | Minimal identity in interspecific pairs from random triplets | 6.18 |
© 2019 by the authors. Licensee MDPI, Basel, Switzerland. This article is an open access article distributed under the terms and conditions of the Creative Commons Attribution (CC BY) license (http://creativecommons.org/licenses/by/4.0/).
Share and Cite
Penin, A.A.; Klepikova, A.V.; Kasianov, A.S.; Gerasimov, E.S.; Logacheva, M.D. Comparative Analysis of Developmental Transcriptome Maps of Arabidopsis thaliana and Solanum lycopersicum. Genes 2019, 10, 50. https://doi.org/10.3390/genes10010050
Penin AA, Klepikova AV, Kasianov AS, Gerasimov ES, Logacheva MD. Comparative Analysis of Developmental Transcriptome Maps of Arabidopsis thaliana and Solanum lycopersicum. Genes. 2019; 10(1):50. https://doi.org/10.3390/genes10010050
Chicago/Turabian StylePenin, Aleksey A., Anna V. Klepikova, Artem S. Kasianov, Evgeny S. Gerasimov, and Maria D. Logacheva. 2019. "Comparative Analysis of Developmental Transcriptome Maps of Arabidopsis thaliana and Solanum lycopersicum" Genes 10, no. 1: 50. https://doi.org/10.3390/genes10010050
APA StylePenin, A. A., Klepikova, A. V., Kasianov, A. S., Gerasimov, E. S., & Logacheva, M. D. (2019). Comparative Analysis of Developmental Transcriptome Maps of Arabidopsis thaliana and Solanum lycopersicum. Genes, 10(1), 50. https://doi.org/10.3390/genes10010050