Article

FAM64A: A Novel Oncogenic Target of Lung Adenocarcinoma Regulated by Both Strands of miR-99a (miR-99a-5p and miR-99a-3p)

1
Department of Pulmonary Medicine, Graduate School of Medical and Dental Sciences, Kagoshima University, Kagoshima 890-8544, Japan
2
MSD K.K., Tokyo 102-8667, Japan
3
Department of Functional Genomics, Chiba University Graduate School of Medicine, Chiba 260-8670, Japan
4
Department of Biochemistry and Genetics, Chiba University Graduate School of Medicine, Chiba 260-8670, Japan
*
Author to whom correspondence should be addressed.
These authors contributed equally to this paper.
Cells 2020, 9(9), 2083; https://doi.org/10.3390/cells9092083
Submission received: 6 August 2020 / Revised: 28 August 2020 / Accepted: 10 September 2020 / Published: 11 September 2020
(This article belongs to the Special Issue microRNA as Therapeutic Target)

Abstract

:
Lung adenocarcinoma (LUAD) is the most aggressive cancer and the prognosis of these patients is unfavorable. We revealed that the expression levels of both strands of miR-99a (miR-99a-5p and miR-99a-3p) were significantly suppressed in several cancer tissues. Analyses of large The Cancer Genome Atlas (TCGA) datasets showed that reduced miR-99a-5p or miR-99a-3p expression is associated with worse prognoses in LUAD patients (disease-free survival (DFS): p = 0.1264 and 0.0316; overall survival (OS): p = 0.0176 and 0.0756, respectively). Ectopic expression of these miRNAs attenuated LUAD cell proliferation, suggesting their tumor-suppressive roles. Our in silico analysis revealed 23 putative target genes of pre-miR-99a in LUAD cells. Among these targets, high expressions of 19 genes were associated with worse prognoses in LUAD patients (OS: p < 0.05). Notably, FAM64A was regulated by both miR-99a-5p and miR-99a-3p in LUAD cells, and its aberrant expression was significantly associated with poor prognosis in LUAD patients (OS: p = 0.0175; DFS: p = 0.0276). FAM64A knockdown using siRNAs suggested that elevated FAM64A expression contributes to cancer progression. Aberrant FAM64A expression was detected in LUAD tissues by immunostaining. Taken together, our miRNA-based analysis might be effective for identifying prognostic and therapeutic molecules in LUAD.

1. Introduction

Lung cancer is one of the most common and lethal cancers. In 2018, approximately 2.1 million people were diagnosed with this disease, and 1.8 million patients died from it [1]. Lung cancers are divided into two pathological types: small-cell lung cancer and non-small-cell lung cancer (NSCLC). NSCLC includes squamous cell carcinoma, adenocarcinoma and large-cell carcinoma [2]. Among NSCLCs, lung adenocarcinoma (LUAD) is the most common, and it is often at an advanced stage by the time of diagnosis, and thus the prognosis of the patients is unfavorable (5-year survival rate on average below 20% on average) [3].
Recently, the survival rate of LUAD patients has improved because of the development of molecularly targeted drugs and immune checkpoint inhibitors [4,5,6]. Various molecular targeted agents have become available, based on driver gene mutations in LUAD [5,6,7]. However, there is a population of LUAD patients who harbor no driver gene mutations, indicating that several distinct molecular and genetic pathways contribute to LUAD progression.
To understand the molecular pathogenesis of LUAD, we applied a microRNA (miRNA)-based approach. miRNAs (19- to 22-nucleotide-long RNA molecules) function as fine-tuners of gene expression regulation in various cells [8,9]. A single miRNA can regulate the expression of a vast number of genes; therefore, aberrant expression of miRNAs disrupts intracellular gene expression networks. A large number of studies have shown that abnormal miRNA expression contributes to several oncogenic pathways [10,11,12,13,14].
We have previously determined miRNA expression signatures in various types of cancers using RNA sequencing [15,16,17,18,19]. Our recent studies have demonstrated that some passenger strands derived from pre-miRNAs contribute to the malignant transformation of cancer cells [15,16,17,18,19]. We have shown that both strands of miRNAs (e.g., pre-miR-144, pre-miR-145 and pre-miR-150) were significantly downregulated in lung cancer tissues, and their ectopic expression attenuated the malignant phenotypes of lung cancer cells (e.g., cancer cell proliferation, migration and invasion) [20,21,22,23,24]. The involvement of the passenger strand of miRNAs in the pathogenesis of cancer is a new theme in cancer research.
Based on miRNA signatures by RNA sequencing, we revealed that expression levels of both strands derived from pre-miR-99a (miR-99a-5p: the guide strand; miR-99a-3p: the passenger strand) were suppressed in several types of cancer tissues [15,16,17,18,19]. In the current study, we investigated the tumor-suppressive functions of both strands of pre-miR-99a and identified their oncogenic targets in LUAD cells. Notably, a total of 19 genes (CKS1B, KCMF1, CENPF, CASC5, MKI67, ESCO2, FANCI, SGOL1, MCM4, KIF11, NEK2, MTHFD2, NCAPG, RRM2, FAM136A, ZWINT, CDK1, CDKN3 and FAM64A) were identified as targets of pre-miR-99a regulation, and they significantly predicted the prognosis (5-year overall survival) of the patients with LUAD. Among the targets, we focused on FAM64A, as it was regulated directly by both miR-99a-5p and miR-99a-3p in LUAD cells. Our miRNA analysis strategy will accelerate the understanding of the molecular mechanism of LUAD.

2. Materials and Methods

2.1. Data Mining of miRNA Target Genes and Their Expression in LUAD Clinical Specimens

Gene expression data in LUAD obtained from The Cancer Genome Atlas (TCGA) were retrieved on 6 March 2020 from the cBioPortal database (https://www.cbioportal.org/) [25], UCSC Xena platform (https://xena.ucsc.edu/) [26] and Firebrowse (http://firebrowse.org/). The mRNA expression Z-scores and information on the clinical samples corresponding to LUAD patients were collected from cBioPortal. To categorize genes into molecular pathways based on gene set enrichment analysis (GSEA) [27], we employed the WebGestalt program (http://www.webgestalt.org/) [28].
Putative target genes possessing binding sites for miR-99a-5p and miR-99a-3p were isolated using the TargetScanHuman database ver. 7.2 (http://www.targetscan.org/vert_72/) [29]. Comprehensive correlations between mRNA and miRNA gene expression in LUAD samples from TCGA were analyzed by LinkedOmics (http://www.linkedomics.org/) [30].

2.2. Transfection of miRNAs, siRNAs and Plasmid Vectors into LUAD Cells and Functional Assays

The procedures for transfecting miRNAs, siRNAs and plasmid vectors were described in our previous studies [20,21,22,23,24]. Functional assays (cell proliferation and cell cycle) were performed in LUAD cells, as described in our previous studies [20,21,22,23,24]. The reagents used are listed in Supplementary Table S1.

2.3. Plasmid Construction and Dual-Luciferase Reporter Assays

The vectors used for this analysis were constructed as described in our previous studies [20,21,22,23,24]. Supplementary Figure S1 shows the sequences incorporated into the vectors. The analysis was performed according to our previous studies [20,21,22,23,24]. The reagents used are listed in Supplementary Table S1.

2.4. Immunohistochemistry

The immunohistochemistry procedure was described in our previous studies [20,21,22,23,24]. The antibodies used in this study are listed in Supplementary Table S1.

2.5. Stastistical Analyses

Statistical analyses were performed using GraphPad Prism 7 (GraphPad Software, La Jolla, CA, USA) and JMP Pro 14 (SAS Institute Inc., Cary, NC, USA). The Mann–Whitney U test was used to determine the significance of differences between two groups, and one-way analysis of variance and Tukey’s test for post-hoc analysis were used for multiple group comparisons. To evaluate the correlation between two variables, we applied Spearman’s rank test. Overall survival (OS) and disease-free survival (DFS) were assessed using the Kaplan–Meier method and log-rank test. To identify independent factors predicting OS and DFS, we utilized multivariate Cox proportional hazards models.

3. Results

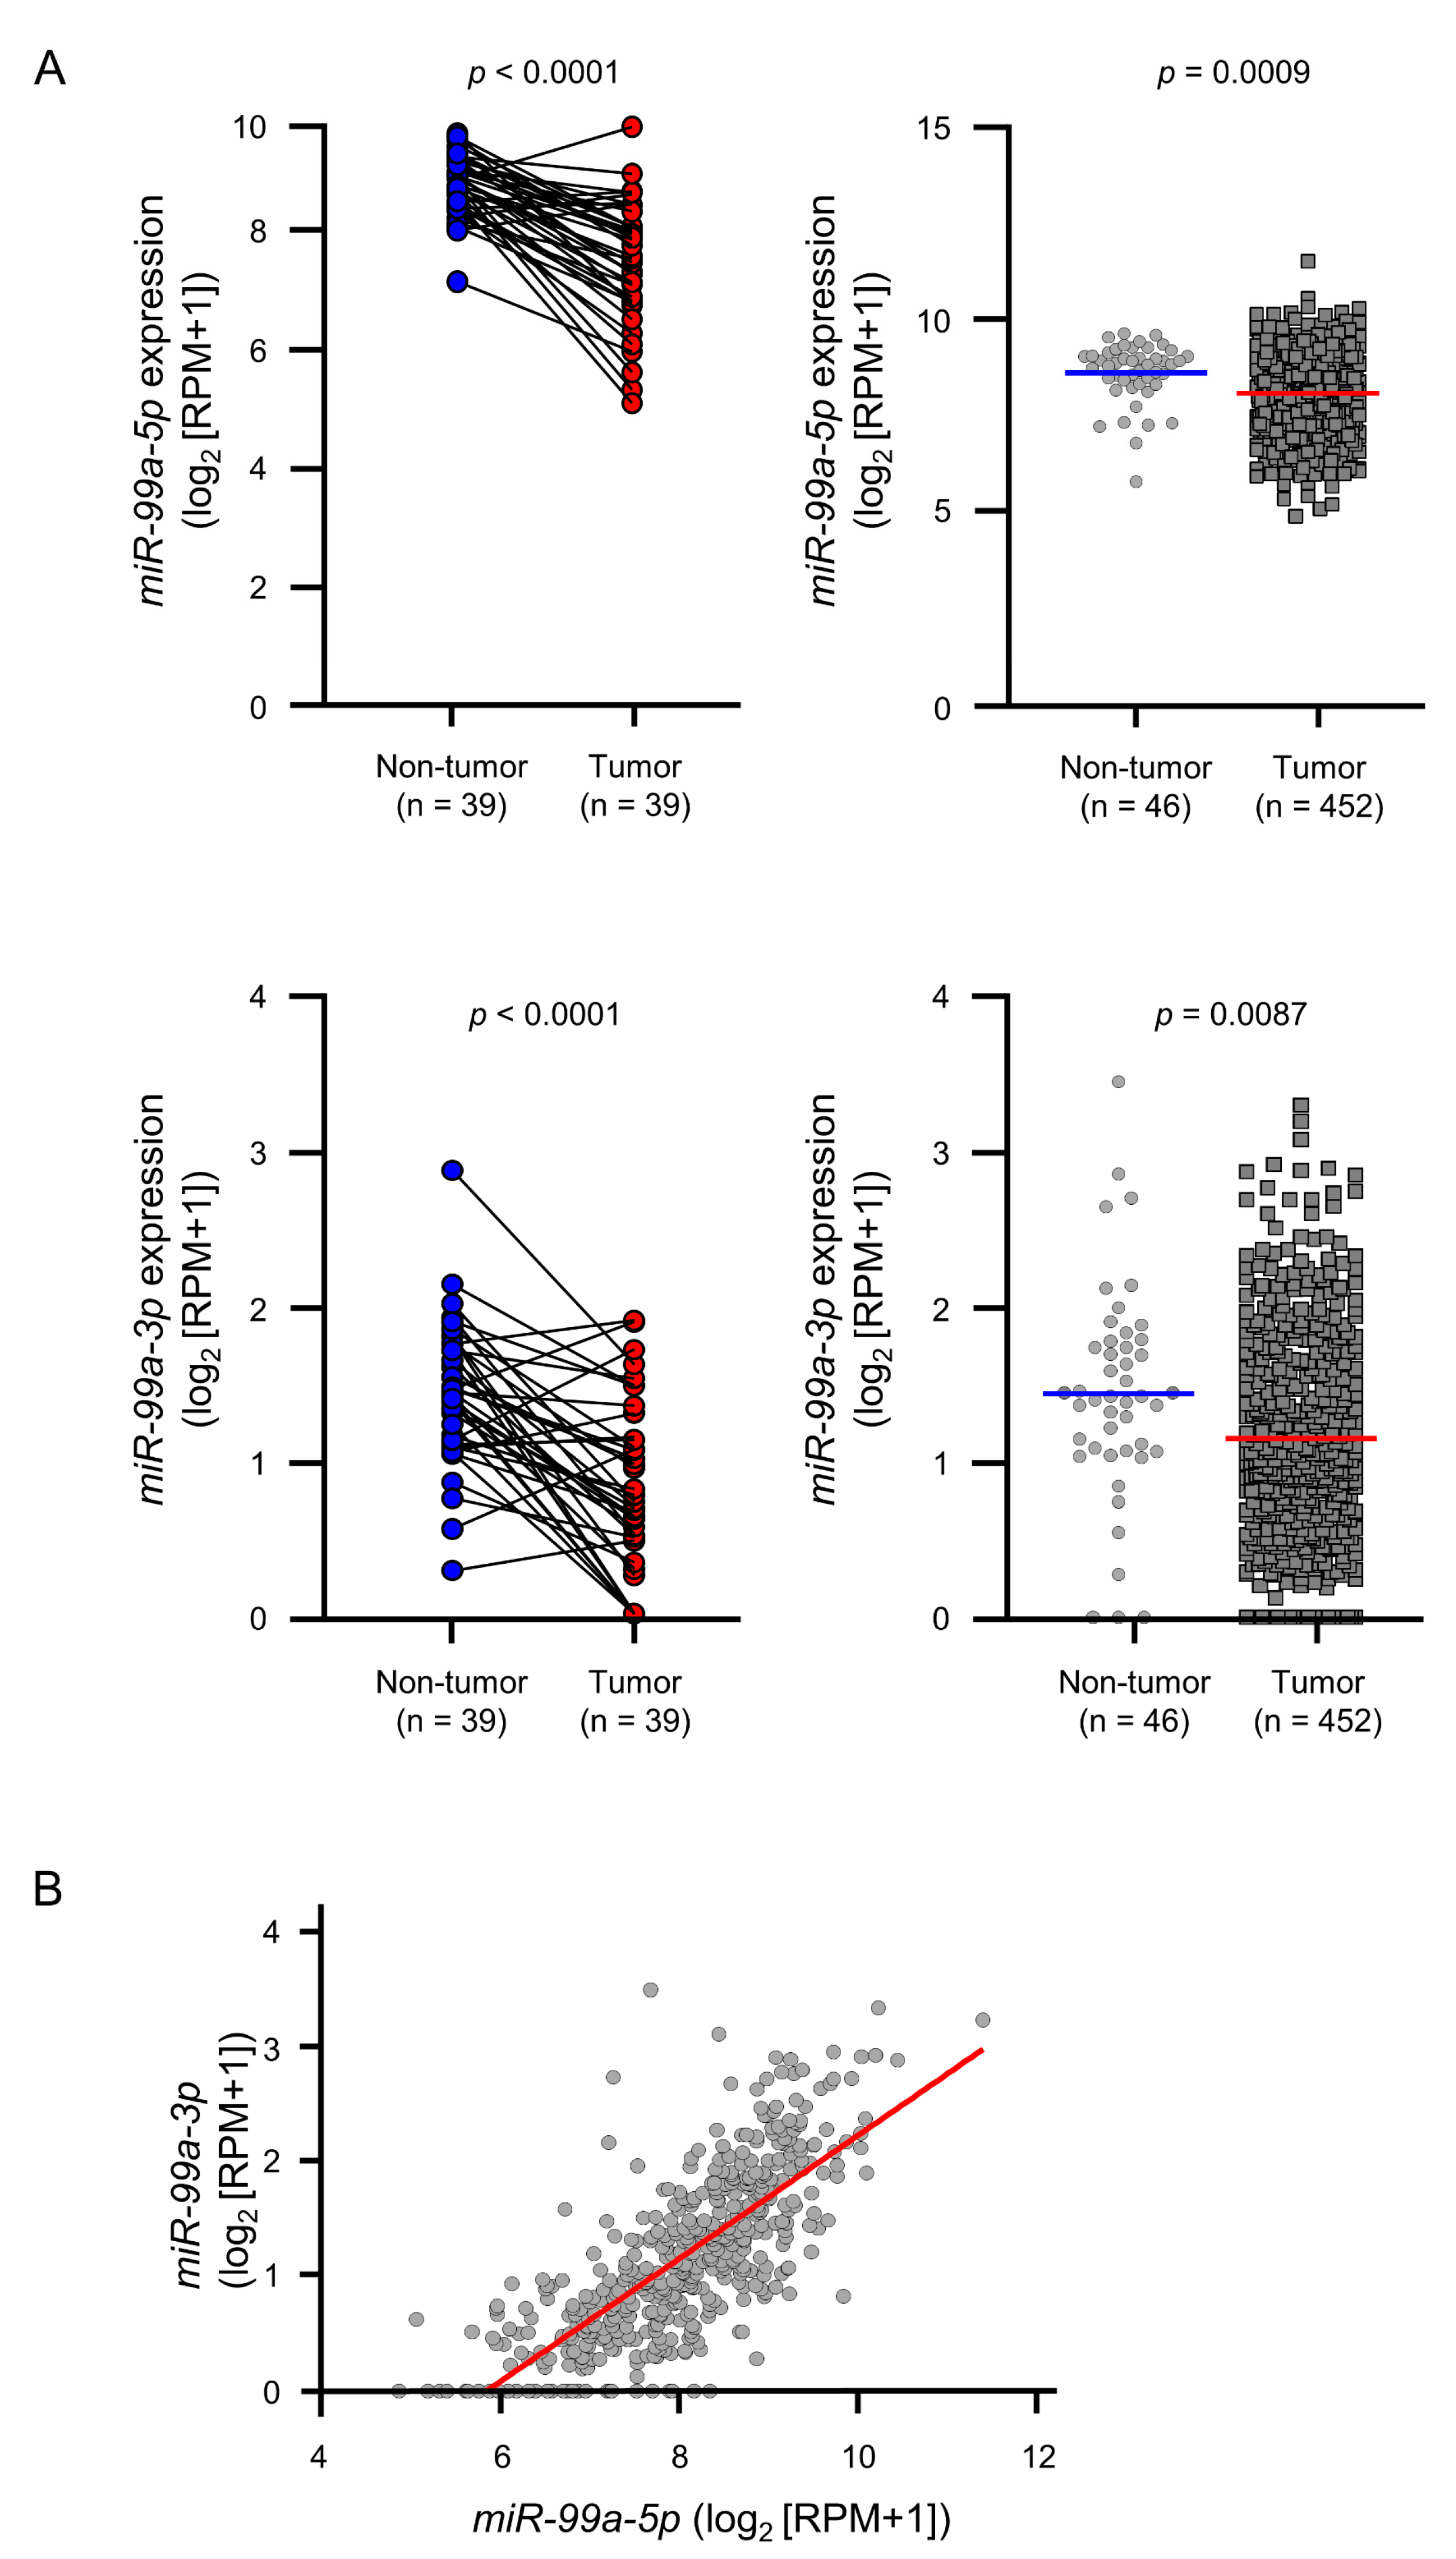
3.1. Downregulation of miR-99a-5p and miR-99a-3p in LUAD Clinical Specimens and Their Clinical Significance

The expression levels of miR-99a-5p and miR-99a-3p were evaluated using miRNA-seq data of TCGA-LUAD from Firebrowse. The miRNA-seq data showed that expression levels of miR-99a-5p and miR-99a-3p were significantly suppressed in LUAD tissues compared with normal lung tissues (Figure 1A). According to Spearman’s rank test, a positive correlation was detected between the expression levels of the two miRNA strands (r = 0.7716, p < 0.0001; Figure 1B).
Kaplan–Meier plot and log-rank test using survival data from TCGA-LUAD revealed that low expression of miR-99a-5p was associated with a worse prognosis compared with high expression (DFS: p = 0.1264; OS: p = 0.00176) (Figure 2A). Similarly, low expression of miR-99a-3p was associated with a worse prognosis compared with high expression (DFS: p = 0.0316; OS: p = 0.0756) (Figure 2A).
Similarly, the patients were divided into two groups according to the expression levels of miR-99a-5p and miR-99a-3p (top 25%: red lines and low 25%: blue lines) and analyzed. Kaplan–Meier plot and log-rank test showed that low expression of miR-99a-5p was associated with a worse prognosis compared with high expression (DFS: p = 0.0035; OS: p = 0.0005) (Figure 2B). Low expression of miR-99a-3p was associated with a worse prognosis compared with high expression (DFS: p = 0.0517; OS: p = 0.0139) (Figure 2B).

3.2. Tumor-Suppressive Functions of miR-99a-5p and miR-99a-3p Assessed by Ectopic Expression Assays

We assessed changes in cell proliferation and cell cycle after ectopic expression of these miRNAs into A549 and H1299 cells. Cell proliferation (XTT assay) was significantly inhibited by miR-99a-5p or miR-99a-3p expression in A549 and H1299 LUAD cell lines (Figure 3A). To investigate the synergistic effects of miR-99a-5p and miR-99a-3p, we performed proliferation assays with co-transfection of miR-99a-5p and miR-99a-3p in LUAD cells (A549 and H1299), but they did not show synergistic effects of these miRNAs transfection (Supplementary Figure S2). In the cell cycle analysis by flow cytometry, the number of LUAD cells in the G0/G1 phase was increased after ectopic expression of these miRNAs compared with control miRNA (Figure 3B). Our data suggest that ectopic expression of miR-99a-5p and miR-99a-3p induces G1 arrest in LUAD cells.

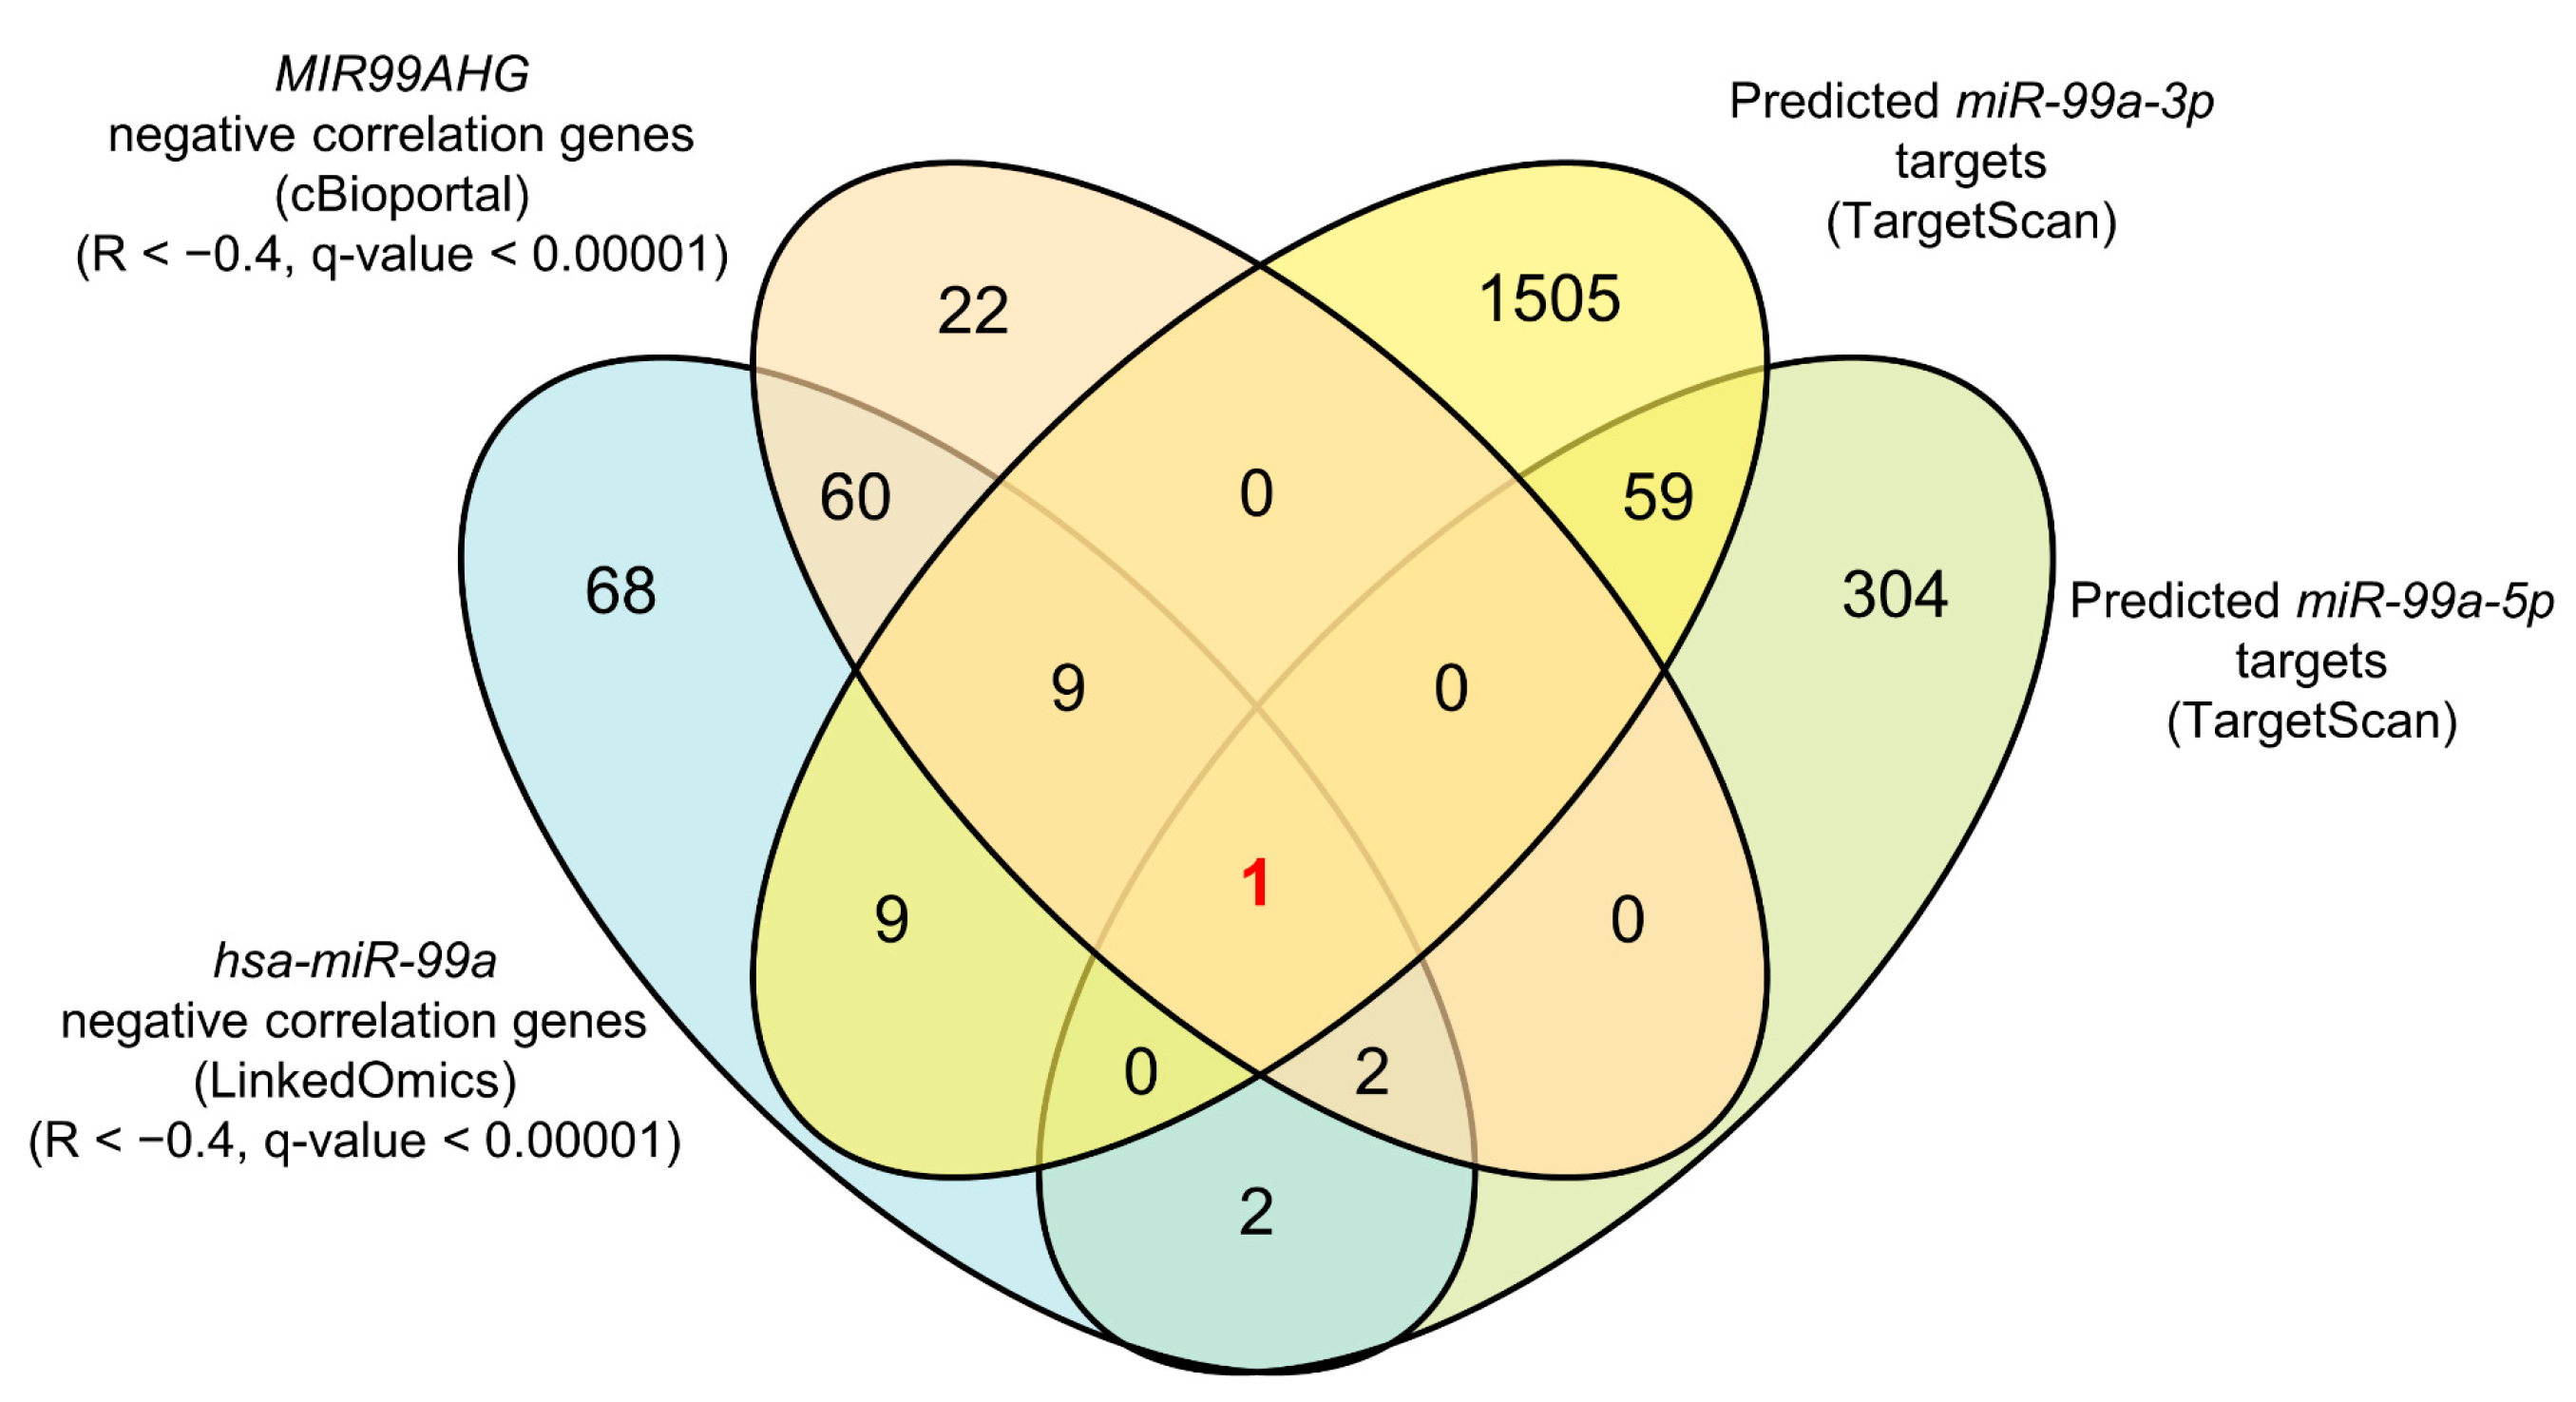
3.3. Identification of miR-99a-5p and miR-99a-3p Target Genes in LUAD

To identify genes regulated by pre-miR-99a in LUAD cells, we applied in silico analyses using the TargetScanHuman (release 7.2), LinkedOmics and cBioportal databases (Figure 4). A total of 23 genes were identified as pre-miR-99a targets in LUAD cells (five miR-99a-5p targets and 19 miR-99a-3p targets; Table 1). Notably, FAM64A was identified as a target of both miR-99a-5p and miR-99a-3p.

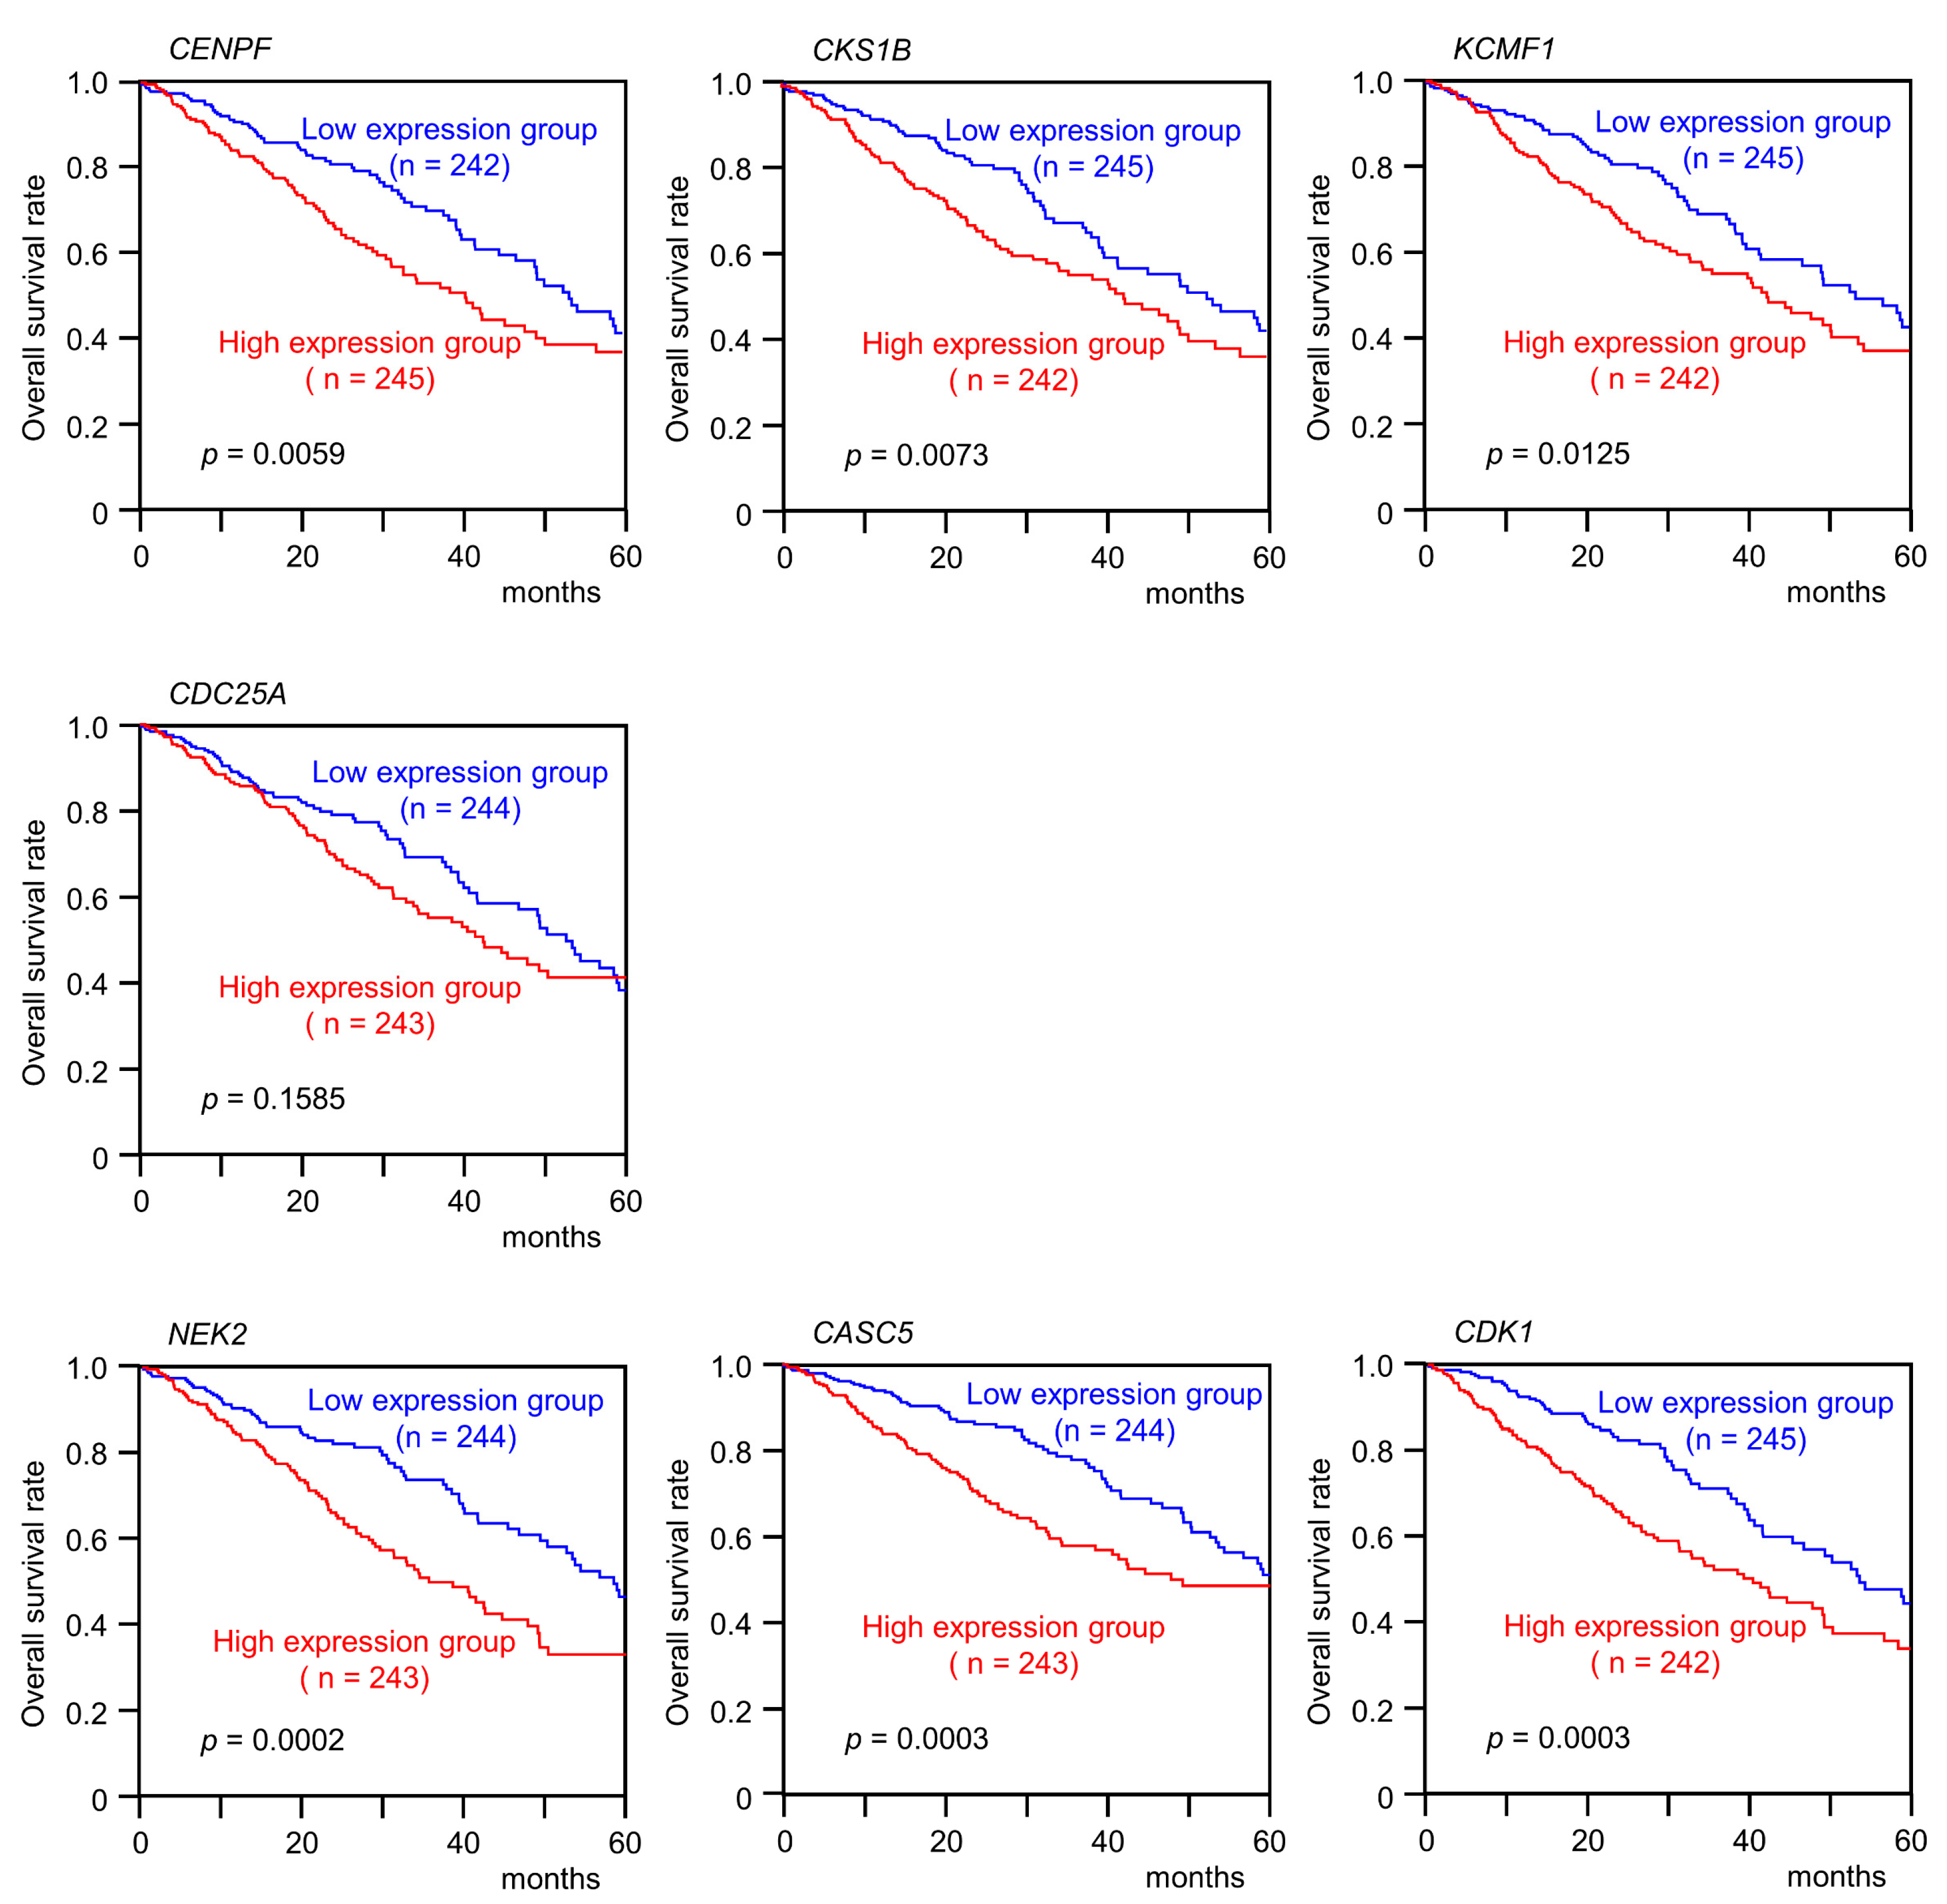
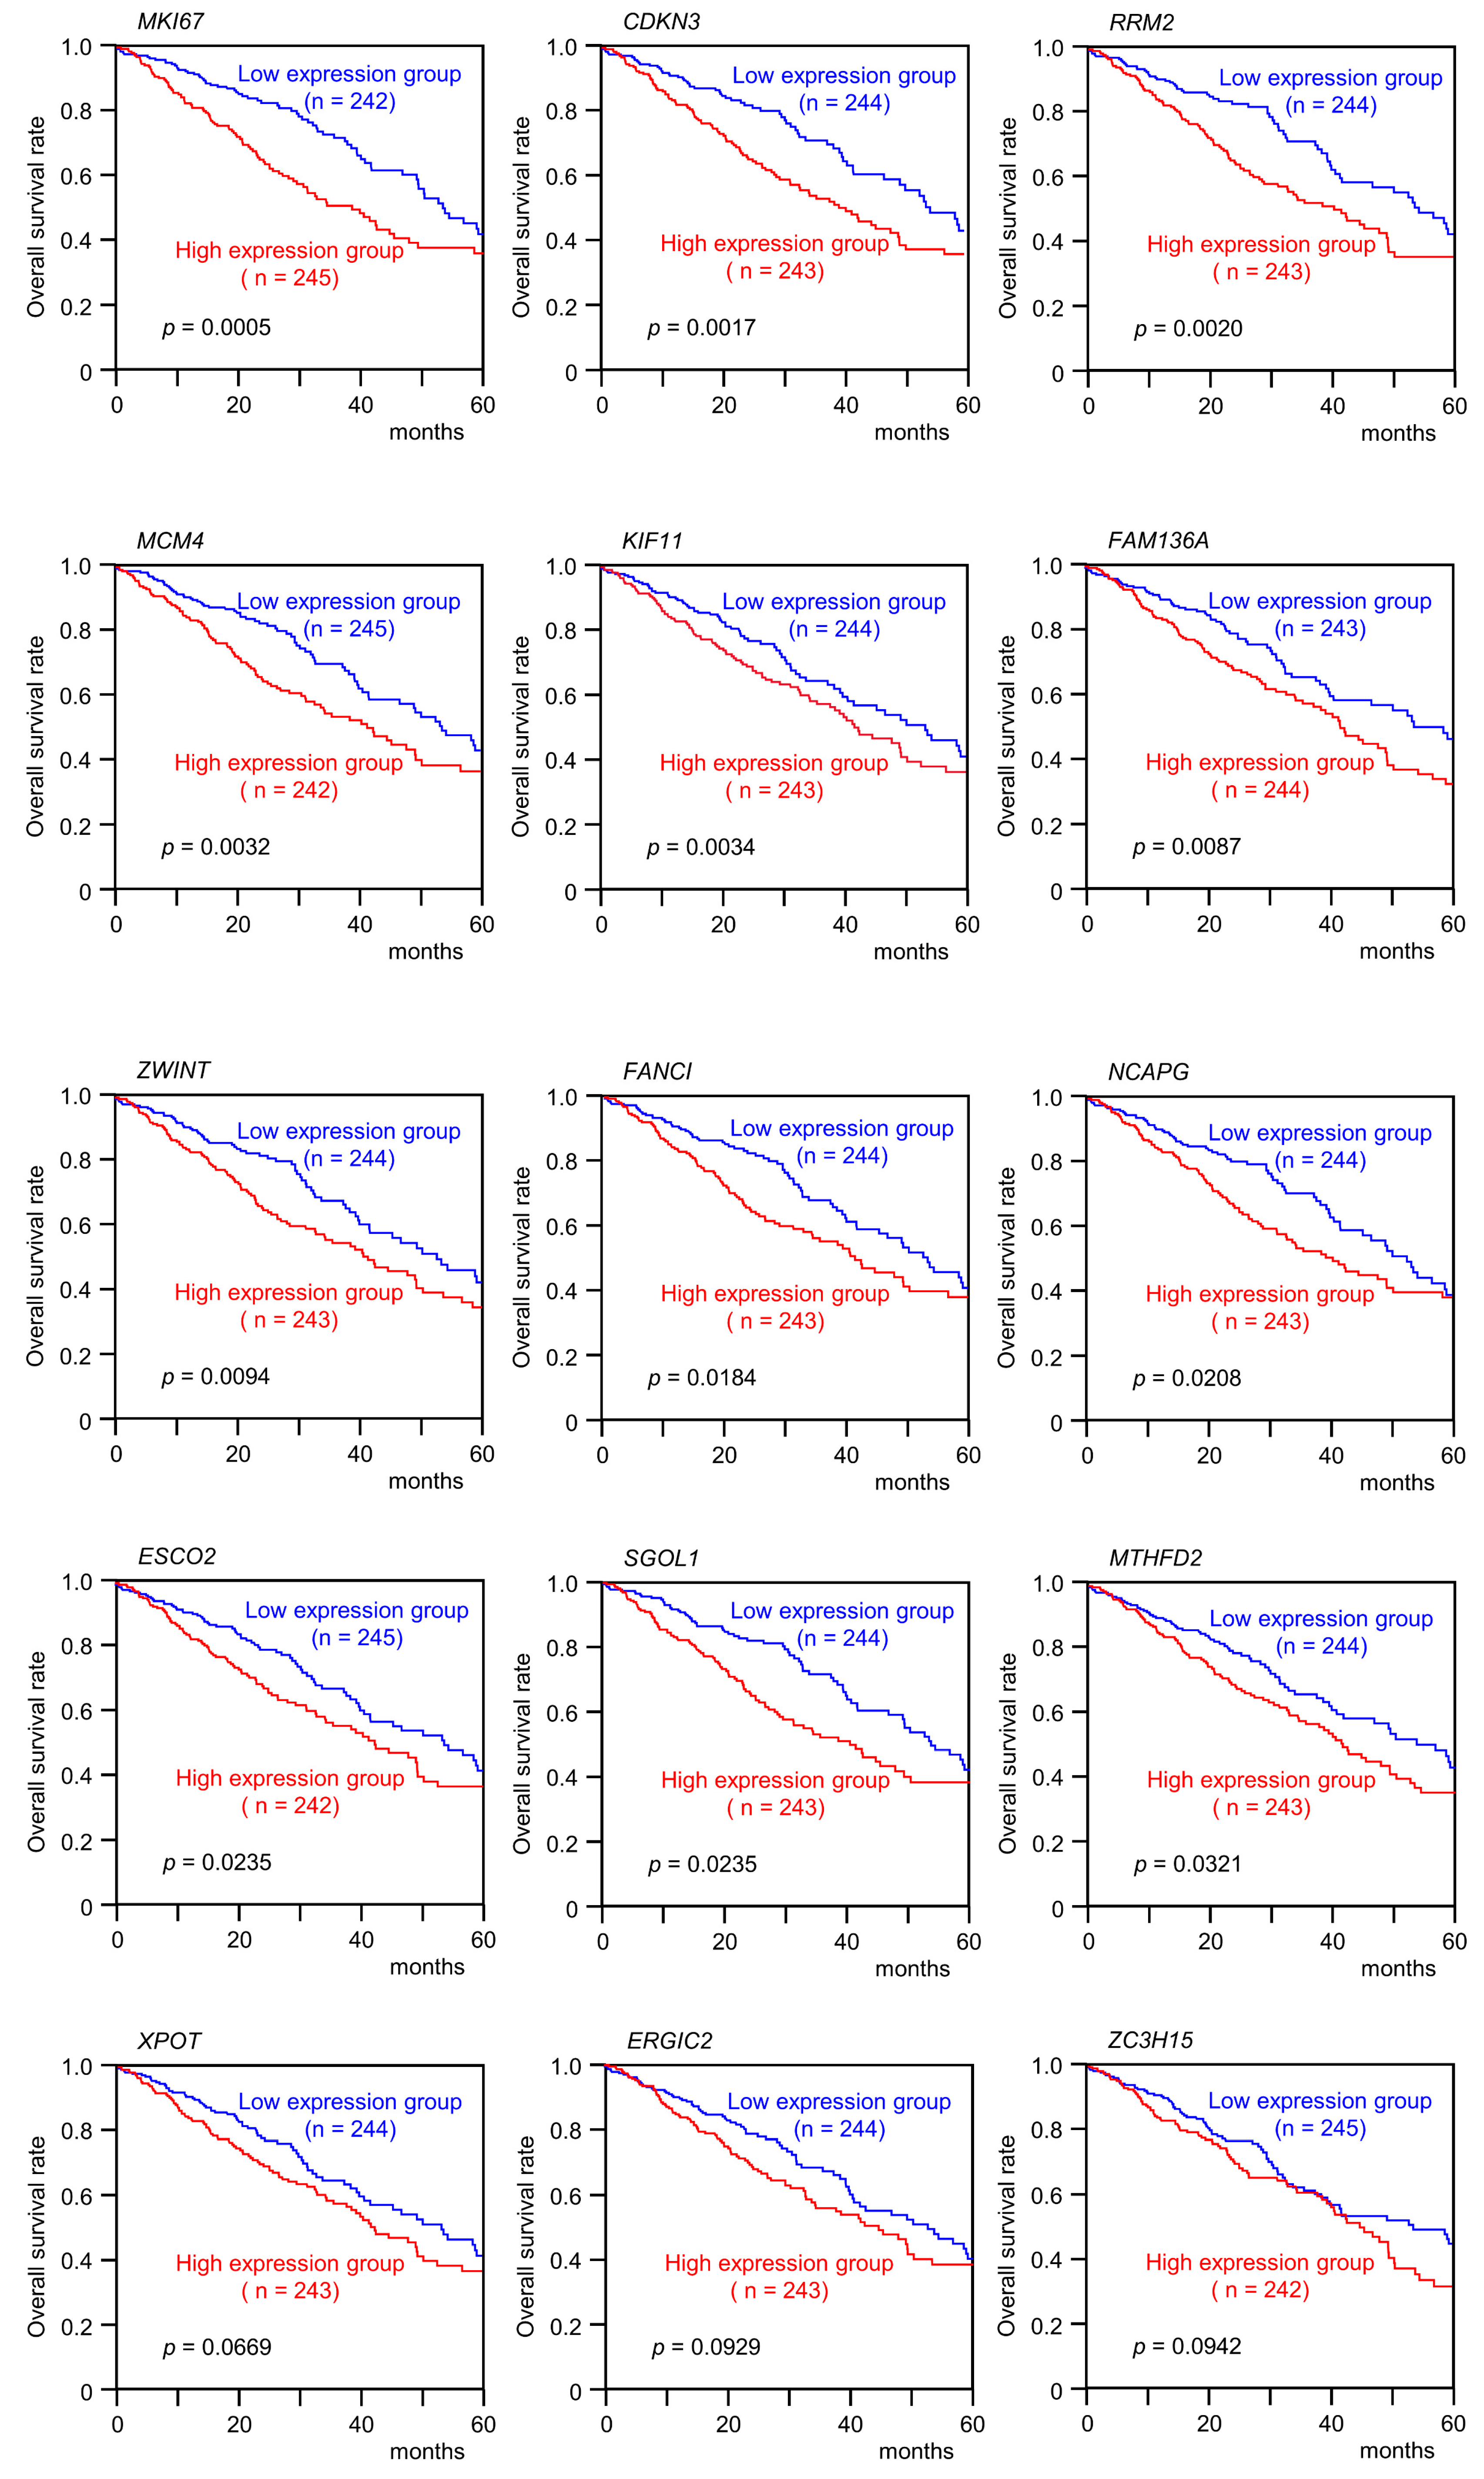
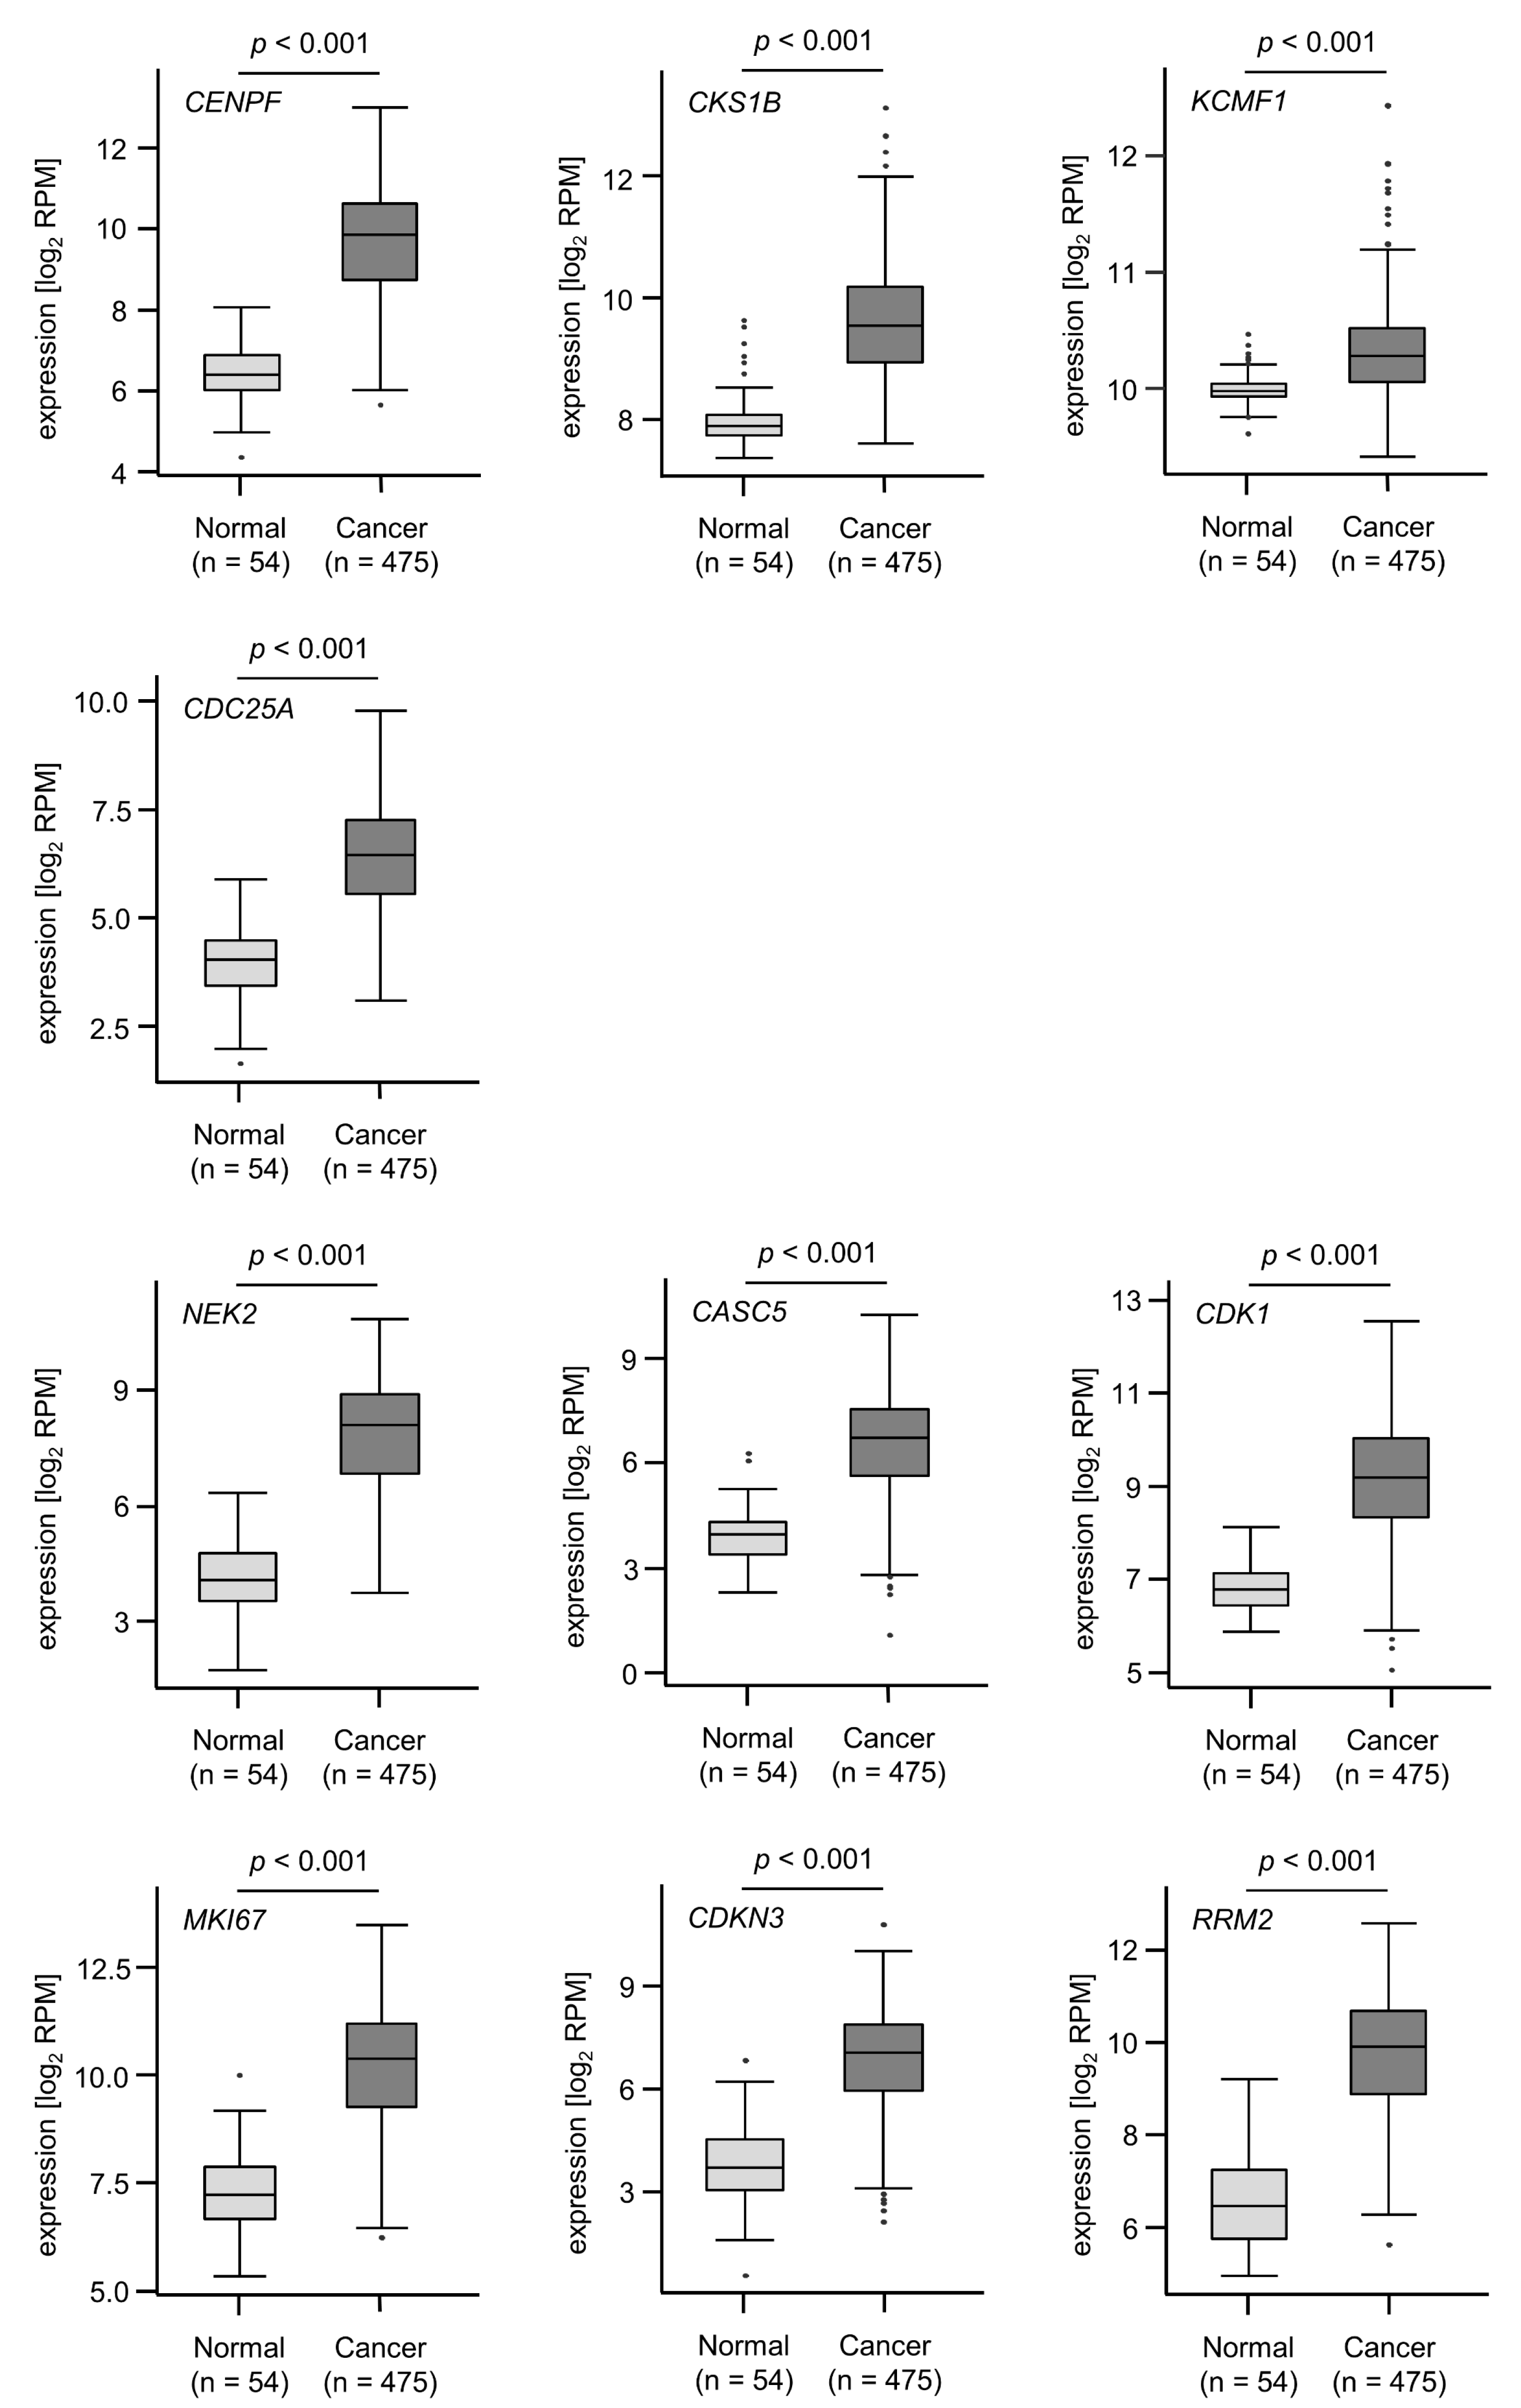
3.4. Clinical Significance of miR-99a-5p and miR-99a-3p Target Genes in LUAD Pathogenesis

We evaluated the associations between expression levels of the genes and survival using TCGA and GEO datasets. Among 22 of the 23 target genes (excluding FAM64A), high expression of 18 genes (CKS1B, KCMF1, CENPF, CASC5, MKI67, ESCO2, FANCI, SGOL1, MCM4, KIF11, NEK2, MTHFD2, NCAPG, RRM2, FAM136A, ZWINT, CDK1 and CDKN3) significantly predicted worse survival (OS: 5-year survival rate) in patients with LUAD (Figure 5). We also adjusted the multiplicity by using Benjamini–Hochberg analysis and confirmed that 19 out of these 23 target genes were significant (Supplementary Table S3). All genes were upregulated in cancer tissues compared with normal tissues (Figure 6). We also classified these target genes according to Gene Ontology (GO: Biological Process) criteria by using the GeneCodis database. The GO classification of the genes controlled by each miRNA was shown in Supplementary Table S4. Each miRNA has regulated genes associated with “cell cycle (GO: 0007049)” and “cell division (GO: 0051301)”.

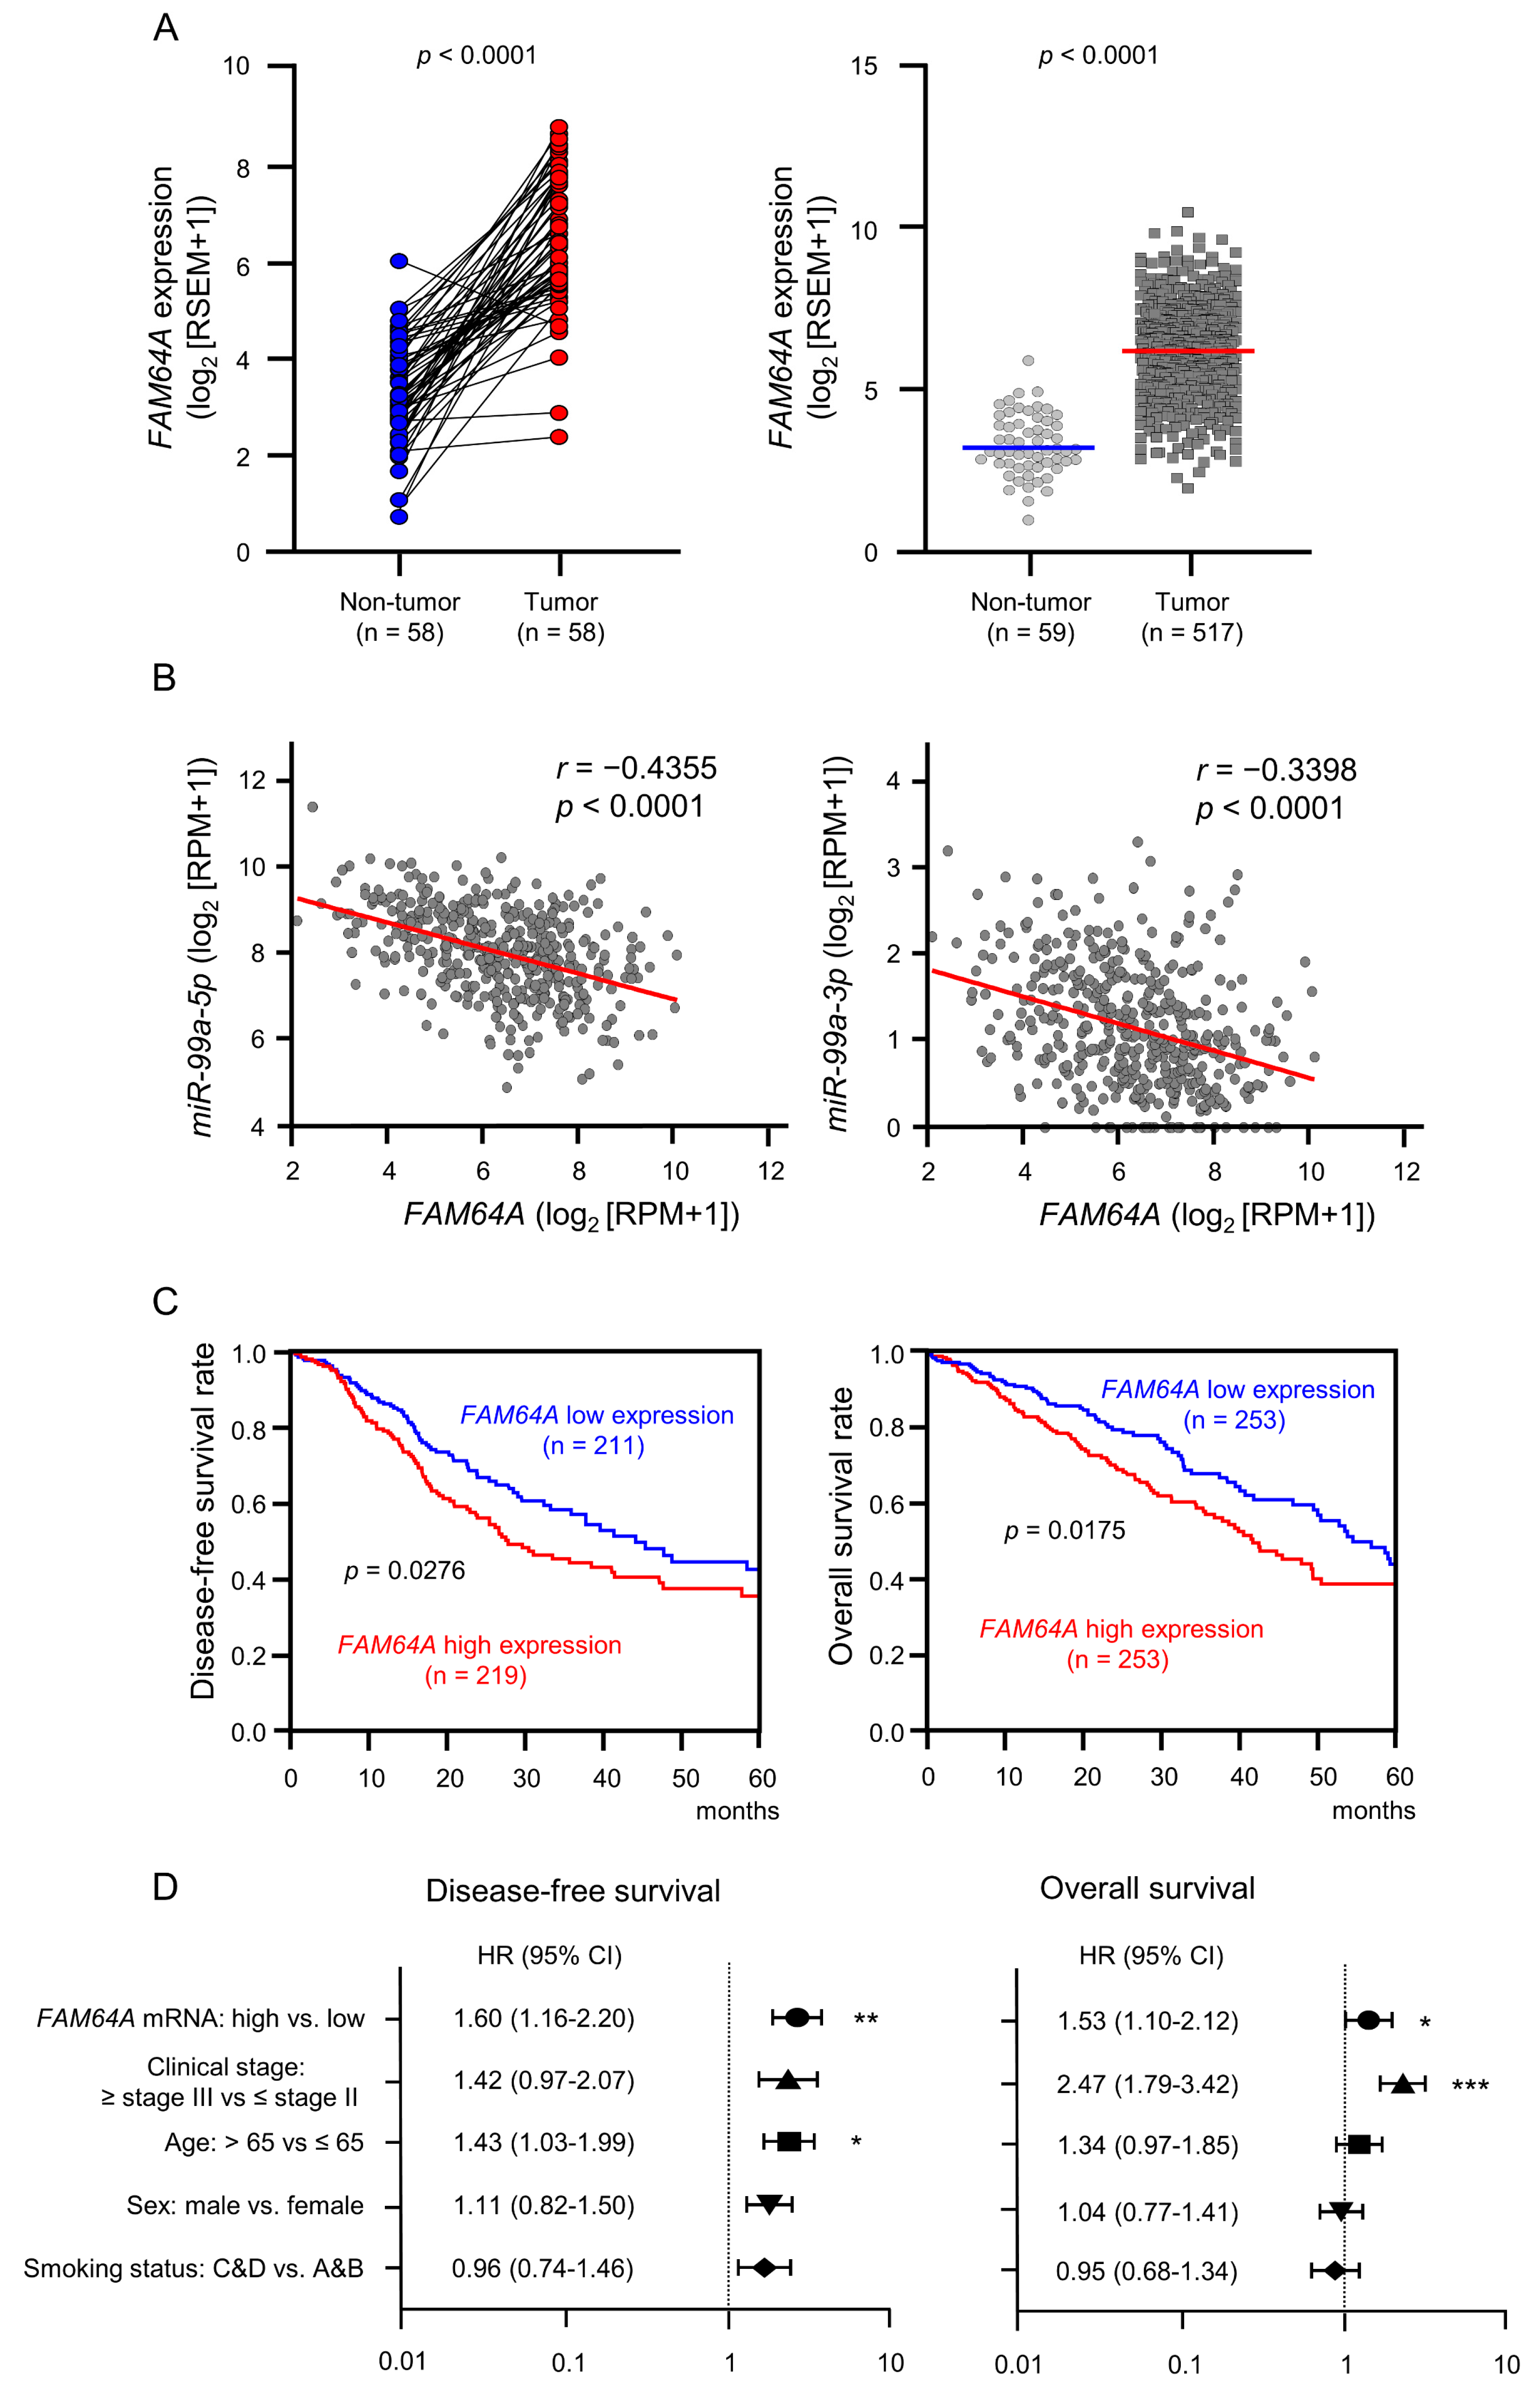
3.5. Clinical Significance of FAM64A in LUAD Pathogenesis

Overexpression of FAM64A in LUAD tissues was confirmed by RNA-seq data from TCGA-LUAD (Figure 7A). Spearman’s rank test indicated negative correlations of FAM64A expression with both miR-99a-5p and miR-99a-3p expression (Figure 7B). We investigated the clinical significance of FAM64A expression in LUAD patients using the TCGA database. High expression of FAM64A was associated with a significantly poor prognosis compared with low expression (DFS: p = 0.0276; OS: p = 0.0175; Figure 7C) and was identified as an independent prognostic factor of survival in the multivariate analysis (p < 0.01; Figure 7D). FAM64A protein expression was also evaluated in LUAD clinical specimens using immunohistochemistry. Overexpression of FAM64A protein was detected in cancer lesions in LUAD clinical specimens (Figure 8).

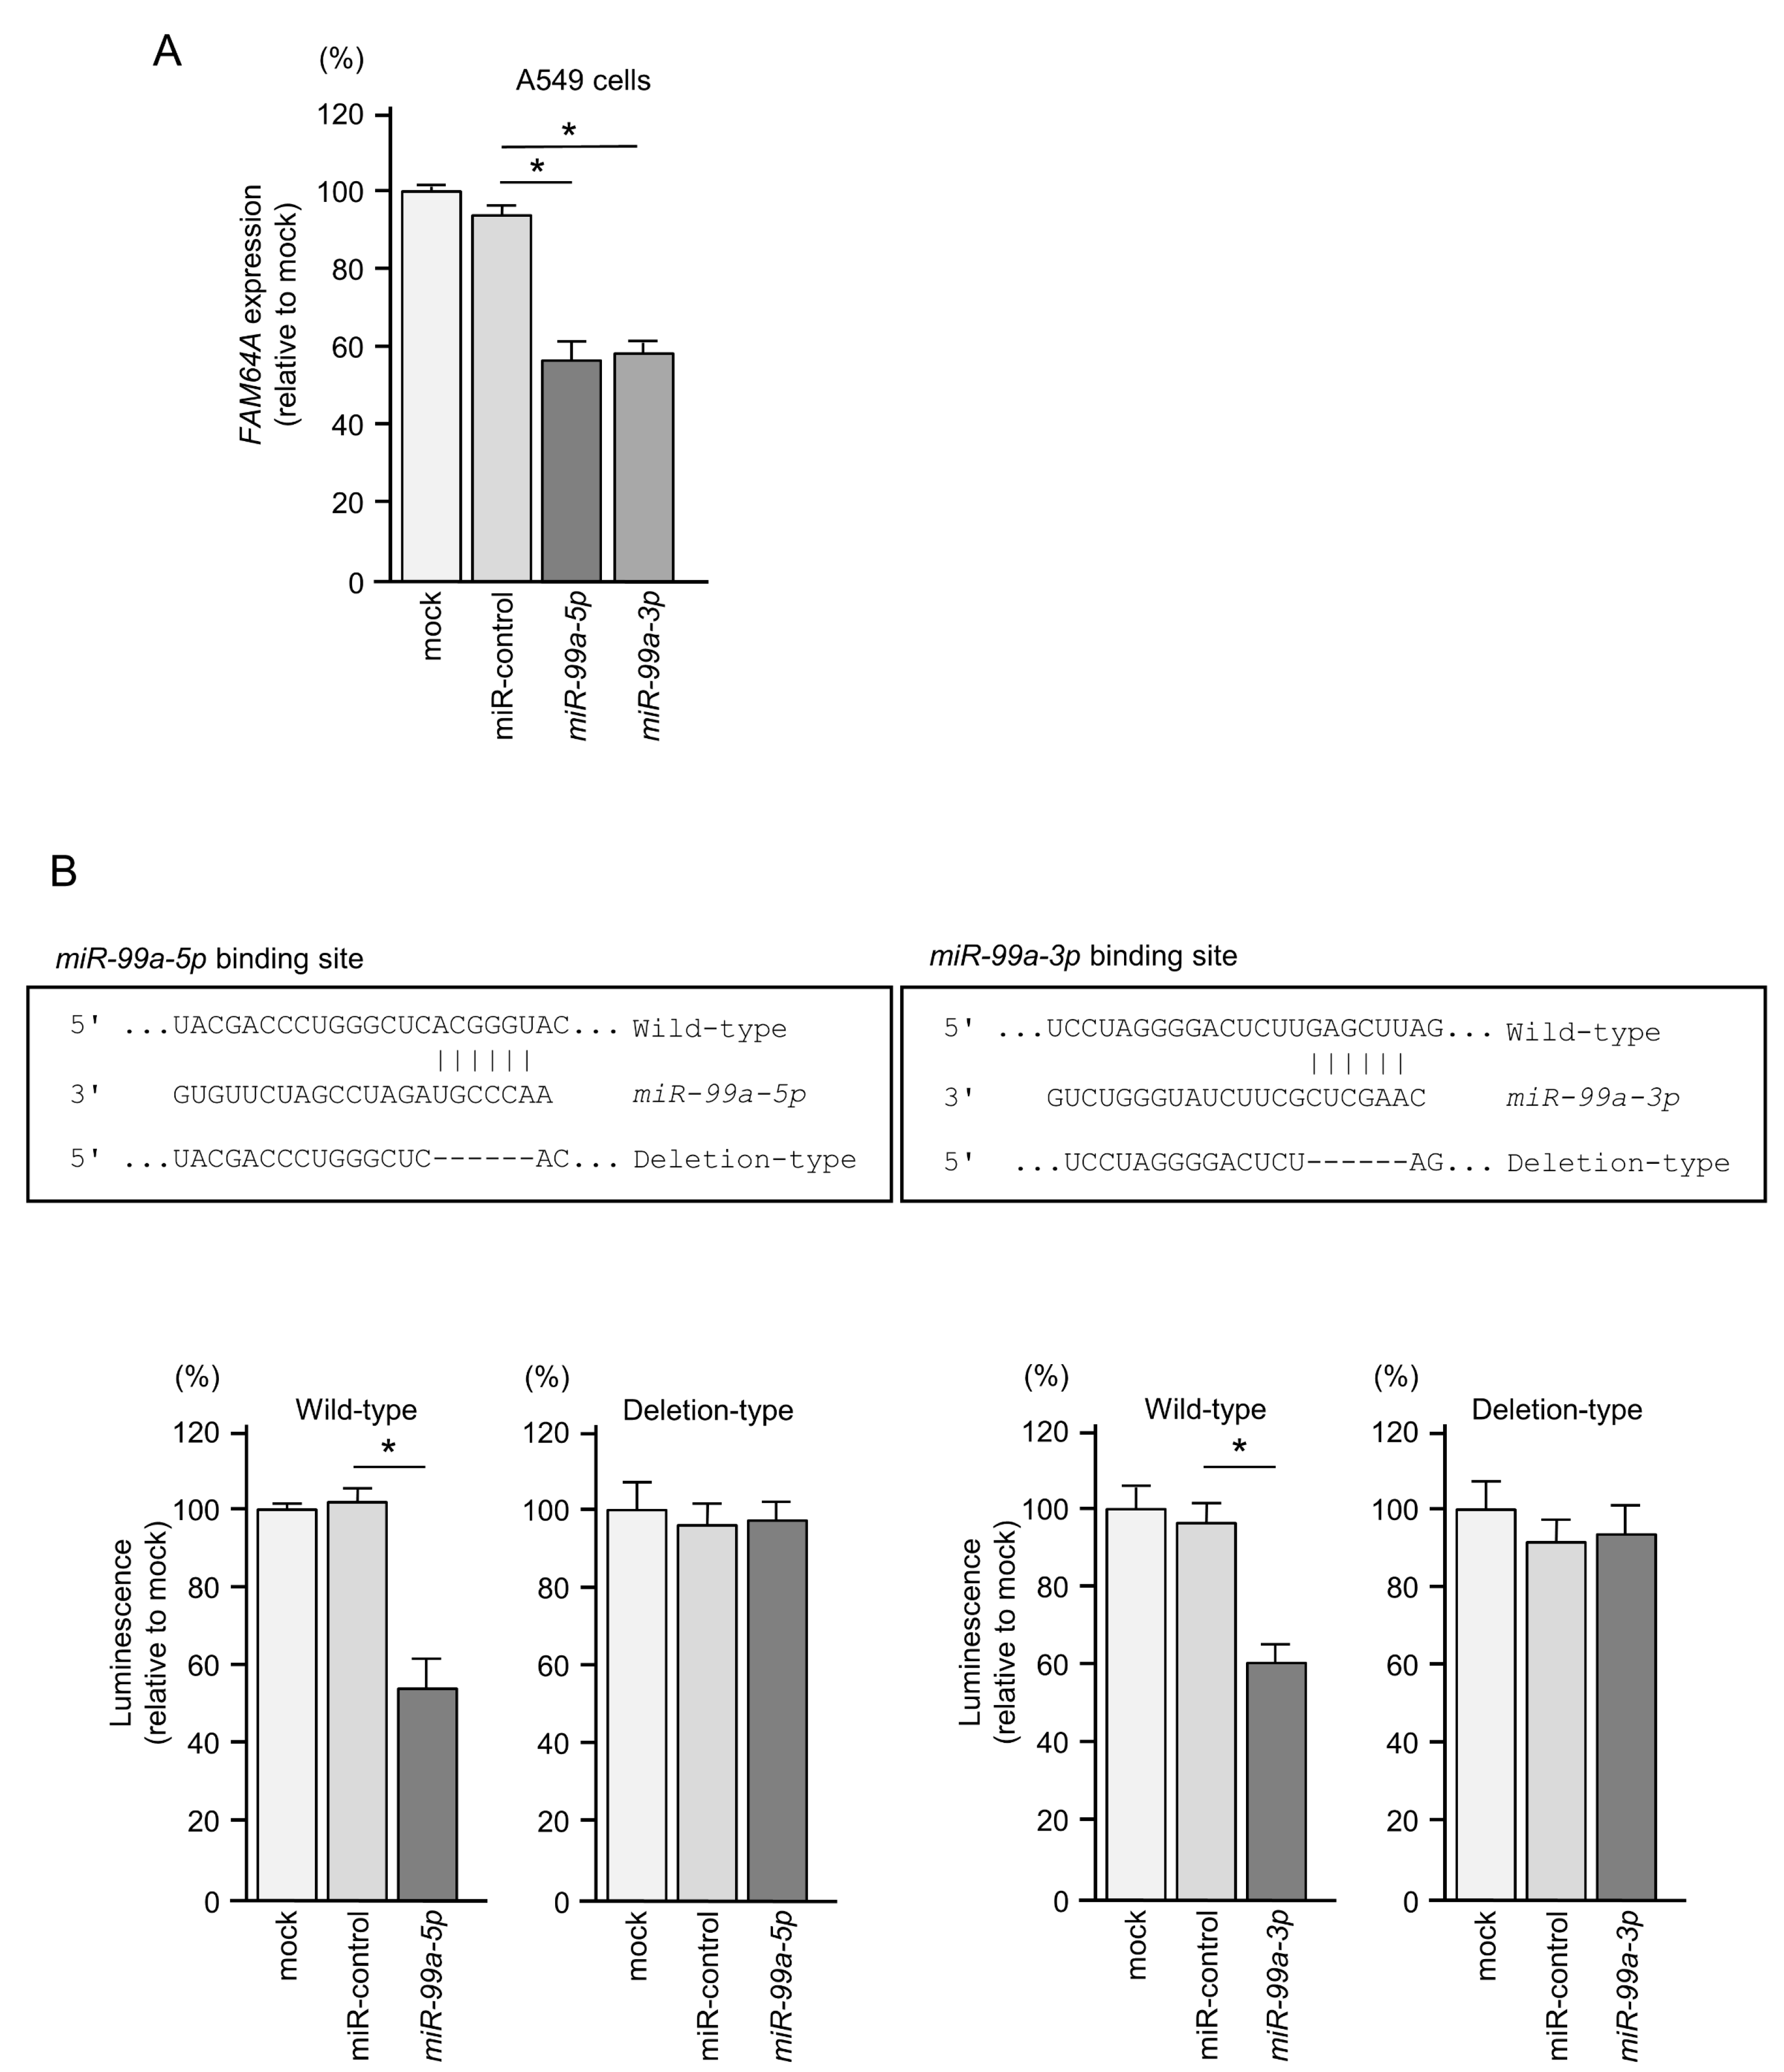
3.6. Direct Regulation of FAM64A by miR-99a-5p and miR-99a-3p in LUAD Cells

We focused on FAM64A because its expression was found to be controlled by both strands of pre-miR-99a (miR-99a-5p and miR-99a-3p). The expression level of FAM64A was significantly reduced after transfection of miR-99a-5p and miR-99a-3p in LUAD cells (Figure 9A).
There is one miRNA-binding site for each miRNA strand (miR-99a-5p and miR-99a-3p) in the 3′UTR region of FAM64A (Figure 9B). In dual-luciferase reporter assays, luciferase activity was significantly decreased by co-transfection of miR-99a-5p or miR-99a-3p with the vector containing the wild-type 3′UTR of FAM64A in A549 cells. On the other hand, the transfection of the deletion vector (containing the deletion-type 3′UTR of FAM64A) prevented this decrease in luminescence (Figure 9B), suggesting that miR-99a-5p and miR-99a-3p bind directly to the 3′UTR of FAM64A in LUAD cells.

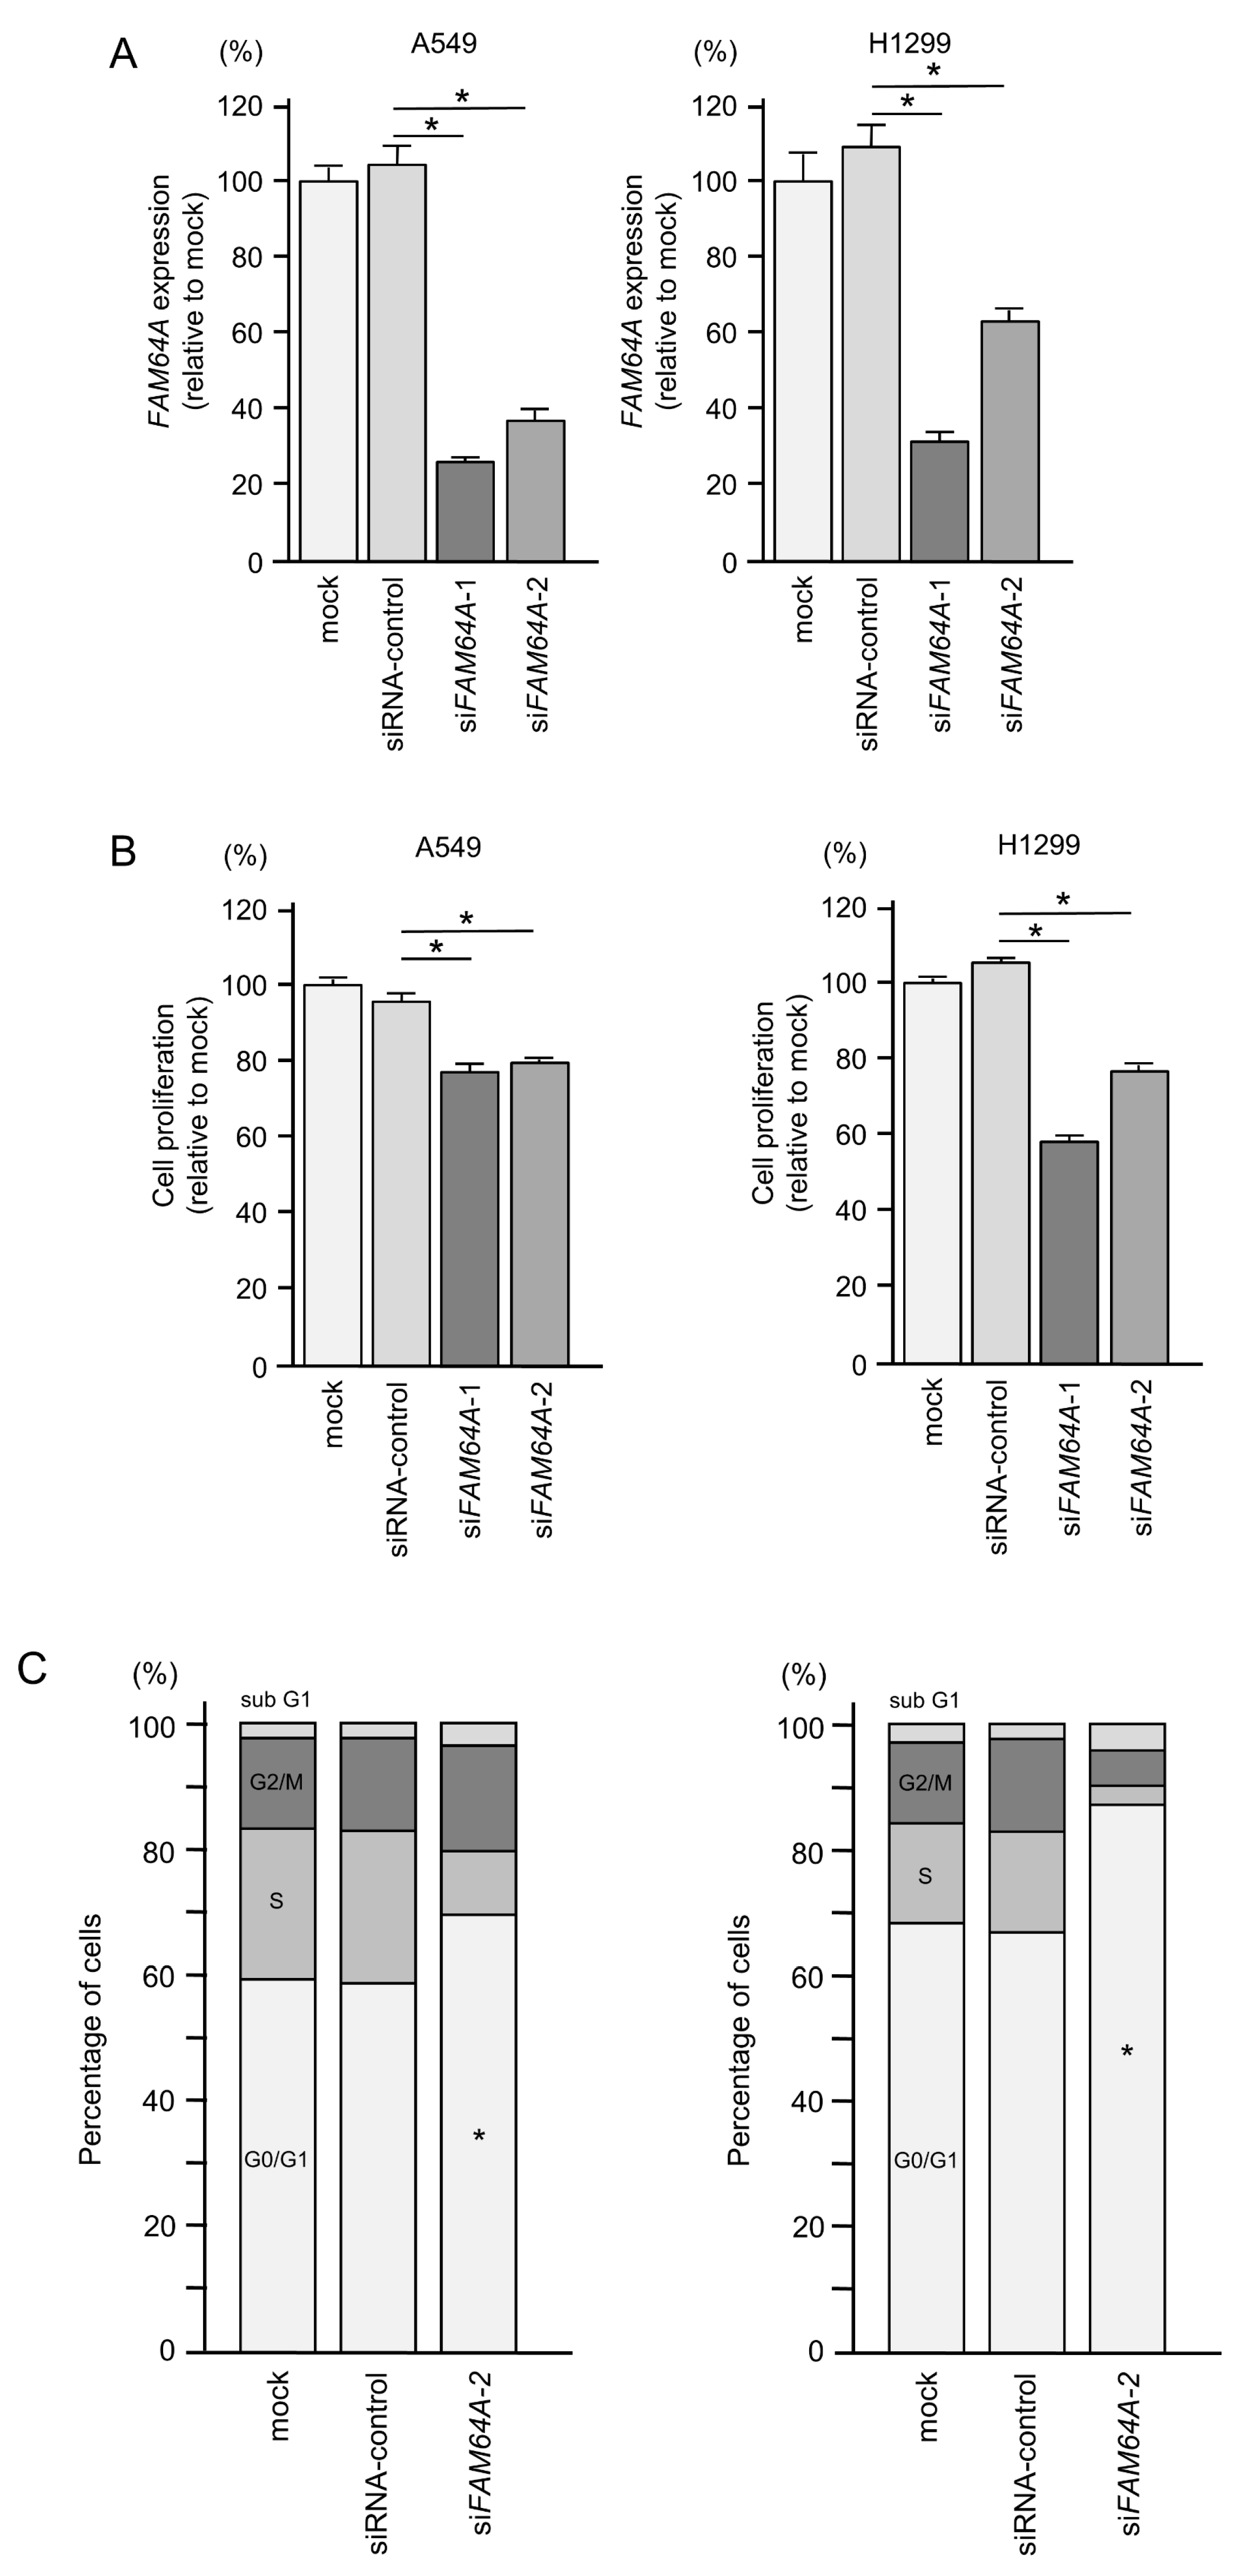
3.7. Effects of FAM64A Knockdown on Cell Proliferation and Cell Cycle in LUAD Cells

To investigate the oncogenic function of FAM64A in LUAD cells, we performed knockdown assays using siRNAs. The expression level of FAM64A was successfully reduced by two different siRNAs (siFAM64A-1 and siFAM64A-2; Figure 10A).
The proliferation of LUAD cells was attenuated by the transfection of each siFAM64A (Figure 10B).
Cell cycle assays demonstrated that the number of LUAD cells in the G0/G1 phase was increased after knockdown of FAM64A (Figure 10C). These data indicate that the expression of FAM64A enhances cell cycle progression.

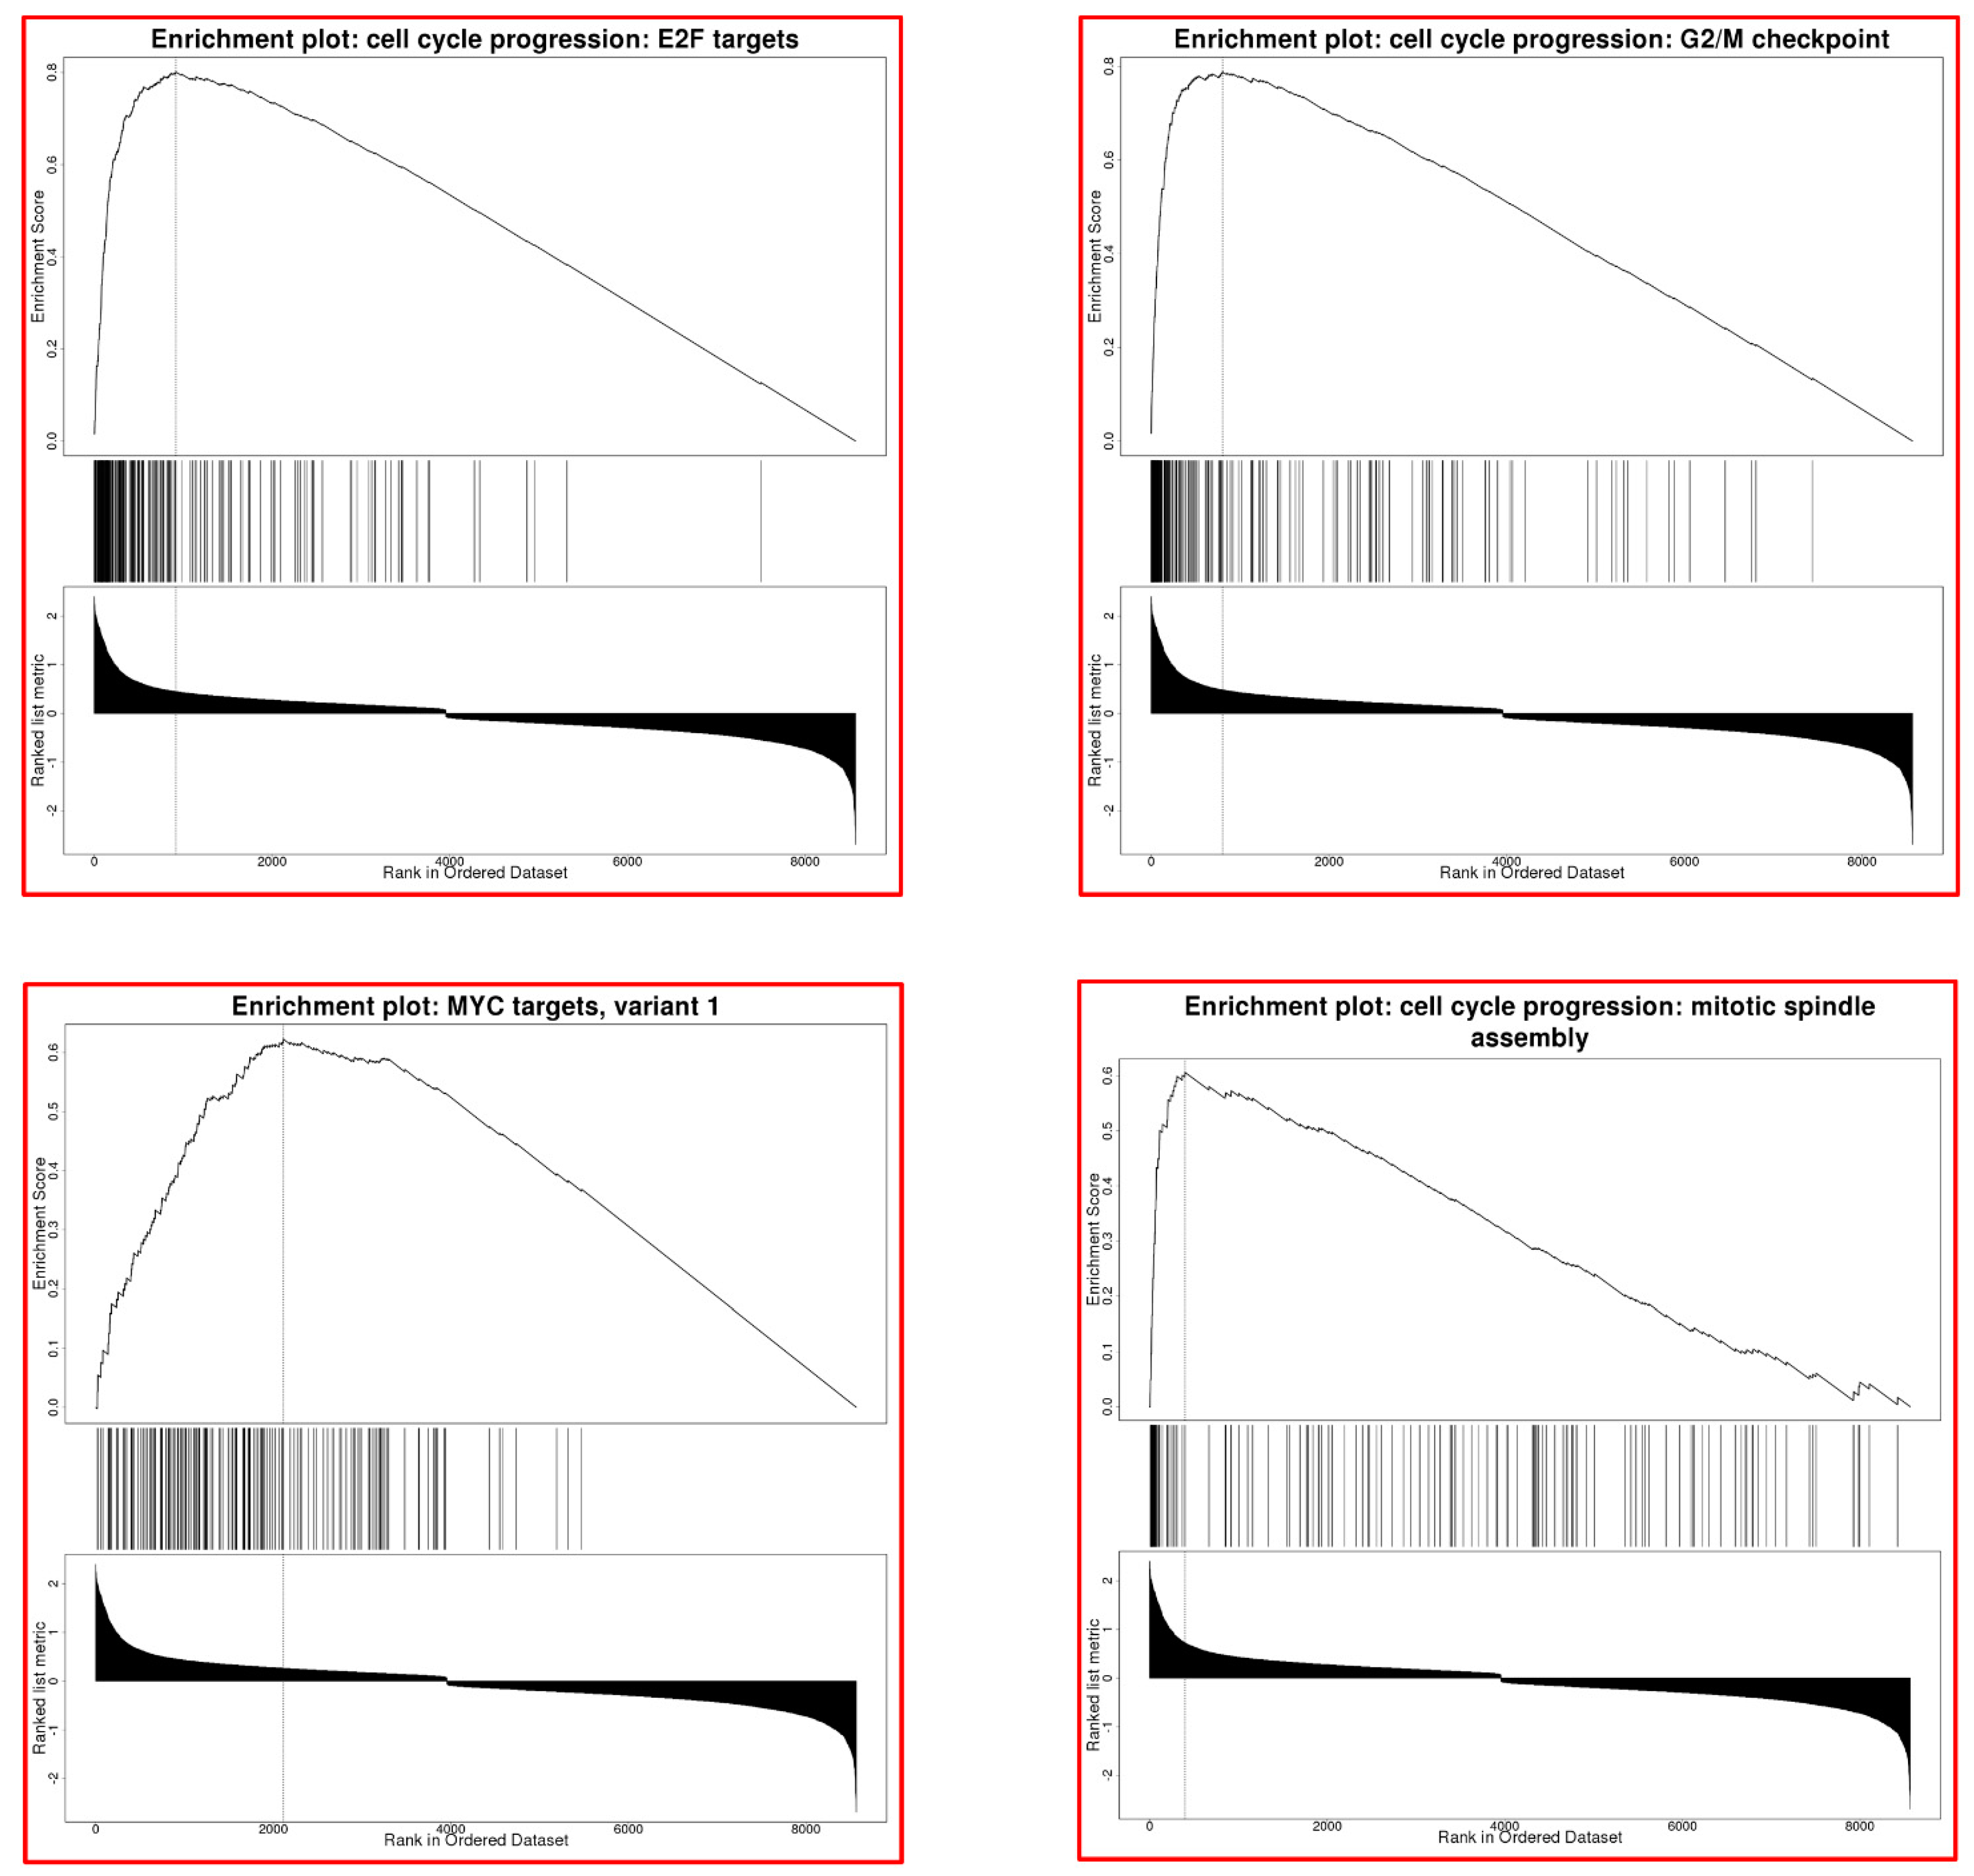
3.8. FAM64A Effects on Molecular Pathways in LUAD

We identified differentially expressed genes from TCGA-LUAD RNA-seq between FAM64A high expression group and low expression group.
GSEA showed that the top signaling pathways enriched in the high FAM64A expression group were cell cycle-associated terms, such as E2F targets, G2M checkpoints, MYC targets and mitotic spindle assembly (Figure 11).
Finally, we found that the proportion of genome alterations (percentage of chromosome regions with copy number alterations relative to all regions evaluated) and the mutation count (the number of mutational events per case) were significantly increased in the high FAM64A expression group (Figure 12), suggesting that FAM64A expression may be associated with genetic mutations and genomic instability in LUAD cells.

4. Discussion

Active genomic research has led to the discovery of driver genes/mutations critical to lung cancer [31]. Molecularly targeted drugs were developed based on these driver genes, and the prognosis of advanced LUAD has greatly improved due to the emergence of molecularly targeted therapeutic agents [32]. However, even with these therapeutic agents, it is difficult to eliminate cancer cells from patients. Continued exploration of molecular networks in LUAD cells provides useful information for developing novel therapeutics.
To identify novel therapeutic targets and pathways, we have previously identified tumor-suppressive miRNAs and their oncogenic targets in LUAD [22,23,24]. A feature of our study is that we analyzed both strands of pre-miRNAs: the guide and passenger strands. The general theory regarding miRNA biogenesis so far is that the passenger strand of a miRNA derived from a pre-miRNA is decomposed in the cytoplasm and has no function [9,10]. Contrary to this belief, recent reports have shown that some passenger strands of miRNAs regulate oncogenes in cancer cells and exert tumor-suppressive functions [33]. Our recent studies demonstrated that some passenger strands of miRNAs, e.g., miR-143-5p, miR-145-3p and miR-150-3p, behave as tumor-suppressive miRNAs in LUAD cells by targeting oncogenes, e.g., LMNB2, MCM4 and TNS4, respectively [22,23,24].
In lung cancer, several studies have shown that miR-99a-5p acts as a tumor-suppressive miRNA by targeting critical oncogenic pathways, including AKT1 and mTOR signaling [34,35]. In contrast, there are few reports on miR-99a-3p function in lung cancer cells. Based on our miRNA signatures, we showed that miR-99a-3p also acts as a tumor-suppressive miRNA in prostate cancer and head and neck squamous cell carcinoma [36,37]. Of particular interest in those papers is that many of the genes identified as targets of miR-99a-3p contribute to malignant phenotypes of cancer cells and significantly predict the worse prognosis of the patients [37]. The search for genes regulated by the passenger strands of miRNAs will provide new information for exploring the molecular mechanisms of LUAD.
In this study, a total of 19 genes (CKS1B, KCMF1, CENPF, CASC5, MKI67, ESCO2, FANCI, SGOL1, MCM4, KIF11, NEK2, MTHFD2, NCAPG, RRM2, FAM136A, ZWINT, CDK1, CDKN3 and FAM64A) identified as pre-miR-99a targets appear to be intimately involved in LUAD pathogenesis. Interestingly, many of these genes are involved in the cell cycle, cell division and chromosome segregation. These molecules are essential for cell division and may be potential targets for cancer drug development. For example, KIF11 is a kinesin, a microtubule-based motor protein that mediates diverse intracellular functions, such as its critical roles in cell division and intercellular vesicle and organelle transport [38,39]. Several inhibitors of KIF11 have entered phase I and II clinical trials [39]. Functional analyses of the genes regulated by pre-miR-99a are useful for exploring molecular networks in LUAD.
In this study, we focused on FAM64A because its expression is regulated by both strands of pre-miR-99a (miR-99a-5p and miR-99a-3p) in LUAD cells. FAM64A (also known as PIMREG, CAKM, CATS and RCS1) was initially identified as a CALM/PICALM-interacting protein using a yeast two-hybrid system [40]. The fusion protein CALM/AF10, t(10;11)(p13;q14), plays a crucial role in acute myeloid leukemia, acute lymphoblastic leukemia and malignant lymphoma [41,42]. Previous studies demonstrated that FAM64A contributes to cell cycle progression [43,44,45]. Overexpression of FAM64A was reported in leukemia, lymphoma and several types of solid cancer [46]. In breast cancer, overexpression of FAM64A enhanced the transactivation of NF-κB by disrupting the NF-κB/IκBα negative feedback loop [47]. Another study demonstrated that FAM64A regulates STAT3 activation and is involved in Th17 differentiation, colitis and colorectal cancer development [48]. These findings indicate that FAM64A behaves as a transcriptional regulator contributing to cell cycle progression. FAM64A might be a potential prognostic factor and therapeutic target in LUAD.

5. Conclusions

Both the guide (miR-99a-5p) and passenger (miR-99a-3p) strands of pre-miR-99a showed antitumor functions in LUAD cells. A total of 23 genes were identified as putative pre-miR-99a targets in LUAD cells. Among these targets, 19 genes (CKS1B, KCMF1, CENPF, CASC5, MKI67, ESCO2, FANCI, SGOL1, MCM4, KIF11, NEK2, MTHFD2, NCAPG, RRM2, FAM136A, ZWINT, CDK1, CDKN3 and FAM64A) were closely associated with the molecular pathogenesis of LUAD. FAM64A was directly regulated by both strands of pre-miR-99a, and its aberrant expression enhanced cancer cell proliferation.

Supplementary Materials

The following are available online at https://www.mdpi.com/2073-4409/9/9/2083/s1, Figure S1: Vector inserted sequences; Figure S2: Effects of ectopic expression of miR-99a-5p and miR-99a-3p on LUAD cells; Table S1: Reagent used in this study; Table S2: Characteristics of the patients used in immunostaining; Table S3: 23 target genes analyzed by Benjamini-Hochberg method; Table S4: Significantly enriched annotations regulated by miR-99a-5p/miR-99a-3p in LUAD cells and pathways regulated by miR-99a-5p/miR-99a-3p in LUAD cells.

Author Contributions

Conceptualization, K.M., N.S.; methodology, N.S.; validation, K.M., H.I. and N.S.; formal analysis, N.N., K.T., S.M. (Shunsuke Misono), R.O., S.A., T.S. and S.M. (Shogo Moriya); investigation, K.T., S.M. (Shunsuke Misono), R.O., S.A., T.S. and S.M. (Shogo Moriya); resources, N.N. and S.A.; data curation, K.T., S.M. (Shunsuke Misono) and R.O.; writing—original draft preparation, K.M., N.S.; writing—review and editing, K.T., S.M. (Shunsuke Misono), R.O. and S.M. (Shogo Moriya); visualization, K.T., S.M. (Shunsuke Misono), R.O. and N.S.; supervision, N.S.; project administration, K.M., H.I. and N.S.; funding acquisition, K.M., H.I. and N.S. All authors have read and agreed to the published version of the manuscript.

Funding

This research was funded by JSPS KAKENHI, grant numbers; 18K09338, 19K08605, 19K08627, 19K08656 and 19K17640.

Conflicts of Interest

The authors declare no conflict of interest. N.N. is an employee of MSD K.K., a subsidiary of Merck & Co., Inc., and receives personal fees from MSD K.K. outside of this study.

References

  1. Bray, F.; Ferlay, J.; Soerjomataram, I.; Siegel, R.L.; Torre, L.A.; Jemal, A. Global cancer statistics 2018: GLOBOCAN estimates of incidence and mortality worldwide for 36 cancers in 185 countries. CA Cancer J. Clin. 2018, 68, 394–424. [Google Scholar] [CrossRef] [Green Version]
  2. Travis, W.D.; Brambilla, E.; Nicholson, A.G.; Yatabe, Y.; Austin, J.H.M.; Beasley, M.B.; Chirieac, L.R.; Dacic, S.; Duhig, E.; Flieder, D.B.; et al. The 2015 World Health Organization Classification of Lung Tumors: Impact of Genetic, Clinical and Radiologic Advances Since the 2004 Classification. J. Thorac. Oncol. 2015, 10, 1243–1260. [Google Scholar] [CrossRef] [Green Version]
  3. Goldstraw, P.; Chansky, K.; Crowley, J.; Rami-Porta, R.; Asamura, H.; Eberhardt, W.E.; Nicholson, A.G.; Groome, P.; Mitchell, A.; Bolejack, V.; et al. The IASLC Lung Cancer Staging Project: Proposals for Revision of the TNM Stage Groupings in the Forthcoming (Eighth) Edition of the TNM Classification for Lung Cancer. J. Thorac. Oncol. 2016, 11, 39–51. [Google Scholar] [CrossRef] [PubMed] [Green Version]
  4. Gandhi, L.; Rodríguez-Abreu, D.; Gadgeel, S.; Esteban, E.; Felip, E.; De Angelis, F.; Domine, M.; Clingan, P.; Hochmair, M.J.; Powell, S.F.; et al. Pembrolizumab plus Chemotherapy in Metastatic Non-Small-Cell Lung Cancer. N. Engl. J. Med. 2018, 378, 2078–2092. [Google Scholar] [CrossRef] [PubMed]
  5. Hida, T.; Nokihara, H.; Kondo, M.; Kim, Y.H.; Azuma, K.; Seto, T.; Takiguchi, Y.; Nishio, M.; Yoshioka, H.; Imamura, F.; et al. Alectinib versus crizotinib in patients with ALK-positive non-small-cell lung cancer (J-ALEX): An open-label, randomised phase 3 trial. Lancet 2017, 390, 29–39. [Google Scholar] [CrossRef]
  6. Ramalingam, S.S.; Vansteenkiste, J.; Planchard, D.; Cho, B.C.; Gray, J.E.; Ohe, Y.; Zhou, C.; Reungwetwattana, T.; Cheng, Y.; Chewaskulyong, B.; et al. Overall Survival with Osimertinib in Untreated, EGFR-Mutated Advanced NSCLC. N. Engl. J. Med. 2020, 382, 41–50. [Google Scholar] [CrossRef] [PubMed]
  7. Rosell, R.; Moran, T.; Queralt, C.; Porta, R.; Cardenal, F.; Camps, C.; Majem, M.; Lopez-Vivanco, G.; Isla, D.; Provencio, M.; et al. Screening for epidermal growth factor receptor mutations in lung cancer. N. Engl. J. Med. 2009, 361, 958–967. [Google Scholar] [CrossRef] [Green Version]
  8. Bartel, D.P. MicroRNAs: Target recognition and regulatory functions. Cell 2009, 136, 215–233. [Google Scholar] [CrossRef] [Green Version]
  9. Bartel, D.P. MicroRNAs: Genomics, biogenesis, mechanism, and function. Cell 2004, 116, 281–297. [Google Scholar] [CrossRef] [Green Version]
  10. Hobert, O. Gene regulation by transcription factors and microRNAs. Science 2008, 319, 1785–1786. [Google Scholar] [CrossRef]
  11. Iorio, M.V.; Croce, C.M. MicroRNAs in cancer: Small molecules with a huge impact. J. Clin. Oncol. 2009, 27, 5848–5856. [Google Scholar] [CrossRef] [PubMed]
  12. Baer, C.; Claus, R.; Plass, C. Genome-wide epigenetic regulation of miRNAs in cancer. Cancer Res. 2013, 73, 473–477. [Google Scholar] [CrossRef] [Green Version]
  13. Wu, S.G.; Chang, T.H.; Liu, Y.N.; Shih, J.Y. MicroRNA in Lung Cancer Metastasis. Cancers 2019, 11, 265. [Google Scholar] [CrossRef] [PubMed] [Green Version]
  14. Wu, K.L.; Tsai, Y.M.; Lien, C.T.; Kuo, P.L.; Hung, A.J. The Roles of MicroRNA in Lung Cancer. Int. J. Mol. Sci. 2019, 20, 1611. [Google Scholar] [CrossRef] [PubMed] [Green Version]
  15. Koshizuka, K.; Nohata, N.; Hanazawa, T.; Kikkawa, N.; Arai, T.; Okato, A.; Fukumoto, I.; Katada, K.; Okamoto, Y.; Seki, N. Deep sequencing-based microRNA expression signatures in head and neck squamous cell carcinoma: Dual strands of pre-miR-150 as antitumor miRNAs. Oncotarget 2017, 8, 30288–30304. [Google Scholar] [CrossRef] [PubMed] [Green Version]
  16. Yonemori, K.; Seki, N.; Idichi, T.; Kurahara, H.; Osako, Y.; Koshizuka, K.; Arai, T.; Okato, A.; Kita, Y.; Arigami, T.; et al. The microRNA expression signature of pancreatic ductal adenocarcinoma by RNA sequencing: Anti-tumour functions of the microRNA-216 cluster. Oncotarget 2017, 8, 70097–70115. [Google Scholar] [CrossRef] [Green Version]
  17. Toda, H.; Kurozumi, S.; Kijima, Y.; Idichi, T.; Shinden, Y.; Yamada, Y.; Arai, T.; Maemura, K.; Fujii, T.; Horiguchi, J.; et al. Molecular pathogenesis of triple-negative breast cancer based on microRNA expression signatures: Antitumor miR-204-5p targets AP1S3. J. Hum. Genet. 2018, 63, 1197–1210. [Google Scholar] [CrossRef]
  18. Toda, H.; Seki, N.; Kurozumi, S.; Shinden, Y.; Yamada, Y.; Nohata, N.; Moriya, S.; Idichi, T.; Maemura, K.; Fujii, T.; et al. RNA-sequence-based microRNA expression signature in breast cancer: Tumor-suppressive miR-101-5p regulates molecular pathogenesis. Mol. Oncol. 2020, 14, 426–446. [Google Scholar] [CrossRef] [Green Version]
  19. Wada, M.; Goto, Y.; Tanaka, T.; Okada, R.; Moriya, S.; Idichi, T.; Noda, M.; Sasaki, K.; Kita, Y.; Kurahara, H.; et al. RNA sequencing-based microRNA expression signature in esophageal squamous cell carcinoma: Oncogenic targets by antitumor miR-143-5p and miR-143-3p regulation. J. Hum. Genet. 2020. [Google Scholar] [CrossRef]
  20. Mataki, H.; Seki, N.; Chiyomaru, T.; Enokida, H.; Goto, Y.; Kumamoto, T.; Machida, K.; Mizuno, K.; Nakagawa, M.; Inoue, H. Tumor-suppressive microRNA-206 as a dual inhibitor of MET and EGFR oncogenic signaling in lung squamous cell carcinoma. Int. J. Oncol. 2015, 46, 1039–1050. [Google Scholar] [CrossRef] [Green Version]
  21. Uchida, A.; Seki, N.; Mizuno, K.; Misono, S.; Yamada, Y.; Kikkawa, N.; Sanada, H.; Kumamoto, T.; Suetsugu, T.; Inoue, H. Involvement of dual-strand of the miR-144 duplex and their targets in the pathogenesis of lung squamous cell carcinoma. Cancer Sci. 2019, 110, 420–432. [Google Scholar] [CrossRef] [Green Version]
  22. Misono, S.; Seki, N.; Mizuno, K.; Yamada, Y.; Uchida, A.; Arai, T.; Kumamoto, T.; Sanada, H.; Suetsugu, T.; Inoue, H. Dual strands of the miR-145 duplex (miR-145-5p and miR-145-3p) regulate oncogenes in lung adenocarcinoma pathogenesis. J. Hum. Genet. 2018, 63, 1015–1028. [Google Scholar] [CrossRef] [PubMed]
  23. Sanada, H.; Seki, N.; Mizuno, K.; Misono, S.; Uchida, A.; Yamada, Y.; Moriya, S.; Kikkawa, N.; Machida, K.; Kumamoto, T.; et al. Involvement of Dual Strands of miR-143 (miR-143-5p and miR-143-3p) and Their Target Oncogenes in the Molecular Pathogenesis of Lung Adenocarcinoma. Int. J. Mol. Sci. 2019, 20, 4482. [Google Scholar] [CrossRef] [PubMed] [Green Version]
  24. Misono, S.; Seki, N.; Mizuno, K.; Yamada, Y.; Uchida, A.; Sanada, H.; Moriya, S.; Kikkawa, N.; Kumamoto, T.; Suetsugu, T.; et al. Molecular Pathogenesis of Gene Regulation by the miR-150 Duplex: miR-150-3p Regulates TNS4 in Lung Adenocarcinoma. Cancers 2019, 11, 601. [Google Scholar] [CrossRef] [Green Version]
  25. Cerami, E.; Gao, J.; Dogrusoz, U.; Gross, B.E.; Sumer, S.O.; Aksoy, B.A.; Jacobsen, A.; Byrne, C.J.; Heuer, M.L.; Larsson, E.; et al. The cBio cancer genomics portal: An open platform for exploring multidimensional cancer genomics data. Cancer Discov. 2012, 2, 401–404. [Google Scholar] [CrossRef] [Green Version]
  26. Goldman, M.J.; Craft, B.; Hastie, M.; Repečka, K.; McDade, F.; Kamath, A.; Banerjee, A.; Luo, Y.; Rogers, D.; Brooks, A.N.; et al. Visualizing and interpreting cancer genomics data via the Xena platform. Nat. Biotechnol. 2020, 38, 675–678. [Google Scholar] [CrossRef]
  27. Subramanian, A.; Tamayo, P.; Mootha, V.K.; Mukherjee, S.; Ebert, B.L.; Gillette, M.A.; Paulovich, A.; Pomeroy, S.L.; Golub, T.R.; Lander, E.S.; et al. Gene set enrichment analysis: A knowledge-based approach for interpreting genome-wide expression profiles. Proc. Natl. Acad. Sci. USA. 2005, 102, 15545–15550. [Google Scholar] [CrossRef] [Green Version]
  28. Liao, Y.; Wang, J.; Jaehnig, E.J.; Shi, Z.; Zhang, B. WebGestalt 2019: Gene set analysis toolkit with revamped UIs and APIs. Nucleic Acids Res. 2019, 47, W199–W205. [Google Scholar] [CrossRef] [Green Version]
  29. Agarwal, V.; Bell, G.W.; Nam, J.W.; Bartel, D.P. Predicting effective microRNA target sites in mammalian mRNAs. Elife 2015, 4. [Google Scholar] [CrossRef]
  30. Vasaikar, S.V.; Straub, P.; Wang, J.; Zhang, B. LinkedOmics: Analyzing multi-omics data within and across 32 cancer types. Nucleic Acids Res. 2017, 46, D956–D963. [Google Scholar] [CrossRef] [PubMed] [Green Version]
  31. Rotow, J.; Bivona, T.G. Understanding and targeting resistance mechanisms in NSCLC. Nat. Rev. Cancer 2017, 17, 637–658. [Google Scholar] [CrossRef] [PubMed]
  32. Quintanal-Villalonga, Á.; Chan, J.M.; Yu, H.A.; Pe’er, D.; Sawyers, C.L.; Sen, T.; Rudin, C.M. Lineage plasticity in cancer: A shared pathway of therapeutic resistance. Nat. Rev. Clin. Oncol. 2020, 17, 360–371. [Google Scholar] [CrossRef] [PubMed]
  33. Mitra, R.; Adams, C.M.; Jiang, W.; Greenawalt, E.; Eischen, C.M. Pan-cancer analysis reveals cooperativity of both strands of microRNA that regulate tumorigenesis and patient survival. Nat. Commun. 2020, 11, 968. [Google Scholar] [CrossRef] [PubMed] [Green Version]
  34. Yu, S.H.; Zhang, C.L.; Dong, F.S.; Zhang, Y.M. miR-99a suppresses the metastasis of human non-small cell lung cancer cells by targeting AKT1 signaling pathway. J. Cell. Biochem. 2015, 116, 268–276. [Google Scholar] [CrossRef] [PubMed]
  35. Yin, H.; Ma, J.; Chen, L.; Piao, S.; Zhang, Y.; Zhang, S.; Ma, H.; Li, Y.; Qu, Y.; Wang, X.; et al. MiR-99a Enhances the Radiation Sensitivity of Non-Small Cell Lung Cancer by Targeting mTOR. Cell. Physiol. Biochem. 2018, 46, 471–481. [Google Scholar] [CrossRef]
  36. Arai, T.; Okato, A.; Yamada, Y.; Sugawara, S.; Kurozumi, A.; Kojima, S.; Yamazaki, K.; Naya, Y.; Ichikawa, T.; Seki, N. Regulation of NCAPG by miR-99a-3p (passenger strand) inhibits cancer cell aggressiveness and is involved in CRPC. Cancer Med. 2018, 7, 1988–2002. [Google Scholar] [CrossRef]
  37. Okada, R.; Koshizuka, K.; Yamada, Y.; Moriya, S.; Kikkawa, N.; Kinoshita, T.; Hanazawa, T.; Seki, N. Regulation of Oncogenic Targets by miR-99a-3p (Passenger Strand of miR-99a-Duplex) in Head and Neck Squamous Cell Carcinoma. Cells 2019, 8, 1535. [Google Scholar] [CrossRef] [Green Version]
  38. Huszar, D.; Theoclitou, M.E.; Skolnik, J.; Herbst, R. Kinesin motor proteins as targets for cancer therapy. Cancer Metastasis Rev. 2009, 28, 197–208. [Google Scholar] [CrossRef]
  39. Rath, O.; Kozielski, F. Kinesins and cancer. Nat. Rev. Cancer 2012, 12, 527–539. [Google Scholar] [CrossRef]
  40. Archangelo, L.F.; Gläsner, J.; Krause, A.; Bohlander, S.K. The novel CALM interactor CATS influences the subcellular localization of the leukemogenic fusion protein CALM/AF10. Oncogene 2006, 25, 4099–4109. [Google Scholar] [CrossRef] [Green Version]
  41. Archangelo, L.F.; Greif, P.A.; Hölzel, M.; Harasim, T.; Kremmer, E.; Przemeck, G.K.; Eick, D.; Deshpande, A.J.; Buske, C.; de Angelis, M.H.; et al. The CALM and CALM/AF10 interactor CATS is a marker for proliferation. Mol. Oncol. 2008, 2, 356–367. [Google Scholar] [CrossRef] [Green Version]
  42. Caudell, D.; Aplan, P.D. The role of CALM-AF10 gene fusion in acute leukemia. Leukemia 2008, 22, 678–685. [Google Scholar] [CrossRef] [PubMed] [Green Version]
  43. Barbutti, I.; Xavier-Ferrucio, J.M.; Machado-Neto, J.A.; Ricon, L.; Traina, F.; Bohlander, S.K.; Saad, S.T.; Archangelo, L.F. CATS (FAM64A) abnormal expression reduces clonogenicity of hematopoietic cells. Oncotarget 2016, 7, 68385–68396. [Google Scholar] [CrossRef] [PubMed]
  44. Hashimoto, K.; Kodama, A.; Honda, T.; Hanashima, A.; Ujihara, Y.; Murayama, T.; Nishimatsu, S.I.; Mohri, S. Fam64a is a novel cell cycle promoter of hypoxic fetal cardiomyocytes in mice. Sci. Rep. 2017, 7, 4486. [Google Scholar] [CrossRef] [PubMed]
  45. Yao, Z.; Zheng, X.; Lu, S.; He, Z.; Miao, Y.; Huang, H.; Chu, X.; Cai, C.; Zou, F. Knockdown of FAM64A suppresses proliferation and migration of breast cancer cells. Breast Cancer 2019, 26, 835–845. [Google Scholar] [CrossRef] [PubMed]
  46. Hu, S.; Yuan, H.; Li, Z.; Zhang, J.; Wu, J.; Chen, Y.; Shi, Q.; Ren, W.; Shao, N.; Ying, X. Transcriptional response profiles of paired tumor-normal samples offer novel perspectives in pan-cancer analysis. Oncotarget 2017, 8, 41334–41347. [Google Scholar] [CrossRef] [Green Version]
  47. Jiang, L.; Ren, L.; Zhang, X.; Chen, H.; Chen, X.; Lin, C.; Wang, L.; Hou, N.; Pan, J.; Zhou, Z.; et al. Overexpression of PIMREG promotes breast cancer aggressiveness via constitutive activation of NF-κB signaling. EBioMedicine 2019, 43, 188–200. [Google Scholar] [CrossRef] [Green Version]
  48. Xu, Z.S.; Zhang, H.X.; Li, W.W.; Ran, Y.; Liu, T.T.; Xiong, M.G.; Li, Q.L.; Wang, S.Y.; Wu, M.; Shu, H.B.; et al. FAM64A positively regulates STAT3 activity to promote Th17 differentiation and colitis-associated carcinogenesis. Proc. Natl. Acad. Sci. USA 2019, 116, 10447–10452. [Google Scholar] [CrossRef] [Green Version]
Figure 1. Downregulation of miR-99a-5p and miR-99a-3p in LUAD. (A) Comparison of the expression levels of miR-99a-5p and miR-99a-3p between tumor and non-tumor tissues in paired (left) and non-paired (right) LUAD clinical specimens from TCGA datasets. (B) Positive correlation between the relative expression level of miR-99a-5p and that of miR-99a-3p in clinical specimens according to Spearman’s rank tests.
Cells 09 02083 g001
Figure 2. Clinical significance of miR-99a-5p and miR-99a-3p expression in LUAD. (A) The patients were divided into two groups according to the median expression level of miR-99a-5p or miR-99a-3p: high (red lines) and low (blue lines) expression groups. (B) The patients were divided into two groups, top 25% and low 25%. High expression of miR-99a-5p and miR-99a-3p is represented by red lines; low expression of these miRNAs is represented by blue lines.
Cells 09 02083 g002
Figure 3. Functional assays of cell proliferation and cell cycle arrest following ectopic expression of miR-99a-5p or miR-99a-3p in LUAD cell lines (A549 and H1299 cells). (A) Cell proliferation assessed using XTT assays at 72 h after miRNA transfection (* p < 0.0001). (B) Flow cytometric analysis of the cell cycle phase distribution of control cells and cells transfected with miR-99a-5p or miR-99a-3p. Cells were evaluated at 72 h after miRNA transfection (* p < 0.0001).
Cells 09 02083 g003
Figure 4. Identification of putative targets of miR-99a-5p or miR-99a-3p regulation in LUAD cells. Prediction of miR-99a-5p and miR-99a-3p target genes using the TargetScanHuman, cBioportal and LinkedOmics databases. Venn diagrams represent the number of putative target genes regulated by miR-99a-5p or miR-99a-3p.
Cells 09 02083 g004
Figure 5. Clinical significance of pre-miR-99a target genes in TCGA database. Kaplan–Meier survival curves and log-rank comparisons of patients with LUAD using TCGA datasets. Patients were divided into two groups according to the median expression of each pre-miR-99a target gene evaluated: high and low expression groups. The red and blue lines represent the high and low expression groups, respectively. High expression mRNA of 18 genes (CKS1B, KCMF1, CENPF, CASC5, MKI67, ESCO2, FANCI, SGOL1, MCM4, KIF11, NEK2, MTHFD2, NCAPG, RRM2, FAM136A, ZWINT, CDK1 and CDKN3) significantly predicted worse survival (5-year overall survival rate) in patients with LUAD. The expression data were downloaded from http://www.oncolnc.org.
Cells 09 02083 g005aCells 09 02083 g005b
Figure 6. Expression levels of pre-miR-99a target genes in LUAD clinical specimens. Using TCGA datasets, the expression levels of all 22 pre-miR-99a target genes evaluated were upregulated in LUAD clinical specimens (n = 475) compared with normal lung tissues (n = 54). The expression data were downloaded from http://firebrowse.org/.
Cells 09 02083 g006aCells 09 02083 g006b
Figure 7. Clinical significance of FAM64A expression in LUAD. (A) Comparison of FAM64A expression levels between tumor and non-tumor tissues in paired (left) and non-paired (right) LUAD clinical specimens from TCGA datasets. Upregulation of FAM64A was detected in LUAD tissues. (B) Correlations between the relative expression level of FAM64A and that of miR-99a-5p or miR-99a-3p. Spearman’s rank test showed a negative correlation between FAM64A and miR-99a-5p or miR-99a-3p expression levels in clinical specimens. (C) Kaplan–Meier survival curves and log-rank comparisons of patients with LUAD using TCGA database. Patients were divided into two groups according to the median FAM64A expression level: high and low expression groups. The red and blue lines represent the high and low expression groups, respectively. (D) Forest plot of the multivariate analysis results assessing independent prognostic factors for disease-free and overall survival, including FAM64A expression (high vs. low) (* p < 0.05, ** p < 0.01, *** p < 0.001).
Cells 09 02083 g007
Figure 8. Overexpression of FAM64A in LUAD clinical specimens. (AC) Immunohistochemical staining of FAM64A in LUAD tissues. Overexpression of FAM64A was detected in the cytoplasm and/or nuclei of cancer cells. On the other hand, expression of FAM64A was low in normal lung cells (D).
Cells 09 02083 g008
Figure 9. Direct regulation of FAM64A by miR-99a-5p and miR-99a-3p in LUAD cells. (A) Significantly reduced expression of FAM64A mRNA by miR-99s-5p or miR-99a-3p transfection in A549 cells (at 72 h after transfection; * p < 0.0001). (B) Predictions of miR-99a-binding sites using TargetScanHuman database analyses. Each miRNA strand (miR-99a-5p and miR-99a-3p) had one binding site in the 3′UTR of FAM64A. Dual-luciferase reporter assays showed that luminescence activity was reduced by co-transfection of the FAM64A wild-type vector (containing the miR-99a-5p-binding site) with miR-99a-5p or of the FAM64A wild-type vector (containing the miR-99a-3p-binding site) with miR-99a-3p in A549 cells. Normalized data were calculated as Renilla/firefly luciferase activity ratios (* p < 0.0001).
Cells 09 02083 g009
Figure 10. Effect of FAM64A knockdown on cell proliferation and cell cycle arrest in LUAD cells. (A) Successful suppression of FAM64A expression by siFAM64A-1 or siFAM64A-2 transfection in A549 and H1299 cells. (B) Cell proliferation assessed by XTT assay at 72 h after miRNA transfection (* p < 0.0001). (C) Flow cytometric analyses of cell cycle phase distributions in control cells and cells transfected with siFAM64A. The cells were assessed at 72 h after miRNA transfection (* p < 0.0001).
Cells 09 02083 g010
Figure 11. TCGA database analysis of the clinical significance and function of FAM64A in LUAD clinical specimens. The bar graph shows the results of gene set enrichment analysis (GSEA) of the genes differentially expressed between high and low FAM64A expression groups in LUAD patients. Four representative GSEA plots are shown below for E2F targets, G2/M checkpoint, MYC target 1 variant 1 and mitotic spindle assembly with q-values < 0.05. These pathway terms were significantly enriched in the high FAM64A expression group.
Cells 09 02083 g011aCells 09 02083 g011b
Figure 12. Associations of genome alterations and mutation counts with FAM64A expression in LUAD clinical specimens. Proportion of genome alterations (percentage of chromosome regions with copy number alterations relative to all regions evaluated; (left)) and the mutation count (number of mutational events per case; (right)) were significantly increased in the high compared with the low FAM64A expression group (*** p < 0.001).
Cells 09 02083 g012
Table 1. Putative targets by miR-99a-5p and miR-99a-3p regulation in LUAD cells.
Entrez Gene IDGene SymbolGene NameLocationTotal Sites5-Year OS p-Value
Putative targets by miR-99a-5p regulation in LUAD cells
1063CENPFCentromere protein F1q4110.0059
1163CKS1BCDC28 protein kinase regulatory subunit 1B1q21.310.0073
56888KCMF1Potassium channel modulatory factor 12p11.210.0125
417685FAM64AFamily with sequence similarity 64 member A17p13.210.0176
993CDC25ACell division cycle 25A3p21.3110.1585
Putative targets by miR-99a-3p regulation in LUAD cells
4751NEK2NIMA related kinase 21q32.310.0002
57082CASC5Cancer susceptibility candidate 515q15.110.0003
983CDK1Cyclin dependent kinase 110q21.210.0003
4288MKI67Marker of proliferation Ki-6710q26.210.0005
1033CDKN3Cyclin dependent kinase inhibitor 314q22.210.0017
6241RRM2Ribonucleotide reductase regulatory subunit M22p25.110.002
4173MCM4Minichromosome maintenance complex component 48q11.2110.0032
3832KIF11Kinesin family member 1110q23.3310.0034
84908FAM136AFamily with sequence similarity 136 member A2p13.310.0087
11130ZWINTZW10 interacting kinetochore protein10q21.110.0094
55215FANCIFA complementation group I15q26.110.0108
64151NCAPGNon-SMC condensin I complex subunit G4p15.3110.0208
157570ESCO2Establishment of sister chromatid cohesion N-acetyltransferase 28p21.110.0235
151648SGOL1Shugoshin 13p24.310.0235
10797MTHFD2Methylenetetrahydrofolate dehydrogenase (NADP+ dependent) 2,
methenyltetrahydrofolate cyclohydrolase
2p13.110.0321
11260XPOTExportin for tRNA12q14.210.0669
417685FAM64AFamily with sequence similarity 64 member A17p13.210.0756
51290ERGIC2ERGIC and golgi 212p11.2210.0929
55854ZC3H15Zinc finger CCCH-type containing 152q32.110.0942

