Nicotinamide Supplementation during the In Vitro Maturation of Oocytes Improves the Developmental Competence of Preimplantation Embryos: Potential Link to SIRT1/AKT Signaling

 , ,
, ,  ,
, 
Abstract
1. Introduction
2. Materials and Methods
2.1. Ethical Approval and Experimental Design
2.2. Oocyte Collection and In Vitro Maturation
2.3. In Vitro Fertilization (IVF)
2.4. In Vitro Culture and Development of Embryos
2.5. Assessment of Cumulus Expansion and Oocyte Maturation
2.6. Estimation of Intracellular ROS Levels, Mitochondrial Content, and Distribution Pattern
2.7. Terminal Deoxynucleotidyl Transferase dUTP Nick-End Labeling (TUNEL) Assay
2.8. RNA Extraction, Complementary DNA (cDNA) Synthesis, and Quantitative Reverse Transcription PCR (RT-qPCR)
2.9. Immunofluorescence Analysis
2.10. Statistical Analysis
3. Results
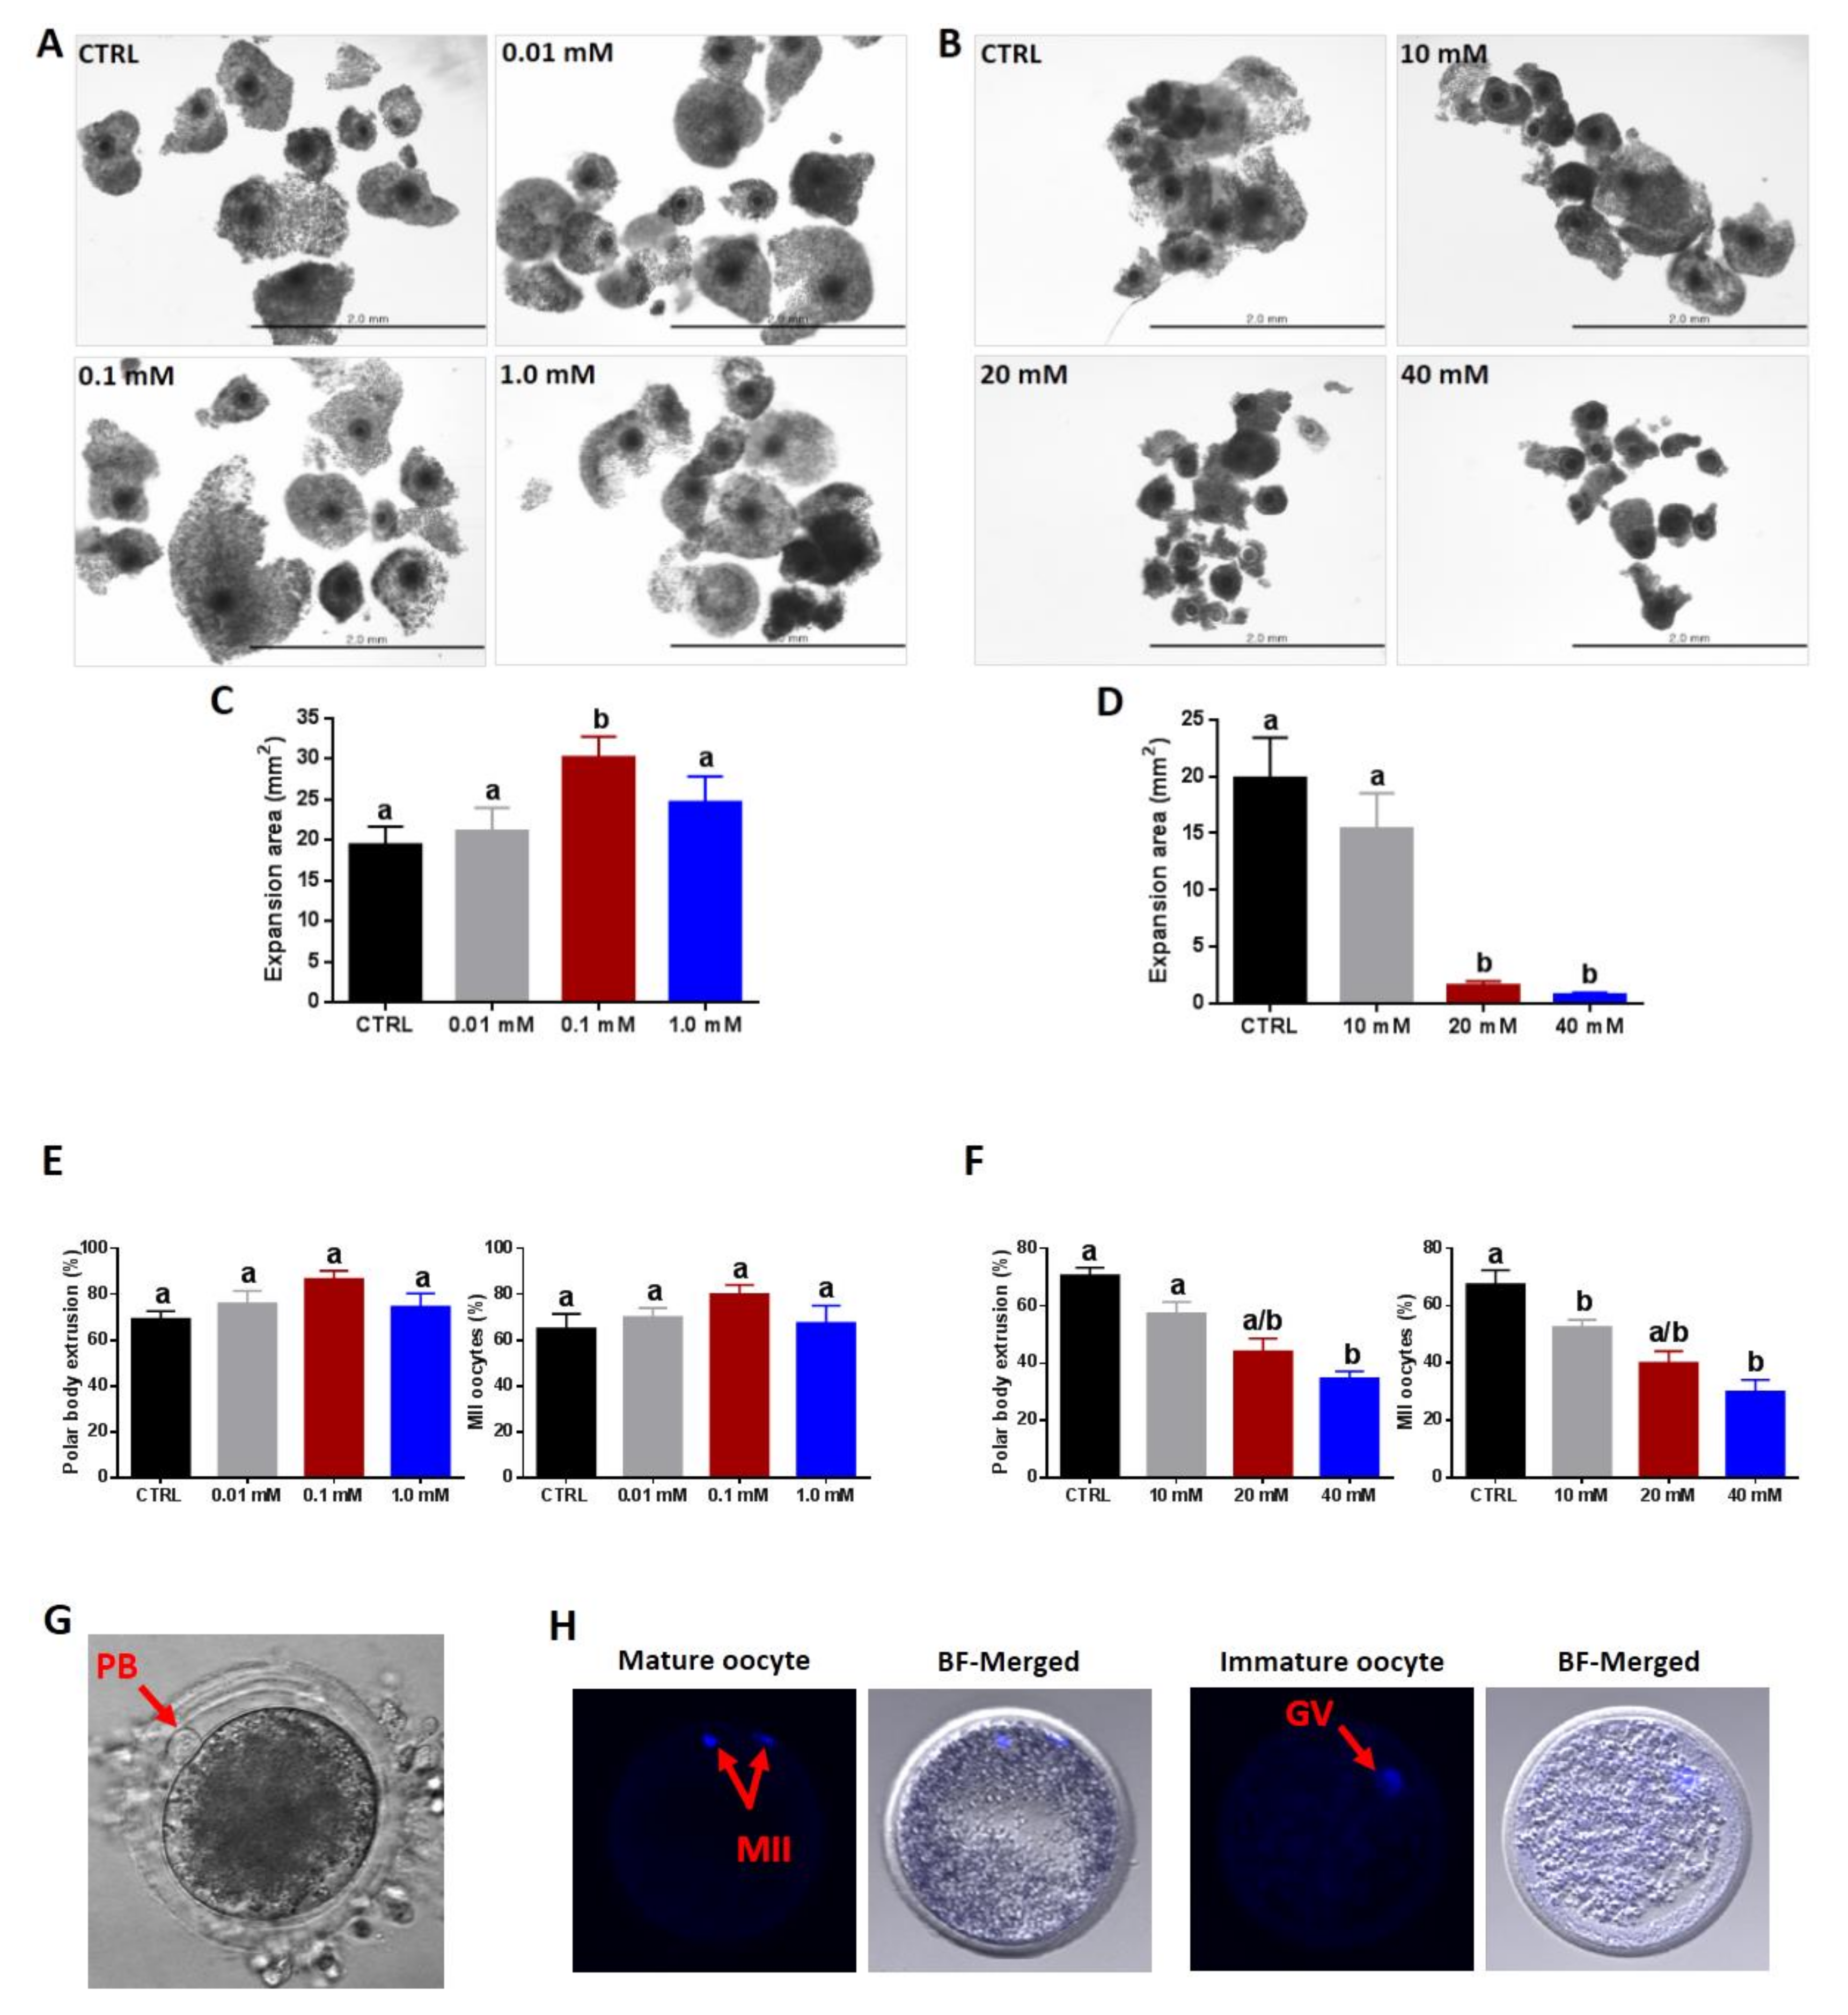
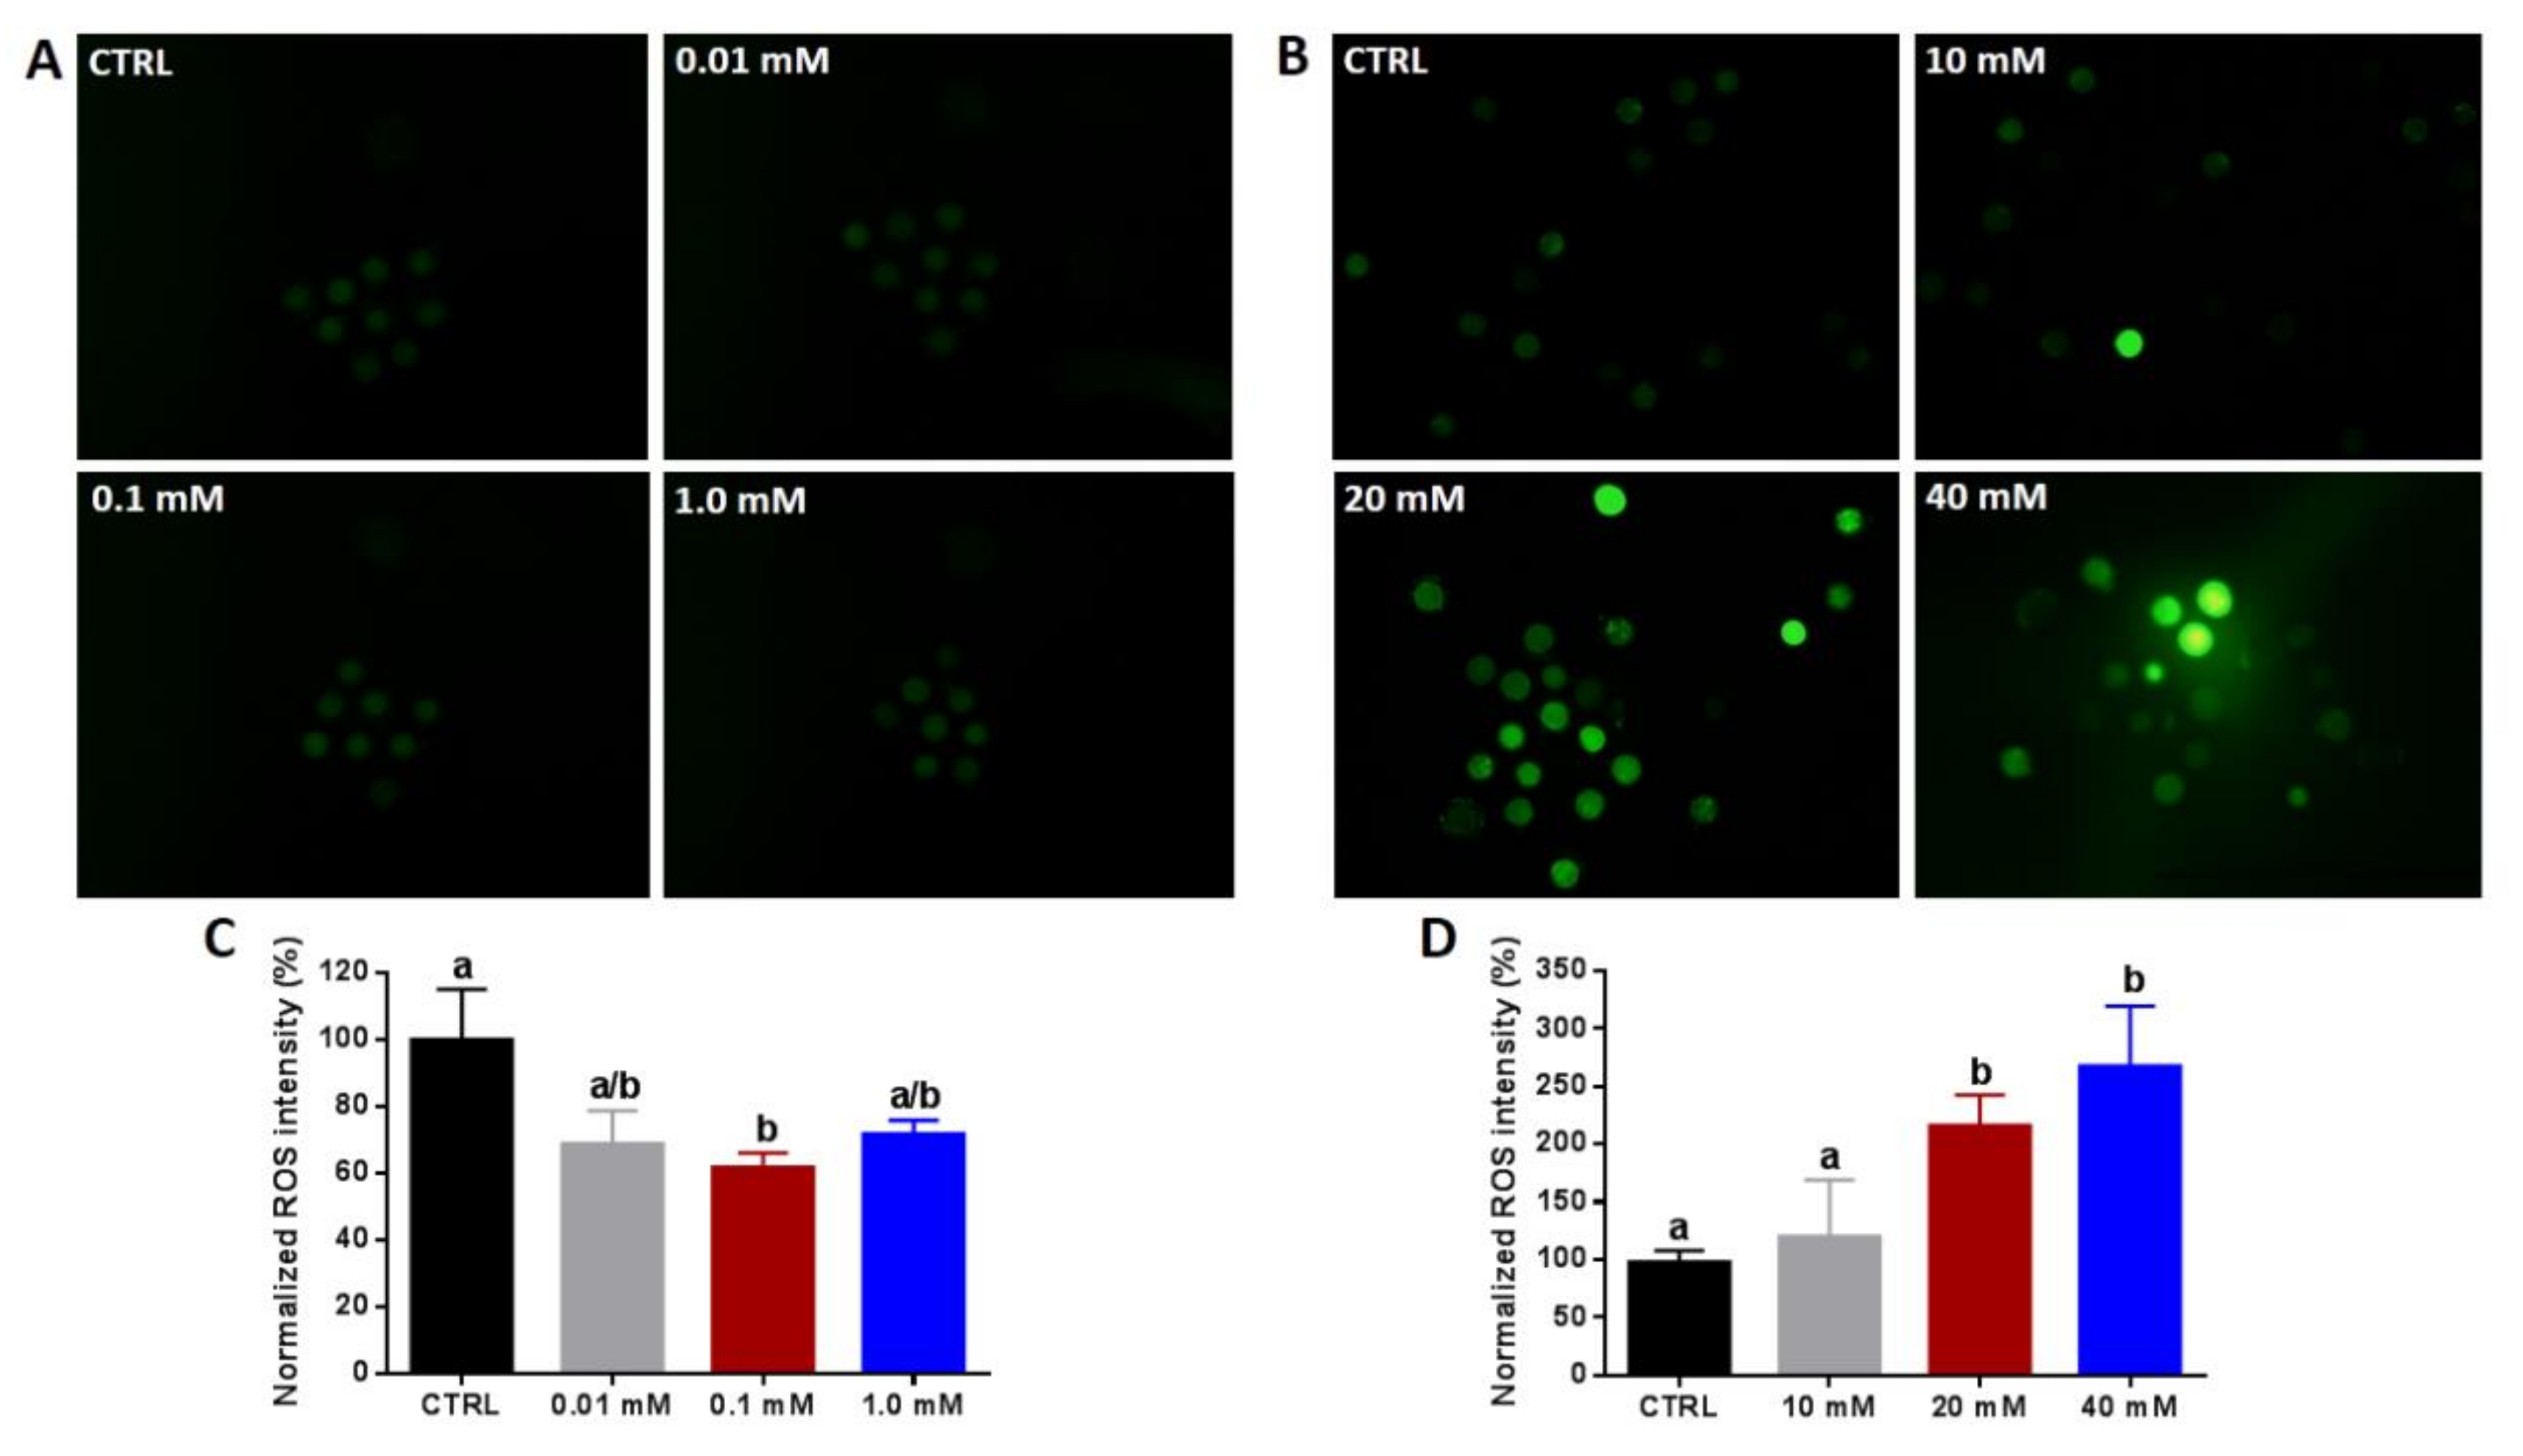
3.1. Effect of NAM Supplementation during the IVM on Cumulus Expansion, Oocyte Maturation, and ROS Levels
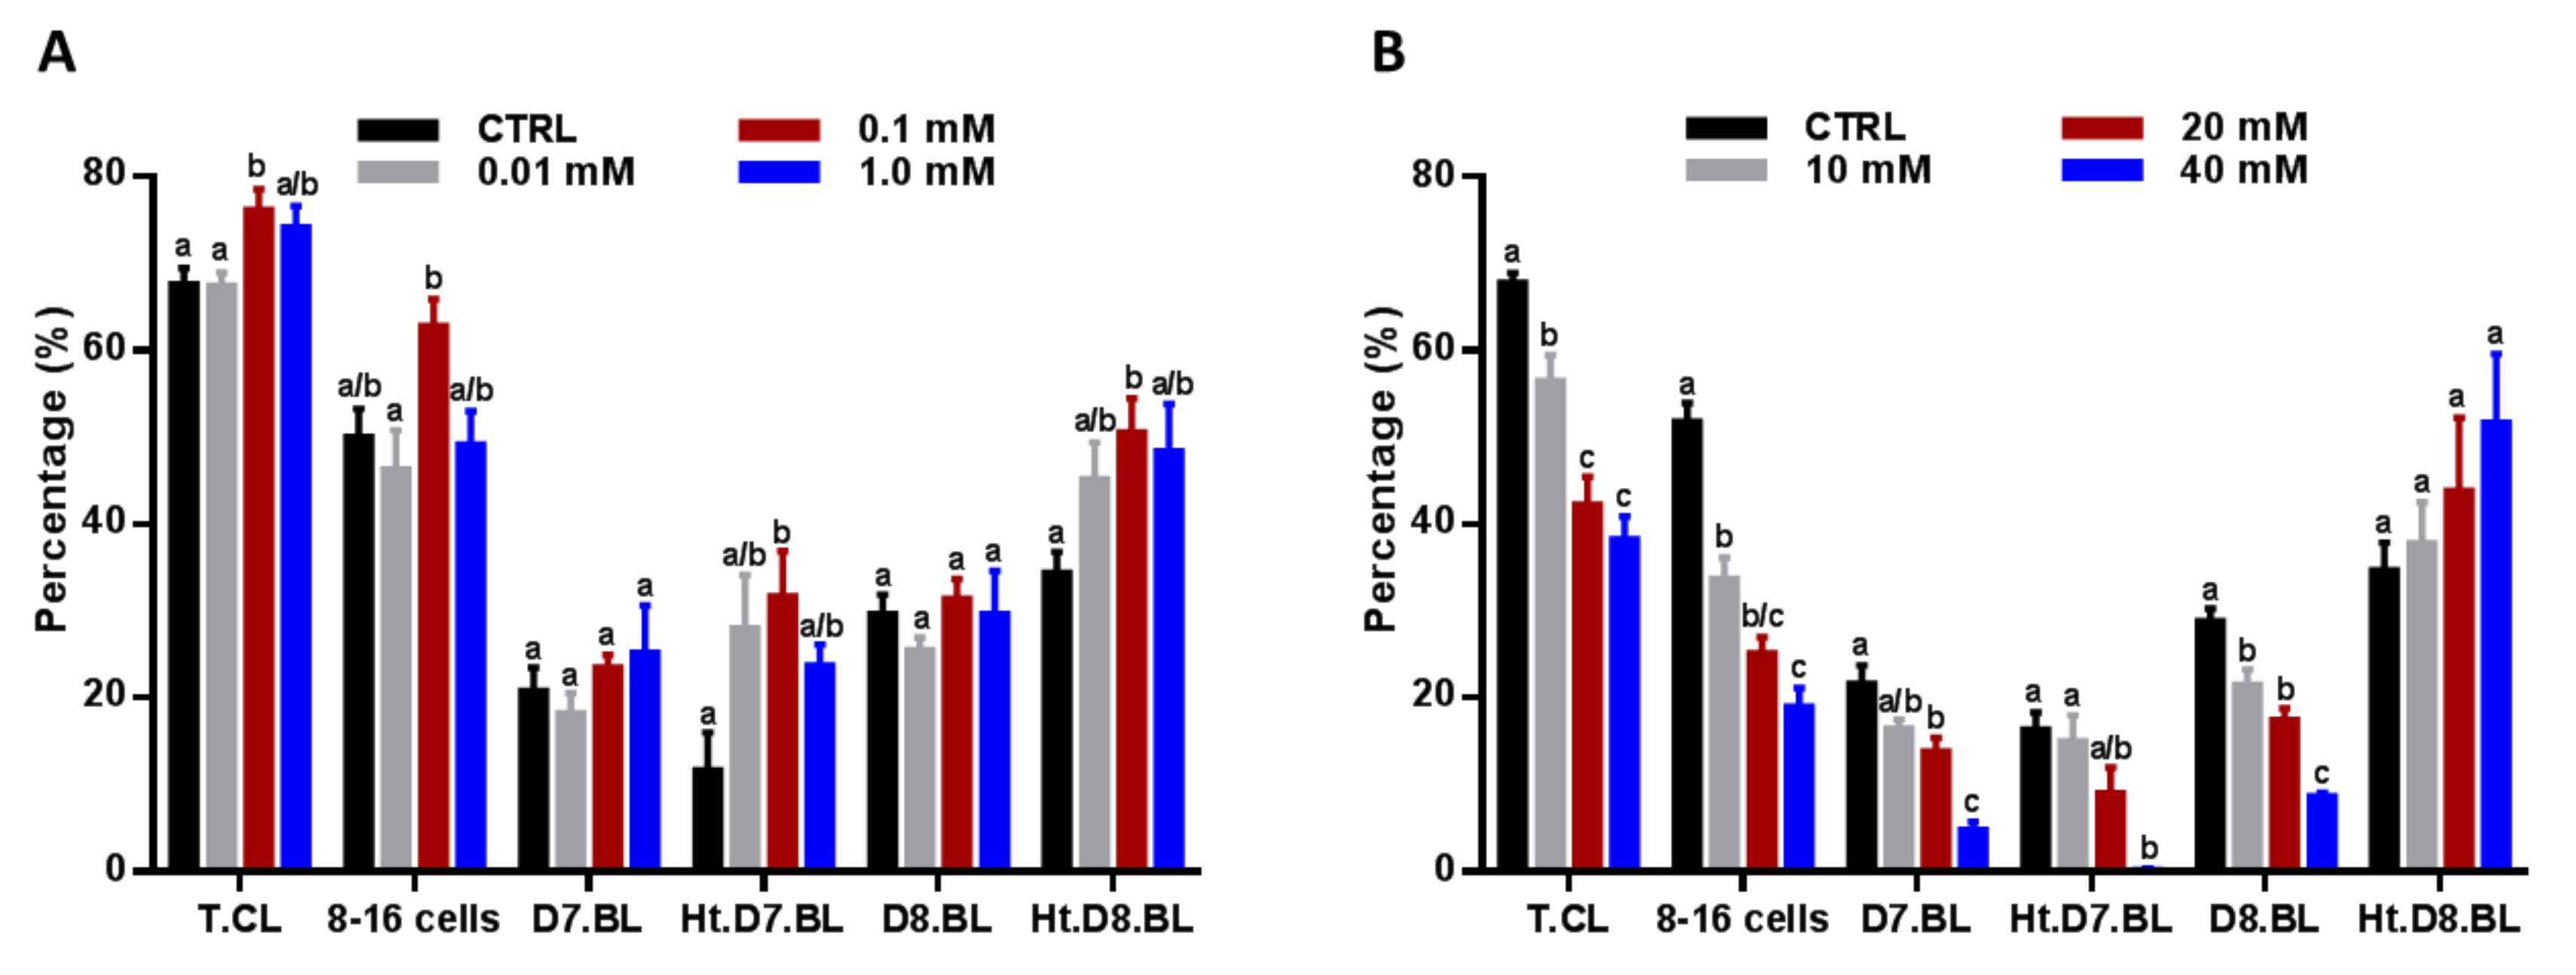
3.2. Impact of NAM Administratration during the IVM on the Development and Hatching of Embryos
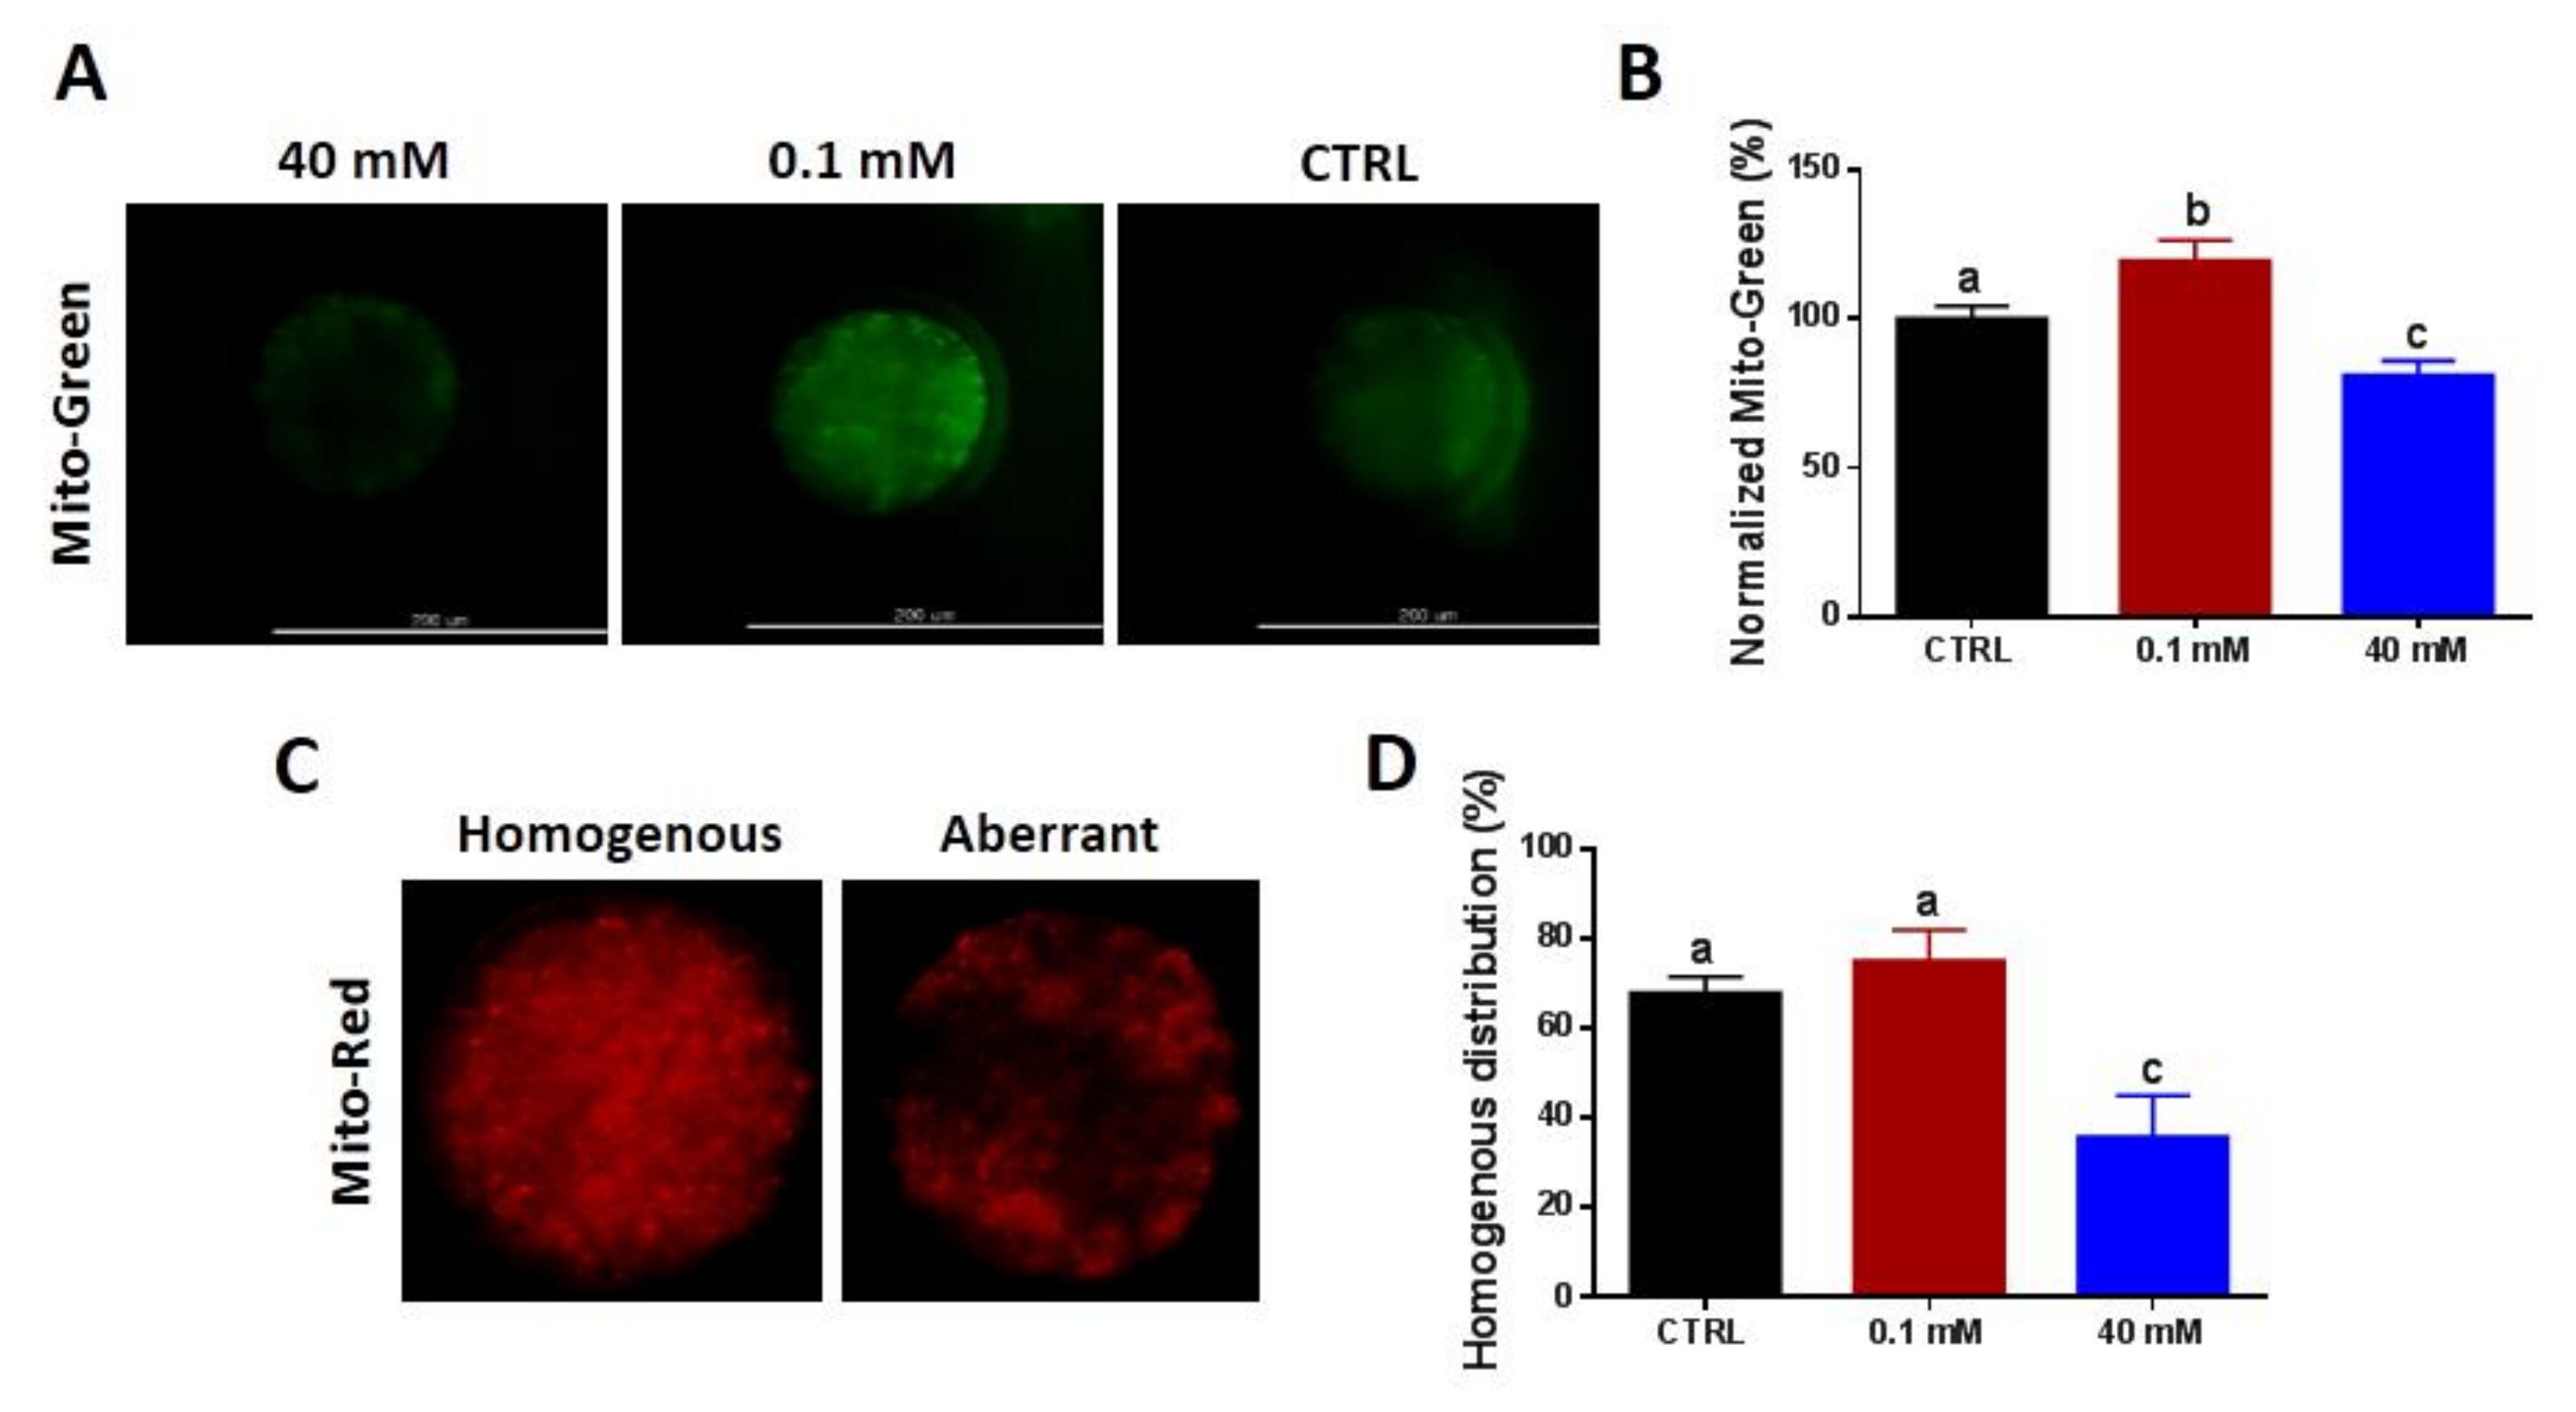
3.3. NAM Modulates Mitochondrial Content and Distribution Pattern in Oocytes
3.4. Regulation of Apoptosis and Autophagy in NAM-Treated Oocytes
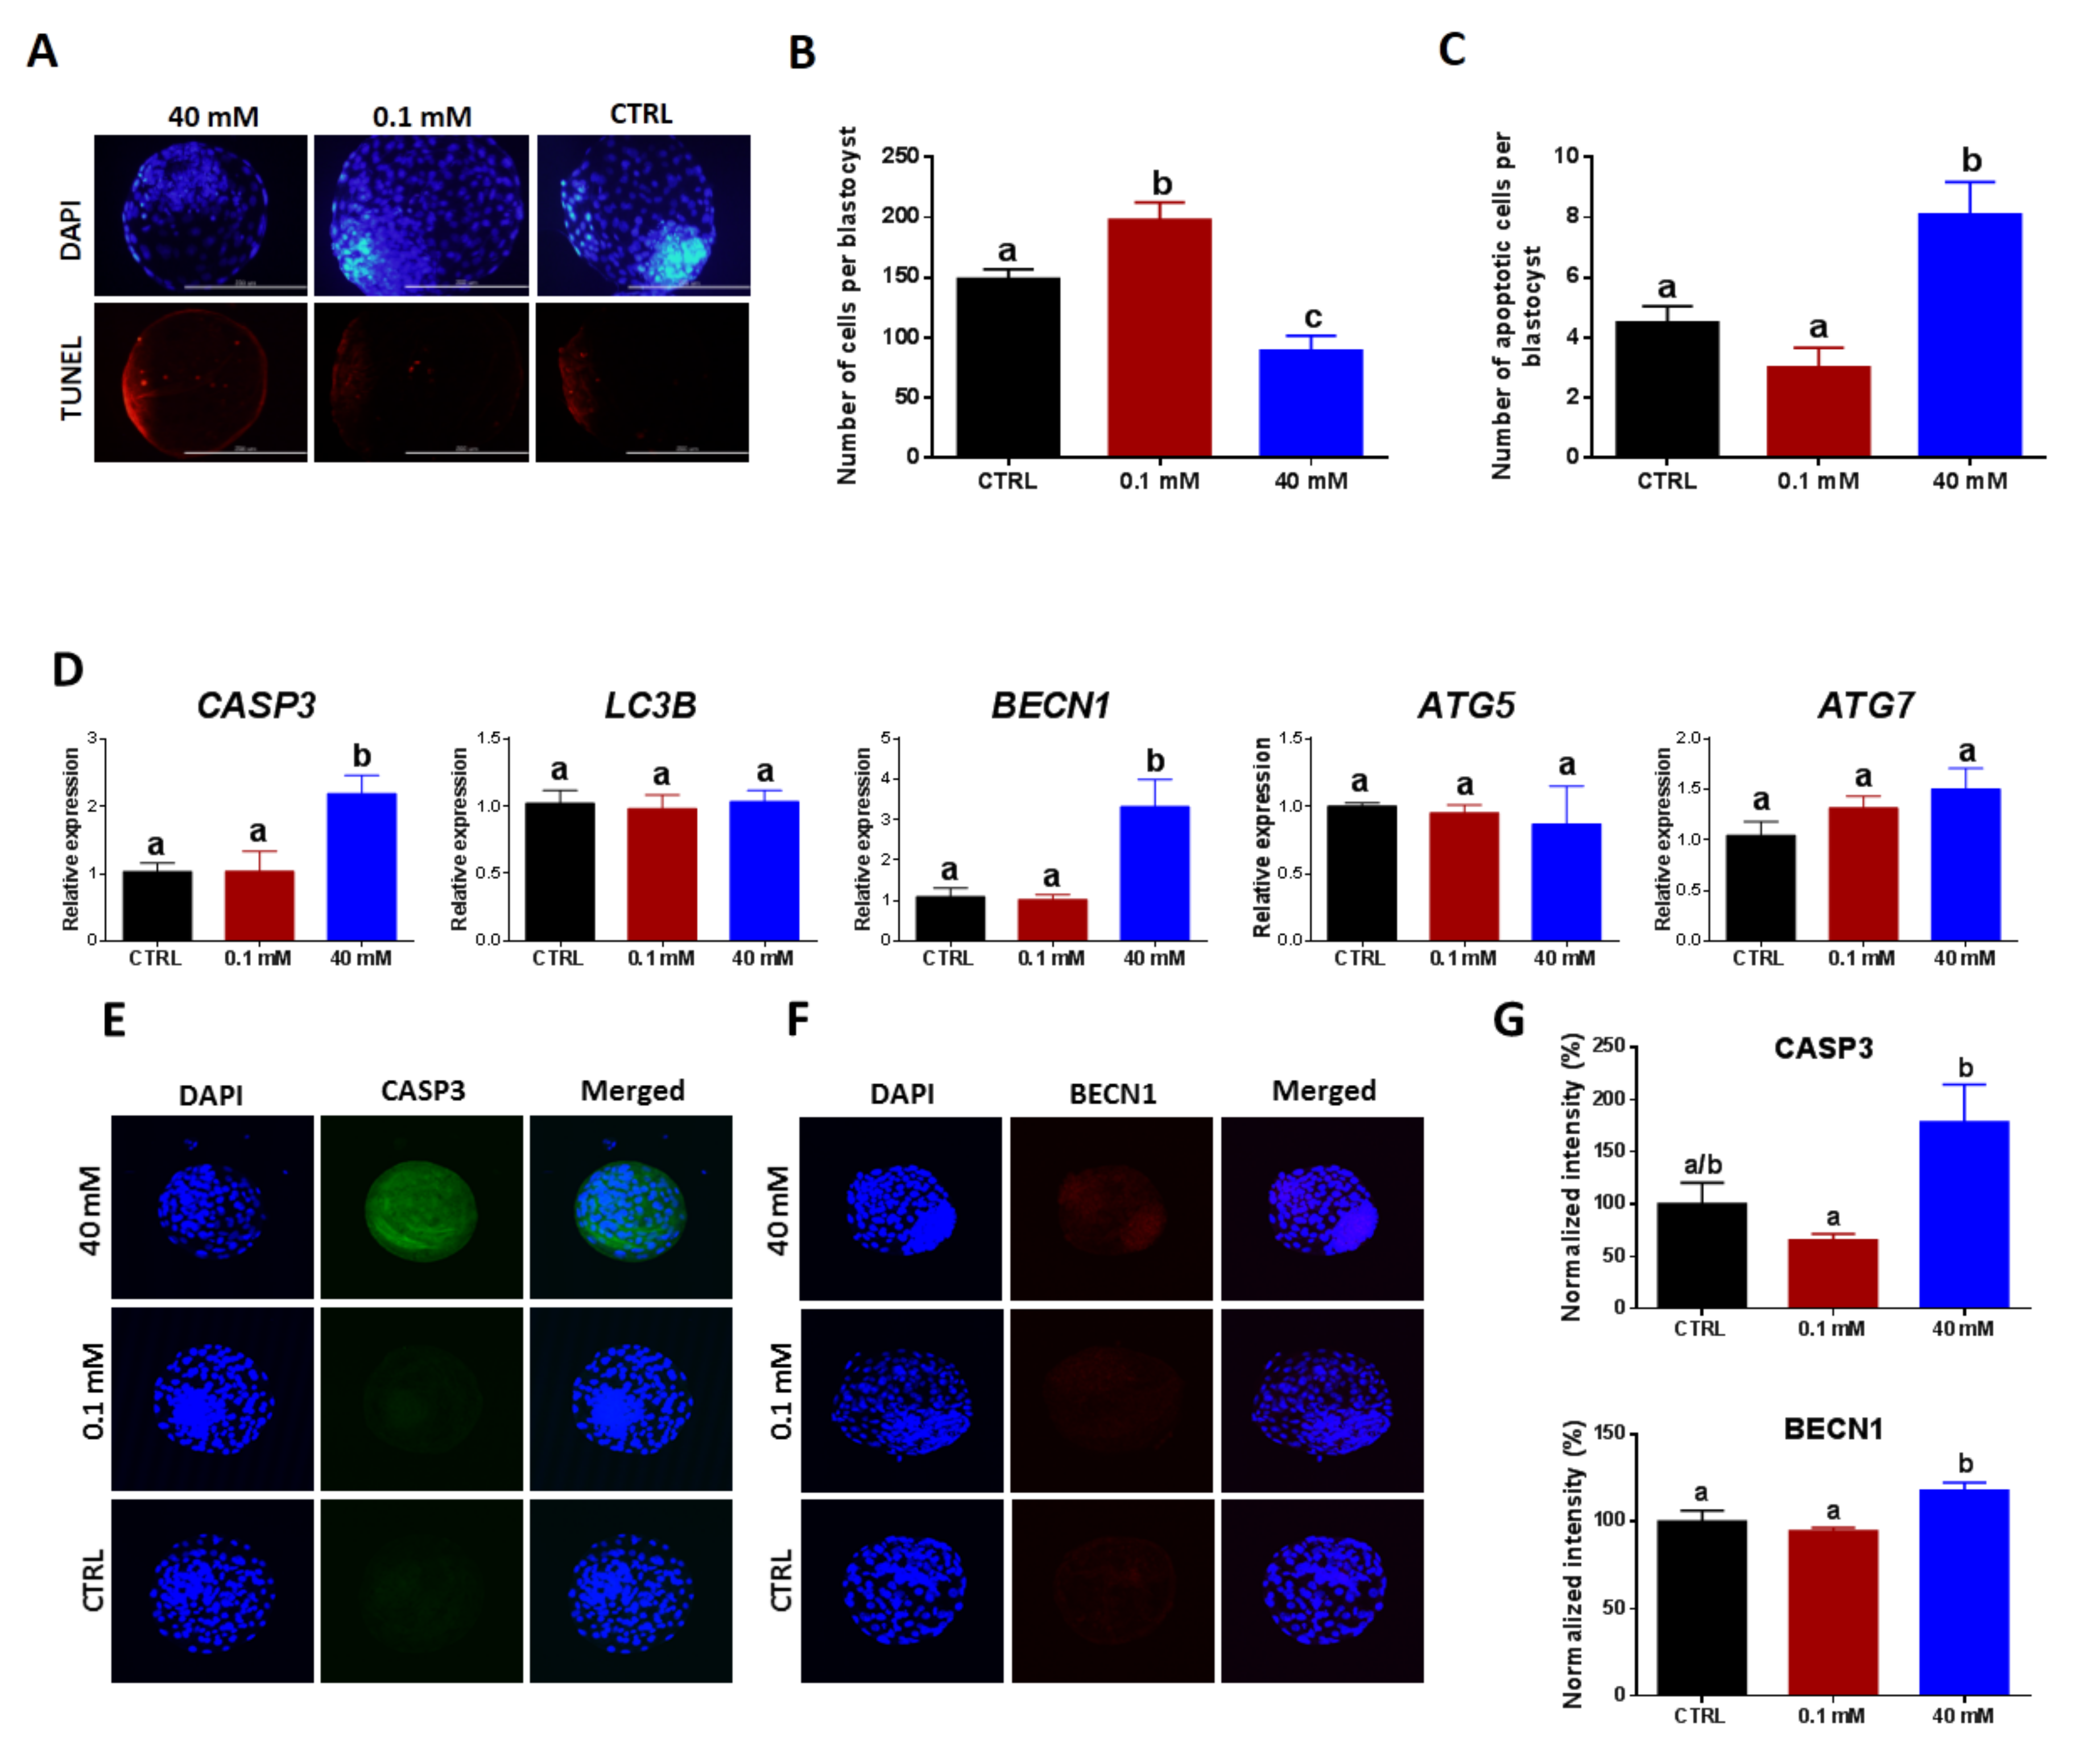
3.5. Supplementation with Low and High NAM Concentrations during the IVM Paradoxically Affects DNA Fragmentation, Apoptosis, Autophagy, and the Quality of Developed Embryos
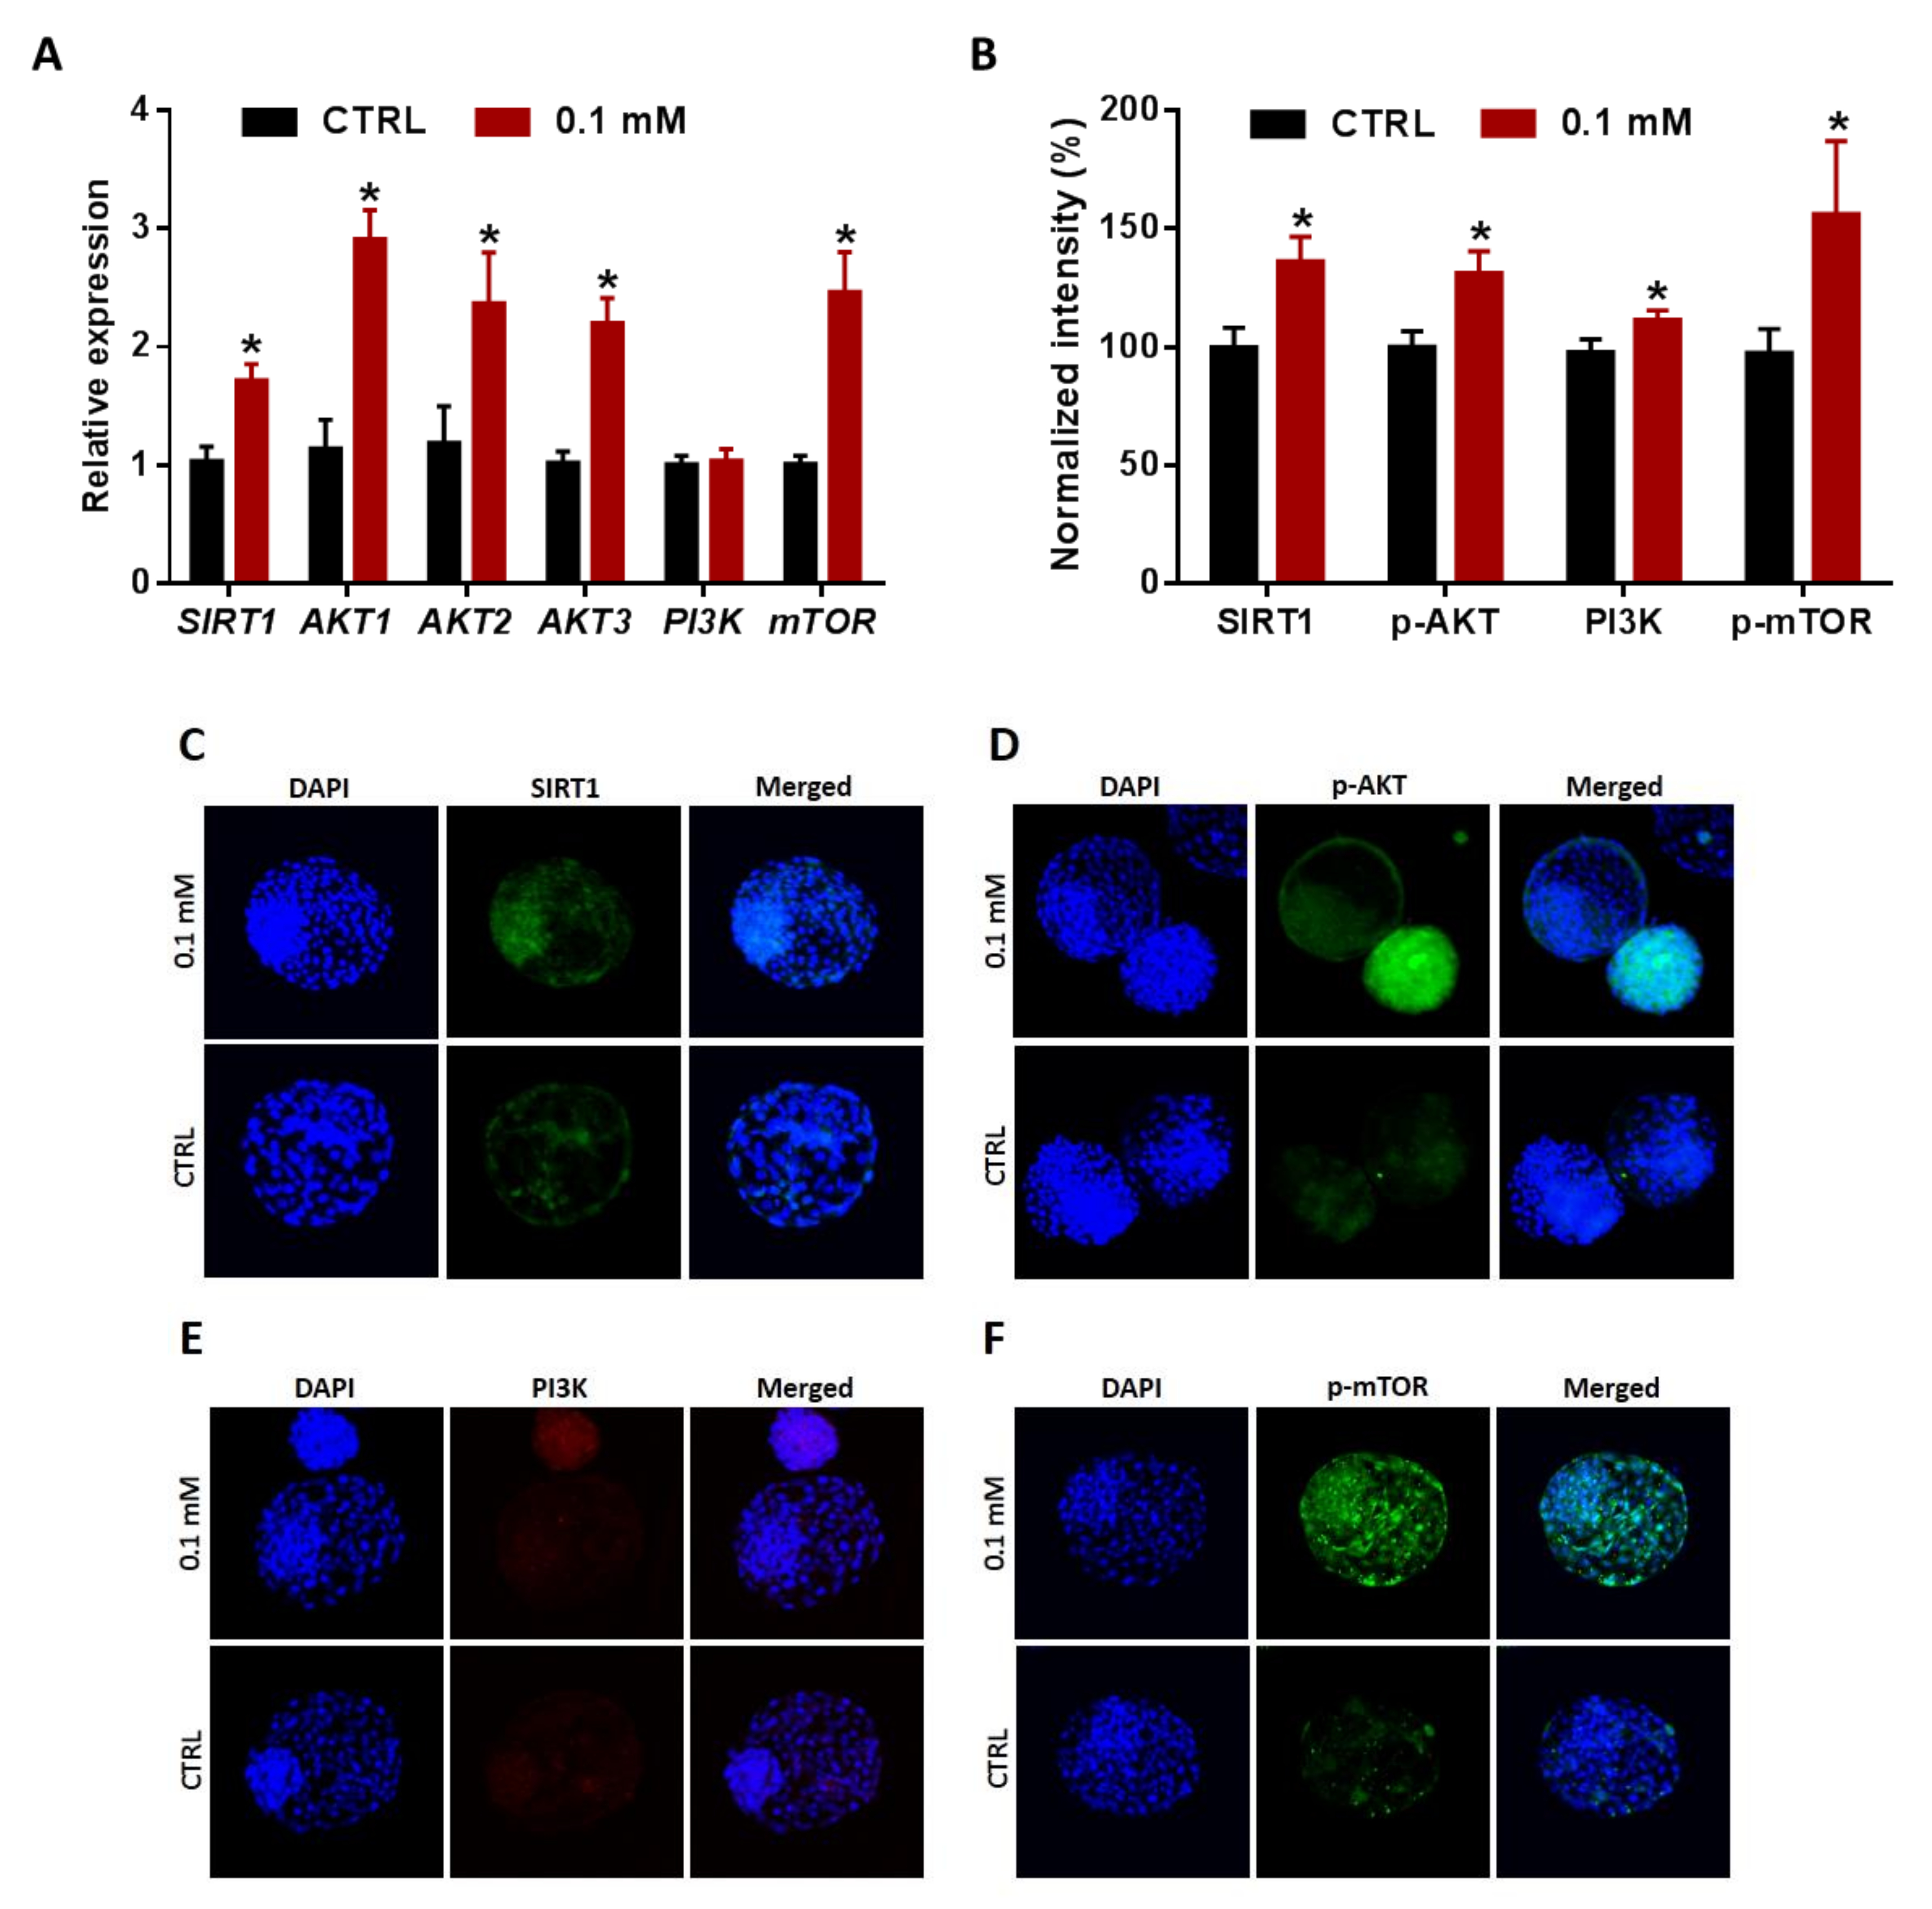
3.6. NAM Induces Hatching of Embryos, Derived from NAM-Treated Oocytes, Potentially via the Regulation of SIRT1 and PI3K/AKT/mTOR Signaling
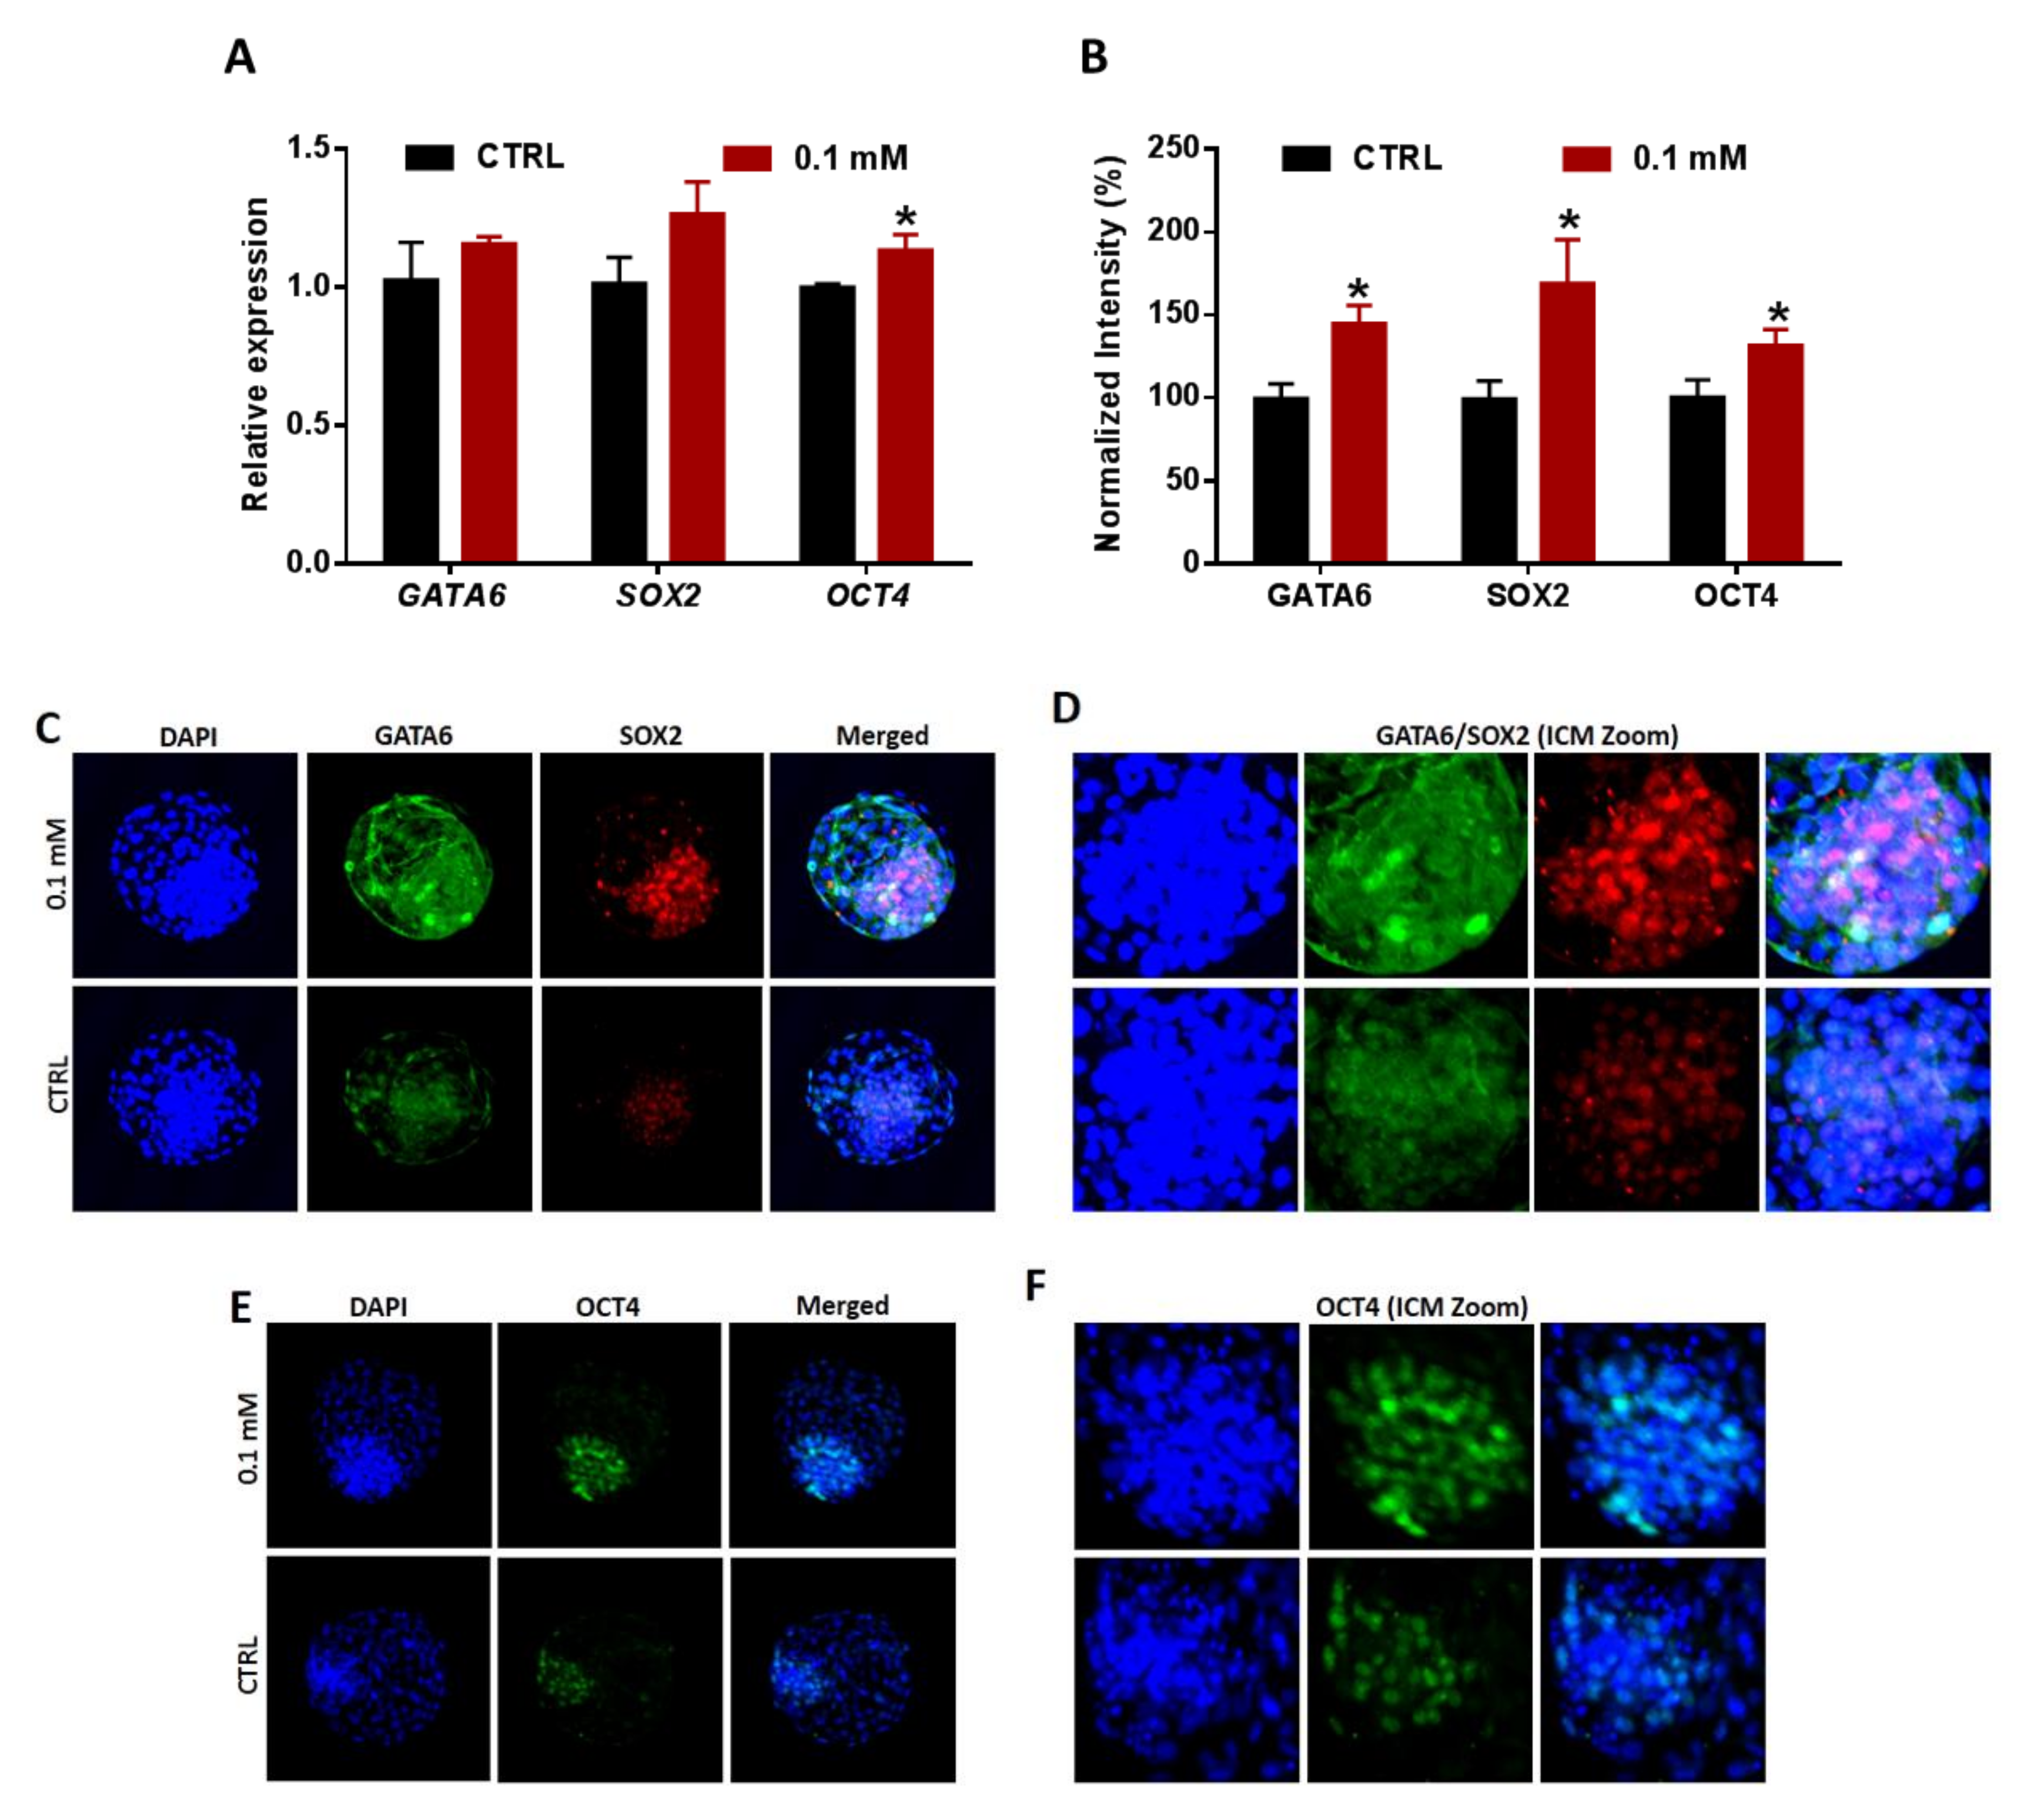
3.7. Lineages Specification of Embryos Developed from NAM-Treated Oocytes
4. Discussion
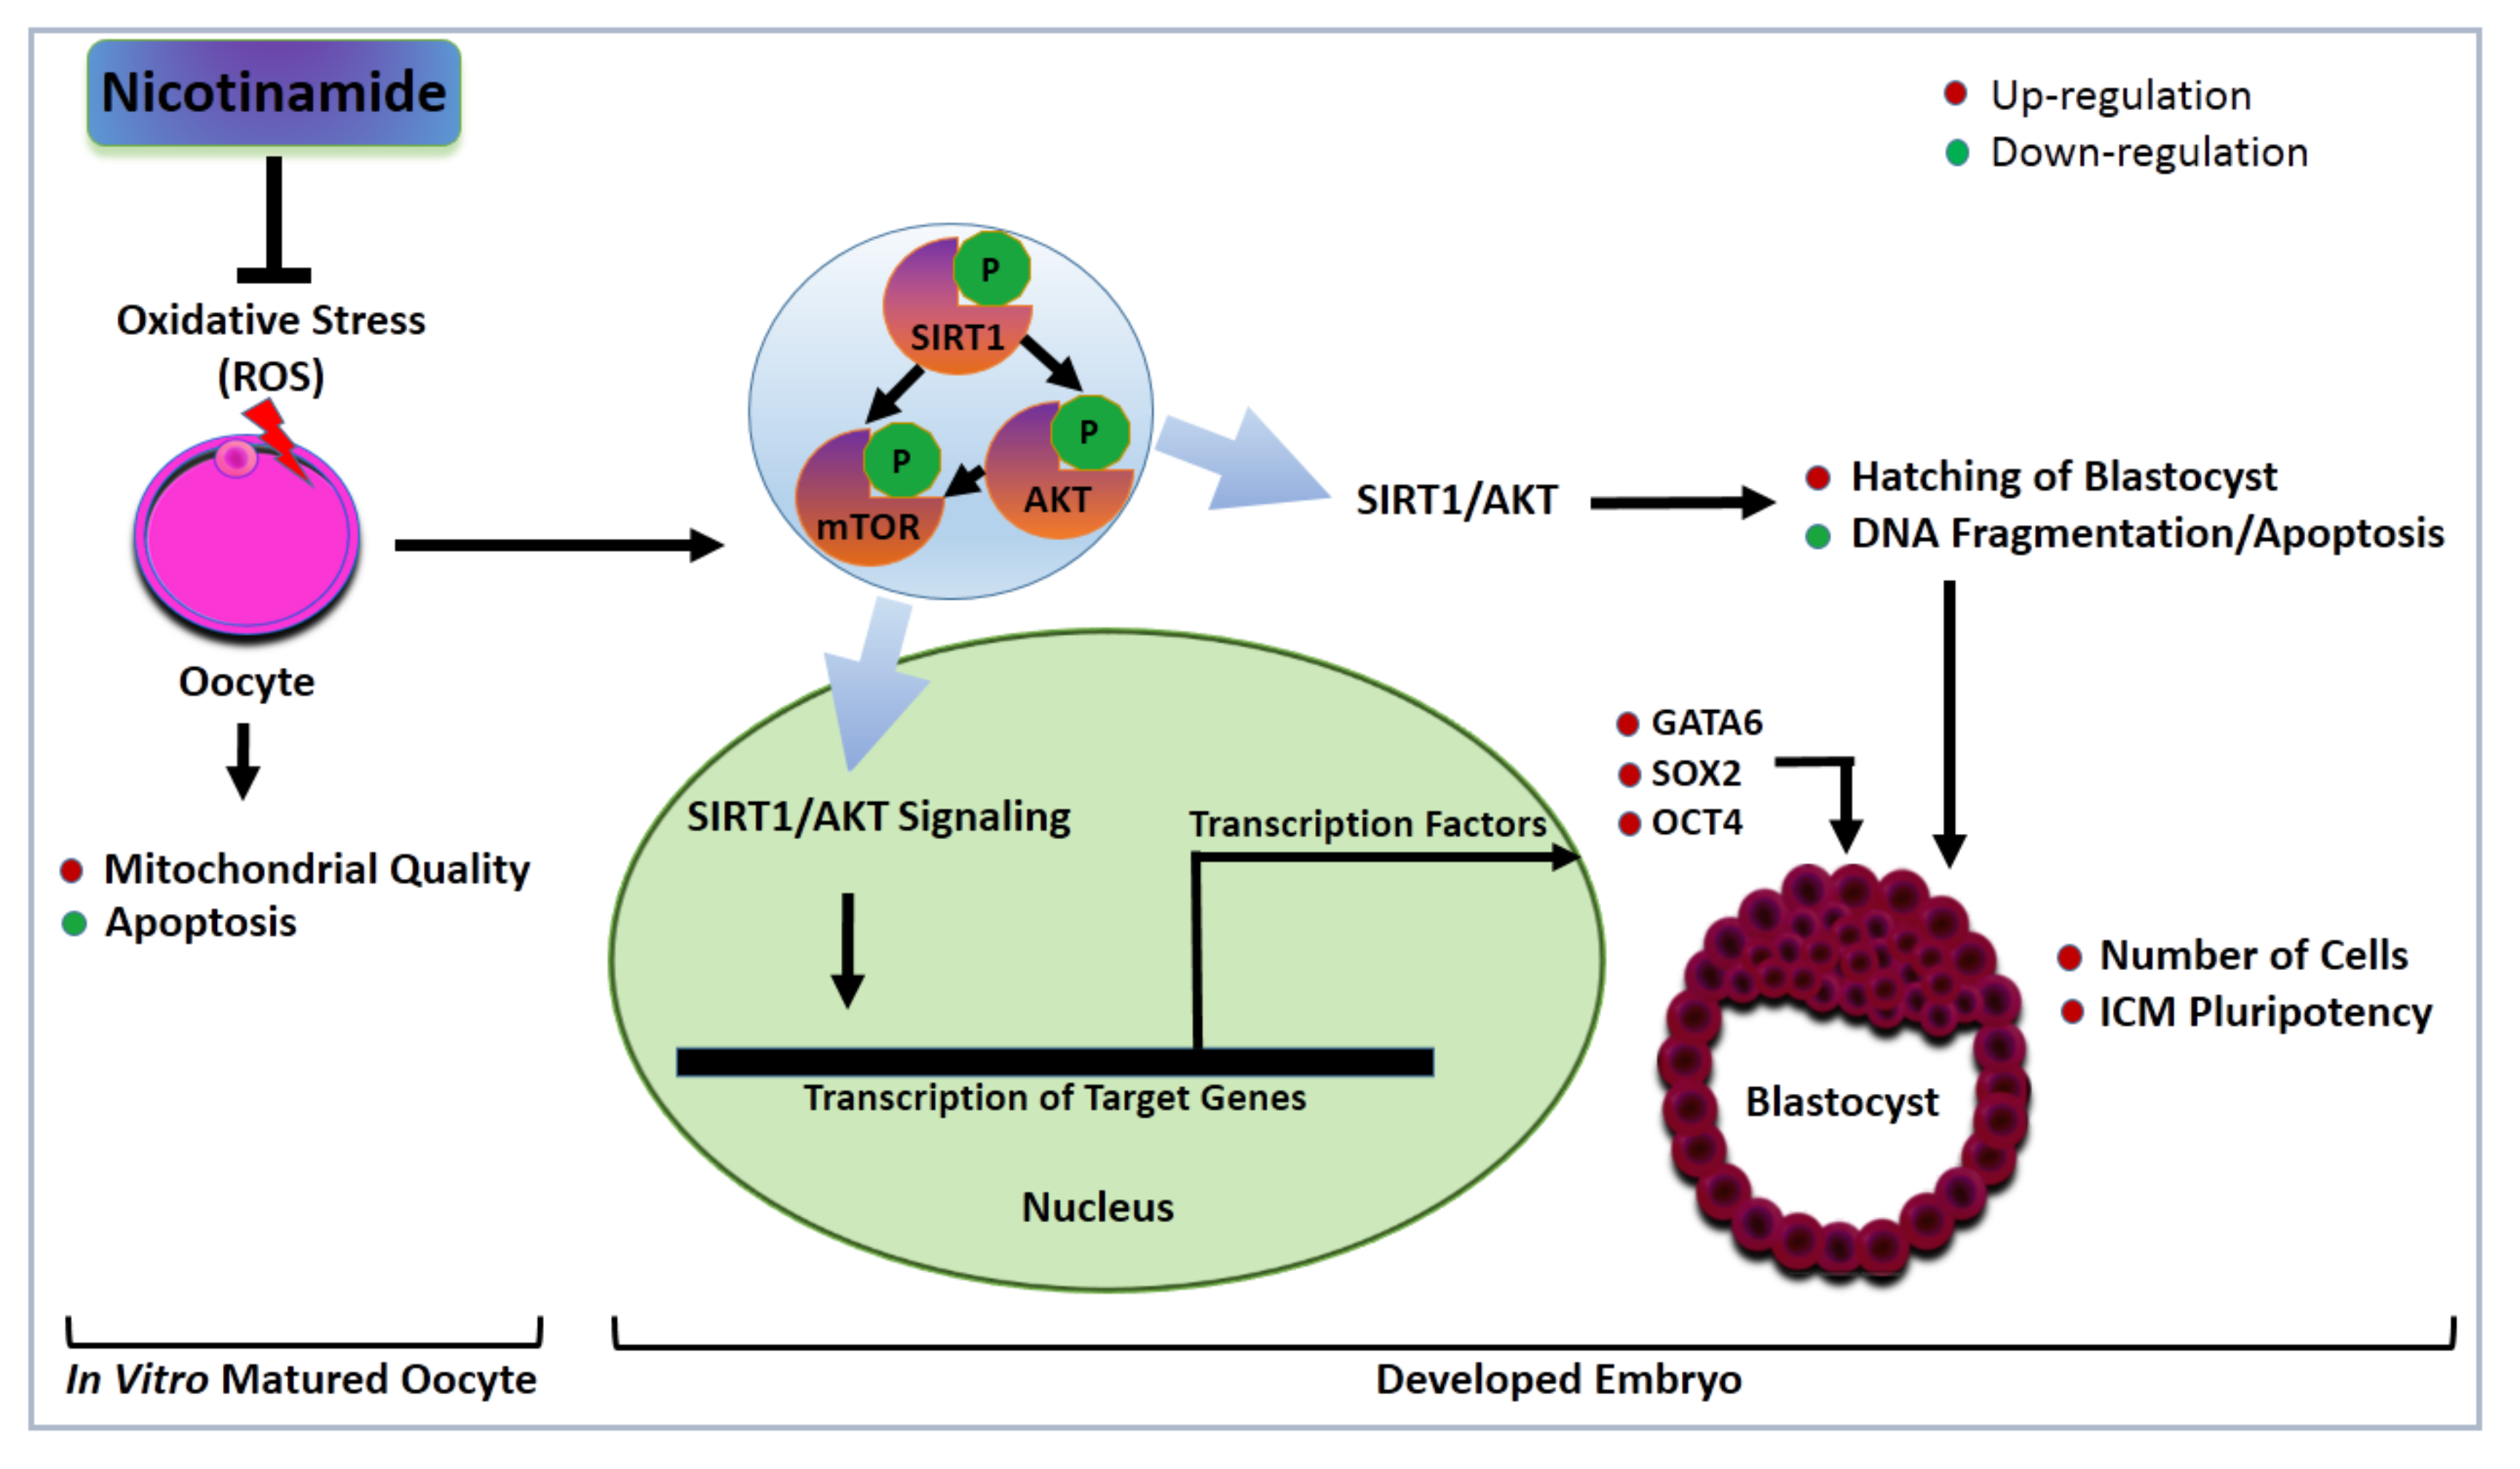
5. Conclusions
Supplementary Materials
Author Contributions
Funding
Acknowledgments
Conflicts of Interest
References
- Hwang, E.S.; Song, S.B. Nicotinamide is an inhibitor of SIRT1 in vitro, but can be a stimulator in cells. Cell. Mol. Life Sci. 2017, 74, 3347–3362. [Google Scholar] [CrossRef]
- Mesalam, A.; Khan, I.; Lee, K.-L.; Song, S.-H.; Chowdhury, M.; Uddin, Z.; Park, K.H.; Kong, I.-K. 2-Methoxystypandrone improves in vitro -produced bovine embryo quality through inhibition of IKBKB. Theriogenology 2017, 99, 10–20. [Google Scholar] [CrossRef] [PubMed]
- Wang, F.; Tian, X.; Zhang, L.; He, C.; Ji, P.; Li, Y.; Tan, D.; Liu, G. Beneficial effect of resveratrol on bovine oocyte maturation and subsequent embryonic development after in vitro fertilization. Fertil. Steril. 2014, 101, 577–586.e1. [Google Scholar] [CrossRef] [PubMed]
- Pang, Y.-W.; Jiang, X.-L.; Wang, Y.-C.; Wang, Y.-Y.; Hao, H.-S.; Zhao, S.-J.; Du, W.; Zhao, X.-M.; Wang, L.; Zhu, H.-B. Melatonin protects against paraquat-induced damage during in vitro maturation of bovine oocytes. J. Pineal Res. 2018, 66, e12532. [Google Scholar] [CrossRef] [PubMed]
- Choi, H.J.; Jang, S.-Y.; Hwang, E.S. High-Dose Nicotinamide Suppresses ROS Generation and Augments Population Expansion during CD8(+) T Cell Activation. Mol. Cells 2015, 38, 918–924. [Google Scholar] [CrossRef] [PubMed]
- Kang, H.T.; Hwang, E.S. Nicotinamide enhances mitochondria quality through autophagy activation in human cells. Aging Cell 2009, 8, 426–438. [Google Scholar] [CrossRef] [PubMed]
- Yuan, Y.-G.; Xu, L.; Zhang, S.; Mesalam, A.; Lee, K.-L.; Liu, H.; Joo, M.-D.; Idrees, M.; Kong, I.-K. Polydatin and I-CBP112 protects early bovine embryo against nicotinamide-induced mitochondrial dysfunction. Theriogenology 2019, 134, 1–10. [Google Scholar] [CrossRef]
- Tsai, F.C.; Gardner, D.K. Nicotinamide, a component of complex culture media, inhibits mouse embryo development in vitro and reduces subsequent developmental potential after transfer. Fertil. Steril. 1994, 61, 376–382. [Google Scholar] [CrossRef]
- Kwak, S.-S.; Cheong, S.-A.; Yoon, J.D.; Jeon, Y.; Hyun, S.H. Expression patterns of sirtuin genes in porcine preimplantation embryos and effects of sirtuin inhibitors on in vitro embryonic development after parthenogenetic activation and in vitro fertilization. Theriogenology 2012, 78, 1597–1610. [Google Scholar] [CrossRef]
- Lee, A.R.; Kishigami, S.; Amano, T.; Matsumoto, K.; Wakayama, T.; Hosoi, Y. Nicotinamide: A Class III HDACi Delays In Vitro Aging of Mouse Oocytes. J. Reprod. Dev. 2013, 59, 238–244. [Google Scholar] [CrossRef]
- McKiernan, S.; Bavister, B. Culture of one-cell hamster embryos with water soluble vitamins: Pantothenate stimulates blastocyst production. Hum. Reprod. 2000, 15, 157–164. [Google Scholar] [CrossRef] [PubMed]
- Mizushima, N.; Levine, B.; Cuervo, A.M.; Klionsky, D.J. Autophagy fights disease through cellular self-digestion. Nature 2008, 451, 1069–1075. [Google Scholar] [CrossRef] [PubMed]
- Duan, X.; Dai, X.-X.; Wang, T.; Liu, H.; Sun, S.-C. Melamine negatively affects oocyte architecture, oocyte development and fertility in mice. Hum. Reprod. 2015, 30, 1643–1652. [Google Scholar] [CrossRef] [PubMed]
- Zhang, J.-W.; Xu, D.-Q.; Feng, X.-Z. The toxic effects and possible mechanisms of glyphosate on mouse oocytes. Chemosphere 2019, 237, 124435. [Google Scholar] [CrossRef] [PubMed]
- Luo, D.; Zhang, J.-B.; Peng, Y.-X.; Liu, J.-B.; Han, D.-X.; Wang, Y.; Zhang, Z.; Yuan, B.; Gao, Y.; Chen, C.-Z.; et al. Imperatorin improves in vitro porcine embryo development by reducing oxidative stress and autophagy. Theriogenology 2020, 146, 145–151. [Google Scholar] [CrossRef]
- Shen, X.; Zhang, N.; Wang, Z.; Bai, G.; Zheng, Z.; Gu, Y.; Wu, Y.; Liu, H.; Zhou, D.; Lei, L. Induction of autophagy improves embryo viability in cloned mouse embryos. Sci. Rep. 2015, 5, 17829. [Google Scholar] [CrossRef]
- Song, B.-S.; Yoon, S.-B.; Kim, J.-S.; Sim, B.-W.; Kim, Y.-H.; Cha, J.-J.; Choi, S.-A.; Min, H.-K.; Lee, Y.; Huh, J.-W.; et al. Induction of Autophagy Promotes Preattachment Development of Bovine Embryos by Reducing Endoplasmic Reticulum Stress1. Biol. Reprod. 2012, 87, 8. [Google Scholar] [CrossRef]
- Di Emidio, G.; Falone, S.; Vitti, M.; D’Alessandro, A.M.; Vento, M.; Di Pietro, C.; Amicarelli, F.; Tatone, C. SIRT1 signalling protects mouse oocytes against oxidative stress and is deregulated during aging. Hum. Reprod. 2014, 29, 2006–2017. [Google Scholar] [CrossRef]
- Zhang, T.; Du, X.; Zhao, L.; He, M.; Lin, L.; Guo, C.; Zhang, X.; Han, J.; Yan, H.; Huang, K.; et al. SIRT1 facilitates primordial follicle recruitment independent of deacetylase activity through directly modulating Akt1 and mTOR transcription. FASEB J. 2019, 33, 14703–14716. [Google Scholar] [CrossRef]
- Ma, R.; Zhang, Y.; Zhang, L.; Han, J.; Rui, R. Sirt1 protects pig oocyte against in vitro aging. Anim. Sci. J. 2015, 86, 826–832. [Google Scholar] [CrossRef]
- Song, S.B.; Park, J.S.; Chung, G.J.; Lee, I.H.; Hwang, E.S. Diverse therapeutic efficacies and more diverse mechanisms of nicotinamide. Metabolomics 2019, 15, 137. [Google Scholar] [CrossRef] [PubMed]
- Riley, J.K.; Carayannopoulos, M.O.; Wyman, A.H.; Chi, M.; Ratajczak, C.K.; Moley, K. The PI3K/Akt pathway is present and functional in the preimplantation mouse embryo. Dev. Biol. 2005, 284, 377–386. [Google Scholar] [CrossRef] [PubMed]
- El Sheikh, M.; Mesalam, A.; Mesalam, A.; Idrees, M.; Lee, K.-L.; Kong, I.-K. Melatonin Abrogates the Anti-Developmental Effect of the AKT Inhibitor SH6 in Bovine Oocytes and Embryos. Int. J. Mol. Sci. 2019, 20, 2956. [Google Scholar] [CrossRef]
- Fiorenza, M.T.; Russo, G.; Narducci, M.G.; Bresin, A.; Mangia, F.; Bevilacqua, A. Protein kinase Akt2/PKBβ is involved in blastomere proliferation of preimplantation mouse embryos. J. Cell. Physiol. 2019, 235, 3393–3401. [Google Scholar] [CrossRef] [PubMed]
- Yu, J.; Cui, W. Proliferation, survival and metabolism: The role of PI3K/AKT/mTOR signalling in pluripotency and cell fate determination. Development 2016, 143, 3050–3060. [Google Scholar] [CrossRef] [PubMed]
- Bulut-Karslioglu, A.; Biechele, S.; Jin, H.; Macrae, T.A.; Hejna, M.; Gertsenstein, M.; Song, J.S.; Ramalho-Santos, M. Inhibition of mTOR induces a paused pluripotent state. Nature 2016, 540, 119–123. [Google Scholar] [CrossRef]
- Sarbassov, D.D.; Guertin, D.A.; Ali, S.M.; Sabatini, D.M. Phosphorylation and Regulation of Akt/PKB by the Rictor-mTOR Complex. Science 2005, 307, 1098–1101. [Google Scholar] [CrossRef]
- Artus, J.; Hue, I.; Acloque, H. Preimplantation development in ungulates: A ‘ménage à quatre’ scenario. Reproduction 2020, 159, R151–R172. [Google Scholar] [CrossRef]
- Liu, S.-J.; Sun, J.-B.; Hao, X.; Han, Z.; Wen, X.; Wang, X.-Y.; Zhou, C.-J.; Liang, C. Blastocyst hatching site is regularly distributed and does not influence foetal development in mice. Sci. Rep. 2020, 10, 1–8. [Google Scholar] [CrossRef]
- Guo, J.; Kim, N.-H.; Cui, X.-S. Inhibition of Fatty Acid Synthase Reduces Blastocyst Hatching through Regulation of the AKT Pathway in Pigs. PLoS ONE 2017, 12, e0170624. [Google Scholar] [CrossRef]
- Zhang, J.-G.; Zhao, G.; Qin, Q.; Wang, B.; Liu, L.; Liu, Y.; Deng, S.-C.; Tian, K.; Wang, C.-Y. Nicotinamide prohibits proliferation and enhances chemosensitivity of pancreatic cancer cells through deregulating SIRT1 and Ras/Akt pathways. Pancreatology 2013, 13, 140–146. [Google Scholar] [CrossRef] [PubMed]
- Wei, Y.; Guo, Y.; Zhou, J.; Dai, K.; Xu, Q.; Jin, X. Nicotinamide Overcomes Doxorubicin Resistance of Breast Cancer Cells through Deregulating SIRT1/Akt Pathway. Anti-Cancer Agents Med. Chem. 2019, 19, 687–696. [Google Scholar] [CrossRef] [PubMed]
- Rossant, J.; Tam, P.P.L. Blastocyst lineage formation, early embryonic asymmetries and axis patterning in the mouse. Development 2009, 136, 701–713. [Google Scholar] [CrossRef] [PubMed]
- Bessonnard, S.; De Mot, L.; Gonze, D.; Barriol, M.; Dennis, C.; Goldbeter, A.; Dupont, G.; Chazaud, C. Gata6, Nanog and Erk signaling control cell fate in the inner cell mass through a tristable regulatory network. Development 2014, 141, 3637–3648. [Google Scholar] [CrossRef] [PubMed]
- Do, D.V.; Ueda, J.; Messerschmidt, D.M.; Lorthongpanich, C.; Zhou, Y.; Feng, B.; Guo, G.; Lin, P.J.; Hossain, Z.; Zhang, W.; et al. A genetic and developmental pathway from STAT3 to the OCT4–NANOG circuit is essential for maintenance of ICM lineages in vivo. Genes Dev. 2013, 27, 1378–1390. [Google Scholar] [CrossRef]
- Mesalam, A.; Lee, K.-L.; Khan, I.; Chowdhury, M.M.R.; Zhang, S.; Song, S.-H.; Joo, M.-D.; Lee, J.-H.; Jin, J.-I.; Kong, I.-K. A combination of bovine serum albumin with insulin-transferrin-sodium selenite and/or epidermal growth factor as alternatives to fetal bovine serum in culture medium improves bovine embryo quality and trophoblast invasion by induction of matrix metalloproteinases. Reprod. Fertil. Dev. 2018, 31, 333. [Google Scholar] [CrossRef]
- Riepsamen, A.H.; Wu, L.; Lau, L.; Listijono, D.; Ledger, W.L.; Sinclair, D.A.; Homer, H.A. Nicotinamide Impairs Entry into and Exit from Meiosis I in Mouse Oocytes. PLoS ONE 2015, 10, e0126194. [Google Scholar] [CrossRef]
- Zhang, L.; Ma, R.; Hu, J.; Ding, X.; Xu, Y. Sirtuin Inhibition Adversely Affects Porcine Oocyte Meiosis. PLoS ONE 2015, 10, e0132941. [Google Scholar] [CrossRef]
- Eppig, J.J.; O’Brien, M. Comparison of preimplantation developmental competence after mouse oocyte growth and development in vitro and in vivo. Theriogenology 1998, 49, 415–422. [Google Scholar] [CrossRef]
- Jiang, W.-J.; Hu, L.-L.; Ren, Y.-P.; Lu, X.; Luo, X.-Q.; Li, Y.-H.; Xu, Y.-N. Podophyllotoxin affects porcine oocyte maturation by inducing oxidative stress-mediated early apoptosis. Toxicon 2020, 176, 15–20. [Google Scholar] [CrossRef]
- Thorburn, A. Apoptosis and autophagy: Regulatory connections between two supposedly different processes. Apoptosis 2008, 13, 1–9. [Google Scholar] [CrossRef] [PubMed]
- Luo, S.; Rubinsztein, D.C. Atg5 and Bcl-2 provide novel insights into the interplay between apoptosis and autophagy. Cell Death Differ. 2007, 14, 1247–1250. [Google Scholar] [CrossRef] [PubMed]
- Schoolcraft, W.B.; Gardner, D.K.; Lane, M.; Schlenker, T.; Hamilton, F.; Meldrum, D.R. Blastocyst culture and transfer: Analysis of results and parameters affecting outcome in two in vitro fertilization programs. Fertil. Steril. 1999, 72, 604–609. [Google Scholar] [CrossRef]
- Vanni, V.S.; Somigliana, E.; Reschini, M.; Pagliardini, L.; Marotta, E.; Faulisi, S.; Paffoni, A.; Viganò, P.; Vegetti, W.; Candiani, M.; et al. Top quality blastocyst formation rates in relation to progesterone levels on the day of oocyte maturation in GnRH antagonist IVF/ICSI cycles. PLoS ONE 2017, 12, e0176482. [Google Scholar] [CrossRef] [PubMed]
- Koga, T.; Suico, M.A.; Shimasaki, S.; Watanabe, E.; Kai, Y.; Koyama, K.; Omachi, K.; Morino-Koga, S.; Sato, T.; Shuto, T.; et al. Endoplasmic Reticulum (ER) Stress Induces Sirtuin 1 (SIRT1) Expression via the PI3K-Akt-GSK3β Signaling Pathway and Promotes Hepatocellular Injury. J. Biol. Chem. 2015, 290, 30366–30374. [Google Scholar] [CrossRef]
- Li, J.; Dou, X.; Li, S.; Zhang, X.; Zeng, Y.; Song, Z. Nicotinamide ameliorates palmitate-induced ER stress in hepatocytes via cAMP/PKA/CREB pathway-dependent Sirt1 upregulation. Biochim. Biophys. Acta (BBA) Bioenergy 2015, 1853, 2929–2936. [Google Scholar] [CrossRef]
- Jang, S.-Y.; Kang, H.T.; Hwang, E.S. Nicotinamide-induced Mitophagy: Event mediated by high NAD+/NADH ratio and SIRT1 protein activation. J. Biol. Chem. 2012, 287, 19304–19314. [Google Scholar] [CrossRef]
- Stoyas, C.A.; Bushart, D.D.; Switonski, P.M.; Ward, J.M.; Alaghatta, A.; Tang, M.-B.; Niu, C.; Wadhwa, M.; Huang, H.; Savchenko, A.; et al. Nicotinamide Pathway-Dependent Sirt1 Activation Restores Calcium Homeostasis to Achieve Neuroprotection in Spinocerebellar Ataxia Type 7. Neuron 2020, 105, 630–644.e9. [Google Scholar] [CrossRef]
- Wan, H.; Li, J.; Liao, H.; Liao, M.; Luo, L.; Xu, L.; Yuan, K.; Zeng, Y. Nicotinamide induces liver regeneration and improves liver function by activating SIRT1. Mol. Med. Rep. 2018, 19, 555–562. [Google Scholar] [CrossRef]
- Canto, C.; Jiang, L.Q.; Deshmukh, A.; Mataki, C.; Coste, A.; Lagouge, M.; Zierath, J.R.; Auwerx, J. Interdependence of AMPK and SIRT1 for Metabolic Adaptation to Fasting and Exercise in Skeletal Muscle. Cell Metab. 2010, 11, 213–219. [Google Scholar] [CrossRef]
- Imai, S.-I. Nicotinamide phosphoribosyltransferase (Nampt): A link between NAD biology, metabolism, and diseases. Curr. Pharm. Des. 2009, 15, 20–28. [Google Scholar] [CrossRef] [PubMed]
- Alonzi, T.; Middleton, G.; Wyatt, S.; Buchman, V.L.; Betz, U.A.K.; Müller, W.; Musiani, P.; Poli, V.; Davies, A.M. Role of STAT3 and PI 3-Kinase/Akt in Mediating the Survival Actions of Cytokines on Sensory Neurons. Mol. Cell. Neurosci. 2001, 18, 270–282. [Google Scholar] [CrossRef] [PubMed]
- Chong, Z.-Z.; Lin, S.-H.; Li, F.; Maiese, K. The sirtuin inhibitor nicotinamide enhances neuronal cell survival during acute anoxic injury through AKT, BAD, PARP, and mitochondrial associated “anti-apoptotic” pathways. Curr. Neurovascular Res. 2005, 2, 271–285. [Google Scholar] [CrossRef] [PubMed]
- Le Bin, G.C.; Muñoz-Descalzo, S.; Kurowski, A.; Leitch, H.; Lou, X.; Mansfield, W.; Etienne-Dumeau, C.; Grabole, N.; Mulas, C.; Niwa, H.; et al. Oct4 is required for lineage priming in the developing inner cell mass of the mouse blastocyst. Development 2014, 141, 1001–1010. [Google Scholar] [CrossRef] [PubMed]
- Malak, P.N.; Dannenmann, B.; Hirth, A.; Rothfuss, O.C.; Schulze-Osthoff, K. Novel AKT phosphorylation sites identified in the pluripotency factors OCT4, SOX2 and KLF4. Cell Cycle 2015, 14, 3748–3754. [Google Scholar] [CrossRef]
- Chen, B.; Xue, Z.; Yang, G.; Shi, B.; Yang, B.; Yan, Y.; Wang, X.; Han, D.; Huang, Y.; Dong, W. Akt-Signal Integration Is Involved in the Differentiation of Embryonal Carcinoma Cells. PLoS ONE 2013, 8, e64877. [Google Scholar] [CrossRef]


| Gene Name | Sequence | GenBank Accession Number | Product Size (bp) |
|---|---|---|---|
| Apoptosis/Autophagy-Related Genes | |||
| CASP3 | F: CCCAAGTGTGACCACTGAAC R: CCATTAGGCCACACTCACTG | NM_001077840.1 | 169 |
| CASP9 | F: CGCCACCATCTTCTCCCTG R: CCAACGTCTCCTTCTCCTCC | NM_001077111.1 | 83 |
| BCL2 | F: TGGATGACCGAGTACCTGAA R: CAGCCAGGAGAAATCAAACA | NM_001166486.1 | 120 |
| ATG5 | F: CCACTGCCGTCATTAAACCT R: TTCCACTCCCTCGAGCTAAA | XM_024996700.1 | 212 |
| ATG7 | F: ATGGCCTTTGAGGAACCTTT R: ATGCCTCCCTTCTGGTTCTT | XM_010817935.3 | 210 |
| BECN1 | F: AGTTGAGAAAGGCGAGACAC R: GATGGAATAGGAACCACCAC | NM_001033627.2 | 100 |
| LC3B | F: TTATCCGAGAGCAGCATCC R: AGGCTTGATTAGCATTGAGC | NM_001001169.1 | 171 |
| SIRT1/AKT Signaling-Related Genes | |||
| SIRT1 | F: CAACGGTTTCCATTCGTGTG R: GTTCGAGGATCTGTGCCAAT | NM_001192980.3 | 138 |
| PI3K | F: TCAACCATGACTGTGTGCCA R: CCATCAGCATCAAATTGGGCA | XM_027540417.1 | 234 |
| AKT1 | F: AAAAGGAAGTGGTGTACAGG R: GAAGTCGGTGATCTTGATGT | NM_173986.2 | 80 |
| AKT2 | F: CGACTATCTCAAACTCCTGG R: ATCTTCATGGCATAGTAGCG | NM_001206146.2 | 90 |
| AKT3 | F: AGCTGTTTTTCCATTTGTCG R: TGTAGATAGTCCAAGGCAGA | NM_001191309.1 | 94 |
| mTOR | F: TTAACAGGGTTCGAGAGAAG R: AGAGGTTTTCATGGGATGTC | XM_002694043.6 | 113 |
| ICM Pluripotency-Related Genes | |||
| GATA6 | F: AAGATGCTGACCAGACATCT R: AGAGACCAGCTGCCTGGAAGT | XM_002697727.3 | 206 |
| SOX2 | F: CGAGTGGAAACTTTTGTCCG R: GGTATTTATAATCCGGGTGTT | NM_001105463.2 | 101 |
| OCT4 | F: GGAGAGCATGTTCCTGCAGTGC R: ACACTCGGACCACGTCCTTCTC | NM_174580.3 | 95 |
| Reference Genes | |||
| GADPH | F: CCCAGAATATCATCCCTGCT R: CTGCTTCACCACCTTCTTGA | NM_001034034.2 | 185 |
| ACTB | F: ATTTTGAATGGACAGCCATC R: TGTACAGGAAAGCCCTGACT | NM_173979.3 | 120 |
© 2020 by the authors. Licensee MDPI, Basel, Switzerland. This article is an open access article distributed under the terms and conditions of the Creative Commons Attribution (CC BY) license (http://creativecommons.org/licenses/by/4.0/).
Share and Cite
El Sheikh, M.; Mesalam, A.A.; Idrees, M.; Sidrat, T.; Mesalam, A.; Lee, K.-L.; Kong, I.-K. Nicotinamide Supplementation during the In Vitro Maturation of Oocytes Improves the Developmental Competence of Preimplantation Embryos: Potential Link to SIRT1/AKT Signaling. Cells 2020, 9, 1550. https://doi.org/10.3390/cells9061550
El Sheikh M, Mesalam AA, Idrees M, Sidrat T, Mesalam A, Lee K-L, Kong I-K. Nicotinamide Supplementation during the In Vitro Maturation of Oocytes Improves the Developmental Competence of Preimplantation Embryos: Potential Link to SIRT1/AKT Signaling. Cells. 2020; 9(6):1550. https://doi.org/10.3390/cells9061550
Chicago/Turabian StyleEl Sheikh, Marwa, Ahmed Atef Mesalam, Muhammad Idrees, Tabinda Sidrat, Ayman Mesalam, Kyeong-Lim Lee, and Il-Keun Kong. 2020. "Nicotinamide Supplementation during the In Vitro Maturation of Oocytes Improves the Developmental Competence of Preimplantation Embryos: Potential Link to SIRT1/AKT Signaling" Cells 9, no. 6: 1550. https://doi.org/10.3390/cells9061550
APA StyleEl Sheikh, M., Mesalam, A. A., Idrees, M., Sidrat, T., Mesalam, A., Lee, K.-L., & Kong, I.-K. (2020). Nicotinamide Supplementation during the In Vitro Maturation of Oocytes Improves the Developmental Competence of Preimplantation Embryos: Potential Link to SIRT1/AKT Signaling. Cells, 9(6), 1550. https://doi.org/10.3390/cells9061550