Changes in Striatal Medium Spiny Neuron Morphology Resulting from Dopamine Depletion Are Reversible


Abstract

1. Introduction
2. Methods
2.1. MPTP Mice
2.2. Golgi Staining and Analysis
2.3. HPLC Analysis of Catecholamines
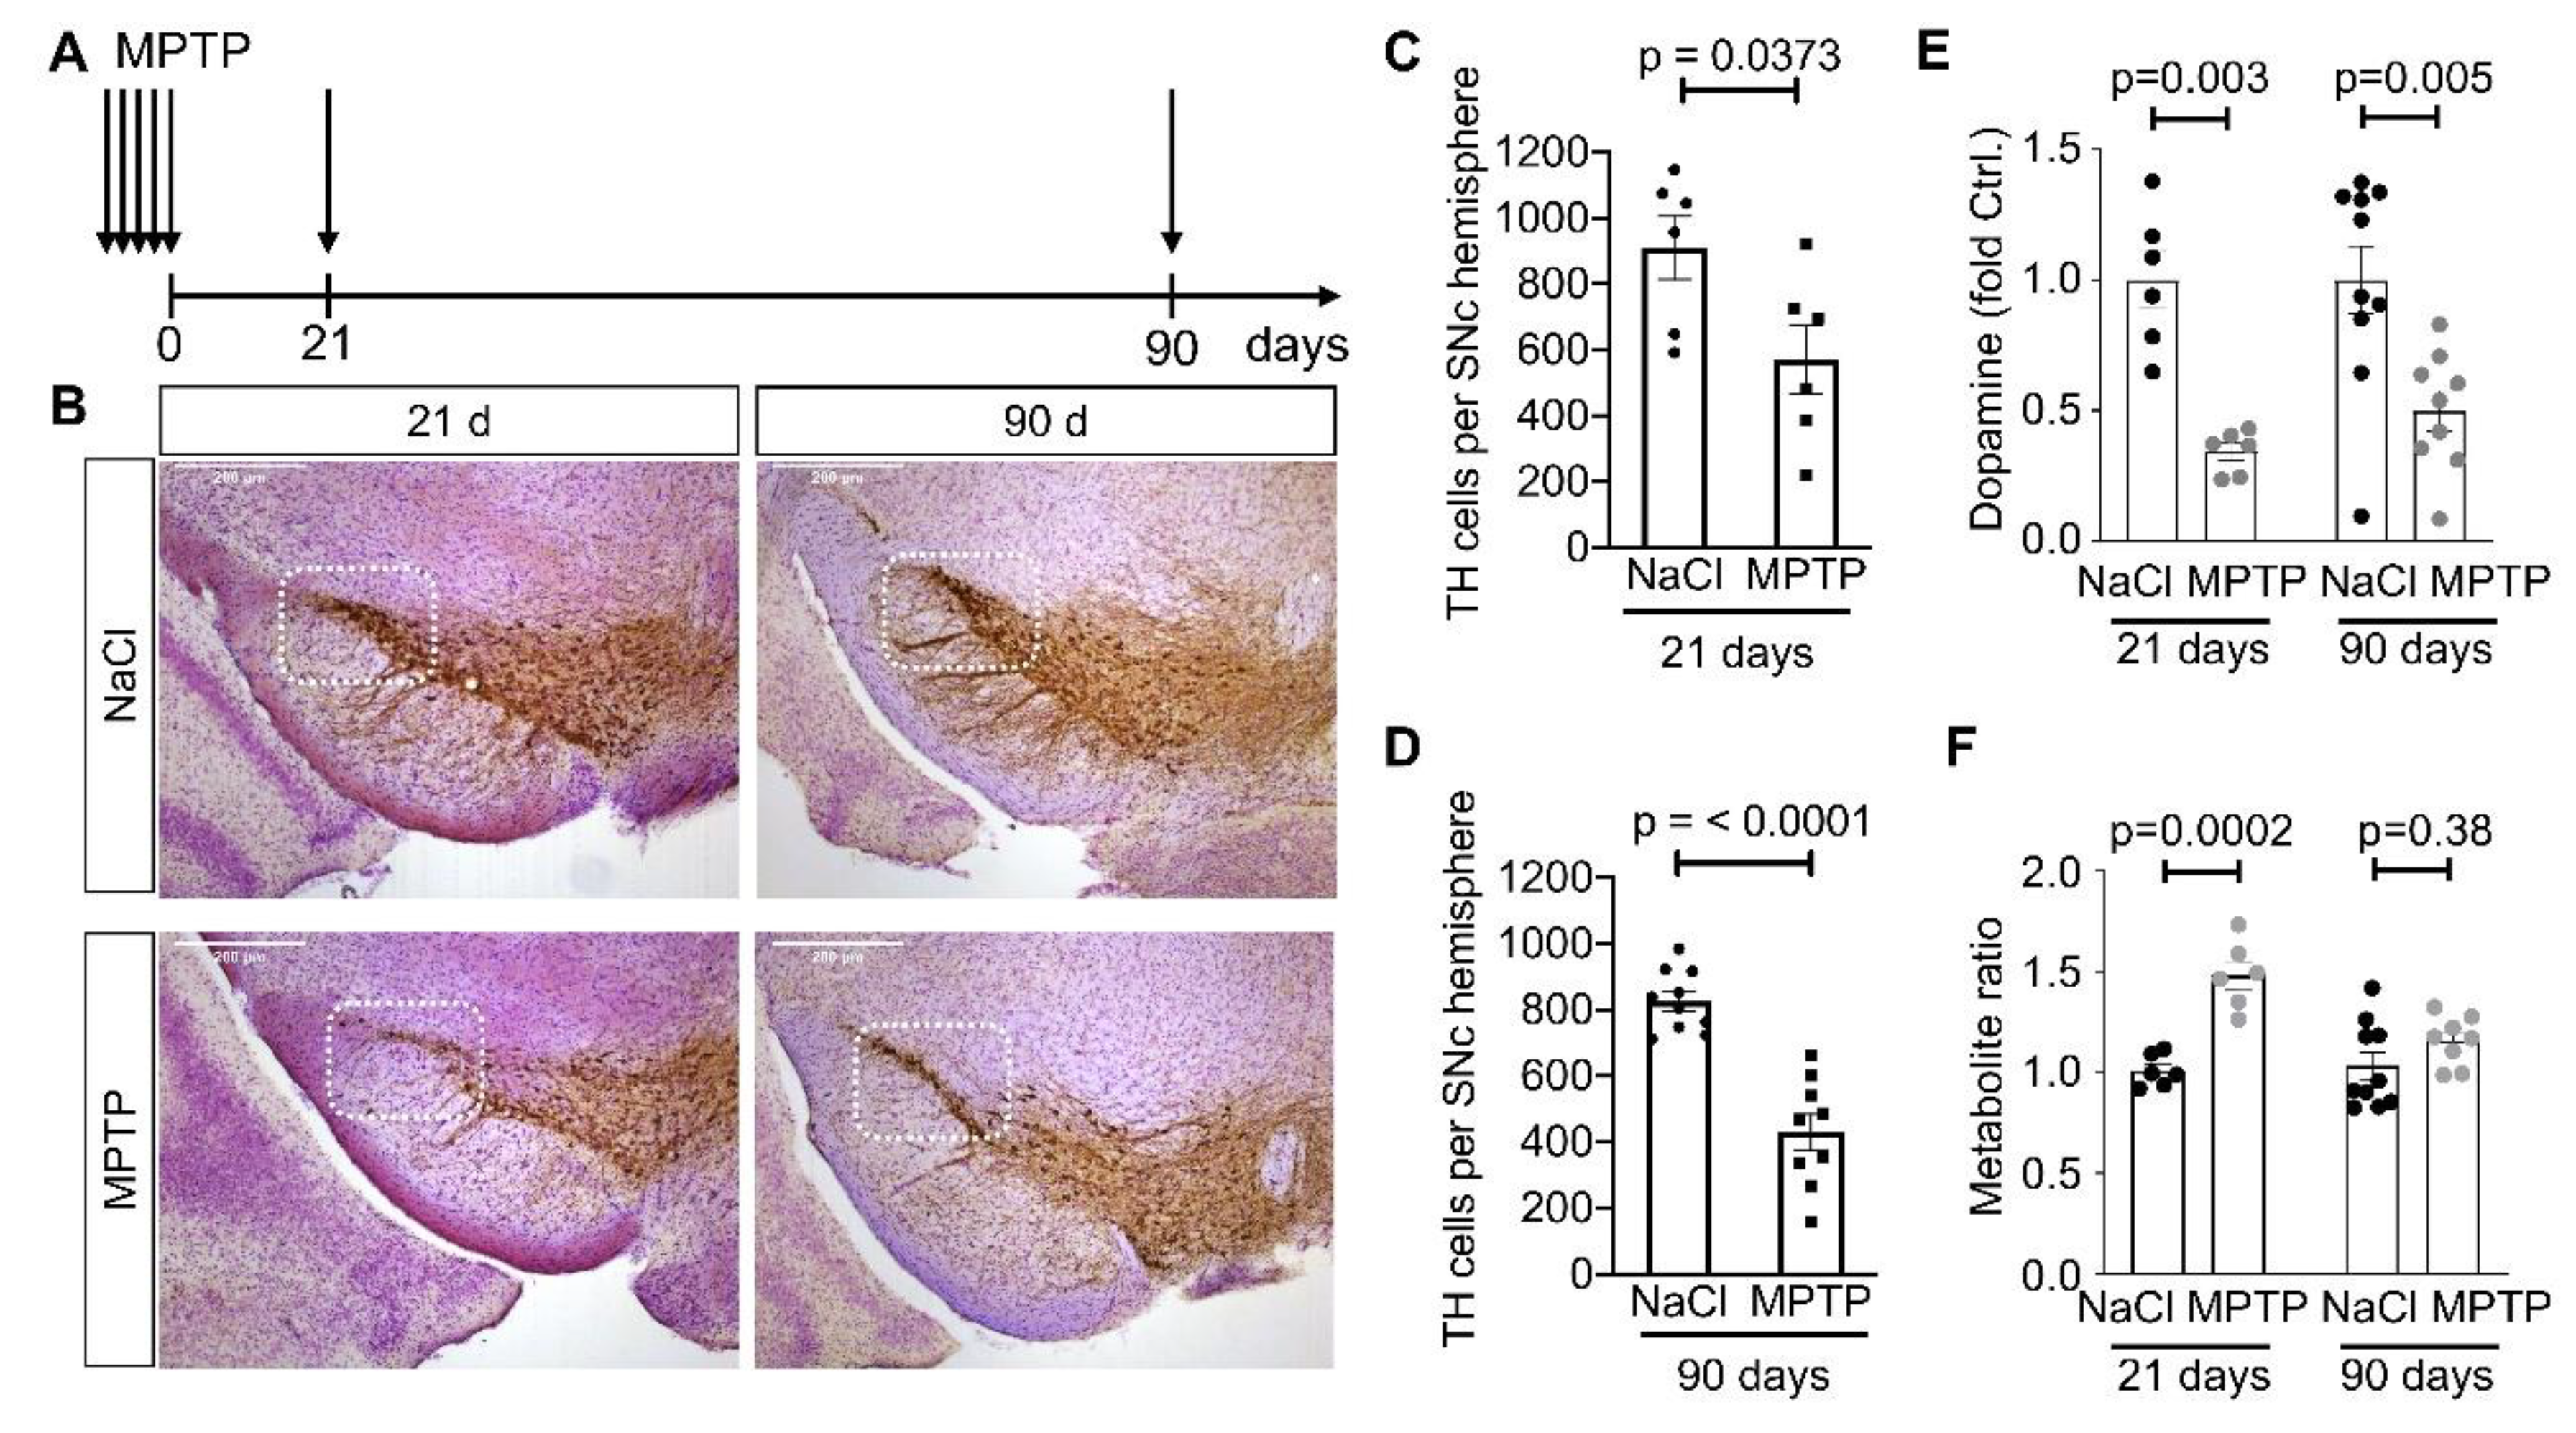
2.4. Immunohistochemistry and Quantification
2.5. Statistical Analysis and Data Visualization
3. Results
3.1. Reduced Complexity of MSN Dendritic Arbors after Dopamine Depletion
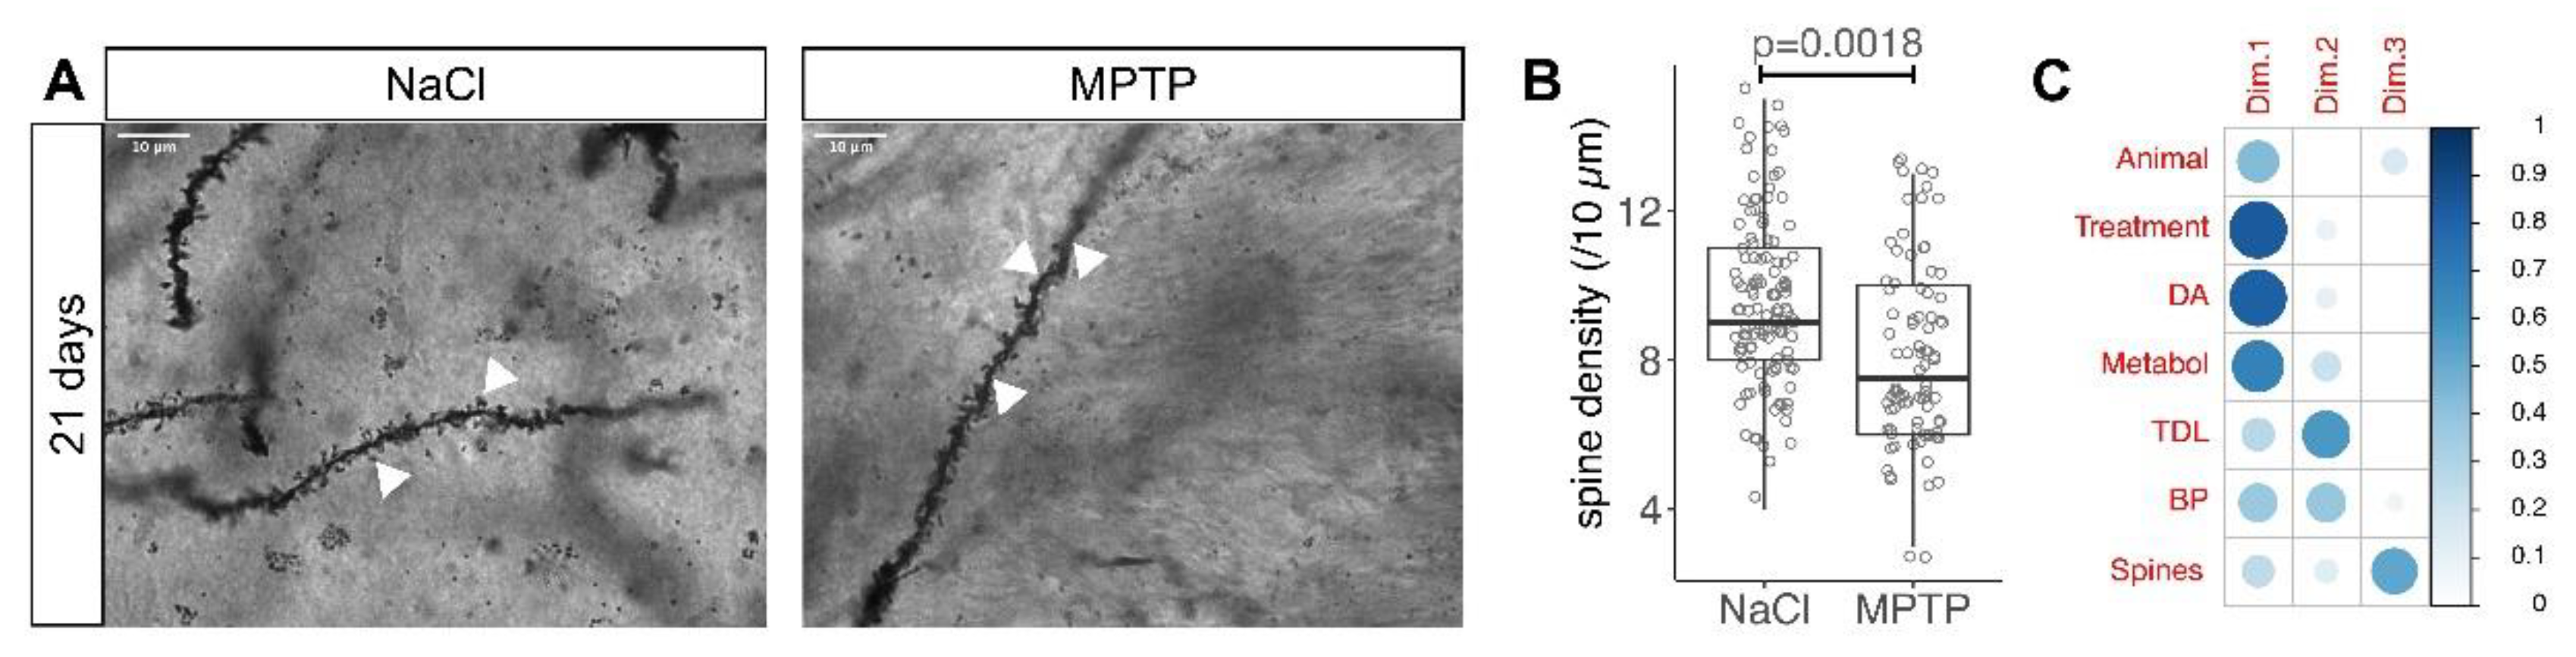
3.2. Reduced Spine Density after Dopamine Depletion
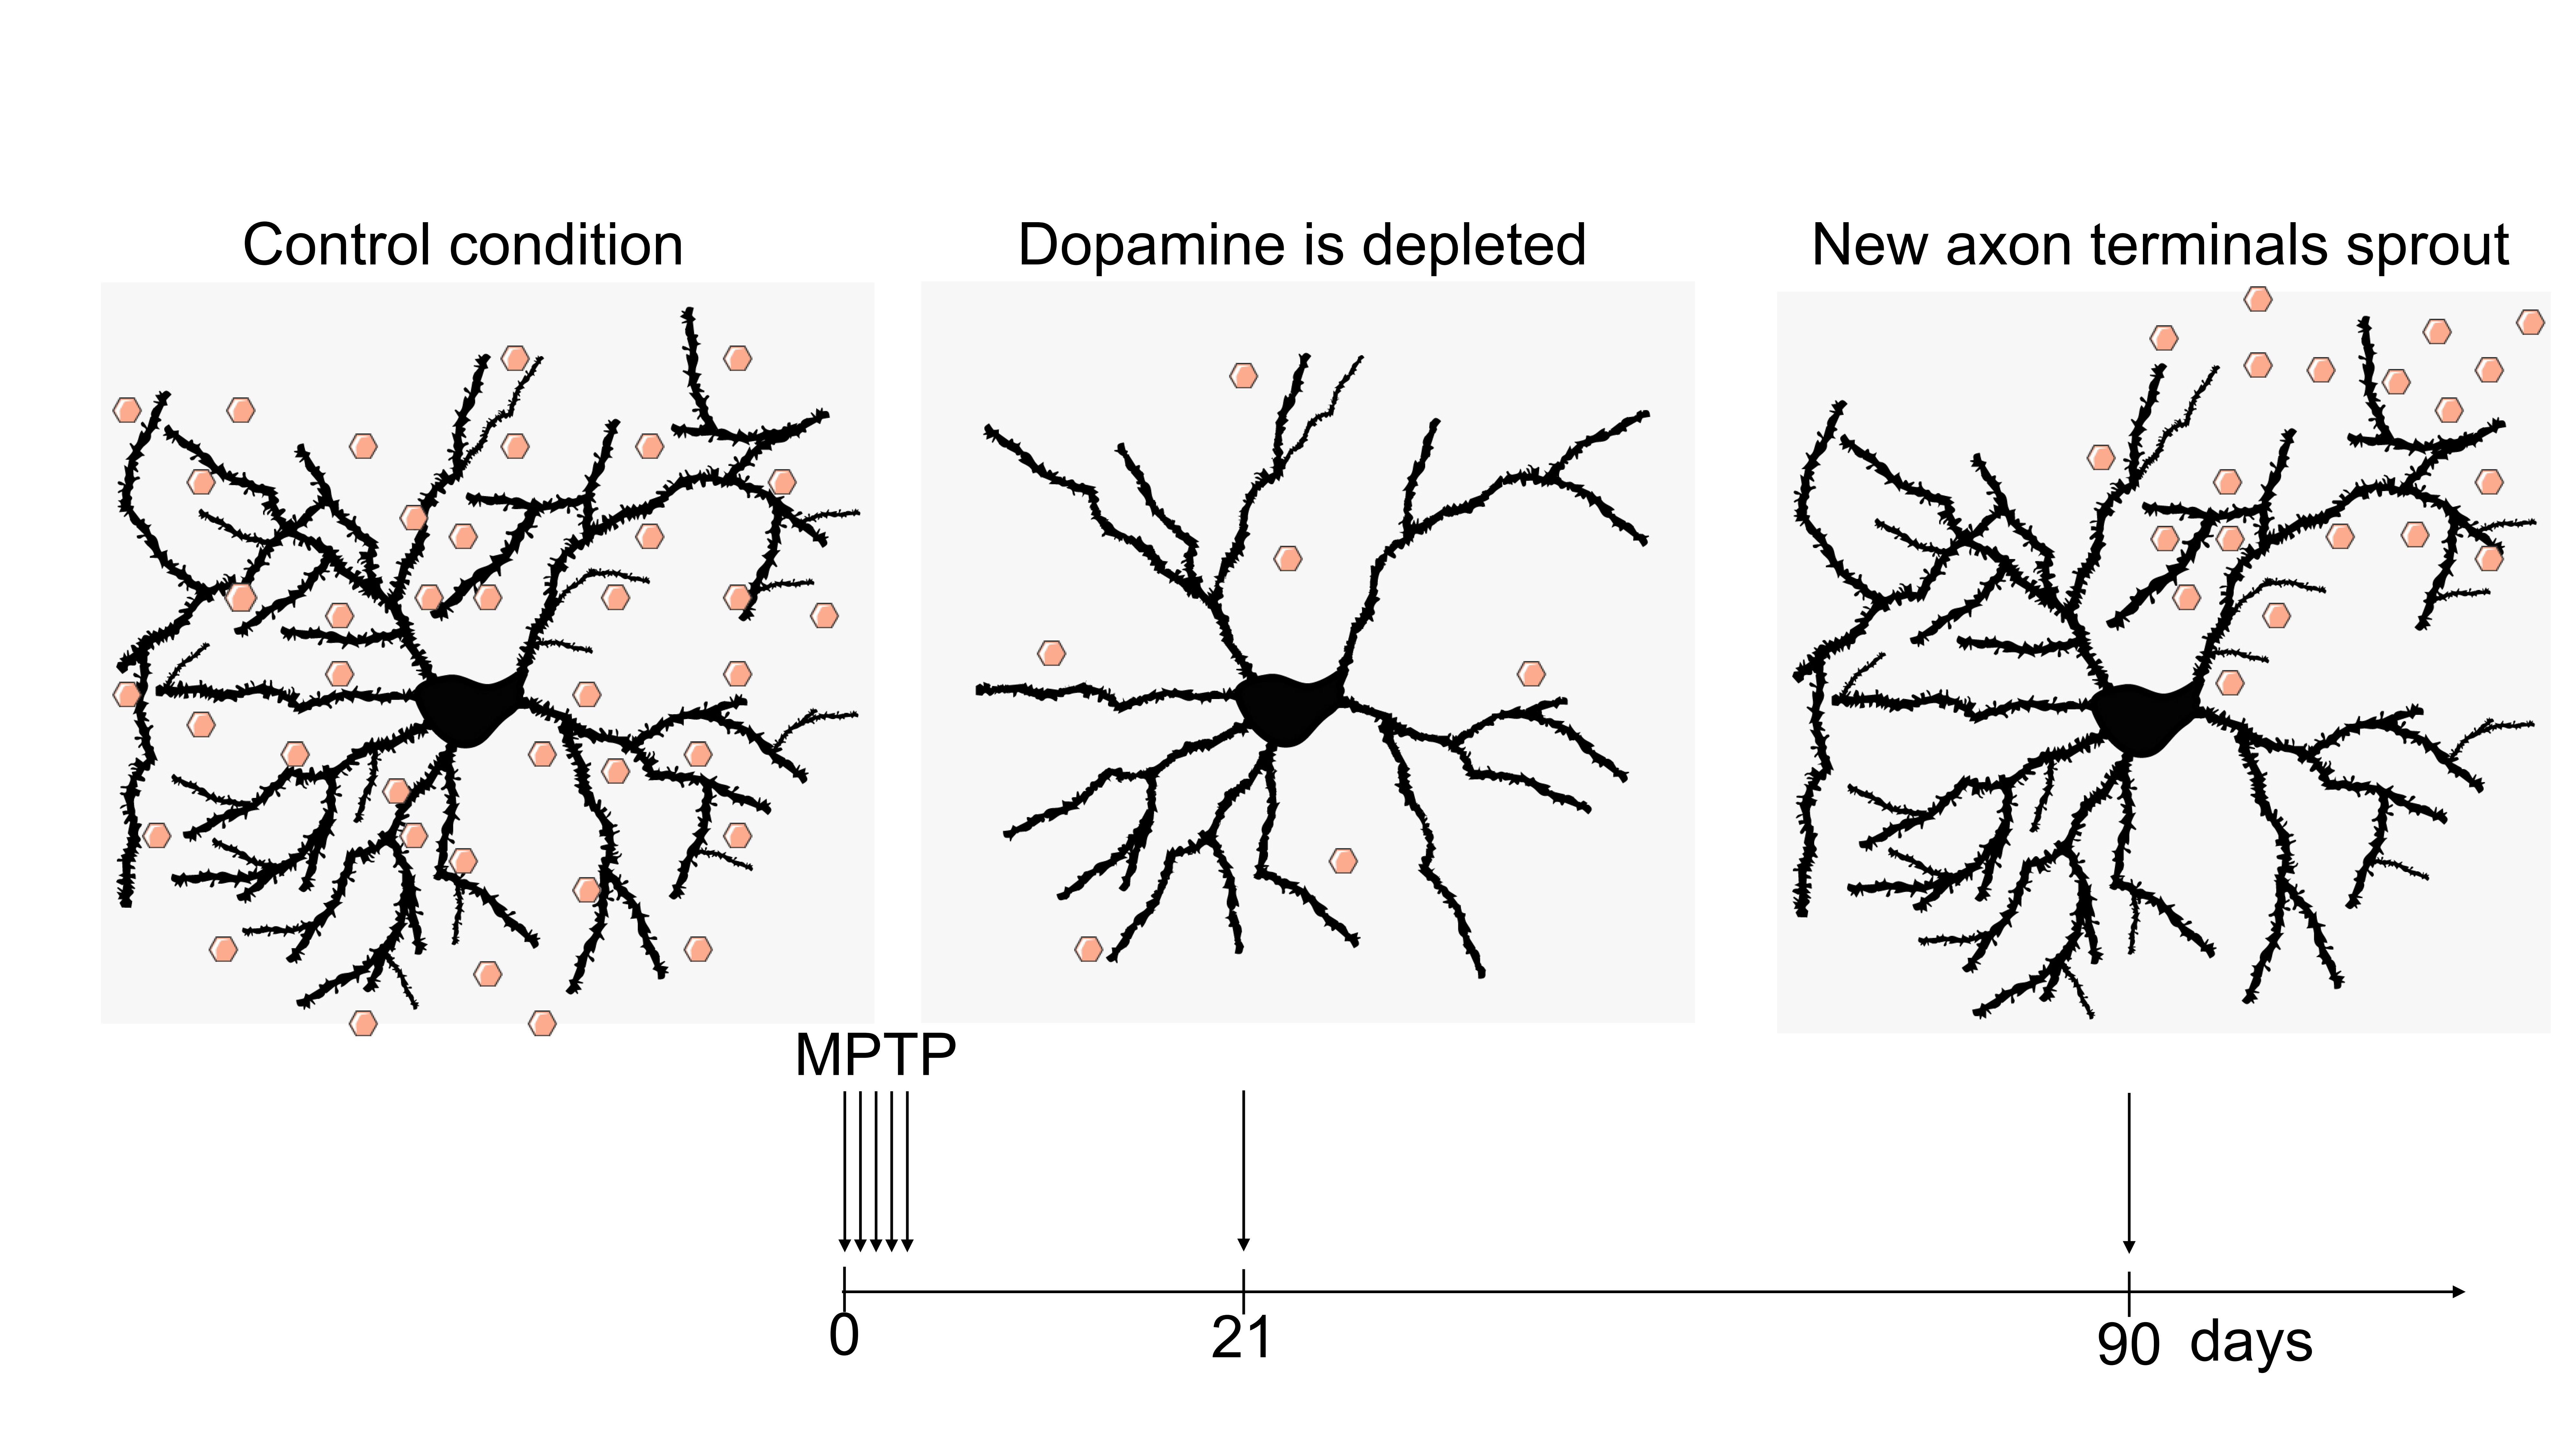
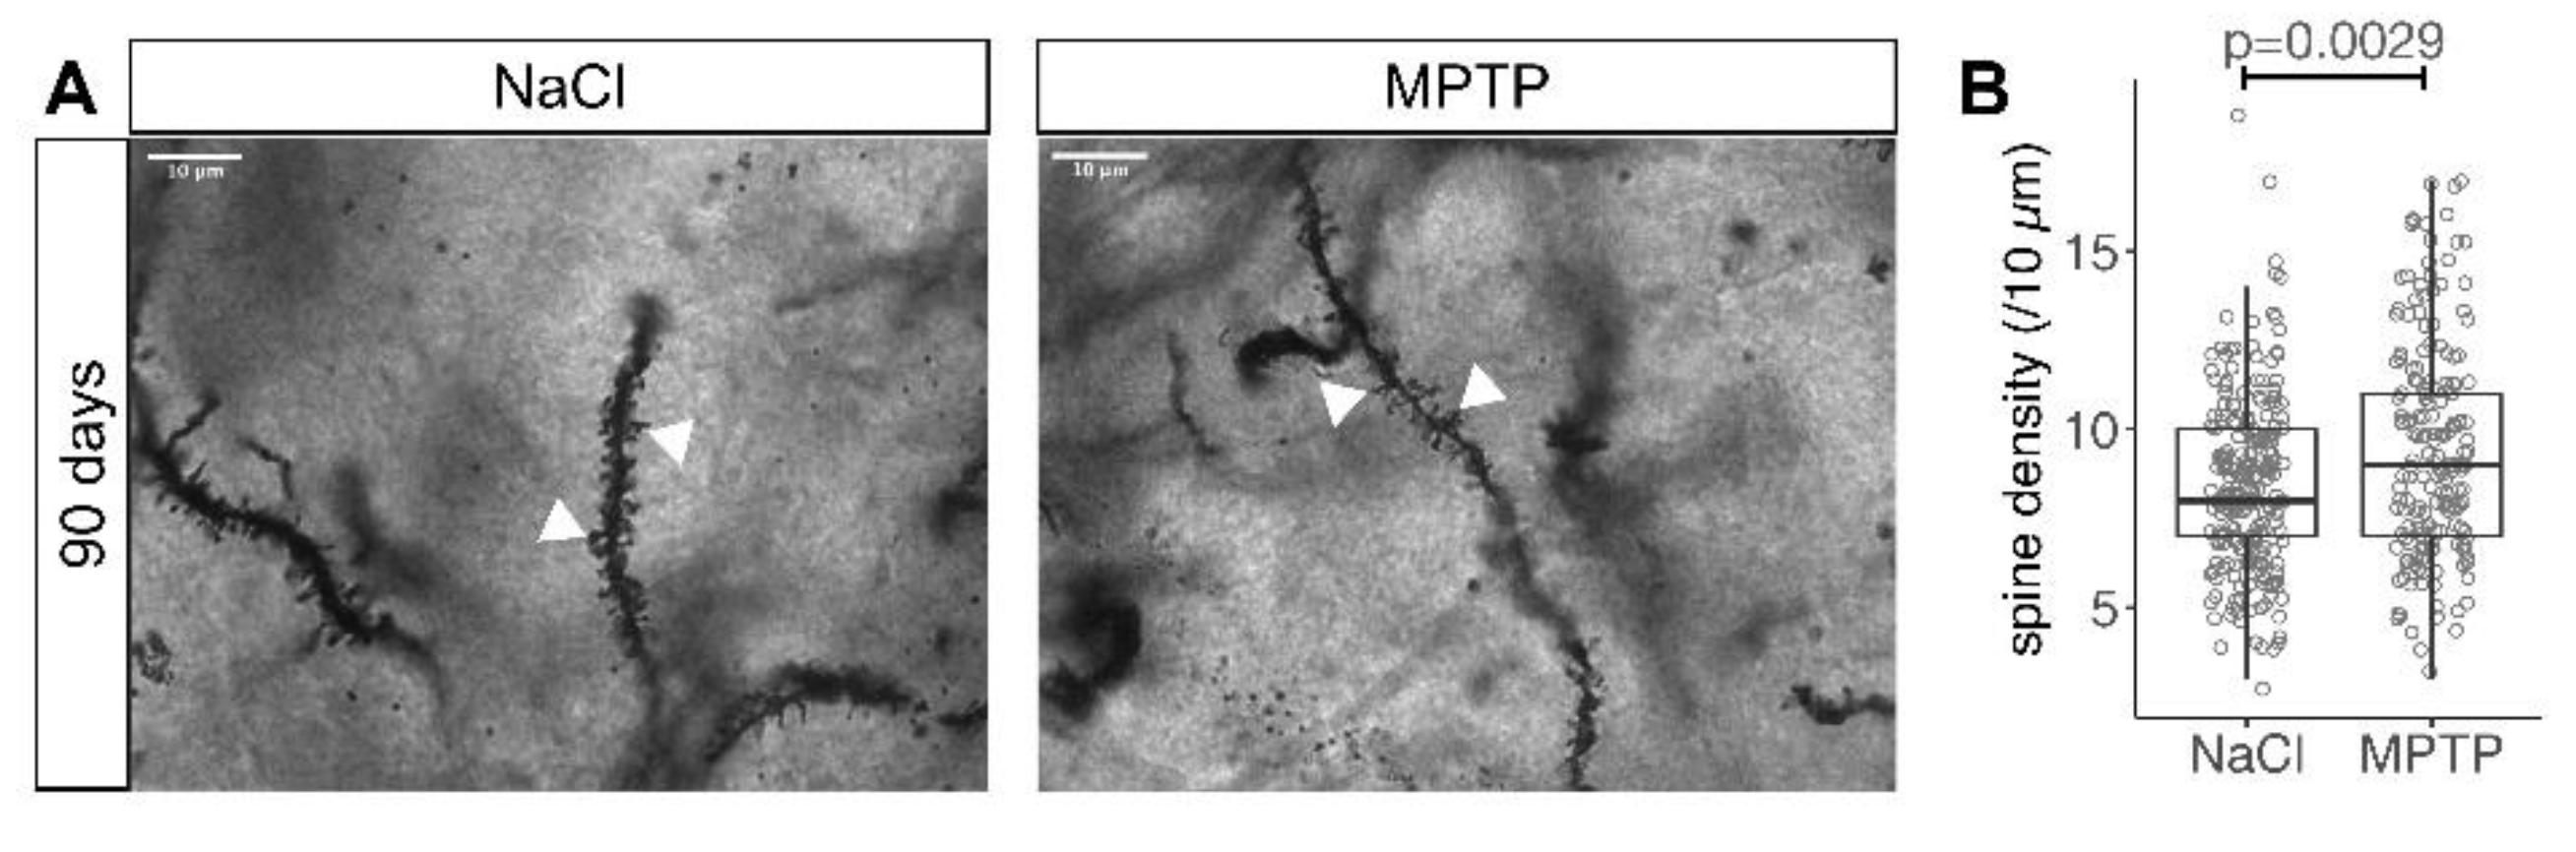
3.3. Recovery of MSN Dendritic Arborization with Axonal Sprouting
4. Discussion
Supplementary Materials
Author Contributions
Funding
Acknowledgments
Conflicts of Interest
References
- Calne, D.B.; Teychenne, P.F.; Leigh, P.N.; Bamji, A.N.; Greenacre, J.K. Treatment of parkinsonism with bromocriptine. Lancet 1974, 2, 1355–1356. [Google Scholar] [CrossRef]
- Cotzias, G.C.; Papavasiliou, P.S.; Gellene, R. Modification of Parkinsonism—Chronic Treatment with L-Dopa. N. Engl. J. Med. 2010, 280, 337–345. [Google Scholar] [CrossRef] [PubMed]
- Steece-Collier, K.; Stancati, J.A.; Collier, N.J.; Sandoval, I.M.; Mercado, N.M.; Sortwell, C.E.; Collier, T.J.; Manfredsson, F.P. Genetic silencing of striatal CaV1.3 prevents and ameliorates levodopa dyskinesia. Mov. Disord. 2019, 34, 697–707. [Google Scholar] [CrossRef] [PubMed]
- Cenci, M.A. Presynaptic mechanisms of l-DOPA-induced dyskinesia: The findings, the febate, and the therapeutic implications. Front. Neurol. 2014, 5, 242. [Google Scholar] [CrossRef] [PubMed]
- Turrigiano, G. Homeostatic synaptic plasticity: Local and global mechanisms for stabilizing neuronal function. Cold Spring Harb. Perspect. Biol. 2012, 4, a005736. [Google Scholar] [CrossRef]
- Roth-Alpermann, C.; Morris, R.G.M.; Korte, M.; Bonhoeffer, T. Homeostatic shutdown of long-term potentiation in the adult hippocampus. Proc. Natl. Acad. Sci. USA 2006, 103, 11039–11044. [Google Scholar] [CrossRef]
- Zhai, S.; Shen, W.; Graves, S.M.; Surmeier, D.J. Dopaminergic modulation of striatal function and Parkinson’s disease. J. Neural. Transm. 2019, 126, 411–422. [Google Scholar] [CrossRef]
- Smith-Dijak, A.I.; Nassrallah, W.B.; Zhang, L.Y.J.; Geva, M.; Hayden, M.R.; Raymond, L.A. Impairment and restoration of homeostatic plasticity in cultured cortical neurons from a mouse model of huntington disease. Front. Cell. Neurosci. 2019, 13, 217. [Google Scholar] [CrossRef]
- Villalba, R.M.; Lee, H.; Smith, Y. Dopaminergic denervation and spine loss in the striatum of MPTP-treated monkeys. Exp. Neurol. 2009, 215, 220–227. [Google Scholar] [CrossRef]
- Forrest, M.P.; Parnell, E.; Penzes, P. Dendritic structural plasticity and neuropsychiatric disease. Nat. Rev. Neurosci. 2018, 19, 215–234. [Google Scholar] [CrossRef]
- Nutt, J.G.; Carter, J.H.; Van Houten, L.; Woodward, W.R. Short- and long-duration responses to levodopa during the first year of levodopa therapy. Ann. Neurol. 1997, 42, 349–355. [Google Scholar] [CrossRef] [PubMed]
- Blanchet, P.J.; Lévesque, D. Time for a new slate in tardive dyskinesia research. Mov. Disord. 2020, 35, 752–755. [Google Scholar] [CrossRef]
- Toy, W.A.; Petzinger, G.M.; Leyshon, B.J.; Akopian, G.K.; Walsh, J.P.; Hoffman, M.V.; Vučković, M.G.; Jakowec, M.W. Treadmill exercise reverses dendritic spine loss in direct and indirect striatal medium spiny neurons in the 1-methyl-4-phenyl-1,2,3,6-tetrahydropyridine (MPTP) mouse model of Parkinson’s disease. Neurobiol. Dis. 2014, 63, 201–209. [Google Scholar] [CrossRef] [PubMed]
- Gagnon, D.; Petryszyn, S.; Sanchez, M.G.; Bories, C.; Beaulieu, J.M.; De Koninck, Y.; Parent, A.; Parent, M. Striatal neurons expressing D1 and D2 receptors are morphologically distinct and differently affected by dopamine denervation in mice. Sci. Rep. 2017, 7, 307. [Google Scholar] [CrossRef]
- Suarez, L.M.; Solis, O.; Caramés, J.M.; Taravini, I.R.; Solís, J.M.; Murer, M.G.; Moratalla, R. L-DOPA Treatment Selectively Restores Spine Density in Dopamine Receptor D2–Expressing Projection Neurons in Dyskinetic Mice. Biol. Psychiatry 2014, 75, 711–722. [Google Scholar] [CrossRef]
- Zhang, Y.; Meredith, G.E.; Mendoza-Elias, N.; Rademacher, D.J.; Tseng, K.Y.; Steece-Collier, K. Aberrant restoration of spines and their synapses in L-DOPA-induced dyskinesia: Involvement of corticostriatal but not thalamostriatal synapses. J. Neurosci. 2013, 33, 11655–11667. [Google Scholar] [CrossRef]
- Nishijima, H.; Ueno, T.; Funamizu, Y.; Ueno, S.; Tomiyama, M. Levodopa treatment and dendritic spine pathology. Mov. Disord. 2017, 33, 877–888. [Google Scholar] [CrossRef] [PubMed]
- Ingham, C.A.; Hood, S.H.; van Maldegem, B.; Weenink, A.; Arbuthnott, G.W. Morphological changes in the rat neostriatum after unilateral 6-hydroxydopamine injections into the nigrostriatal pathway. Exp. Brain. Res. 1993, 93, 17–27. [Google Scholar] [CrossRef]
- McNeill, T.H.; Brown, S.A.; Rafols, J.A.; Shoulson, I. Atrophy of medium spiny I striatal dendrites in advanced Parkinson’s disease. Brain Res. 1988, 455, 148–152. [Google Scholar] [CrossRef]
- Stephens, B.; Mueller, A.J.; Shering, A.F.; Hood, S.H.; Taggart, P.; Arbuthnott, G.W.; Bell, J.E.; Kilford, L.; Kingsbury, A.E.; Daniel, S.E.; et al. Evidence of a breakdown of corticostriatal connections in Parkinson’s disease. Neuroscience 2005, 132, 741–754. [Google Scholar] [CrossRef]
- Fieblinger, T.; Graves, S.M.; Sebel, L.E.; Alcacer, C.; Plotkin, J.L.; Gertler, T.S.; Chan, C.S.; Heiman, M.; Greengard, P.; Cenci, M.A.; et al. Cell type-specific plasticity of striatal projection neurons in parkinsonism and L-DOPA-induced dyskinesia. Nat. Commun. 2014, 5, 5316. [Google Scholar] [CrossRef]
- Suarez, L.M.; Alberquilla, S.; García-Montes, J.R.; Moratalla, R. Differential synaptic remodeling by dopamine in direct and indirect striatal projection neurons in Pitx3−/− Mice, a genetic model of Parkinson’s Disease. J. Neurosci. 2018, 38, 3619–3630. [Google Scholar] [CrossRef]
- Suarez, L.M.; Solis, O.; Aguado, C.; Lujan, R.; Moratalla, R. L-DOPA oppositely regulates synaptic strength and spine morphology in D1 and D2 striatal projection neurons in dyskinesia. Cereb. Cortex 2016, 26, 4253–4264. [Google Scholar] [CrossRef]
- Kowsky, S.; Pöppelmeyer, C.; Kramer, E.R.; Falkenburger, B.H.; Kruse, A.; Klein, R.; Schulz, J.B. RET signaling does not modulate MPTP toxicity but is required for regeneration of dopaminergic axon terminals. Proc. Natl. Acad. Sci. USA 2007, 104, 20049–20054. [Google Scholar] [CrossRef]
- Przedborski, S.; Jackson-Lewis, V.; Naini, A.B.; Jakowec, M.; Petzinger, G.; Miller, R.; Akram, M. The parkinsonian toxin 1-methyl-4-phenyl-1,2,3,6-tetrahydropyridine (MPTP): A technical review of its utility and safety. J. Neurochem. 2001, 76, 1265–1274. [Google Scholar] [CrossRef] [PubMed]
- Paxinos, G.; Franklin, K.B.J. Paxinos and Franklin’s the Mouse Brain in Stereotaxic Coordinates; Academic Press: Cambridge, MA, USA, 2012; ISBN 978-0-12-391057-8. [Google Scholar]
- Braak, H.; Braak, E. Neuronal types in the striatum of man. Cell Tissue Res. 1982, 227, 319–342. [Google Scholar] [CrossRef]
- Meijering, E.; Jacob, M.; Sarria, J.-C.F.; Steiner, P.; Hirling, H.; Unser, M. Design and validation of a tool for neurite tracing and analysis in fluorescence microscopy images. Cytometry 2004, 58A, 167–176. [Google Scholar] [CrossRef]
- Komnig, D.; Schulz, J.B.; Reich, A.; Falkenburger, B.H. Mice lacking Faim2 show increased cell death in the MPTP mouse model of Parkinson disease. J. Neurochem. 2016, 139, 848–857. [Google Scholar] [CrossRef]
- Zaja-Milatovic, S.; Milatovic, D.; Schantz, A.M.; Zhang, J.; Montine, K.S.; Samii, A.; Deutch, A.Y.; Montine, T.J. Dendritic degeneration in neostriatal medium spiny neurons in Parkinson disease. Neurology 2005, 64, 545–547. [Google Scholar] [CrossRef] [PubMed]
- Shen, W.; Tian, X.; Day, M.; Ulrich, S.; Tkatch, T.; Nathanson, N.M.; Surmeier, D.J. Cholinergic modulation of Kir2 channels selectively elevates dendritic excitability in striatopallidal neurons. Nat. Neurosci. 2007, 10, 1–9. [Google Scholar] [CrossRef]
- Graves, S.M.; Surmeier, D.J. Delayed spine pruning of direct pathway spiny projection neurons in a mouse model of Parkinson’s Disease. Front. Cell. Neurosci. 2019, 13, 251. [Google Scholar] [CrossRef]
- Kang, U.J.; Auinger, P. Parkinson study group ELLDOPA investigators activity enhances dopaminergic long-duration response in Parkinson disease. Neurology 2012, 78, 1146–1149. [Google Scholar] [CrossRef]
- Choi, S.H.; Kim, Y.H.; Hebisch, M.; Sliwinski, C.; Lee, S.; D’Avanzo, C.; Chen, H.; Hooli, B.; Asselin, C.; Muffat, J.; et al. A three-dimensional human neural cell culture model of Alzheimer’s disease. Nature 2014, 515, 274–278. [Google Scholar] [CrossRef]
- Papadimitriou, C.; Celikkaya, H.; Cosacak, M.I.; Mashkaryan, V.; Bray, L.; Bhattarai, P.; Brandt, K.; Hollak, H.; Chen, X.; He, S.; et al. 3D culture method for Alzheimer’s Disease modeling reveals interleukin-4 rescues Aβ42-induced loss of human neural stem cell plasticity. Dev. Cell 2018, 46, 85–101.e8. [Google Scholar] [CrossRef]
- Kocsis, J.D.; Kitai, S.T. Dual excitatory inputs to caudate spiny neurons from substantia nigra stimulation. Brain Res. 1977, 138, 271–283. [Google Scholar] [CrossRef]
- Broussard, J.I. Co-transmission of dopamine and glutamate. J. Gen. Physiol. 2012, 139, 93–96. [Google Scholar] [CrossRef]
- Garcia, B.G.; Neely, M.D.; Deutch, A.Y. Cortical regulation of striatal medium spiny neuron dendritic remodeling in parkinsonism: Modulation of glutamate release reverses dopamine depletion–induced dendritic spine loss. Cereb. Cortex 2010, 20, 2423–2432. [Google Scholar] [CrossRef]


| Treatment | Days after Treatment | Mice 1 | SN 2 | HPLC 3 | Golgi 4 | MSN 5 | Spine Density 6 |
|---|---|---|---|---|---|---|---|
| NaCl | 21 | 6 | 6 | 6 | 5 | 118 | 116 |
| MPTP | 21 | 6 | 6 | 6 | 4 | 95 | 85 |
| NaCl | 90 | 10 | 10 | 10 | 10 | 240 | 235 |
| MPTP | 90 | 10 | 9 | 9 | 8 | 192 | 182 |
| # | Response | Predictors | p Values 1 | ||
|---|---|---|---|---|---|
| First | Second | First | Second | ||
| 1 | TDL | Treatment | DA | 3.362e−4 | n.s. |
| 2 | BP | Treatment | DA | 2.258e−5 | n.s. |
| 3 | SL | Treatment | DA | 5.357e−3 | n.s. |
| 4 | TDL | DA | Treatment | 2.711e−3 | 3.7215e−2 |
| 5 | BP | DA | Treatment | 1.494e−4 | 6.3311e−3 |
| 6 | SL | DA | Treatment | 9.064e−3 | n.s. |
| 7 | TDL | BP | Treatment | <2e−16 | n.s. |
| 8 | BP | TDL | Treatment | <2e−16 | 4.168e−3 |
| 9 | TDL | Treatment | BP | 1.187e−6 | <2e−16 |
| 10 | spines | Treatment | DA | 5.948e−6 | n.s. |
| 11 | spines | DA | Treatment | 8.435e−4 | 3.245e−4 |
| 12 | spines | TDL | BP | 2.196e−9 | n.s. |
| 13 | spines | BP | TDL | 3.188e−6 | 6.618e−5 |
| 14 | spines | BP + TDL | Treatment | 4.139e−5 | 4.852e−4 |
| # | Group | Response | Predictors | p Values | ||
|---|---|---|---|---|---|---|
| First | Second | First | Second | |||
| 1 | all 90d | spines | Treatment | DA | 2.891e−4 | 3.43835e−2 |
| 2 | all 90d | spines | DA | Treatment | 1.223e−4 | n.s. |
| 3 | MPTP only | spines | TH | DA | 3.5920e−3 | 1.599e−4 |
| 4 | MPTP only | spines | DA | TH | 3.022e−6 | n.s. |
| 5 | MPTP only | TDL | TH | DA | 2.826e−3 | 1.302e−3 |
| 6 | MPTP only | TDL | DA | TH | n.s. | 3.174e−5 |
Publisher’s Note: MDPI stays neutral with regard to jurisdictional claims in published maps and institutional affiliations. |
© 2020 by the authors. Licensee MDPI, Basel, Switzerland. This article is an open access article distributed under the terms and conditions of the Creative Commons Attribution (CC BY) license (http://creativecommons.org/licenses/by/4.0/).
Share and Cite
Witzig, V.S.; Komnig, D.; Falkenburger, B.H. Changes in Striatal Medium Spiny Neuron Morphology Resulting from Dopamine Depletion Are Reversible. Cells 2020, 9, 2441. https://doi.org/10.3390/cells9112441
Witzig VS, Komnig D, Falkenburger BH. Changes in Striatal Medium Spiny Neuron Morphology Resulting from Dopamine Depletion Are Reversible. Cells. 2020; 9(11):2441. https://doi.org/10.3390/cells9112441
Chicago/Turabian StyleWitzig, Victoria Sofie, Daniel Komnig, and Björn H. Falkenburger. 2020. "Changes in Striatal Medium Spiny Neuron Morphology Resulting from Dopamine Depletion Are Reversible" Cells 9, no. 11: 2441. https://doi.org/10.3390/cells9112441
APA StyleWitzig, V. S., Komnig, D., & Falkenburger, B. H. (2020). Changes in Striatal Medium Spiny Neuron Morphology Resulting from Dopamine Depletion Are Reversible. Cells, 9(11), 2441. https://doi.org/10.3390/cells9112441