On the Anti-Cancer Effect of Cold Atmospheric Plasma and the Possible Role of Catalase-Dependent Apoptotic Pathways


Abstract
1. Introduction
- Higher influx of hydrogen peroxide due to a higher density of aquaporins in the cell membrane of cancer cells [47].
2. Anti-Cancer Effect of CAP by Reactivation of Catalase-Dependent Apoptotic Pathways
- Generation of extracellular superoxide anions.
- Membrane-associated catalase.
2.1. Apoptosis-Inducing Signaling Pathways Originating from Superoxide Anions
2.2. The Protective Role of Catalase
2.3. Effect of CAP on Cancer Cells
3. The Mathematical Model
3.1. Construction of the Mathematical Model
3.2. Reaction Network
3.3. Rate Equations
4. Numerical Details
4.1. Parameter Values
4.2. Software and Details about the Calculations
5. Results and Discussion
5.1. Revealing the Dominant Pathway for Hydroxyl Radical Generation
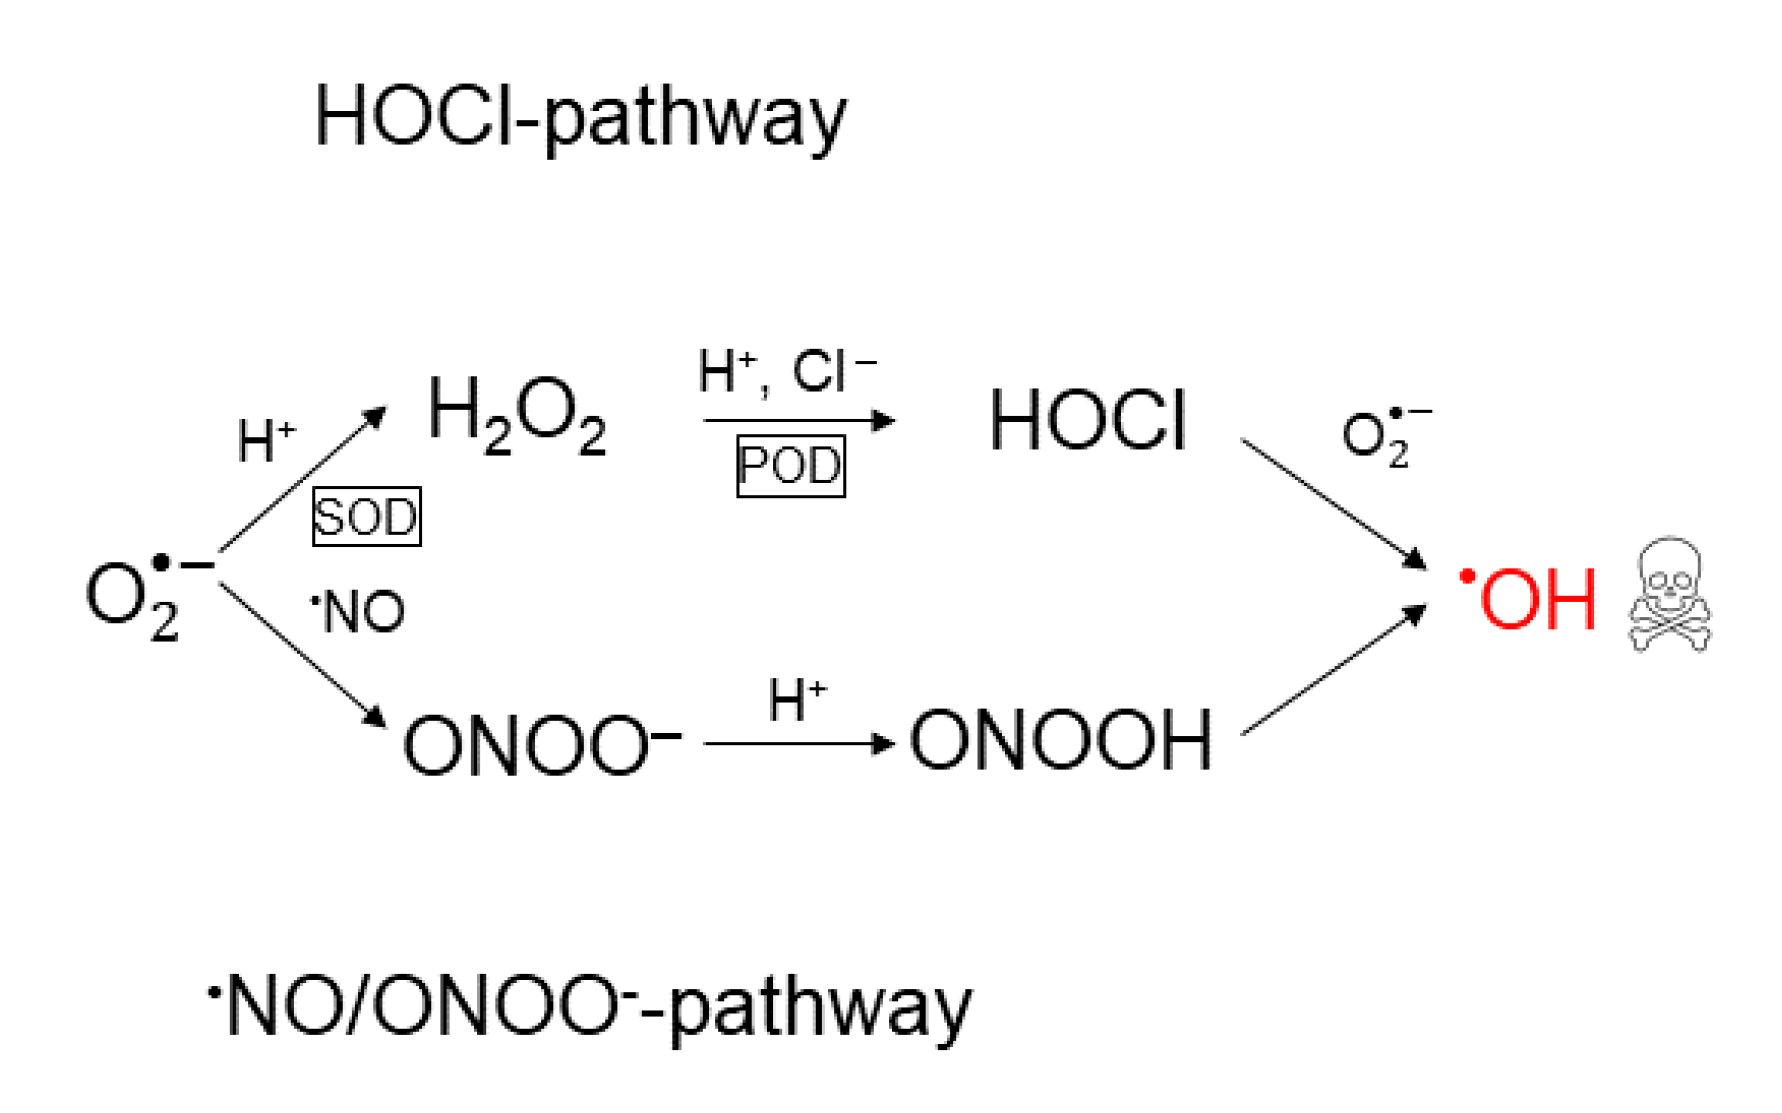
- The nitric oxide/peroxynitrite pathway regime occurs for
- The combined pathway regime occurs for.
- The hypochlorous acid pathway regime occurs for
5.2. The Catalase-Dependence of the Hydroxyl Radical Generation in the Nitric Oxide/Peroxynitrite Pathway
- Two orders of magnitude reduction of.
- Three orders of magnitude reduction of.
- The maximal concentration of hydroxyl radicals generated from this pathway (i.e., when it is fully reactivated, see Figure 4 at), is four order of magnitudes lower than the concentration required to induce apoptosis when hydroxyl radicals are added externally ([105,106]). Thus, it seems unlikely that this pathway will account for the anti-cancer effect of CAP.
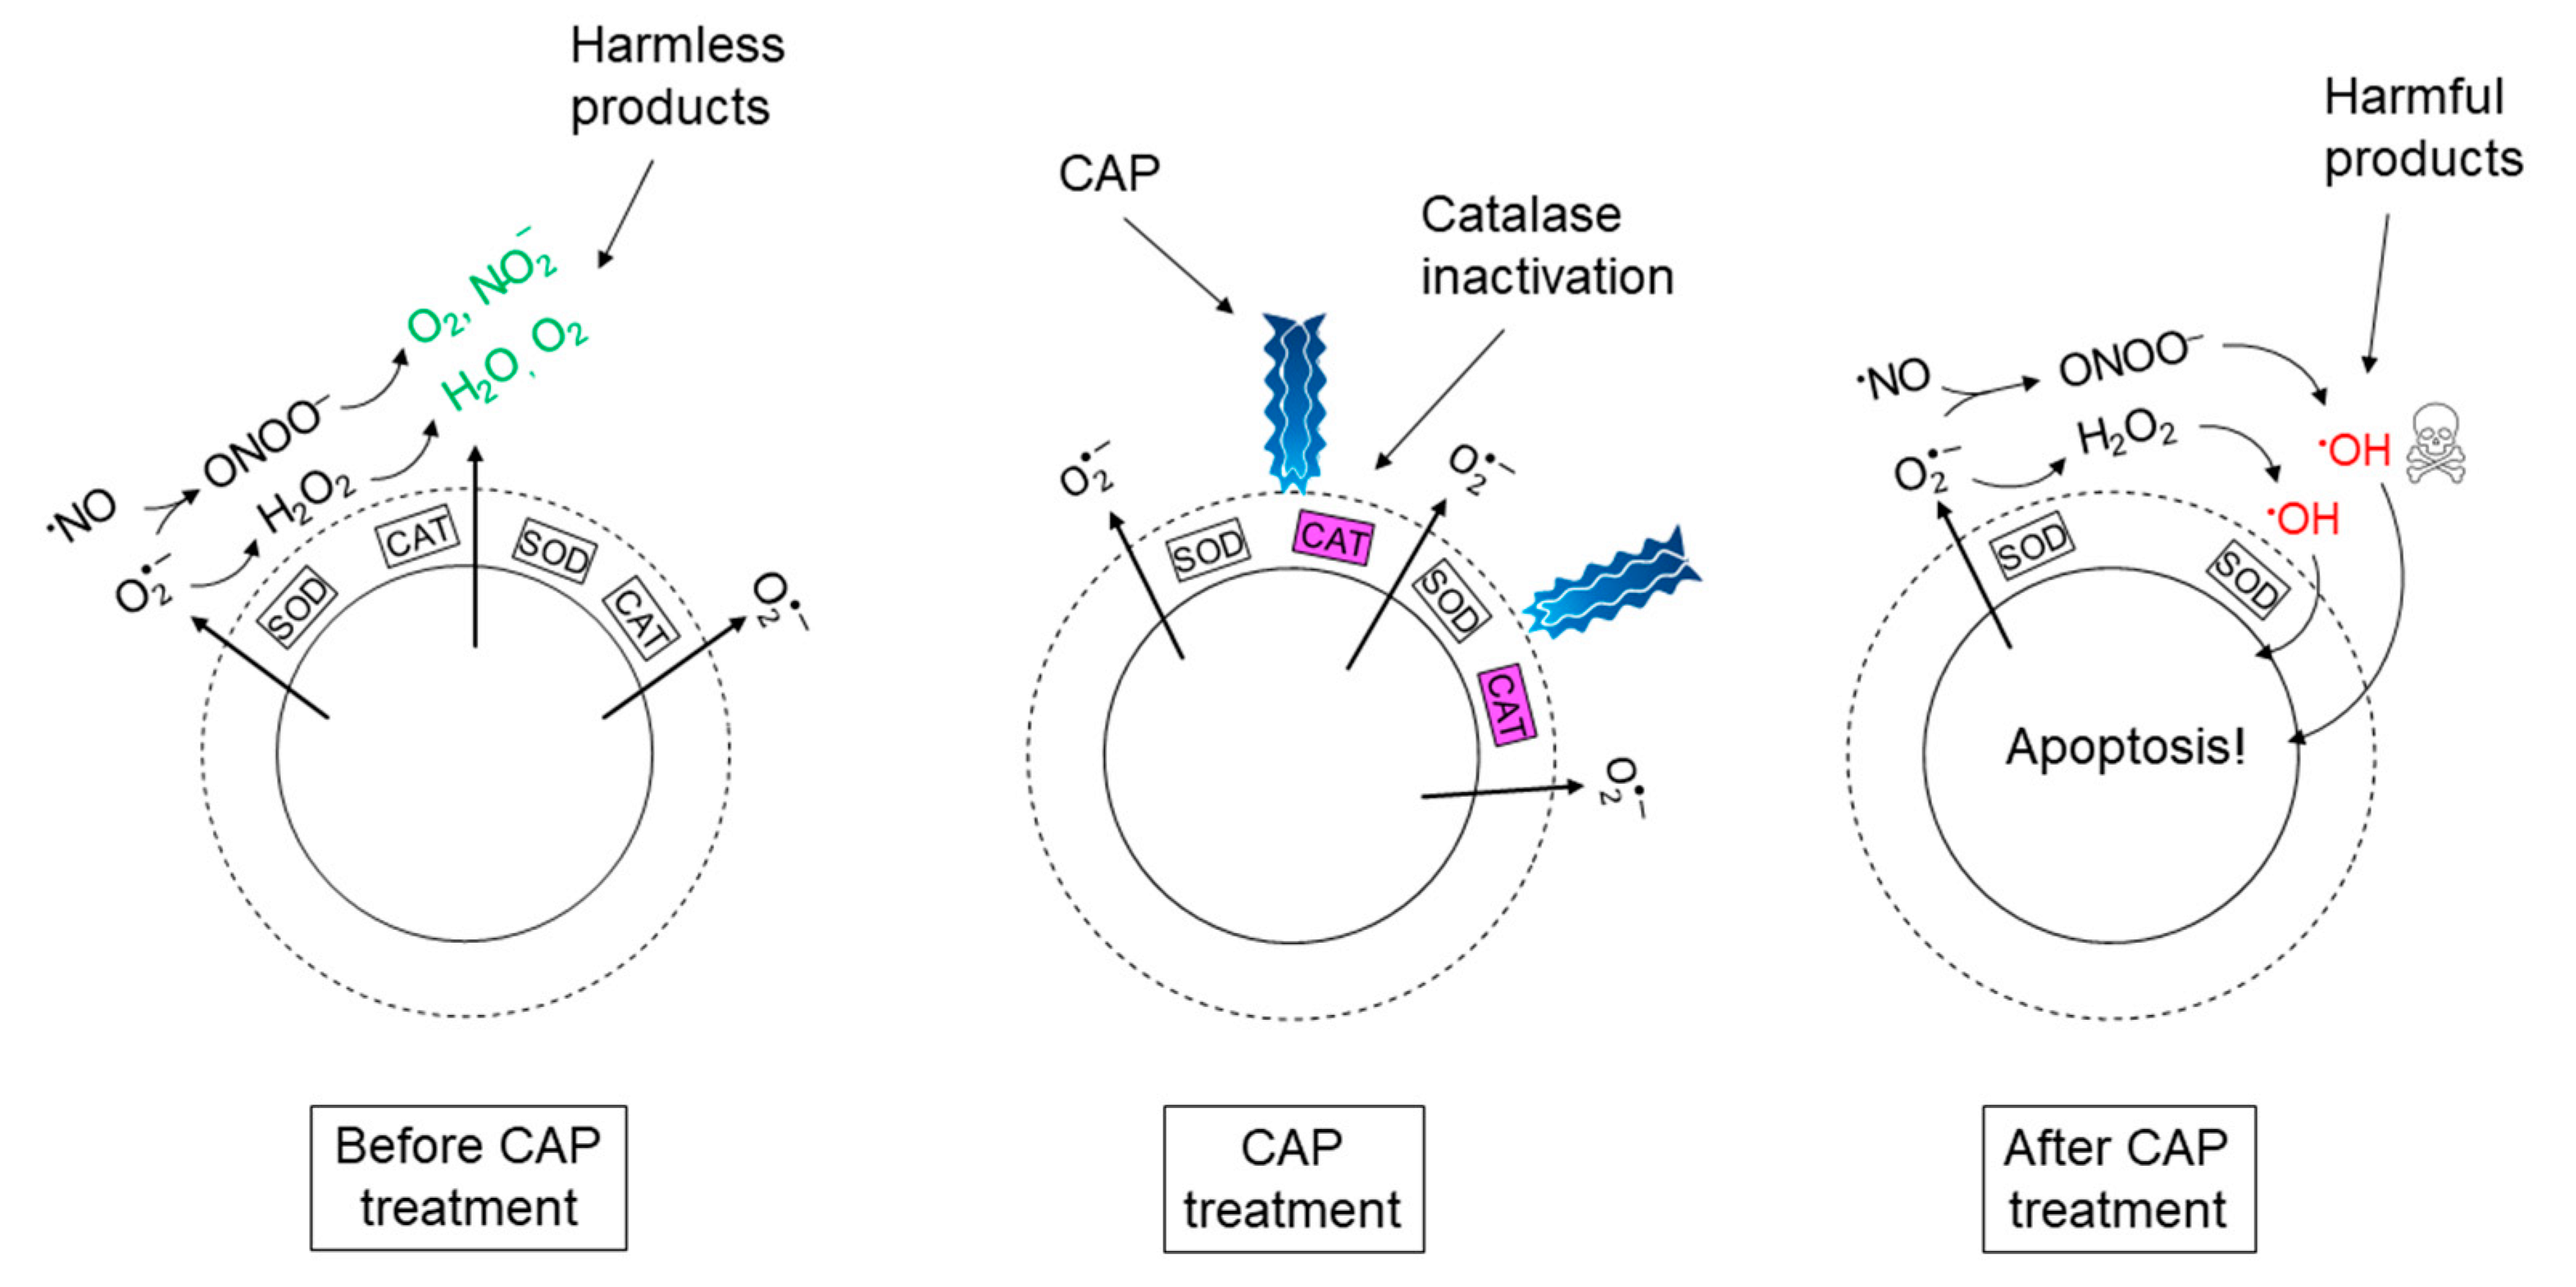
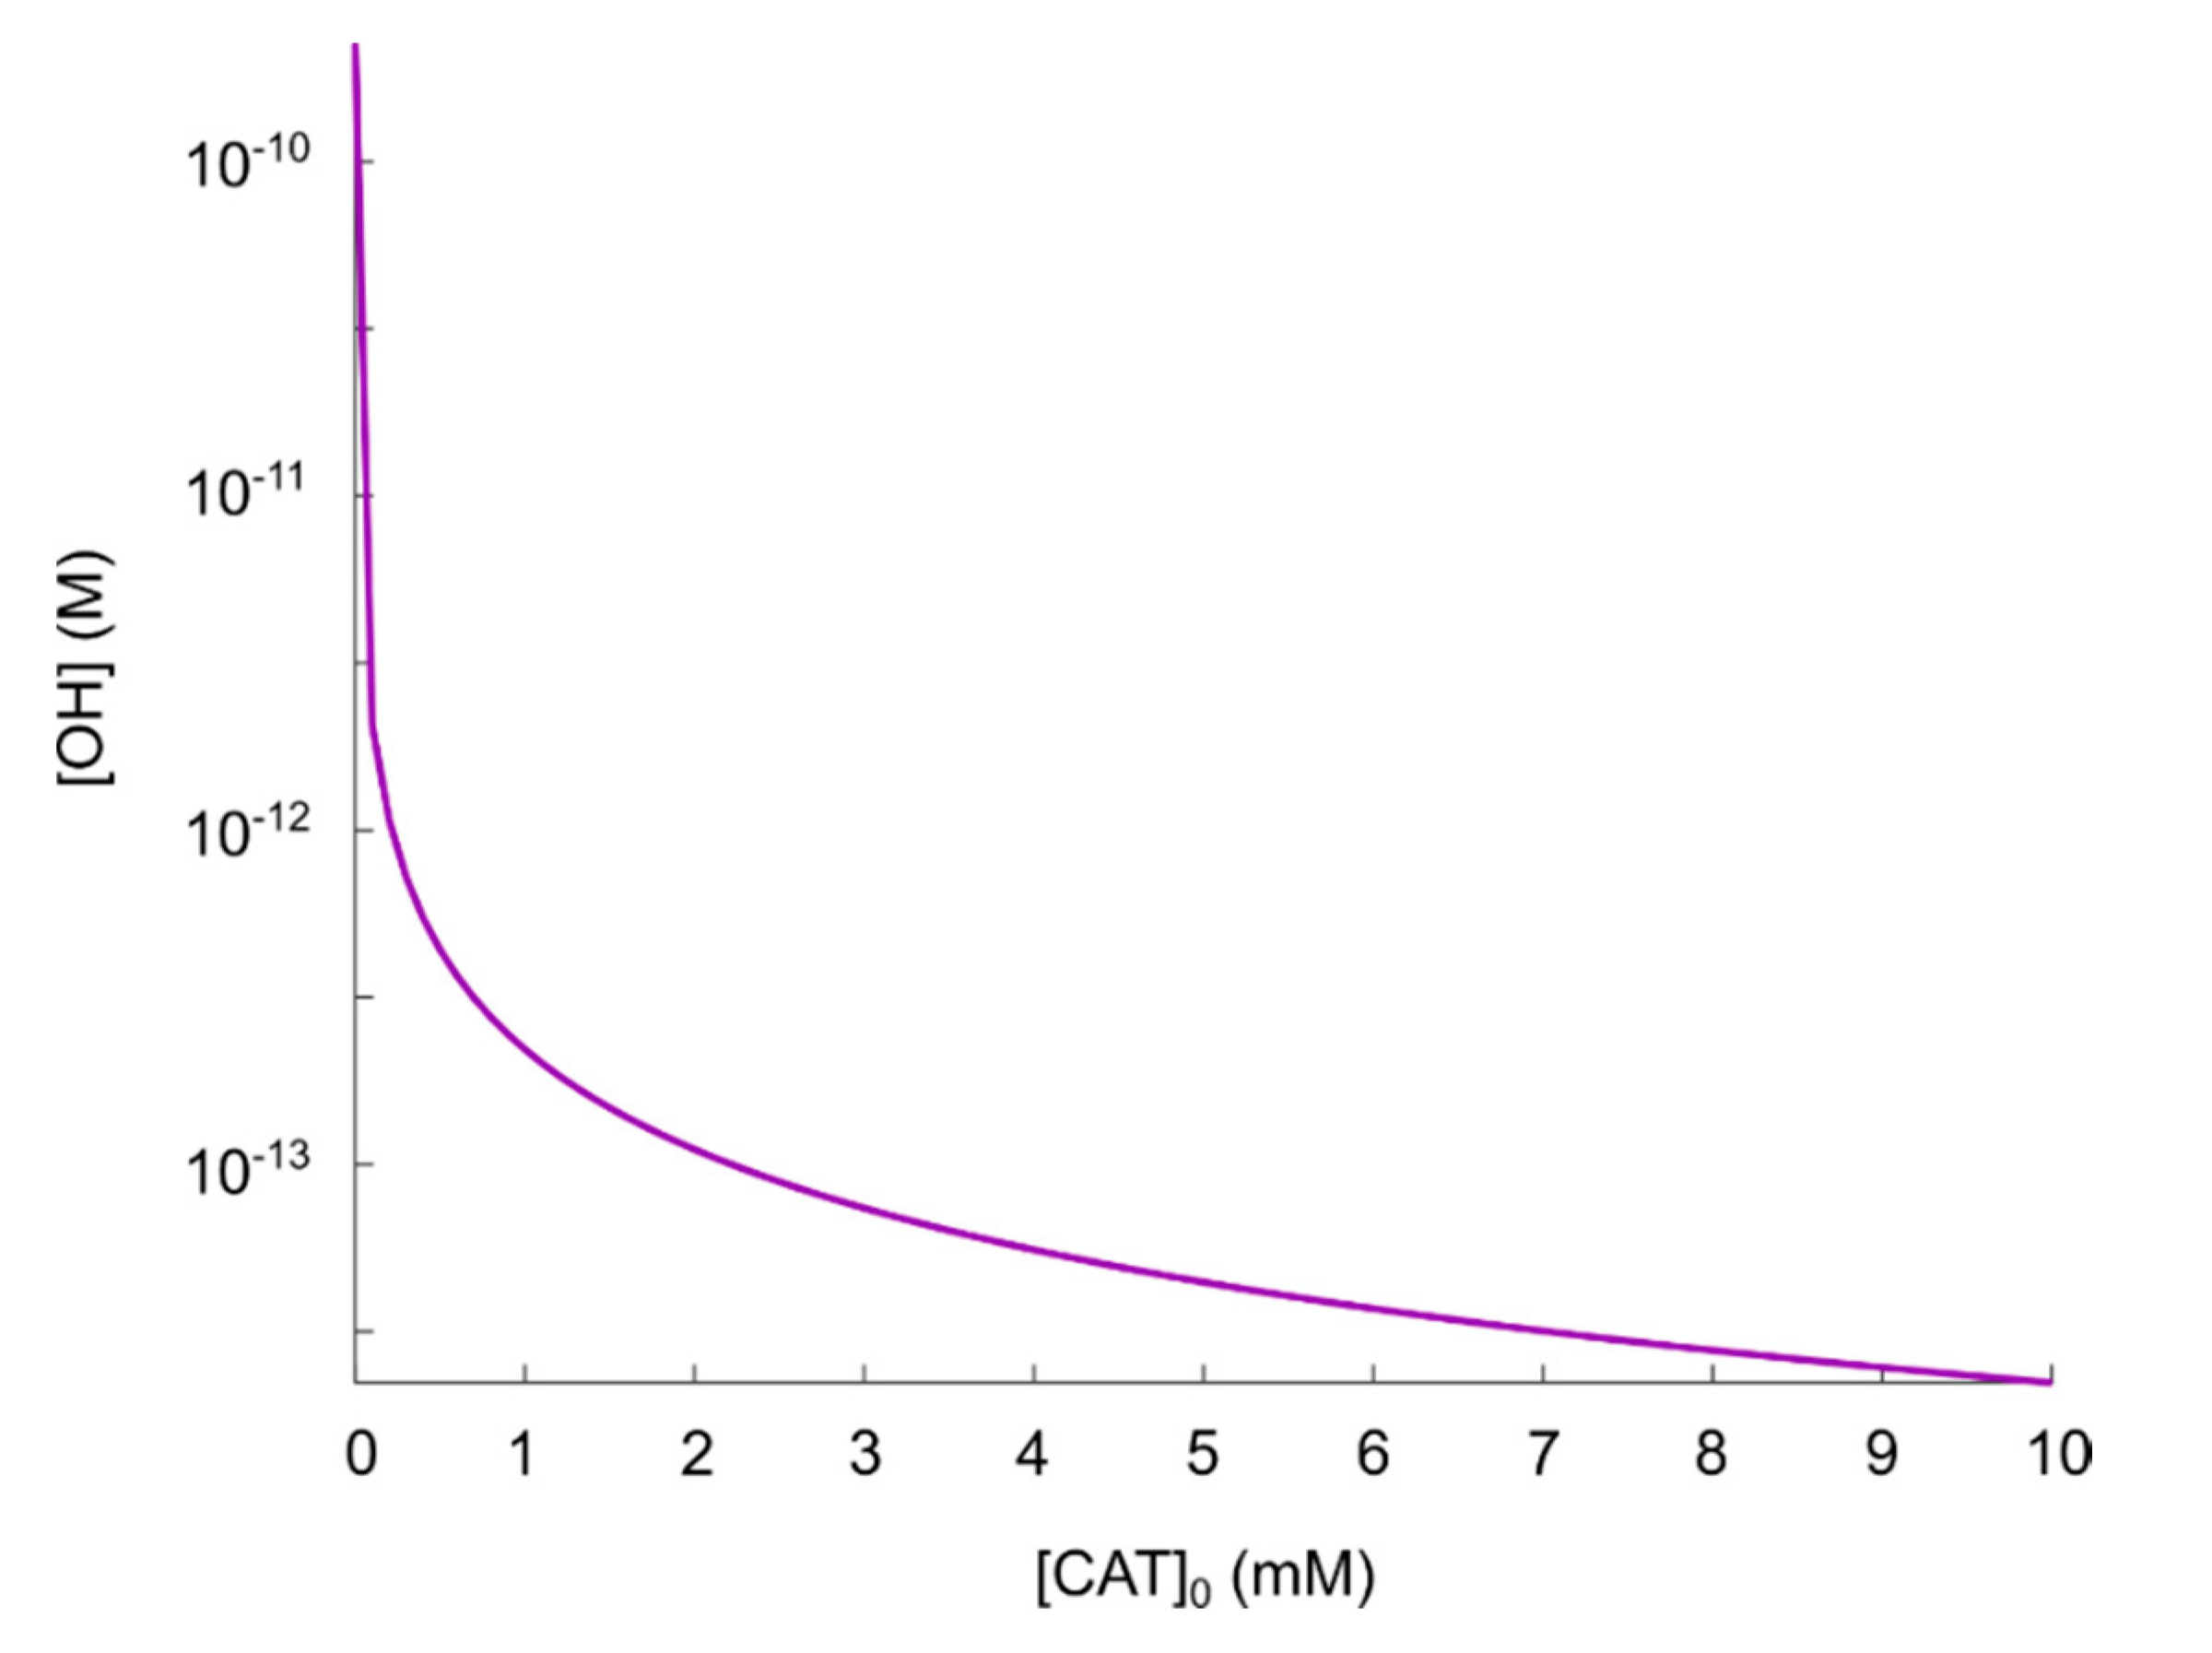
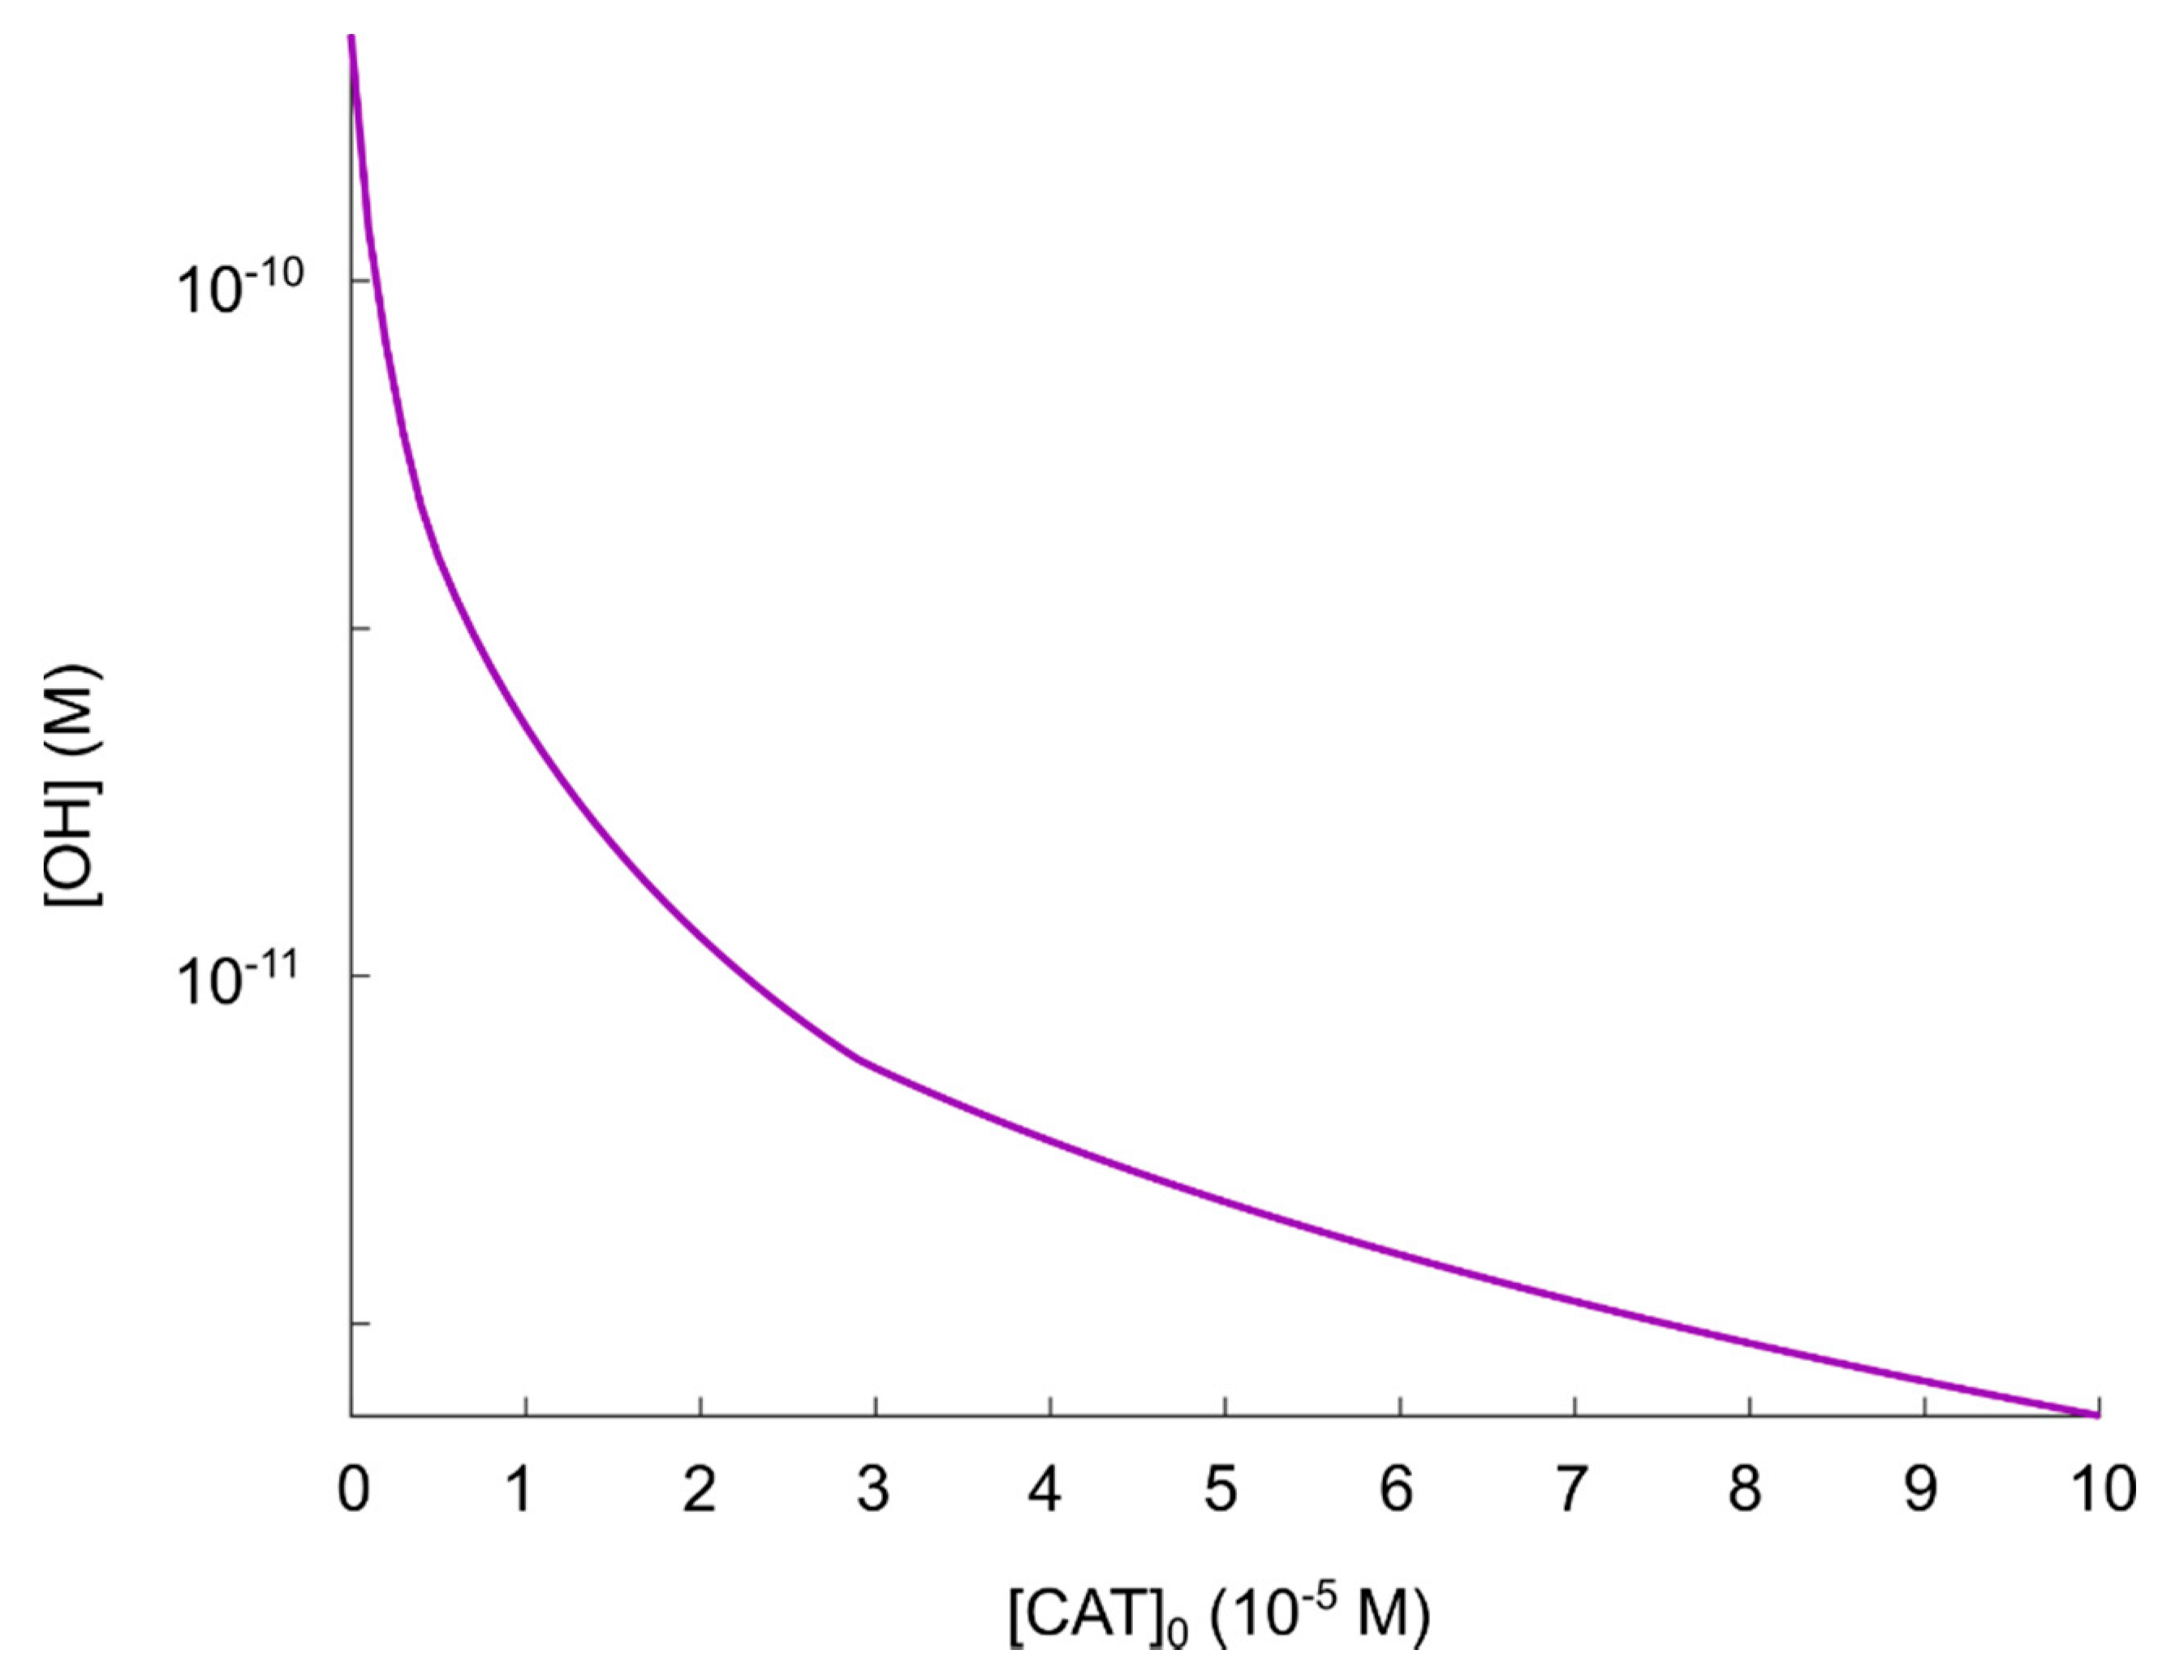
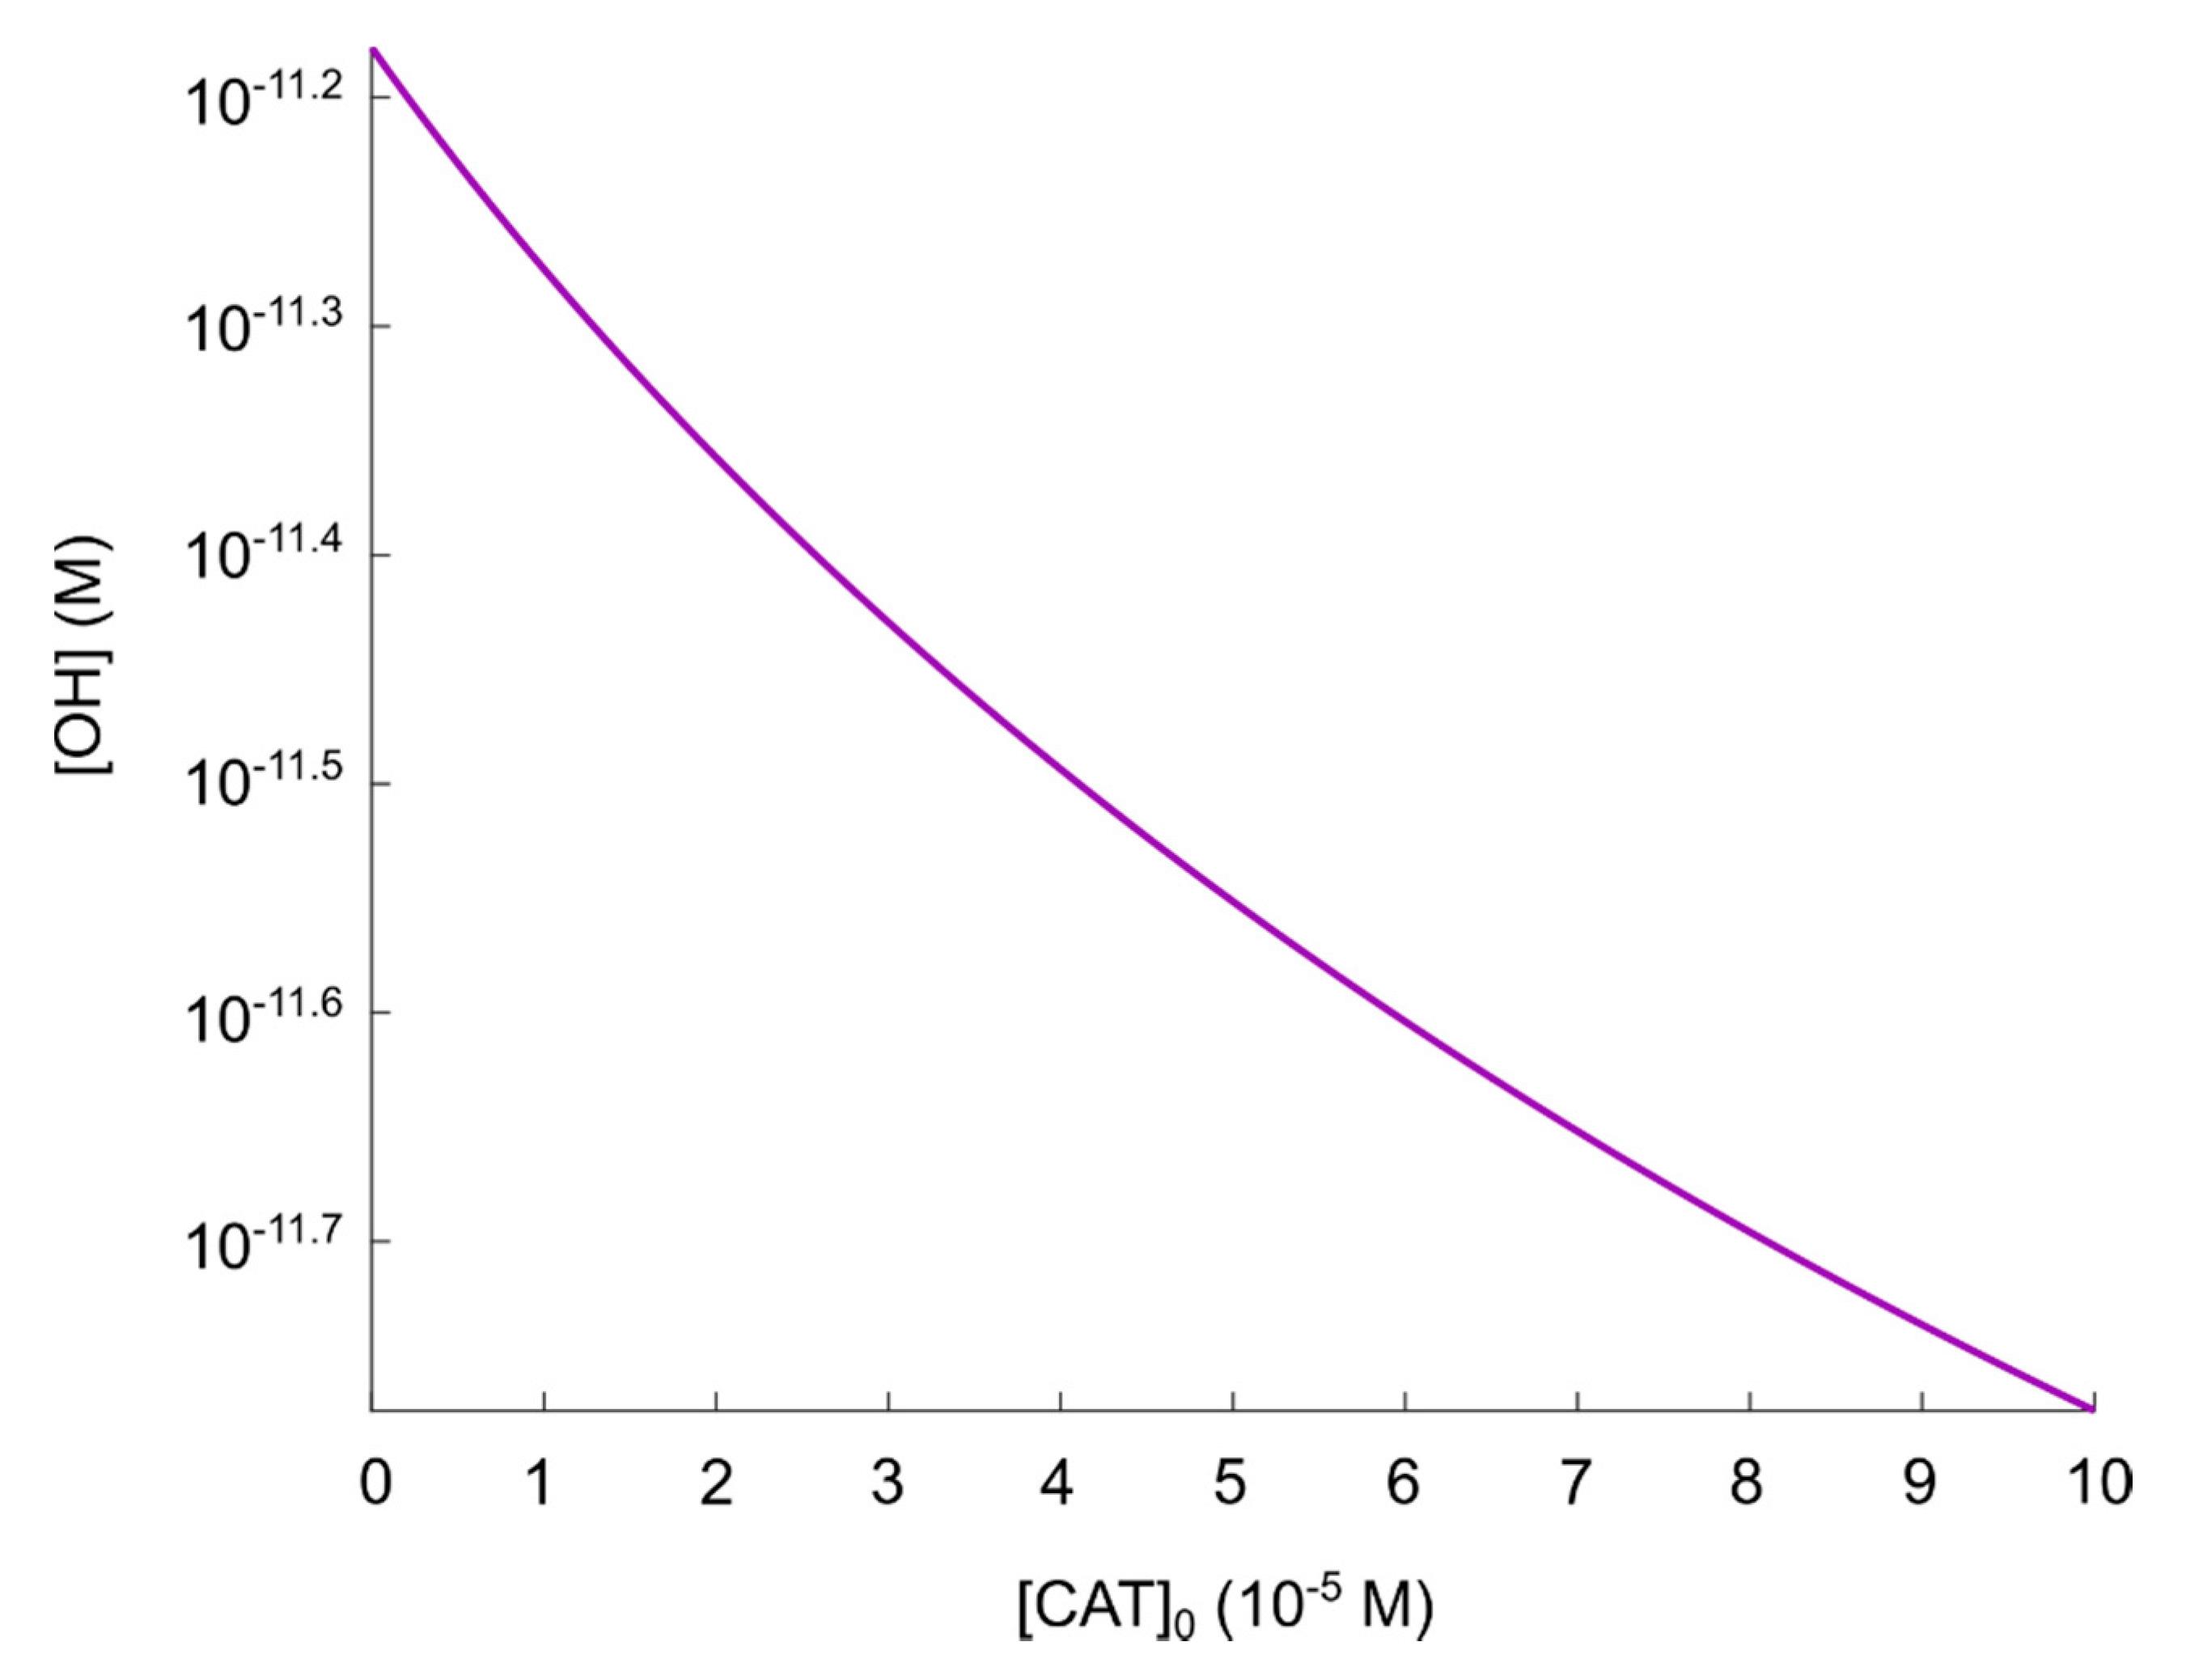
- If it is assumed that the amount of generated hydroxyl radicals from the fully reactivated nitric oxide/peroxynitrite pathway still is sufficient to cause apoptosis-induction, the level of protection of different catalase concentrations can be analyzed. From the resulting plot (see Figure 4) of the hydroxyl radical concentrations for various catalase concentrations (spanning from zero to the physically maximum amount of catalase), we conclude thatseem to be a reasonable assumption of the amount of catalase required to protect from hydroxyl radical generation. This is because this catalase concentration reduces the amount of generated hydroxyl radicals by approximately two orders of magnitude compared to a fully reactivated pathways (i.e., when), see Figure 4. For, on the other hand, the additional protection of an increased catalase concentration is less profound. In Figure 4 it can indeed be seen that in this regime, the slope of the curve is significantly less than for.
- If it is assumed that does protect the cancer cells sufficiently well from apoptosis-induction by hydroxyl radicals, it can be seen in Figure 4 and Figure 5 that a massive decrease of the catalase concentration is required in order to reactivate the hydroxyl radical generation. Indeed, aboutof the catalase has to be inactivated in order to increase the concentration of hydroxyl radicals with one order of magnitude. This is due to the nonlinear behavior of the kinetics of the nitric oxide/peroxynitrite pathway; the resulting hydroxyl radical generation is very sensitive in the regimeand thus, a small difference in the input (i.e., the catalase concentration) causes a large difference in the output (i.e., the hydroxyl radical concentration).
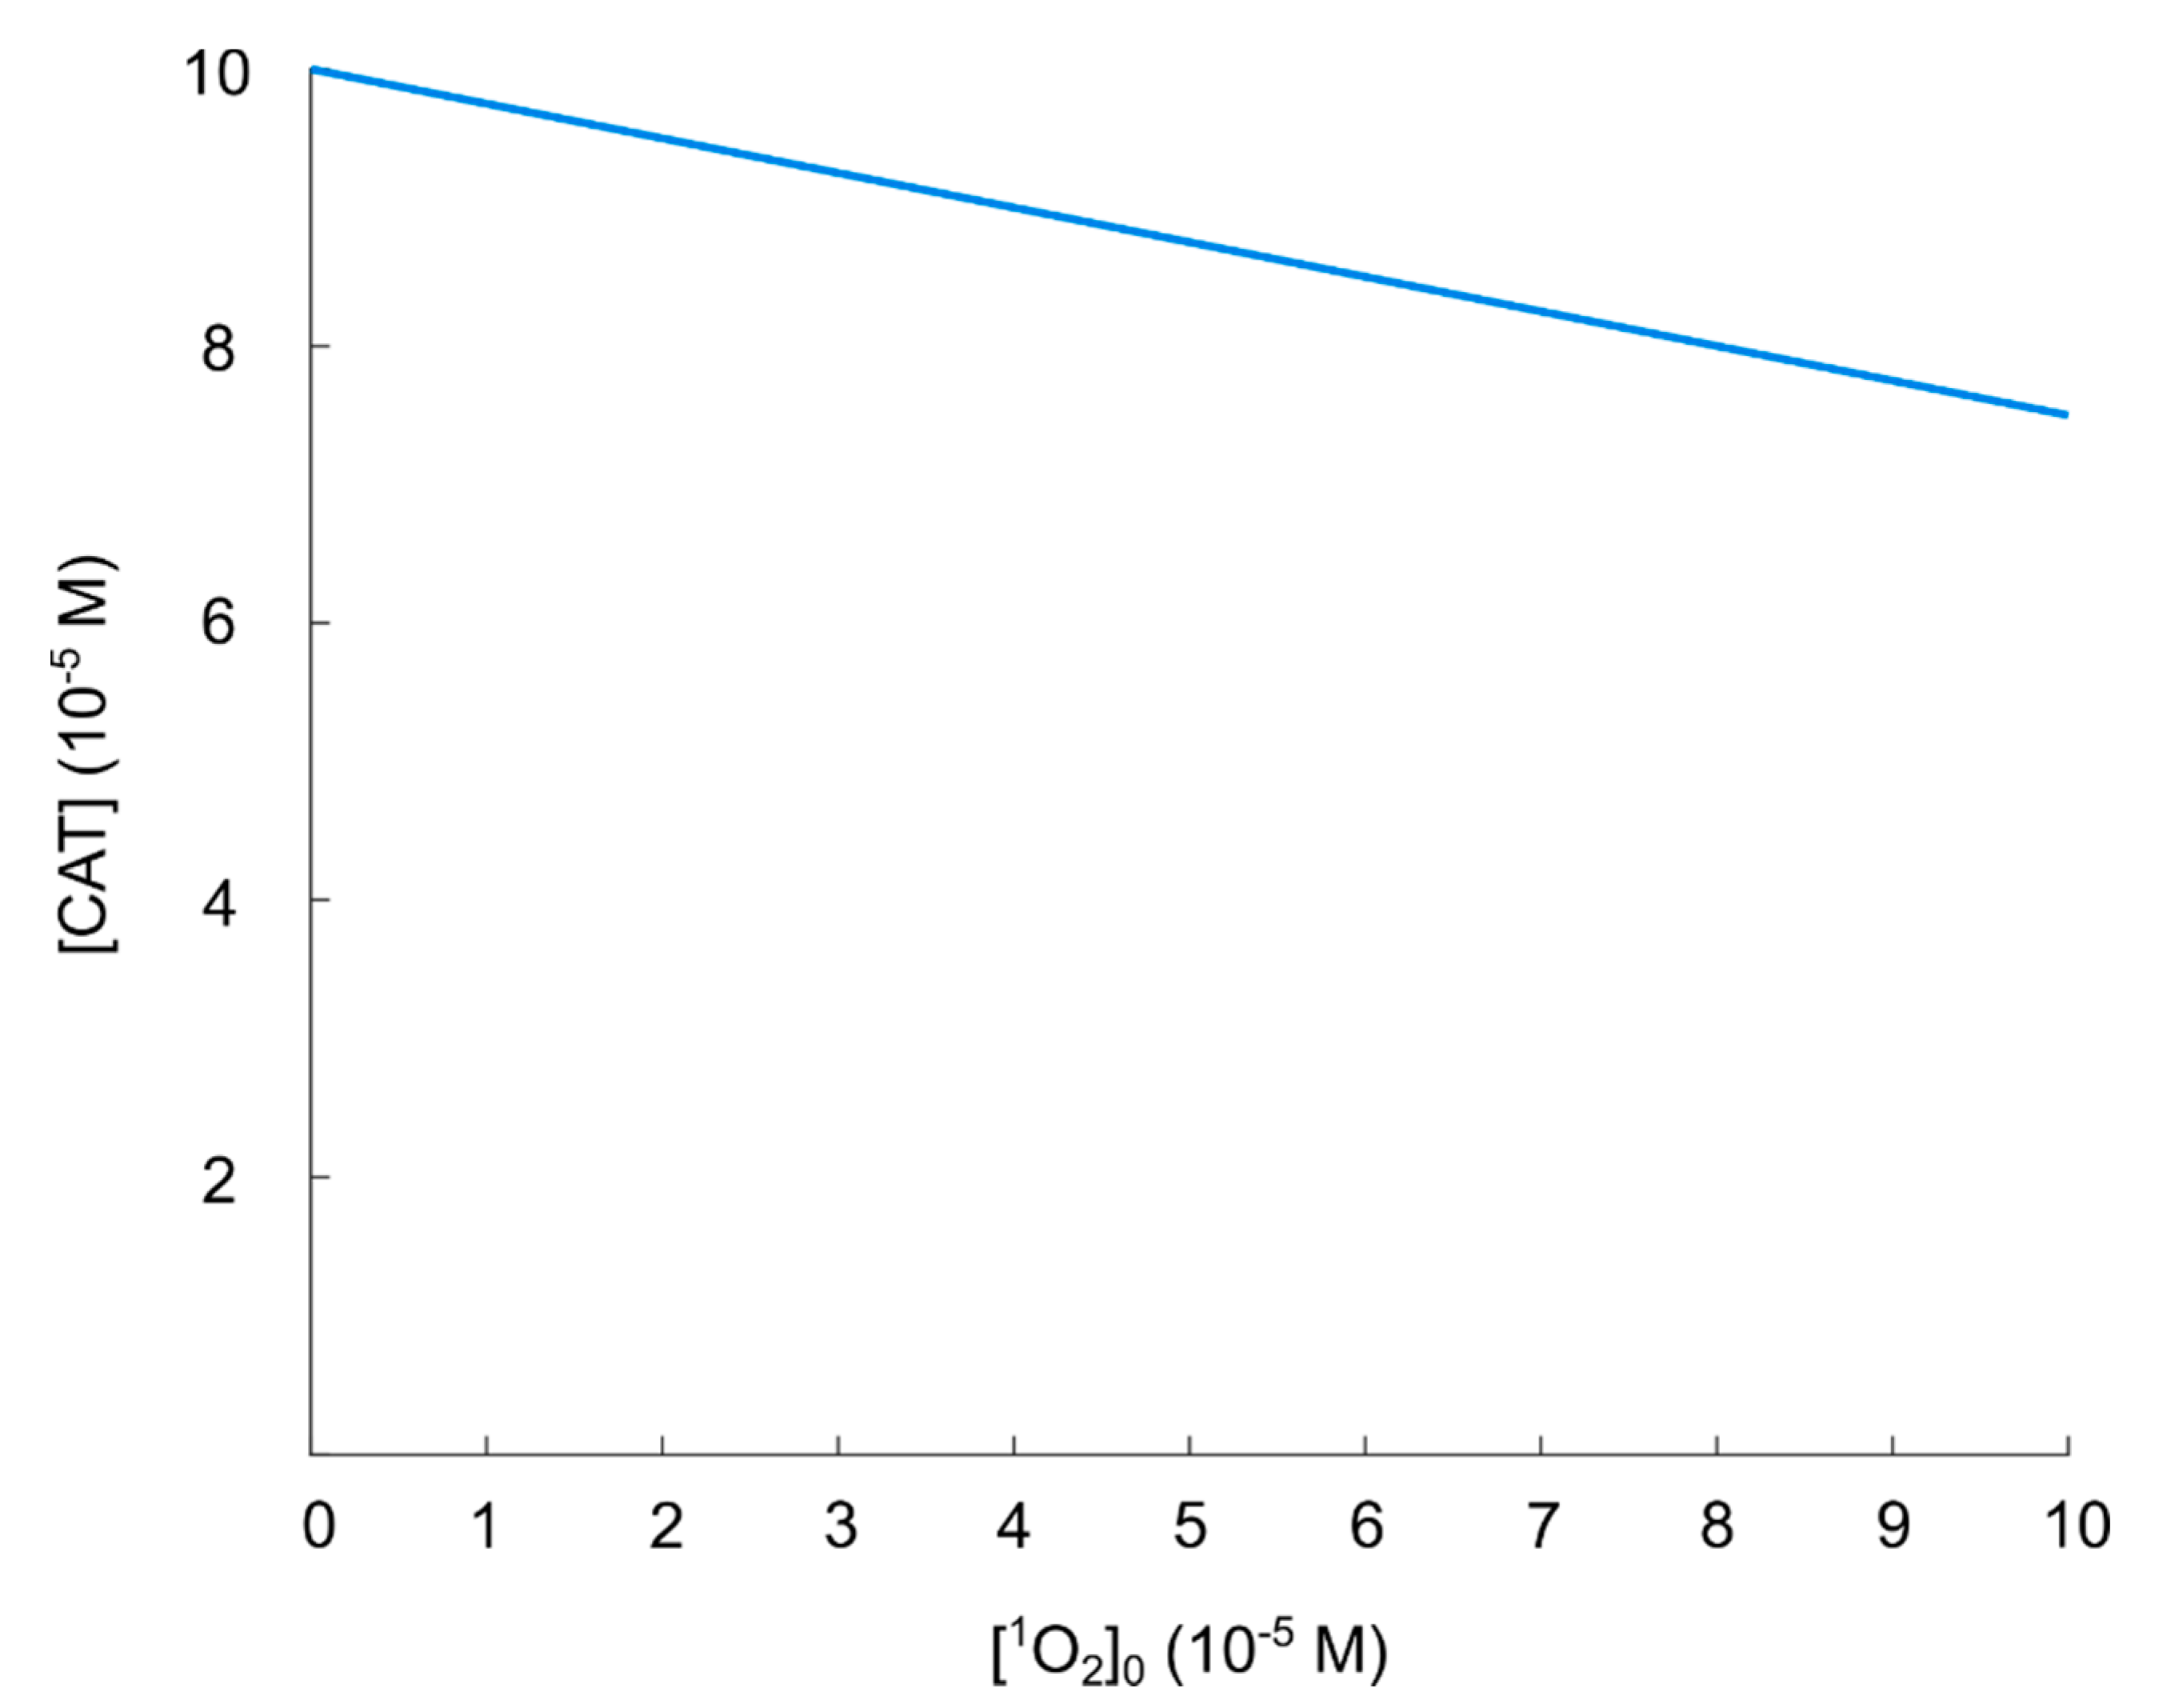
5.3. Catalase Inactivation by Primary and Secondary Singlet Oxygen
5.3.1. Primary Singlet Oxygen
5.3.2. Secondary Singlet Oxygen
5.3.3. Summary of the Effect of Singlet Oxygen in the Reactivation of Hydroxyl Radicals in the Nitric Oxide/Peroxynitrite Pathway
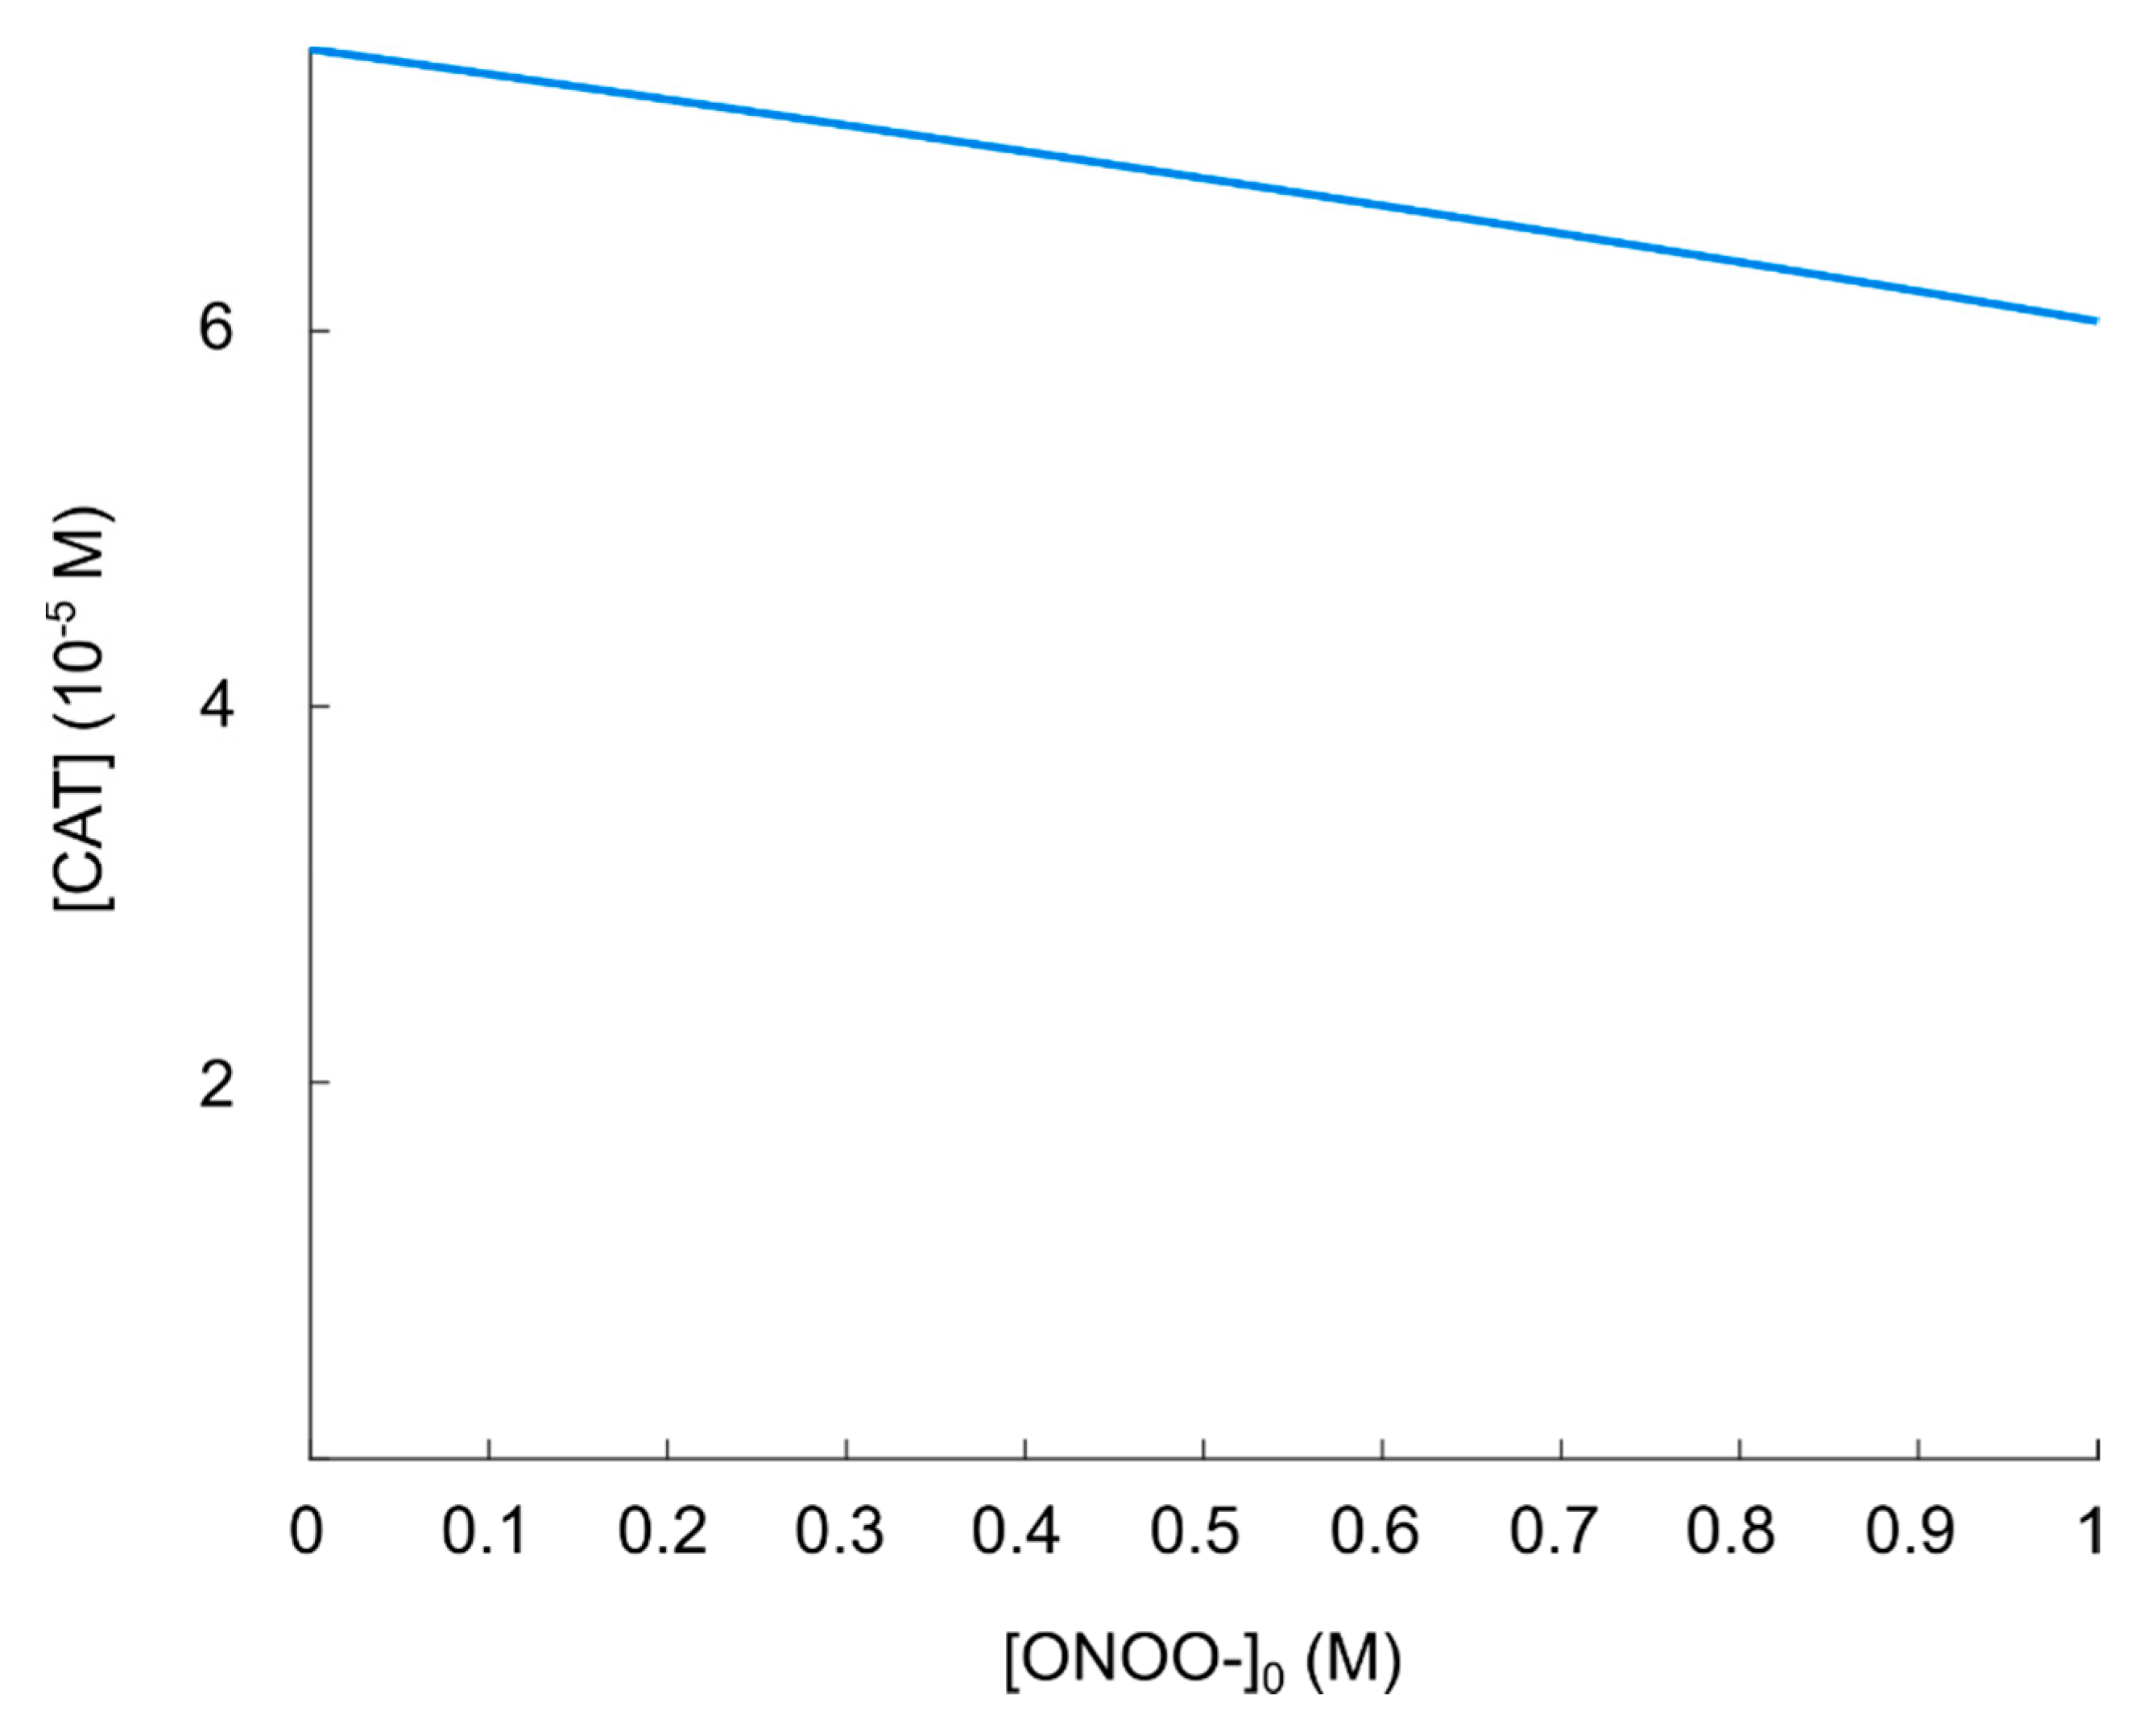
5.4. The Impact of Carbon Dioxide-Catalyzed Decay of Peroxynitrite on the Hydroxyl Radical Generation in the Nitric Oxide/Peroxynitrite Pathway
5.5. Limitations of the Model and Potential Implications
- The spatial dynamics of the involved species.
- The constant generation of some species (superoxide anions and nitric oxide in particular).
- The effect of (more) interfering pathways (which in general will cause a reduction of the generation of hydroxyl radicals, because the substrates of hydroxyl radical generation are used in the formation of other products).
- The effect of a possible pH gradient between the extracellular- and intracellular compartments.
- The difference in the catalytic action of membrane-bound enzymes as compared to enzymes that are free in solution.
- The effect of non-equilibrium on the rate constants.
- The potential enzyme inhibition by the products (or other species).
- The pH-dependence of enzyme activity.
6. Conclusions
- The hypochlorous acid pathway is highly unlikely to generate hydroxyl radicals at all at the conditions outlined by the theory. This is due to a very unfavorable kinetics of this pathway with respect to hydroxyl radical formation, causing the rate of generation of hydroxyl radicals to be negligible.
- The nitric oxide/peroxynitrite pathway may only generate—under conditions that absolutely maximize the yield of hydroxyl radicals—hydroxyl radicals in a concentration that is almost four orders of magnitudes lower than what has been found to be the critical extracellular hydroxyl radical concentration for apoptosis-induction [105,106]. It thus seems unlikely that this pathway will result in apoptosis-induction, whether there is catalase in the extracellular compartment or not.
- If it is assumed that the amount of generated hydroxyl radicals from the fully reactivated nitric oxide/peroxynitrite pathway is sufficient to cause apoptosis-induction, then a catalase concentration of about 100 µM is required to protect the cells. However, when a physiological concentration of carbon dioxide is introduced into the reaction network of the nitric oxide/peroxynitrite pathway, the effect of catalase in the system is negligible since the generation of hydroxyl radicals is vanishing at all catalase concentrations. Thus, there is no reactivation of the apoptotic pathway at any level of catalase inactivation.
- If the nitric oxide/peroxynitrite pathway still is assumed to represent a possible apoptotic pathway, then one crucial result still remain; sufficient catalase inactivation (i.e., sufficient with respect to the possibility of pathway reactivation) will most likely not occur by the primary and secondary singlet oxygen possibly contained and generated in the solution after CAP-exposure.
Author Contributions
Funding
Conflicts of Interest
Appendix A
Appendix A.1. Rate Equations and Rate Constants
Appendix A.1.1. General Information
Appendix A.1.2. Reaction (1)
Appendix A.1.3. Reaction (2)
Appendix A.1.4. Reaction (3)
Appendix A.1.5. Reaction (4)
Appendix A.1.6. Reaction (5)
Appendix A.1.7. Reaction (6)
Appendix A.1.8. Reaction (7)
Appendix A.1.9. Reaction (8)
Appendix A.2. Enzyme Effective Radius
Appendix A.2.1. Catalase
Appendix A.2.2. SOD
Appendix A.3. Concentration of Carbon Dioxide
References
- Kaushik, N.K.; Attri, P.; Kaushik, N.; Choi, E.H. A Preliminary Study of the Effect of DBD Plasma and Osmolytes on T98G Brain Cancer and HEK Non-Malignant Cells. Molecules 2013, 18, 4917–4928. [Google Scholar] [CrossRef] [PubMed]
- Vandamme, M.; Robert, E.; Lerondel, S.; Sarron, V.; Ries, D.; Dozias, S.; Sobilo, J.; Gosset, D.; Kieda, C.; Legrain, B.; et al. ROS implication in a new antitumor strategy based on non-thermal plasma. Int. J. Cancer 2012, 130, 2185–2194. [Google Scholar] [CrossRef] [PubMed]
- Fridman, G.; Shereshevsky, A.; Jost, M.M.; Brooks, A.D.; Fridman, A.; Gutsol, A.; Vasilets, V.; Friedman, G. Floating electrode dielectric barrier discharge plasma in air promoting apoptotic behavior in melanoma skin cancer cell lines. Plasma Chem. Plasma Process. 2007, 27, 163–176. [Google Scholar] [CrossRef]
- Kim, G.C.; Kim, G.J.; Park, S.R.; Jeon, S.M.; Seo, H.J.; Iza, F.; Lee, J.K. Air plasma coupled with antibody-conjugated nanoparticles: A new weapon against cancer. J. Phys. D Appl. Phys. 2009, 42, 5. [Google Scholar] [CrossRef]
- Lee, H.J.; Shon, C.H.; Kim, Y.S.; Kim, S.; Kim, G.C.; Kong, M.G. Degradation of adhesion molecules of G361 melanoma cells by a non-thermal atmospheric pressure microplasma. New J. Phys. 2009, 11, 13. [Google Scholar] [CrossRef]
- Ninomiya, K.; Ishijima, T.; Imamura, M.; Yamahara, T.; Enomoto, H.; Takahashi, K.; Tanaka, Y.; Uesugi, Y.; Shimizu, N. Evaluation of extra- and intracellular OH radical generation, cancer cell injury, and apoptosis induced by a non-thermal atmospheric-pressure plasma jet. J. Phys. D Appl. Phys. 2013, 46, 8. [Google Scholar] [CrossRef]
- Wang, M.; Holmes, B.; Cheng, X.Q.; Zhu, W.; Keidar, M.; Zhang, L.G. Cold Atmospheric Plasma for Selectively Ablating Metastatic Breast Cancer Cells. PLoS ONE 2013, 8, e73741. [Google Scholar] [CrossRef] [PubMed]
- Ishaq, M.; Evans, M.D.M.; Ostrikov, K. Atmospheric pressure gas plasma-induced colorectal cancer cell death is mediated by Nox2-ASK1 apoptosis pathways and oxidative stress is mitigated by Srx-Nrf2 anti-oxidant system. Biochim. Biophys. Acta Mol. Cell Res. 2014, 1843, 2827–2837. [Google Scholar] [CrossRef]
- Plewa, J.M.; Yousfi, M.; Frongia, C.; Eichwald, O.; Ducommun, B.; Merbahi, N.; Lobjois, V. Low-temperature plasma-induced antiproliferative effects on multi-cellular tumor spheroids. New J. Phys. 2014, 16, 20. [Google Scholar] [CrossRef]
- Keidar, M.; Walk, R.; Shashurin, A.; Srinivasan, P.; Sandler, A.; Dasgupta, S.; Ravi, R.; Guerrero-Preston, R.; Trink, B. Cold plasma selectivity and the possibility of a paradigm shift in cancer therapy. Br. J. Cancer 2011, 105, 1295–1301. [Google Scholar] [CrossRef]
- Kim, J.Y.; Ballato, J.; Foy, P.; Hawkins, T.; Wei, Y.Z.; Li, J.H.; Kim, S.O. Apoptosis of lung carcinoma cells induced by a flexible optical fiber-based cold microplasma. Biosens. Bioelectron. 2011, 28, 333–338. [Google Scholar] [CrossRef] [PubMed]
- Ahn, H.J.; Kim, K.I.; Hoan, N.N.; Kim, C.H.; Moon, E.; Choi, K.S.; Yang, S.S.; Lee, J.S. Targeting Cancer Cells with Reactive Oxygen and Nitrogen Species Generated by Atmospheric-Pressure Air Plasma. PLoS ONE 2014, 9, e86173. [Google Scholar] [CrossRef]
- Tan, X.; Zhao, S.S.; Lei, Q.; Lu, X.P.; He, G.Y.; Ostrikov, K. Single-Cell-Precision Microplasma-Induced Cancer Cell Apoptosis. PLoS ONE 2014, 9, e101299. [Google Scholar] [CrossRef]
- Barekzi, N.; Laroussi, M. Dose-dependent killing of leukemia cells by low-temperature plasma. J. Phys. D Appl. Phys. 2012, 45, 6. [Google Scholar] [CrossRef]
- Thiyagarajan, M.; Anderson, H.; Gonzales, X.F. Induction of Apoptosis in Human Myeloid Leukemia Cells by Remote Exposure of Resistive Barrier Cold Plasma. Biotechnol. Bioeng. 2014, 111, 565–574. [Google Scholar] [CrossRef]
- Metelmann, H.R.; Nedrelow, D.S.; Seebauer, C.; Schuster, M.; von Woedtke, T.; Weltmann, K.D.; Kindler, S.; Metelmann, P.H.; Finkelstein, S.E.; Von Hoff, D.D.; et al. Head and neck cancer treatment and physical plasma. Clin. Plasma Med. 2015, 3, 17–23. [Google Scholar] [CrossRef]
- Metelmann, H.R.; Seebauer, C.; Miller, V.; Fridman, A.; Bauer, G.; Graves, D.B.; Pouvesle, J.M.; Rutkowski, R.; Schuster, M.; Bekeschus, S.; et al. Clinical experience with cold plasma in the treatment of locally advanced head and neck cancer. Clin. Plasma Med. 2018, 9, 6–13. [Google Scholar] [CrossRef]
- Schuster, M.; Seebauer, C.; Rutkowski, R.; Hauschild, A.; Podmelle, F.; Metelmann, C.; Metelmann, B.; von Woedtke, T.; Hasse, S.; Weltmann, K.D.; et al. Visible tumor surface response to physical plasma and apoptotic cell kill in head and neck cancer. J. Cranio-MaxilloFac. Surg. 2016, 44, 1445–1452. [Google Scholar] [CrossRef] [PubMed]
- Adachi, T.; Nonomura, S.; Horiba, M.; Hirayama, T.; Kamiya, T.; Nagasawa, H.; Hara, H. Iron stimulates plasma-activated medium-induced A549 cell injury. Sci. Rep. 2016, 6, 12. [Google Scholar] [CrossRef]
- Guerrero-Preston, R.; Ogawa, T.; Uemura, M.; Shumulinsky, G.; Valle, B.L.; Pirini, F.; Ravi, R.; Sidransky, D.; Keidar, M.; Trink, B. Cold atmospheric plasma treatment selectively targets head and neck squamous cell carcinoma cells. Int. J. Mol. Med. 2014, 34, 941–946. [Google Scholar] [CrossRef]
- Iseki, S.; Nakamura, K.; Hayashi, M.; Tanaka, H.; Kondo, H.; Kajiyama, H.; Kano, H.; Kikkawa, F.; Hori, M. Selective killing of ovarian cancer cells through induction of apoptosis by nonequilibrium atmospheric pressure plasma. Appl. Phys. Lett. 2012, 100, 4. [Google Scholar] [CrossRef]
- Ishaq, M.; Kumar, S.; Varinli, H.; Han, Z.J.; Rider, A.E.; Evans, M.D.M.; Murphy, A.B.; Ostrikov, K. Atmospheric gas plasma-induced ROS production activates TNF-ASK1 pathway for the induction of melanoma cancer cell apoptosis. Mol. Biol. Cell 2014, 25, 1523–1531. [Google Scholar] [CrossRef]
- Kaushik, N.K.; Kaushik, N.; Park, D.; Choi, E.H. Altered Antioxidant System Stimulates Dielectric Barrier Discharge Plasma-Induced Cell Death for Solid Tumor Cell Treatment. PLoS ONE 2014, 9, e103349. [Google Scholar] [CrossRef] [PubMed]
- Kim, S.J.; Chung, T.H. Cold atmospheric plasma jet-generated RONS and their selective effects on normal and carcinoma cells. Sci. Rep. 2016, 6, 14. [Google Scholar] [CrossRef] [PubMed]
- Kumar, N.; Park, J.H.; Jeon, S.N.; Park, B.S.; Choi, E.H.; Attri, P. The action of microsecond-pulsed plasma-activated media on the inactivation of human lung cancer cells. J. Phys. D Appl. Phys. 2016, 49, 9. [Google Scholar] [CrossRef]
- Kurake, N.; Tanaka, H.; Ishikawa, K.; Kondo, T.; Sekine, M.; Nakamura, K.; Kajiyama, H.; Kikkawa, F.; Mizuno, M.; Hori, M. Cell survival of glioblastoma grown in medium containing hydrogen peroxide and/or nitrite, or in plasma-activated medium. Arch. Biochem. Biophys. 2016, 605, 102–108. [Google Scholar] [CrossRef] [PubMed]
- Siu, A.; Volotskova, O.; Cheng, X.Q.; Khalsa, S.S.; Bian, K.; Murad, F.; Keidar, M.; Sherman, J.H. Differential Effects of Cold Atmospheric Plasma in the Treatment of Malignant Glioma. PLoS ONE 2015, 10, e126313. [Google Scholar] [CrossRef] [PubMed]
- Utsumi, F.; Kajiyama, H.; Nakamura, K.; Tanaka, H.; Hori, M.; Kikkawa, F. Selective cytotoxicity of indirect nonequilibrium atmospheric pressure plasma against ovarian clear-cell carcinoma. SpringerPlus 2014, 3, 9. [Google Scholar] [CrossRef]
- Biscop, E.; Lin, A.; Van Boxem, W.; Van Loenhout, J.; De Backer, J.; Deben, C.; Dewilde, S.; Smits, E.; Bogaerts, A. Influence of Cell Type and Culture Medium on Determining Cancer Selectivity of Cold Atmospheric Plasma Treatment. Cancers 2019, 11, 1287. [Google Scholar] [CrossRef]
- Ahn, H.J.; Kim, K.I.; Kim, G.; Moon, E.; Yang, S.S.; Lee, J.S. Atmospheric-Pressure Plasma Jet Induces Apoptosis Involving Mitochondria via Generation of Free Radicals. PLoS ONE 2011, 6, e28154. [Google Scholar] [CrossRef]
- Arjunan, K.P.; Friedman, G.; Fridman, A.; Clyne, A.M. Non-thermal dielectric barrier discharge plasma induces angiogenesis through reactive oxygen species. J. R. Soc. Interface 2012, 9, 147–157. [Google Scholar] [CrossRef]
- Yan, X.; Xiong, Z.L.; Zou, F.; Zhao, S.S.; Lu, X.P.; Yang, G.X.; He, G.Y.; Ostrikov, K. Plasma-Induced Death of HepG2 Cancer Cells: Intracellular Effects of Reactive Species. Plasma Process. Polym. 2012, 9, 59–66. [Google Scholar] [CrossRef]
- Barekzi, N.; Laroussi, M. Effects of Low Temperature Plasmas on Cancer Cells. Plasma Process. Polym. 2013, 10, 1039–1050. [Google Scholar] [CrossRef]
- Bauer, G. Increasing the endogenous NO level causes catalase inactivation and reactivation of intercellular apoptosis signaling specifically in tumor cells. Redox Biol. 2015, 6, 353–371. [Google Scholar] [CrossRef] [PubMed]
- Bauer, G. The Antitumor Effect of Singlet Oxygen. Anticancer Res. 2016, 36, 5649–5663. [Google Scholar] [CrossRef] [PubMed]
- Bauer, G. Central Signaling Elements of Intercellular Reactive Oxygen/Nitrogen Species-dependent Induction of Apoptosis in Malignant Cells. Anticancer Res. 2017, 37, 499–513. [Google Scholar] [CrossRef]
- Bauer, G.; Graves, D.B. Mechanisms of Selective Antitumor Action of Cold Atmospheric Plasma-Derived Reactive Oxygen and Nitrogen Species. Plasma Process. Polym. 2016, 13, 1157–1178. [Google Scholar] [CrossRef]
- Gay-Mimbrera, J.; Garcia, M.C.; Isla-Tejera, B.; Rodero-Serrano, A.; Garcia-Nieto, A.V.; Ruano, J. Clinical and Biological Principles of Cold Atmospheric Plasma Application in Skin Cancer. Adv. Ther. 2016, 33, 894–909. [Google Scholar] [CrossRef]
- Keidar, M. Plasma for cancer treatment. Plasma Sources Sci. Technol. 2015, 24, 20. [Google Scholar] [CrossRef]
- Keidar, M.; Shashurin, A.; Volotskova, O.; Stepp, M.A.; Srinivasan, P.; Sandler, A.; Trink, B. Cold atmospheric plasma in cancer therapy. Phys. Plasmas 2013, 20, 8. [Google Scholar] [CrossRef]
- Ratovitski, E.A.; Cheng, X.Q.; Yan, D.Y.; Sherman, J.H.; Canady, J.; Trink, B.; Keidar, M. Anti-Cancer Therapies of 21st Century: Novel Approach to Treat Human Cancers Using Cold Atmospheric Plasma. Plasma Process. Polym. 2014, 11, 1128–1137. [Google Scholar] [CrossRef]
- Riethmuller, M.; Burger, N.; Bauer, G. Singlet oxygen treatment of tumor cells triggers extracellular singlet oxygen generation, catalase inactivation and reactivation of intercellular apoptosis-inducing signaling. Redox Biol. 2015, 6, 157–168. [Google Scholar] [CrossRef]
- Joh, H.M.; Kim, S.J.; Chung, T.H.; Leem, S.H. Reactive oxygen species-related plasma effects on the apoptosis of human bladder cancer cells in atmospheric pressure pulsed plasma jets. Appl. Phys. Lett. 2012, 101, 5. [Google Scholar] [CrossRef]
- Kim, C.H.; Bahn, J.H.; Lee, S.H.; Kim, G.Y.; Jun, S.I.; Lee, K.; Baek, S.J. Induction of cell growth arrest by atmospheric non-thermal plasma in colorectal cancer cells. J. Biotechnol. 2010, 150, 530–538. [Google Scholar] [CrossRef] [PubMed]
- Kim, S.J.; Chung, T.H.; Bae, S.H.; Leem, S.H. Induction of apoptosis in human breast cancer cells by a pulsed atmospheric pressure plasma jet. Appl. Phys. Lett. 2010, 97, 3. [Google Scholar] [CrossRef]
- Yan, D.Y.; Sherman, J.H.; Keidar, M. Cold atmospheric plasma, a novel promising anti-cancer treatment modality. Oncotarget 2017, 8, 15977–15995. [Google Scholar] [CrossRef]
- Yan, D.Y.; Xiao, H.J.; Zhu, W.; Nourmohammadi, N.; Zhang, L.G.; Bian, K.; Keidar, M. The role of aquaporins in the anti-glioblastoma capacity of the cold plasma-stimulated medium. J. Phys. D Appl. Phys. 2017, 50, 8. [Google Scholar] [CrossRef]
- Kaushik, N.K.; Kaushik, N.; Min, B.; Choi, K.H.; Hong, Y.J.; Miller, V.; Fridman, A.; Choi, E.H. Cytotoxic macrophage-released tumour necrosis factor-alpha (TNF-alpha) as a killing mechanism for cancer cell death after cold plasma activation. J. Phys. D Appl. Phys. 2016, 49, 9. [Google Scholar] [CrossRef]
- Lin, A.; Truong, B.; Pappas, A.; Kirifides, L.; Oubarri, A.; Chen, S.Y.; Lin, S.J.; Dobrynin, D.; Fridman, G.; Fridman, A.; et al. Uniform Nanosecond Pulsed Dielectric Barrier Discharge Plasma Enhances Anti-Tumor Effects by Induction of Immunogenic Cell Death in Tumors and Stimulation of Macrophages. Plasma Process. Polym. 2015, 12, 1392–1399. [Google Scholar] [CrossRef]
- Lin, A.; Truong, B.; Patel, S.; Kaushik, N.; Choi, E.H.; Fridman, G.; Fridman, A.; Miller, V. Nanosecond-Pulsed DBD Plasma-Generated Reactive Oxygen Species Trigger Immunogenic Cell Death in A549 Lung Carcinoma Cells through Intracellular Oxidative Stress. Int. J. Mol. Sci. 2017, 18, 966. [Google Scholar] [CrossRef]
- Miller, V.; Lin, A.; Fridman, A. Why Target Immune Cells for Plasma Treatment of Cancer. Plasma Chem. Plasma Process. 2016, 36, 259–268. [Google Scholar] [CrossRef]
- Miller, V.; Lin, A.; Fridman, G.; Dobrynin, D.; Fridman, A. Plasma Stimulation of Migration of Macrophages. Plasma Process. Polym. 2014, 11, 1193–1197. [Google Scholar] [CrossRef]
- Van der Paal, J.; Neyts, E.C.; Verlackt, C.C.W.; Bogaerts, A. Effect of lipid peroxidation on membrane permeability of cancer and normal cells subjected to oxidative stress. Chem. Sci. 2016, 7, 489–498. [Google Scholar] [CrossRef] [PubMed]
- Van der Paal, J.; Verheyen, C.; Neyts, E.C.; Bogaerts, A. Hampering Effect of Cholesterol on the Permeation of Reactive Oxygen Species through Phospholipids Bilayer: Possible Explanation for Plasma Cancer Selectivity. Sci. Rep. 2017, 7, 39526. [Google Scholar] [CrossRef]
- Bauer, G. Signal Amplification by Tumor Cells: Clue to the Understanding of the Antitumor Effects of Cold Atmospheric Plasma and Plasma-Activated Medium. IEEE Trans. Radiat. Plasma Med. Sci. 2018, 2, 87–98. [Google Scholar] [CrossRef]
- Bauer, G. Targeting Protective Catalase of Tumor Cells with Cold Atmospheric Plasma-Activated Medium (PAM). Anti-Cancer Agents Med. Chem. 2018, 18, 784–804. [Google Scholar] [CrossRef]
- Bauer, G. The synergistic effect between hydrogen peroxide and nitrite, two long-lived molecular species from cold atmospheric plasma, triggers tumor cells to induce their own cell death. Redox Biol. 2019, 26. [Google Scholar] [CrossRef]
- Bauer, G. Intercellular singlet oxygen-mediated bystander signaling triggered by long-lived species of cold atmospheric plasma and plasma-activated medium. Redox Biol. 2019, 26. [Google Scholar] [CrossRef]
- Bauer, G.; Sersenová, D.; Graves, D.B.; Machala, Z. Cold Atmospheric Plasma and Plasma-Activated Medium Trigger RONS-Based Tumor Cell Apoptosis. Sci. Rep. 2019, 9, 14210. [Google Scholar] [CrossRef]
- Bauer, G.; Sersenová, D.; Graves, D.B.; Machala, Z. Dynamics of Singlet Oxygen-Triggered, RONS-Based Apoptosis Induction after Treatment of Tumor Cells with Cold Atmospheric Plasma or Plasma-Activated Medium. Sci. Rep. 2019, 9, 13931. [Google Scholar] [CrossRef]
- Bauer, G. Autoamplificatory singlet oxygen generation sensitizes tumor cells for intercellular apoptosis-inducing signaling. Mech. Ageing. Dev. 2018, 172, 59–77. [Google Scholar] [CrossRef]
- Adimora, N.J.; Jones, D.P.; Kemp, M.L. A Model of Redox Kinetics Implicates the Thiol Proteome in Cellular Hydrogen Peroxide Responses. Antioxid. Redox Signal. 2010, 13, 731–743. [Google Scholar] [CrossRef] [PubMed]
- Benfeitas, R.; Selvaggio, G.; Antunes, F.; Coelho, P.; Salvador, A. Hydrogen peroxide metabolism and sensing in human erythrocytes: A validated kinetic model and reappraisal of the role of peroxiredoxin II. Free Radic. Biol. Med. 2014, 74, 35–49. [Google Scholar] [CrossRef] [PubMed]
- Chen, B.; Deen, W.M. Analysis of the effects of cell spacing and liquid depth on nitric oxide and its oxidation products in cell cultures. Chem. Res. Toxicol. 2001, 14, 135–147. [Google Scholar] [CrossRef] [PubMed]
- Chen, B.; Deen, W.M. Effect of liquid depth on the synthesis and oxidation of nitric oxide in macrophage cultures. Chem. Res. Toxicol. 2002, 15, 490–496. [Google Scholar] [CrossRef]
- Chen, B.; Keshive, M.; Deen, W.M. Diffusion and reaction of nitric oxide in suspension cell cultures. Biophys. J. 1998, 75, 745–754. [Google Scholar] [CrossRef]
- Chin, M.P.; Deen, W.M. Prediction of nitric oxide concentrations in melanomas. Nitric Oxide-Biol. Chem. 2010, 23, 319–326. [Google Scholar] [CrossRef]
- Chin, M.P.; Schauer, D.B.; Deen, W.M. Nitric Oxide, Oxygen, and Superoxide Formation and Consumption in Macrophages and Colonic Epithelial Cells. Chem. Res. Toxicol. 2010, 23, 778–787. [Google Scholar] [CrossRef]
- Hu, T.M.; Hayton, W.L.; Mallery, S.R. Kinetic modeling of nitric-oxide-associated reaction network. Pharm. Res. 2006, 23, 1702–1711. [Google Scholar] [CrossRef]
- Komalapriya, C.; Kaloriti, D.; Tillmann, A.T.; Yin, Z.K.; Herrero-de-Dios, C.; Jacobsen, M.D.; Belmonte, R.C.; Cameron, G.; Haynes, K.; Grebogi, C.; et al. Integrative Model of Oxidative Stress Adaptation in the Fungal Pathogen Candida albicans. PLoS ONE 2015, 10, e137750. [Google Scholar] [CrossRef]
- Lim, C.H.; Dedon, P.C.; Deen, W.A. Kinetic Analysis of Intracellular Concentrations of Reactive Nitrogen Species. Chem. Res. Toxicol. 2008, 21, 2134–2147. [Google Scholar] [CrossRef] [PubMed]
- Lim, J.B.; Huang, B.K.; Deen, W.M.; Sikes, H.D. Analysis of the lifetime and spatial localization of hydrogen peroxide generated in the cytosol using a reduced kinetic model. Free Radic. Biol. Med. 2015, 89, 47–53. [Google Scholar] [CrossRef] [PubMed]
- Nalwaya, N.; Deen, W.M. Analysis of the effects of nitric oxide and oxygen on nitric oxide production by macrophages. J. Theor. Biol. 2004, 226, 409–419. [Google Scholar] [CrossRef] [PubMed]
- Nalwaya, N.; Deen, W.M. Peroxynitrite exposure of cells cocultured with macrophages. Ann. Biomed. Eng. 2004, 32, 664–676. [Google Scholar] [CrossRef] [PubMed]
- Du, J.; Liu, J.; Smith, B.J.; Tsao, M.S.; Cullen, J.J. Role of Rac1-dependent NADPH oxidase in the growth of pancreatic cancer. Cancer Gene Ther. 2011, 18, 135–143. [Google Scholar] [CrossRef] [PubMed]
- Irani, K.; Goldschmidt-Clermont, P.J. Ras, superoxide and signal transduction. Biochem. Pharmacol. 1998, 55, 1339–1346. [Google Scholar]
- Irani, K.; Xia, Y.; Zweier, J.L.; Sollott, S.J.; Der, C.J.; Fearon, E.R.; Sundaresan, M.; Finkel, T.; GoldschmidtClermont, P.J. Mitogenic signaling mediated by oxidants in ras-transformed fibroblasts. Science 1997, 275, 1649–1652. [Google Scholar] [CrossRef]
- Kamata, T. Roles of Nox1 and other Nox isoforms in cancer development. Cancer Sci. 2009, 100, 1382–1388. [Google Scholar] [CrossRef]
- Lambeth, J.D. Nox enzymes, ROS, and chronic disease: An example of antagonistic pleiotropy. Free Radic. Biol. Med. 2007, 43, 332–347. [Google Scholar] [CrossRef]
- Laurent, E.; McCoy, J.W.; Macina, R.A.; Liu, W.H.; Cheng, G.J.; Robine, S.; Papkoff, J.; Lambeth, J.D. Nox1 is over-expressed in human colon cancers and correlates with activating mutations in K-Ras. Int. J. Cancer 2008, 123, 100–107. [Google Scholar] [CrossRef]
- Ma, Q.; Cavallin, L.E.; Yan, B.; Zhu, S.K.; Duran, E.M.; Wang, H.L.; Hale, L.P.; Dong, C.M.; Cesarman, E.; Mesri, E.A.; et al. Antitumorigenesis of antioxidants in a transgenic Rac1 model of Kaposi’s sarcoma. Proc. Natl. Acad. Sci. USA 2009, 106, 8683–8688. [Google Scholar] [CrossRef] [PubMed]
- Mitsushita, J.; Lambeth, J.D.; Kamata, T. The superoxide-generating oxidase Nox1 is functionally required for Ras oncogene transformation. Cancer Res. 2004, 64, 3580–3585. [Google Scholar] [CrossRef] [PubMed]
- Suh, Y.A.; Arnold, R.S.; Lassegue, B.; Shi, J.; Xu, X.X.; Sorescu, D.; Chung, A.B.; Griendling, K.K.; Lambeth, J.D. Cell transformation by the superoxide-generating oxidase Mox1. Nature 1999, 401, 79–82. [Google Scholar] [CrossRef]
- Tominaga, K.; Kawahara, T.; Sano, T.; Toida, K.; Kuwano, Y.; Sasaki, H.; Kawai, T.; Teshima-Kondo, S.; Rokutan, K. Evidence for cancer-associated expression of NADPH oxidase 1 (Nox1)-based oxidase system in the human stomach. Free Radic. Biol. Med. 2007, 43, 1627–1638. [Google Scholar] [CrossRef]
- Weinberg, F.; Chandel, N.S. Reactive oxygen species-dependent signaling regulates cancer. Cell. Mol. Life Sci. 2009, 66, 3663–3673. [Google Scholar] [CrossRef] [PubMed]
- Yang, J.Q.; Li, S.J.; Domann, F.E.; Buettner, G.R.; Oberley, L.W. Superoxide generation in v-Ha-ras-transduced human keratinocyte HaCaT cells. Mol. Carcinog. 1999, 26, 180–188. [Google Scholar] [CrossRef]
- Szatrowski, T.P.; Nathan, C.F. Production of large amounts of hydrogen-peroxide by human tumor-cells. Cancer Res. 1991, 51, 794–798. [Google Scholar]
- Turner, C.P.; Toye, A.M.; Jones, O.T.G. Keratinocyte superoxide generation. Free Radic. Biol. Med. 1998, 24, 401–407. [Google Scholar] [CrossRef]
- Bauer, G. Tumor Cell-protective Catalase as a Novel Target for Rational Therapeutic Approaches Based on Specific Intercellular ROS Signaling. Anticancer Res. 2012, 32, 2599–2624. [Google Scholar]
- Bauer, G. Targeting Extracellular ROS Signaling of Tumor Cells. Anticancer Res. 2014, 34, 1467–1482. [Google Scholar]
- Bechtel, W.; Bauer, G. Catalase Protects Tumor Cells from Apoptosis Induction by Intercellular ROS Signaling. Anticancer Res. 2009, 29, 4541–4557. [Google Scholar] [PubMed]
- Bohm, B.; Heinzelmann, S.; Motz, M.; Bauer, G. Extracellular localization of catalase is associated with the transformed state of malignant cells. Biol. Chem. 2015, 396, 1339–1356. [Google Scholar] [CrossRef] [PubMed]
- Heinzelmann, S.; Bauer, G. Multiple protective functions of catalase against intercellular apoptosis-inducing ROS signaling of human tumor cells. Biol. Chem. 2010, 391, 675–693. [Google Scholar] [CrossRef]
- Engelmann, I.; Dormann, S.; Saran, M.; Bauer, G. Transformed target cell-derived superoxide anions drive apoptosis induction by myeloperoxidase. Redox Rep. 2000, 5, 207–214. [Google Scholar] [CrossRef]
- Heigold, S.; Sers, C.; Bechtel, W.; Ivanovas, B.; Schafer, R.; Bauer, G. Nitric oxide mediates apoptosis induction selectively in transformed fibroblasts compared to nontransformed fibroblasts. Carcinogenesis 2002, 23, 929–941. [Google Scholar] [CrossRef]
- Herdener, M.; Heigold, S.; Saran, M.; Bauer, G. Target cell-derived superoxide anions cause efficiency and selectivity of intercellular induction of apoptosis. Free Radic. Biol. Med. 2000, 29, 1260–1271. [Google Scholar] [CrossRef]
- Van Gaens, W.; Bogaerts, A. Kinetic modelling for an atmospheric pressure argon plasma jet in humid air (vol 46, 275201, 2013). J. Phys. D Appl. Phys. 2014, 47, 3. [Google Scholar] [CrossRef]
- Van Gaens, W.; Bogaerts, A. Reaction pathways of biomedically active species in an Ar plasma jet. Plasma Sources Sci. Technol. 2014, 23, 27. [Google Scholar] [CrossRef]
- Brunelli, L.; Yermilov, V.; Beckman, J. Modulation of catalase peroxidatic and catalatic activity by nitric oxide. Free Radic. Biol. Med. 2001, 30, 709–714. [Google Scholar] [CrossRef]
- Gebicka, L.; Didik, J. Catalytic scavenging of peroxynitrite by catalase. J. Inorg. Biochem. 2009, 103, 1375–1379. [Google Scholar] [CrossRef] [PubMed]
- Escobar, J.A.; Rubio, M.A.; Lissi, E.A. SOD and catalase inactivation by singlet oxygen and peroxyl radicals. Free Radic. Biol. Med. 1996, 20, 285–290. [Google Scholar] [CrossRef]
- Kim, S.Y.; Kwon, O.J.; Park, J.W. Inactivation of catalase and superoxide dismutase by singlet oxygen derived from photoactivated dye. Biochimie 2001, 83, 437–444. [Google Scholar] [CrossRef]
- Lewis, R.S.; Tamir, S.; Tannenbaum, S.R.; Deen, W.M. KINETIC-ANALYSIS OF THE FATE OF NITRIC-OXIDE SYNTHESIZED BY MACROPHAGES IN-VITRO. J. Biol. Chem. 1995, 270, 29350–29355. [Google Scholar] [CrossRef]
- Nalwaya, N.; Deen, W.M. Nitric oxide, oxygen, and superoxide formation and consumption in macrophage cultures. Chem. Res. Toxicol. 2005, 18, 486–493. [Google Scholar] [CrossRef] [PubMed]
- Attri, P.; Kim, Y.H.; Park, D.H.; Park, J.H.; Hong, Y.J.; Uhm, H.S.; Kim, K.N.; Fridman, A.; Choi, E.H. Generation mechanism of hydroxyl radical species and its lifetime prediction during the plasma-initiated ultraviolet (UV) photolysis. Sci. Rep. 2015, 5, 8. [Google Scholar] [CrossRef] [PubMed]
- Kim, Y.H.; Hong, Y.J.; Baik, K.Y.; Kwon, G.C.; Choi, J.J.; Cho, G.S.; Uhm, H.S.; Kim, D.Y.; Choi, E.H. Measurement of Reactive Hydroxyl Radical Species Inside the Biosolutions During Non-thermal Atmospheric Pressure Plasma Jet Bombardment onto the Solution. Plasma Chem. Plasma Process. 2014, 34, 457–472. [Google Scholar] [CrossRef]
- Switala, J.; Loewen, P.C. Diversity of properties among catalases. Arch. Biochem. Biophys. 2002, 401, 145–154. [Google Scholar] [CrossRef]
- Zuurbier, K.W.M.; Bakkenist, A.R.J.; Wever, R.; Muijsers, A.O. The chlorinating activity of human myeloperoxidase—High initial activity at neutral ph value and activation by electron-donors. Biochim. Biophys. Acta 1990, 1037, 140–146. [Google Scholar] [CrossRef]
- Botti, H.; Moller, M.N.; Steinmann, D.; Nauser, T.; Koppenol, W.H.; Denicola, A.; Radi, R. Distance-Dependent Diffusion-Controlled Reaction of (NO)-N-center dot and O-2(center dot-) at Chemical Equilibrium with ONOO. J. Phys. Chem. B 2010, 114, 16584–16593. [Google Scholar] [CrossRef]
- Candeias, L.P.; Patel, K.B.; Stratford, M.R.L.; Wardman, P. Free hydroxyl radicals are formed on reaction between the neutrophil-derived species superoxide anion and hypochlorous acid. FEBS Lett. 1993, 333, 151–153. [Google Scholar] [CrossRef]
- Fielden, E.M.; Roberts, P.B.; Bray, R.C.; Lowe, D.J.; Mautner, G.N.; Rotilio, G.; Calabrese, L. MEchanism of action of superoxide-dismutase from pulse-radiolysis and electron-paramagnetic resonance—Evidence that only half active-sites function in catalysis. Biochem. J. 1974, 139, 49–60. [Google Scholar] [CrossRef] [PubMed]
- Gutman, M.; Nachliel, E. The dynamic aspects of proton-transfer processes. Biochim. Biophys. Acta 1990, 1015, 391–414. [Google Scholar] [CrossRef]
- Klug, D.; Fridovich, I.; Rabani, J. Direct demonstration of catalytic action of superoxide dismutase through use of pulse radiolysis. J. Biol. Chem. 1972, 247, 4839–4842. [Google Scholar] [PubMed]
- Koppenol, W.H.; Kissner, R. Can O = NOOH undergo homolysis? Chem. Res. Toxicol. 1998, 11, 87–90. [Google Scholar] [CrossRef]
- Logager, T.; Sehested, K. Formation and decay of peroxynitrous acid—A pulse-radiolysis study. J. Phys. Chem. 1993, 97, 6664–6669. [Google Scholar] [CrossRef]
- Lymar, S.V.; Poskrebyshev, G.A. Rate of ON-OO-bond homolysis and the Gibbs energy of formation of peroxynitrite. J. Phys. Chem. A 2003, 107, 7991–7996. [Google Scholar] [CrossRef]
- Merenyi, G.; Lind, J. Free radical formation in the peroxynitrous acid (ONOOH) peroxynitrite (ONOO-) system. Chem. Res. Toxicol. 1998, 11, 243–246. [Google Scholar] [CrossRef]
- Pryor, W.A.; Squadrito, G.L. The chemistry of peroxynitrite—A product from the reaction of nitric-oxide with superoxide. Am. J. Physiol. Lung Cell. Mol. Physiol. 1995, 268, L699–L722. [Google Scholar] [CrossRef]
- Malinski, T.; Taha, Z.; Grunfeld, S.; Patton, S.; Kapturczak, M.; Tomboulian, P. Diffusion of nitric-oxide in the aorta wall monitored in-situ by porphyrinic microsensors. Biochem. Biophys. Res. Commun. 1993, 193, 1076–1082. [Google Scholar] [CrossRef]
- Furtmuller, P.G.; Burner, U.; Regelsberger, G.; Obinger, C. Spectral and kinetic studies on the formation of eosinophil peroxidase compound I and its reaction with halides and thiocyanate. Biochemistry 2000, 39, 15578–15584. [Google Scholar] [CrossRef]
- Takamatsu, T.; Uehara, K.; Sasaki, Y.; Miyahara, H.; Matsumura, Y.; Iwasawa, A.; Ito, N.; Azuma, T.; Kohno, M.; Okino, A. Investigation of reactive species using various gas plasmas. RSC Adv. 2014, 4, 39901–39905. [Google Scholar] [CrossRef]
- Bauer, G. siRNA-based Analysis of the Abrogation of the Protective Function of Membrane-associated Catalase of Tumor Cells. Anticancer Res. 2017, 37, 567–581. [Google Scholar] [CrossRef]
- Di Mascio, P.; Bechara, E.J.H.; Medeiros, M.H.G.; Briviba, K.; Sies, H. Singlet molecular-oxygen production in the reaction of peroxynitrite with hydrogen-peroxide. FEBS Lett. 1994, 355, 287–289. [Google Scholar] [CrossRef]
- Scheit, K.; Bauer, G. Direct and indirect inactivation of tumor cell protective catalase by salicylic acid and anthocyanidins reactivates intercellular ROS signaling and allows for synergistic effects. Carcinogenesis 2015, 36, 400–411. [Google Scholar] [CrossRef] [PubMed]
- Miyamoto, S.; Ronsein, G.E.; Correa, T.C.; Martinez, G.R.; Medeiros, M.H.G.; Mascio, P. Direct evidence of singlet molecular oxygen generation from peroxynitrate, a decomposition product of peroxynitrite. Dalton Trans. 2009, 5720–5729. [Google Scholar] [CrossRef] [PubMed]
- Diaz, A.; Munoz-Clares, R.A.; Rangel, P.; Valdes, V.J.; Hansberg, W. Functional and structural analysis of catalase oxidized by singlet oxygen. Biochimie 2005, 87, 205–214. [Google Scholar] [CrossRef] [PubMed]
- Denicola, A.; Freeman, B.A.; Trujillo, M.; Radi, R. Peroxynitrite reaction with carbon dioxide/bicarbonate: Kinetics and influence on peroxynitrite-mediated oxidations. Arch. Biochem. Biophys. 1996, 333, 49–58. [Google Scholar] [CrossRef]
- Squadrito, G.L.; Pryor, W.A. Mapping the reaction of peroxynitrite with CO2: Energetics, reactive species, and biological implications. Chem. Res. Toxicol. 2002, 15, 885–895. [Google Scholar] [CrossRef]
- Zhuang, S.G.; Demirs, J.T.; Kochevar, I.E. Protein kinase C inhibits singlet oxygen-induced apoptosis by decreasing caspase-8 activation. Oncogene 2001, 20, 6764–6776. [Google Scholar] [CrossRef]
- Selleri, C.; Sato, T.; Raiola, A.M.; Rotoli, B.; Young, N.S.; Maciejewski, J.P. Induction of nitric oxide synthase is involved in the mechanism of Fas-mediated apoptosis in haemopoietic cells. Br. J. Haematol. 1997, 99, 481–489. [Google Scholar] [CrossRef]
- Suzuki, Y.; Ono, Y.; Hirabayashi, Y. Rapid and specific reactive oxygen species generation via NADPH oxidase activation during Fas-mediated apoptosis. FEBS Lett. 1998, 425, 209–212. [Google Scholar] [CrossRef]
- Attri, P.; Park, J.H.; De Backer, J.; Kim, M.; Yun, J.H.; Heo, Y.; Dewilde, S.; Shiratani, M.; Choi, E.H.; Lee, W.; et al. Structural modification of NADPH oxidase activator (Noxa 1) by oxidative stress: An experimental and computational study. Int. J. Biol. Macromol. 2020. [Google Scholar] [CrossRef]
- Coddington, J.W.; Hurst, J.K.; Lymar, S.V. Hydroxyl radical formation during peroxynitrous acid decomposition. J. Am. Chem. Soc. 1999, 121, 2438–2443. [Google Scholar] [CrossRef]
- Crow, J.P.; Spruell, C.; Chen, J.; Gunn, C.; Ischiropoulos, H.; Tsai, M.; Smith, C.D.; Radi, R.; Koppenol, W.H.; Beckman, J.S. On the ph-dependent yield of hydroxyl radical products from peroxynitrite. Free Radic. Biol. Med. 1994, 16, 331–338. [Google Scholar] [CrossRef]
- Gerasimov, O.V.; Lymar, S.V. The yield of hydroxyl radical from the decomposition of peroxynitrous acid. Inorg. Chem. 1999, 38, 4317–4321. [Google Scholar] [CrossRef]
- Kirsch, M.; Korth, H.G.; Wensing, A.; Sustmann, R.; de Groot, H. Product formation and kinetic simulations in the pH range 1-14 account for a free-radical mechanism of peroxynitrite decomposition. Arch. Biochem. Biophys. 2003, 418, 133–150. [Google Scholar] [CrossRef]
- Kissner, R.; Nauser, T.; Kurz, C.; Koppenol, W.H. Peroxynitrous acid—Where is the hydroxyl radical? IUBMB Life 2003, 55, 567–572. [Google Scholar] [CrossRef]
- Richeson, C.E.; Mulder, P.; Bowry, V.W.; Ingold, K.U. The complex chemistry of peroxynitrite decomposition: New insights. J. Am. Chem. Soc. 1998, 120, 7211–7219. [Google Scholar] [CrossRef]
- Yang, G.; Candy, T.E.G.; Boaro, M.; Wilkin, H.E.; Jones, P.; Nazhat, N.B.; Saadallanazhat, R.A.; Blake, D.R. FREE-RADICAL YIELDS FROM THE HOMOLYSIS OF PEROXYNITROUS ACID. Free Radic. Biol. Med. 1992, 12, 327–330. [Google Scholar] [CrossRef]
- Keynes, R.G.; Griffiths, C.; Garthwaite, J. Superoxide-dependent consumption of nitric oxide in biological media may confound in vitro experiments. Biochem. J. 2003, 369, 399–406. [Google Scholar] [CrossRef]
- Bauer, G.; Motz, M. The Antitumor Effect of Single-domain Antibodies Directed Towards Membrane-associated Catalase and Superoxide Dismutase. Anticancer Res. 2016, 36, 5945–5956. [Google Scholar] [CrossRef] [PubMed]
- Rotilio, G.; Fielden, E.M.; Bray, R.C. PULSE RADIOLYSIS STUDY OF SUPEROXIDE DISMUTASE. Biochim. Biophys. Acta 1972, 268, 605–609. [Google Scholar] [CrossRef]
- Huie, R.E.; Padmaja, S. THE REACTION OF NO WITH SUPEROXIDE. Free Radic. Res. Commun. 1993, 18, 195–199. [Google Scholar] [CrossRef]
- Goldstein, S.; Czapski, G. The reaction of no-center-dot with o-2(center-dot-) and ho2-center-dot—A pulse-radiolysis study. Free Radic. Biol. Med. 1995, 19, 505–510. [Google Scholar] [CrossRef]
- Nauser, T.; Koppenol, W.H. The rate constant of the reaction of superoxide with nitrogen monoxide: Approaching the diffusion limit. J. Phys. Chem. A 2002, 106, 4084–4086. [Google Scholar] [CrossRef]
- Andrews, P.C.; Parnes, C.; Krinsky, N.I. Comparison of myeloperoxidase and hemi-myeloperoxidase with respect to catalysis, regulation, and bactericidal activity. Arch. Biochem. Biophys. 1984, 228, 439–442. [Google Scholar] [CrossRef]
- Kissner, R.; Nauser, T.; Bugnon, P.; Lye, P.G.; Koppenol, W.H. Formation and properties of peroxynitrite as studied by laser flash photolysis, high-pressure stopped-flow technique, and pulse radiolysis. Chem. Res. Toxicol. 1997, 10, 1285–1292. [Google Scholar] [CrossRef]
- Safo, M.K.; Musayev, F.N.; Wu, S.H.; Abraham, D.J.; Ko, T.P. Structure of tetragonal crystals of human erythrocyte catalase. Acta Crystallogr. Sect. D Biol. Crystallogr. 2001, 57, 1–7. [Google Scholar] [CrossRef]
- Banci, L.; Benedetto, M.; Bertini, I.; Del Conte, R.; Piccioli, M.; Viezzoli, M.S. Solution structure of reduced monomeric Q133M2 copper, zinc superoxide dismutase (SOD). Why is SOD a dimeric enzyme? Biochemistry 1998, 37, 11780–11791. [Google Scholar] [CrossRef]
- Jordanoglou, J.; Tatsis, G.; Danos, J.; Gougoulakis, S.; Orfanidou, D.; Gaga, M. Alveolar partial pressures of carbon-dioxide and oxygen measured by a helium washout technique. Thorax 1990, 45, 520–524. [Google Scholar] [CrossRef]


| Rate Constant | Value | Reference | Remark |
|---|---|---|---|
| [109] | No information about. | ||
| [116,117] | °C | ||
| [110] | |||
| Assigned | |||
| [112] | |||
| [118] | |||
| [114] | , no information about. | ||
| [115] | , no information about. |
Publisher’s Note: MDPI stays neutral with regard to jurisdictional claims in published maps and institutional affiliations. |
© 2020 by the authors. Licensee MDPI, Basel, Switzerland. This article is an open access article distributed under the terms and conditions of the Creative Commons Attribution (CC BY) license (http://creativecommons.org/licenses/by/4.0/).
Share and Cite
Bengtson, C.; Bogaerts, A. On the Anti-Cancer Effect of Cold Atmospheric Plasma and the Possible Role of Catalase-Dependent Apoptotic Pathways. Cells 2020, 9, 2330. https://doi.org/10.3390/cells9102330
Bengtson C, Bogaerts A. On the Anti-Cancer Effect of Cold Atmospheric Plasma and the Possible Role of Catalase-Dependent Apoptotic Pathways. Cells. 2020; 9(10):2330. https://doi.org/10.3390/cells9102330
Chicago/Turabian StyleBengtson, Charlotta, and Annemie Bogaerts. 2020. "On the Anti-Cancer Effect of Cold Atmospheric Plasma and the Possible Role of Catalase-Dependent Apoptotic Pathways" Cells 9, no. 10: 2330. https://doi.org/10.3390/cells9102330
APA StyleBengtson, C., & Bogaerts, A. (2020). On the Anti-Cancer Effect of Cold Atmospheric Plasma and the Possible Role of Catalase-Dependent Apoptotic Pathways. Cells, 9(10), 2330. https://doi.org/10.3390/cells9102330