Abstract
DNA modifications can be used to monitor pathological processes. We have previously shown that estimating the amount of the main DNA epigenetic mark, 5-methylcytosine (m5C), is an efficient and reliable way to diagnose brain tumors, hypertension, and other diseases. Abnormal increases of reactive oxygen species (ROS) are a driving factor for mutations that lead to changes in m5C levels and cancer evolution. 8-oxo-deoxyguanosine (8-oxo-dG) is a specific marker of ROS-driven DNA-damage, and its accumulation makes m5C a hotspot for mutations. It is unknown how m5C and 8-oxo-dG correlate with the malignancy of gliomas. We analyzed the total contents of m5C and 8-oxo-dG in DNA from tumor tissue and peripheral blood samples from brain glioma patients. We found an opposite relationship in the amounts of m5C and 8-oxo-dG, which correlated with glioma grade in the way that low level of m5C and high level of 8-oxo-dG indicated increased glioma malignancy grade. Our results could be directly applied to patient monitoring and treatment protocols for gliomas, as well as bolster previous findings, suggesting that spontaneously generated ROS react with m5C. Because of the similar mechanisms of m5C and guanosine oxidation, we concluded that 8-oxo-dG could also predict glioma malignancy grade and global DNA demethylation in cancer cells.
1. Introduction
Gliomas are the largest and most diverse group of primary brain tumors [1]. They are subdivided according to their histological and molecular features [2]. Diffuse gliomas, the most abundant subgroup, show broad infiltration in the surrounding central nervous system (CNS) parenchyma. They present the malignancy range from WHO grade II (low grade) to IV (glioblastoma, high grade). Other glial tumors, like pilocytic astrocytomas (WHO grade I), have a more circumscribed growth pattern. Glioblastoma (GBM) is the most frequent diffuse glioma in adults and is the deadliest form with a median patient survival of about one year. GBM cells have the predilection for aggressive invasion into the normal brain tissue and infiltration along the vascular tracts, which limits the possibility of complete tumor resection and reduces the effect of localized radiotherapy. Defects in multiple intracellular signaling pathways are involved in the gliomas’ pathogenesis and lead to the evasion of cell death, which constitutes a hallmark of cancer [3].
Cellular damage accelerates the advancement of degenerative processes, aging, apoptosis, as well as carcinogenesis [4,5]. Reactive oxygen species (ROS) are the main damaging agent of various cell components, including DNA [4]. Under physiological conditions, there is a balance between ROS production and scavenging, as well as oxidative damage to cellular components and their repair [6]. An imbalance between ROS production, antioxidant enzymes, and radical scavenging compounds’ activities indicates cellular stress [7]. Excessive ROS levels are pro-tumorigenic and lead to the activation of pro-survival signaling pathways, generation of oncogenic mutations, loss of tumor suppressor gene-function, adaptations to hypoxia, and increased glucose metabolism [8,9]. Therefore, quantification of ROS in cells has great informative potential for medical diagnosis.
Direct measurement of ROS in biological material is possible, but difficult to apply in the clinical practice [10]. More reliable and useful information is harbored in cellular components, such as the amount of nucleic acid already oxidized by ROS, which can be determined [11,12].
Hydroxyl radical (•OH) is the most reactive among ROS and has a relatively short half-life (10−9 s–10−8 s). It generates a vast range of DNA lesions, including canonical and odd bases modifications, deletions, strand breakages, and chromosomal rearrangements. DNA damage products, being a result of •OH activity, can be used as indicators of cellular oxidative stress. The product of a direct reaction of •OH with guanosine, the most easily oxidizable base, is 8-oxo-7,8-dihydro-2′-deoxyguanosine (8-oxo-dG). 8-oxo-dG mispairs also with adenine, instead of cytosine, and induces G→T transversions [13]. Therefore, oxidative stress and, in consequence, a higher amount of 8-oxo-dG in DNA contribute to changes in cancer cells, such as elevated proliferation rate, chemotherapy resistance, and metastatic ability.
Oxidative damage can also occur with modified DNA constituents, including 5-methylcytosine (m5C), which is the main epigenetic marker [14]. m5C is most commonly found in CpG islands, which are short stretches of DNA with the CG sequence frequency higher than in other regions. m5C presence in DNA influences cell differentiation and development processes [15,16]. The first and most significant epigenetic aberration found in cancer cells is abnormal DNA methylation patterns in CpG islands. In certain cancers, m5C becomes continuously eroded throughout the genome. However, some promoter-associated CpG islands remain or become hypermethylated to act in a process known as ‘CpG island methylator phenotype’, which essentially inactivates tumor suppressor genes [17]. Therefore, DNA methylation changes (m5C) are regarded as a good measure of cancer development and progression [18]. We have previously shown that the total contents of m5C can serve as a marker in the diagnosis of various diseases and aging, as well as for the molecular description of the treatment process [19,20,21,22,23]. Therefore, the implementation of total DNA methylation analysis, rather than more specific methods (like methylation matrices, methylome sequencing), is a useful approach in clinical practice [24,25].
Our study aimed to provide an insight into the potential mechanism and effects of m5C demethylation and oxidative DNA damage in m5CpG dinucleotides of cancer cells. We investigated the relation of m5C and 8-oxo-dG amounts, estimated in DNA isolated from brain glioma tissues and peripheral blood samples, to tumor grade. Our findings revealed a correlation in the level of m5C and 8-oxo-dG that corresponds to glioma malignancy. We noticed an increased level of oxidized guanosine (8-oxo-dG) and loss of m5C (demethylation) in DNA from brain glioma tissues and peripheral blood samples. Our data suggested that dynamic demethylation of m5C in cancer cells was due to random hydroxyl radicals reacting with DNA. To explain that, we described in detail the similarities in mechanisms of m5C loss and guanosine oxidation product formation. We proposed 8-oxo-dG as a solid auxiliary marker for grading gliomas. That additionally reinforced the m5C position as a marker of cancer development and progression through DNA damage and epigenetic deregulation.
2. Materials and Methods
2.1. Collection of Tumor Tissue and Peripheral Blood Samples
The brain glioma tissue samples for this study were collected from 28 glioma patients who underwent tumor surgery at the Department of Neurosurgery and Neurotraumatology of the University of Medical Sciences in Poznan between 2016 and 2017. Peripheral whole blood samples (4.9 mL, in EDTA-coated vials) from another 8 glioma patients were taken preoperatively. The control group consisted of 34 generally healthy individuals, from whom peripheral blood samples were taken. The samples were stored frozen at −80 °C. Demographic and clinical data were collected from the patients’ medical records. Tumors were graded histopathologically, according to the WHO classification.
Peripheral blood and tumor tissue analyses were approved by the Bioethical Committee of Karol Marcinkowski University of Medical Sciences, Poznan (896/9, 838/12). The participants provided a written consent to donate their tissue and blood samples for research.
2.2. Isolation of DNA from Tumor Tissue Samples and Peripheral Blood Samples
DNA isolation from blood and tissue samples was performed, as previously described [19,20,21,23]. DNA purity was controlled with UV absorbance measurements at 260 and 280 nm. In the analyzed set, the A260/A280 ratio for all samples was 2.0–2.1.
2.3. Analysis of m5C Contents in DNA
DNA hydrolysis, labeling, and TLC chromatography were performed as previously described [19,20,21,22,23]. The radioactive intensity of spots corresponding to m5C, C (cytosine), and T (thymine) was used for calculations. The data obtained with the post labeling and TLC methods were compared to the ELISA assay [26].
2.4. Analysis of 8-oxo-dG Contents in DNA
DNA was dissolved in 200 µL of a buffer (pH 5.3) containing 40 mM sodium acetate and 0.1 mM ZnCl2, then mixed with nuclease P1 (Sigma-Aldrich, St. Louis, MO, USA) solution (30 µg), and incubated for 3 h at 37 °C. Then, 30 µL of 1M Tris–HCl pH 8.0 and 5 µL of alkaline phosphatase (1.5 units) solution were added, following with 1 h incubation at 37 °C. DNA hydrolysate was purified using cut-off 10,000 Da filter units. 8-oxo-dG amount in DNA was determined using HPLC (Agilent Technologies 1260 Infinity, Santa. 25. Clara, CA, USA) with two detectors working in series: 1260 Diode Array Detector and Coulochem III Electrochemical Detector (ESA Inc., Chelmsford, MA, USA). Isocratic chromatography of DNA hydrolysate was performed using a solution of 50 mM CH3COONH4 at pH 5.3 and methanol (93:7). Analysis of dG for reference was performed at 260 nm. 8-oxo-dG was determined with the following electrochemical detection settings: guard cell +400 mV, detector 1: +130 mV (screening electrode), detector 2: +350 mV (measuring electrode set on the 100 nA sensitivity).
2.5. Calculation of the Total Amount of M5c And 8-Oxo-Dg in Human DNA
The amount of modified bases in DNA was calculated on the basis of global genome composition—3.2 × 10⁹ bases (100%), where C—663 × 106 (20%), T—954 × 106 (29%), G—663 × 106 (20%), A—954 × 106 (29%), and m5C—33 × 106 (1%) [27]. Amount of m5C (%) in pyrimidines in DNA was determined from TLC analysis with formula R[%] = m5C × 100/(C + T). The total number of m5C in the genome was calculated from formula m5C = (1,584,257,992) × R/100 [27].
The input amount of guanosine was necessary to determine 8-oxo-dG contents. It was calculated from Diode Array Detector (PAD) measurements using Avogadro number NG = 6.02 × 10²⁰ × b(mAU)/a(mAU) standard. 8-oxo-dG nucleoside amount was estimated with electrochemical detector N8-oxo-dG = 6.02 × 10²⁰ × d(nA)/c(nA) standard. The total number of 8-oxo-dG = 663 × 106 × N8-oxo-dG/NG (Figure 1).
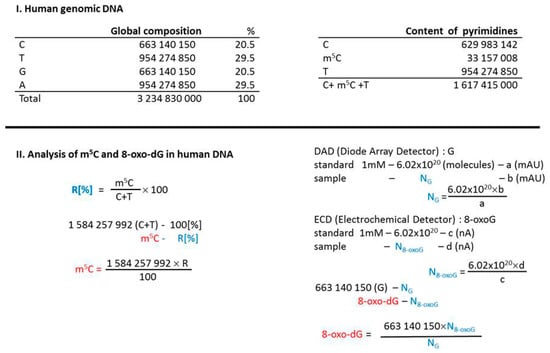
Figure 1.
Calculations leading to determine the 5-methylcytosine (m5C) and 8-oxo-deoxyguanosine (8-oxo-dG) contents in examined DNA samples. Human genomic DNA composition data were taken from [27].
2.6. Statistical Analysis
Unless otherwise specified, the results were expressed as the mean ± SD (Standard Deviation) in the error bars, and the data were collected from three independent analyses. Statistical significance was determined using the STATISTICA software, 1998 edition (StatSoft Poland, 1995–2008), as in our previous studies [28], by ANOVA test, and a p-value <0.05 was considered as significant.
3. Results
3.1. Patients’ Characteristics
The analyzed cohort consisted of 36 individuals diagnosed with brain glioma, aged from 19 to 81 years (Table S1 and S2). The median patient’s age at the time of tumor surgery was 53.1 ± 13.3 years. There were 21 (58.3%) males and 15 (41.7%) females. The tumors were mainly primary (i.e., the samples were taken before any other oncological treatment), but the cohort included some cases of recurrent gliomas (those undergone previously first surgery, radiotherapy, and chemotherapy) (Table S1 and S2). The control group consisted of 34 generally healthy persons, aged from 18 to 66 years (mean 43.1 ± 14.5 years), with 15 (44.1%) males and 19 (55.9%) females (Table S3).
3.2. Total Contents of m5C and 8-oxo-dG in DNA from Tumor Tissue Samples
For 28 patients, the total level of m5C and 8-oxo-dG in genomic DNA from brain tumor tissue was analyzed (Table S1). There were variations in the contents of both compounds in the tumor histological subgroups, most clearly seen for glioblastoma group, reflecting the heterogeneity of those tumors (Table S1, Figure 2).
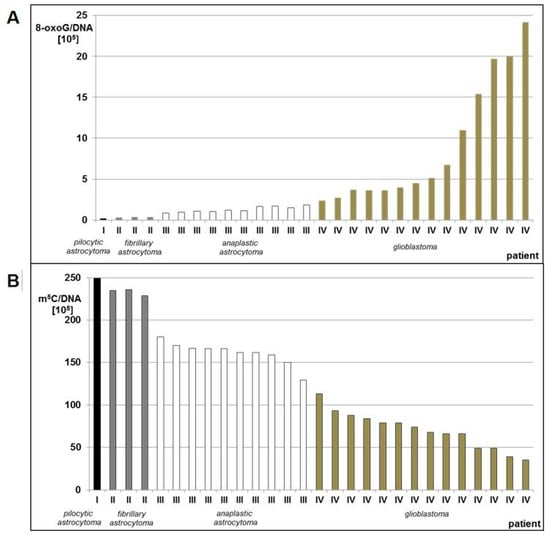
Figure 2.
8-oxo-dG (A) and m5C (B) contents in DNA from human brain tumors tissues classified as pilocytic astrocytoma (WHO I), fibrillary astrocytoma (WHO II), anaplastic astrocytoma (WHO III), and glioblastoma (WHO IV).
We observed a significant stepwise increase of 8-oxo-dG contents in DNA from brain glioma tissue with increasing tumor malignancy. Glioblastoma (WHO IV) had 12–121 times higher amount of 8-oxo-dG than pilocytic astrocytoma (WHO I) (Table S1, Figure 2A). Low levels of total DNA methylation were concomitant with high levels of 8-oxo-dG and in higher grade gliomas. The m5C amount in pilocytic astrocytoma (WHO I) was 2–7 times higher than glioblastoma (WHO IV) (Table S1, Figure 2B). The number of m5C residues in relation to the number of 8-oxo-dG residues was ca. 1000:1 in low grade (WHO I-II) gliomas, and dropped significantly to ca. 100:1 or less in high grade (WHO III-IV) tumors, indicating higher DNA damage (Table S2).
The mean amounts of 8-oxo-dG were increasing with increasing tumor grade, while total DNA methylation was decreasing (Figure 3). The differences between the subgroups comprising tumors of the same grade were statistically significant. The ANOVA test for 8-oxo-dG showed F= 4.873 and p = 0.009; only for WHO groups III and IV, F = 10.346, p = 0.004; whereas for m5C, F = 107.194 and p < 0.005.
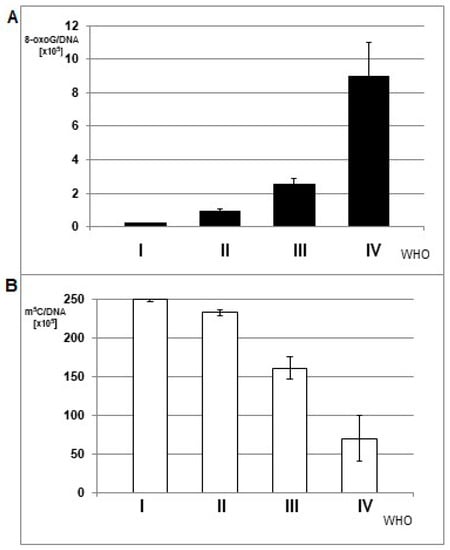
Figure 3.
The mean amount of 8-oxo-dG (A) and m5C (B) in DNA from brain glioma tissues of different malignancy grade (WHO I-IV).
The application of an exponential one-phase decay function for m5C in relation to 8-oxo-dG showed an extremely high correlation coefficient of 0.9804 (Figure 4). A clear trend was observed that a small increase in 8-oxo-dG contents led to great depletion in m5C amount.
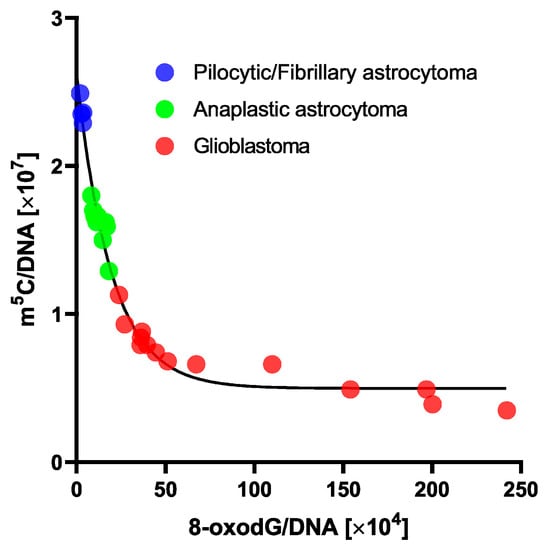
Figure 4.
One phase decay curve of m5C in relation to 8-oxo-dG contents in DNA from human brain tumors tissues. 8-oxo-dG allows subdividing gliomas within a similar total DNA methylation level.
3.3. Total DNA Methylation and 8-oxo-dG Contents in Peripheral Blood Samples
For eight glioma patients, we analyzed the total level of m5C and 8-oxo-dG in genomic DNA from peripheral blood samples (Table S2). The group included seven glioblastoma (WHO IV) patients along with one anaplastic astrocytoma (WHO III) for comparison. The total DNA methylation levels were almost equal in that group (Table S2, Figure 5).
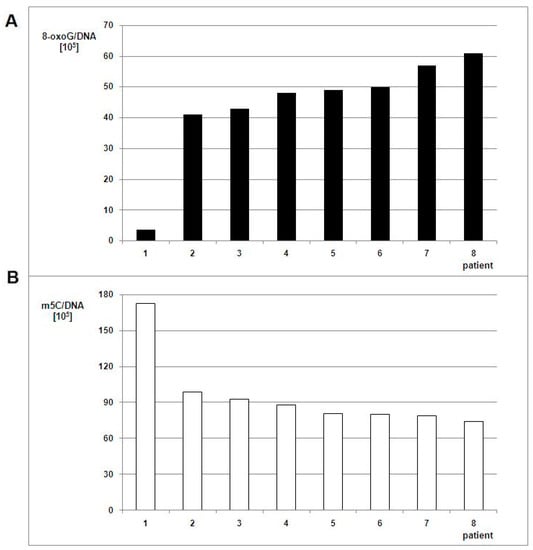
Figure 5.
8-oxo-dG (A) and m5C (B) contents in DNA from the peripheral blood of patients with brain tumors. The white bars correspond to m5C contents, the black ones to the number of 8-oxo-dG nucleosides in DNA.
The relationship of m5C and 8-oxo-dG contents observed for peripheral blood samples was similar to those from glioma tissues. The amount of m5C was 1.7–2.3 times lower and 8-oxo-dG 11.4–16.9 times higher in WHO IV samples when compared to the WHO III sample.
The differences between m5C and 8-oxo-dG contents for blood samples in glioma patients versus the control group were statistically significant. In the control group of generally healthy individuals, the mean m5C contents in DNA was 314 ± 31 × 105 (Figure 6), so significantly higher than in the brain glioma WHO III-IV group (Table S2, Figure 5). It has been already reported that the amount of 8-oxo-dG in normal human cells’ DNA is of 1 base per 107 guanosine residues [29]. The relation of the 8-oxo-dG contents with subjects’ older age showed clear increase: 4.63 ± 1.11 (for mean age 13), 3.59 ± 1.60 (for mean age 31), 4.82 ± 1.62 (for mean age 50), and 5.79 ± 2.22 (for mean age 67) per 106 guanosine residues [30]. We calculated 8-oxo-dG amounts per whole genome (DNA). The 8-oxo-dG contents in peripheral blood DNA of glioma patients were substantially higher. The one-way ANOVA test values were F = 309.347 and p < 0.005 for total DNA methylation in glioma and control group, and F = 49.966 and p < 0.005 for 8-oxo-dG contents between glioma group and the literature data [29].
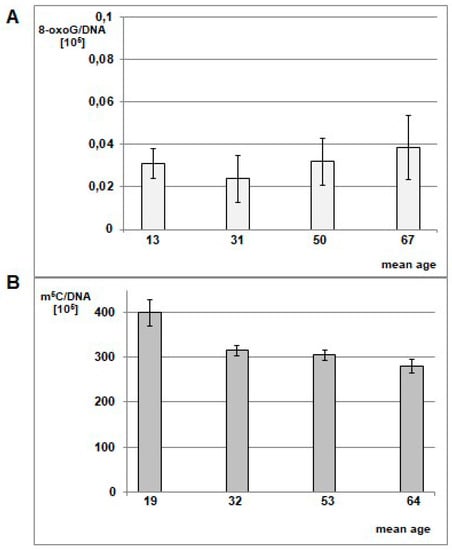
Figure 6.
Mean level of 8-oxo-dG (A) in leukocyte DNA in healthy individuals cohort divided into mean age groups of 13, 31, 50, and 67 y.o. The graph was prepared based on data taken from Siomek et al. 2007 [30], 8-oxo-dG values were recalculated per genome. One can see the minute amounts of 8-oxo-dG in healthy subjects. (B) Mean amount of m5C in DNA from peripheral blood samples of healthy individuals in different age groups. The cohort (Table S3) was divided into 4 age groups: <21 y.o. (mean age 19), 21–40 y.o. (mean age 32), 41–60 y.o. (mean age 53), >60 y.o. (mean age 64). The amounts of m5C were significantly higher than in glioma patients.
4. Discussion
Currently, there is a need for better complex disease characterization on the molecular level that can assist clinicians in identification and optimal treatment of brain gliomas. Molecular markers turned out to be a powerful aid for clinical diagnostics, precise treatment implementation, and estimating clinical outcomes [31]. DNA hypomethylation is an exceptionally frequent change linked to numerous neoplasms [32,33]. Carcinogenesis is also linked to the overproduction of reactive oxygen species, including superoxide radical, hydroxyl radical and hydrogen peroxide, as well as a shortage of antioxidants [34]. ROS levels in cancer cells are typically higher than physiologic because of increased metabolic activity, cellular signaling, oncogene activity, and mitochondrial dysfunction [35,36].
The brain is especially susceptible to the damaging effects of ROS because of its high metabolic activity, oxygen consumption, and low capacity for cellular regeneration [5]. The impact of ROS, as well as reactive nitrogen species (RNS), on gliomagenesis have been described, mainly in signal transduction and metabolomics aspects [37,38].
We previously showed that there’s a clear correlation between total DNA methylation and brain tumor malignancy, in tumor tissues as well as in peripheral blood samples [19,21,23]. We also identified single papers that estimated 8-oxo-dG in glioma tissues, noticing the relation of higher oxidative stress with tumor malignancy [39,40,41]. In the present study, we focused on the comparison between m5C, a DNA epigenetic marker, and 8-oxo-dG, which is an established well-known oxidative damage marker, in glioma tissues and peripheral blood samples. Both nucleosides frequently occur in m5CpG dinucleotides [42]. One previous study on genome-wide methylation profiling in pediatric glioblastoma showed a possible association of ROS with pediatric GBM. Gene Ontology analysis performed there showed that the pediatric GBM-specific methylome identified the “superoxide metabolic process” and the “oxygen and ROS metabolic process”, indicating ROS action as a driving phenomenon in those tumors [43]. What is unique in our present findings is that for the first time we’ve shown a direct correlation between the oxidative DNA damage (monitored by 8-oxo-dG) and epigenetic regulation (through total m5C), and their relation with tumor malignancy. Moreover, 8-oxo-dG allowed subdividing gliomas within a similar total DNA methylation level (Figure 4). That is a step further than nowadays existing classification systems [1], and holds a potential for better patient stratification in terms of treatment planning and prognosis.
The •OH radical diffusion rate properties and ability to react with DNA is confined to short distances, limited to 2 nm in cells and tissues. Therefore, it acts seemingly at generation sites [44]. The Fenton reaction is the most common source of •OH in the cell [45]. It involves reduced redox-active metal ions, as ferrous and cuprous, that react with metabolically produced hydrogen peroxide (H2O2). There is usually the site-specific output of •OH from Fenton-like reactions, for example, including metal ions close to or bound to DNA [44].
Guanine (G) is the most susceptible to oxidation (lowest redox potential, 1.29 mV) out of the four DNA bases [42]. The 8-oxo-dG redox potential is even lower, 0.74 mV, which results in its further oxidation [46]. That property is explored for electrochemical analyses of this compound at a picomol level [47]. To determine the extent of oxidative stress to which a cell has been exposed, the cellular level of 8-oxo-dG in the genome can be estimated and regarded as a status of oxidative stress leading to mutations [48]. The frequency for 8-oxo-dG to cause de novo spontaneous and heritable G→T transversion mutations in mice was estimated at the range of ~1% [49]. There is a steady-state level of ~30,000 8-oxo-dGs (mouse embryonic stem cell) that theoretically generates ~300 mutation events during replication [50]. m5C deamination can also lead to C→T transition [51]. In mouse embryonic stem cells there are ~50 million m5C sites that could result in ~1000 mutations [50]. Therefore, it can be estimated that m5C leads to ~3-fold more mutations than 8-oxo-dG. That corresponds to deep genome sequencing studies that identified more C→T than G→T mutations [52]. Moreover, the presence of 8-oxo-dG negatively affects adjacent sites of DNA methylation and suppresses methylation of nascent DNA strand one or two base pairs away from the damaged guanine [53,54]. On the other hand, DNA methylation may influence the mutagenic effect of ROS [55].
The demarcation between genetic (mutations) and epigenetic DNA modifications is blurred. The oxidative damage to m5C is extremely important for the formation of epimutations [56], as well as for its function as an epigenetic regulator [15,16,32]. Therefore, it should lead to a reevaluation of modifications that are considered mutagenic.
A parallel analysis of m5C (epigenetic mark) and 8-oxo-dG (oxidation marker) provides a challenge of the biological significance of an enzymatic m5C hydroxylation mechanism leading to DNA demethylation in brain tumors. Data are showing that Ten-eleven translocation (TET) proteins are responsible for m5C oxidation and, in fact, demethylation [57]. They cause hydroxylation of the m5C methyl group forming 5-hydroxymethylcytosine (5hmC), 5-formylcytosine (5fC), and 5-carboxylcytosine (5caC). TET-mediated m5C oxidation is considered as an active DNA demethylation mechanism for genome stability. DNA demethylation sites are concomitant with base excision repair. 8-Oxoguanine glycosylase (OGG1) binds and recruits TET1 to the 8-oxo-G adjacent m5C sites to prevent mutations [58]. Tet2 is responsible for marking sites of DNA-damage with 5hmC [59]. Cancer genomes are characterized by focal DNA hypermethylation, co-existing with widespread hypomethylation. However, recent data show, that even in the case of TET loss of function, general loss of DNA methylation occurs [60]. That raises the question about the exact mechanism of oxidative DNA modifications.
It is generally accepted that 8-oxo-dG formation is the result of the attack of •OH on carbon 8 (C8) of guanosine, which is the most reactive site easily available to •OH in the major groove of DNA (Figure 7).
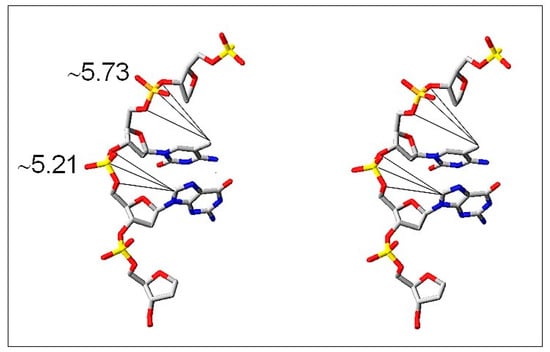
Figure 7.
Stereo view of the major groove of DNA where m5C and guanosine (C-8) are located and are freely available for the reaction with •OH. It is indicated by distances (Å) of the reactive sites (-CH3 of m5C and C-8 of G) from a phosphodiester group of the nucleotide (modified from [61]).
The question arises whether m5C, a neighbor nucleoside in m5CpG dinucleotide, is reacting with •OH (Figure 7). The hydrophobic methyl group of m5C protrudes into the major groove of DNA double helix and is prone to •OH attack. A direct oxidation product of m5C is 5hmC [62]. Moreover, oxidation of m5C induces final loss of a methyl group in the form of formaldehyde or formic acid [63]. Further support for that observation is a relatively low ratio (3–5) of the methyl group modification in comparison to guanosine modification. It is a result of a small efficiency of hydrogen abstraction from a methyl group and formation of C–CH2•. Our data provide strong support for ROS-induced demethylation of DNA in glioma patients’ samples. Furthermore, it was demonstrated that ROS-mediated DNA oxidation that yields 8-oxo-dG in gene promoters is a signal for gene activation. The presence of 8-oxo-dG in a G-quadruplex-forming promoter sequence resulted in ca. 300% in gene expression increase [64]. A comparison of 8-oxo-dG yield and m5C loss in human brain tumors of different malignancy strongly suggests that both nucleosides are modified by ROS, particularly by •OH, during oxidative stress conditions.
There is no doubt that elevated ROS rates promote tumor development and progression [36]. However, the relations of DNA methylation changes with cancer are less obvious. Cancer-linked DNA hypermethylation includes promoters of tumor suppressor genes resulting in repression of gene expression, thereby facilitating cancer formation. Global DNA hypomethylation during the neoplastic process doesn’t have such straightforward relation but is observed in many tumors, and results in global gene expression deregulation [65]. It is also observed during cellular senescence [20]. It is generally accepted that the antineoplastic effect of chemotherapeutic drugs is due to the induction of oxidative stress and ROS-mediated cell injury [66]. In the same way, DNA demethylation agents are used [67]. But is the way of complete oxidative damage of the cell the right way of oncological treatment? The cells that survive such therapy are highly resistant to any treatment and produce aggressive recurrences. Moreover, significant harm is done to normal organism’s cells [66]. Based on the results of our study, it may be presumed that the opposite actions should be promoted and DNA hypermethylating strategies should be concerned. Antioxidants’ intake is a well-known prophylactic and treatment supporting method. They generally increase the response rate to chemotherapy, help restore proper redox balance of the organism, and some even impact patients’ survival [68]. The examples are also known for brain gliomas [69]. Besides adding them to the therapeutic regimen, one can explore the ROS-scavenging properties of already used drugs. In the case of brain gliomas, mannitol, the widely used medication against brain edema, presents such effects [70]. That detail can impact the extension of its use in therapy.
5. Conclusions
We showed that brain gliomas were characterized by strong oxidative stress, which resulted in global DNA damage. Two different types of DNA modifications, mainly occurring randomly, were characterized. 8-oxo-dG levels were indicative for increased oxidative stress, DNA damage, and therefore higher tumor malignancy. In parallel, DNA demethylation was observed, resulting in pathological DNA gene expression.
Supplementary Materials
The following are available online at https://www.mdpi.com/2073-4409/8/9/1065/s1. Table S1. The characteristics of 28 patients for whom the contents of m5C (post labeling method) and 8-oxo-dG (electrochemical detector) in DNA from tumor tissue were analyzed, as well as patients’ clinical characteristics. Table S2. The characteristics of 8 patients with WHO III and IV brain gliomas for whom the contents of m5C (post labeling method) and 8-oxo-dG (electrochemical detector) in DNA from peripheral blood samples were analyzed, as well as patients’ clinical characteristics. Table S3. The characteristics of 34 healthy individuals comprising the control group for whom the contents of m5C (postlabeling method) in DNA from peripheral blood samples was analysed.
Author Contributions
Conceptualization, A.-M.B. and M.N.-B.; methodology, A.-M.B., M.G.-P.; investigation, A.-M.B., M.G.-P.; data curation, A.-M.B., M.G.-P.; formal analysis, A.-M.B., M.N.-B.; writing—original draft preparation, A.-M.B.; writing—review and editing, P.M.P., M.N.-B.; visualization, A.-M.B., P.M.P.; supervision, M.N.-B.
Funding
P.M.P. is supported by SONATA 11 (2016/21/D/NZ3/00641) grant from the National Science Center, Poland.
Conflicts of Interest
The authors declare no conflict of interest.
References
- Louis, D.N.; Perry, A.; Reifenberger, G.; Von Deimling, A.; Figarella-Branger, D.; Cavenee, W.K.; Ohgaki, H.; Wiestler, O.D.; Kleihues, P.; Ellison, D.W. The 2016 World Health Organization Classification of Tumors of the Central Nervous System: a summary. Acta Neuropathol. 2016, 131, 803–820. [Google Scholar] [CrossRef] [PubMed]
- Wesseling, P.; Capper, D. WHO 2016 Classification of gliomas. Neuropathol. Appl. Neurobiol. 2018, 44, 139–150. [Google Scholar] [CrossRef] [PubMed]
- Nakada, M.; Kita, D.; Watanabe, T.; Hayashi, Y.; Teng, L.; Pyko, I.V.; Hamada, J.-I. Aberrant Signaling Pathways in Glioma. Cancers 2011, 3, 3242–3278. [Google Scholar] [CrossRef] [PubMed]
- Valko, M.; Rhodes, C.; Moncol, J.; Izakovic, M.; Mazur, M. Free radicals, metals and antioxidants in oxidative stress-induced cancer. Chem. Interactions 2006, 160, 1–40. [Google Scholar] [CrossRef] [PubMed]
- Waris, G.; Ahsan, H. Reactive oxygen species: role in the development of cancer and various chronic conditions. J. Carcinog. 2006, 5, 14. [Google Scholar] [CrossRef] [PubMed]
- Trachootham, D.; Alexandre, J.; Huang, P. Targeting cancer cells by ROS-mediated mechanisms: a radical therapeutic approach? Nat. Rev. Drug Discov. 2009, 8, 579–591. [Google Scholar] [CrossRef] [PubMed]
- Poprac, P.; Jomova, K.; Simunkova, M.; Kollar, V.; Rhodes, C.J.; Valko, M. Targeting Free Radicals in Oxidative Stress-Related Human Diseases. Trends Pharmacol. Sci. 2017, 38, 592–607. [Google Scholar] [CrossRef] [PubMed]
- Sabharwal, S.S.; Schumacker, P.T. Mitochondrial ROS in cancer: initiators, amplifiers or an Achilles’ heel? Nat. Rev. Cancer 2014, 14, 709–721. [Google Scholar] [CrossRef] [PubMed]
- Levine, A.J.; Puzio-Kuter, A.M. The Control of the Metabolic Switch in Cancers by Oncogenes and Tumor Suppressor Genes. Science 2010, 330, 1340–1344. [Google Scholar] [CrossRef]
- Cheng, G.; Zielonka, M.; Dranka, B.; Kumar, S.N.; Myers, C.R.; Bennett, B.; Garces, A.M.; Machado, L.G.D.D.; Thiebaut, D.; Ouari, O.; et al. Detection of mitochondria-generated reactive oxygen species in cells using multiple probes and methods: Potentials, pitfalls, and the future. J. Boil. Chem. 2018, 293, 10363–10380. [Google Scholar] [CrossRef]
- Dąbrowska, N.; Wiczkowski, A. Analytics of oxidative stress markers in the early diagnosis of oxygen DNA damage. Adv. Clin. Exp. Med. 2017, 26, 155–166. [Google Scholar] [CrossRef]
- Umeno, A.; Biju, V.; Yoshida, Y. In vivo ROS production and use of oxidative stress–derived biomarkers to detect the onset of diseases such as Alzheimer’s disease, Parkinson’s disease, and diabetes. Free. Radic. Res. 2017, 51, 1–41. [Google Scholar] [CrossRef]
- Fleming, A.M.; Burrows, C.J. 8-Oxo-7,8-dihydroguanine, friend and foe: Epigenetic-like regulator versus initiator of mutagenesis. DNA Repair 2017, 56, 75–83. [Google Scholar] [CrossRef] [PubMed]
- Feil, R.; Fraga, M.F. Epigenetics and the environment: emerging patterns and implications. Nat. Rev. Genet. 2012, 13, 97–109. [Google Scholar] [CrossRef] [PubMed]
- Horvath, S. DNA methylation age of human tissues and cell types. Genome Boil. 2013, 14, R115. [Google Scholar] [CrossRef] [PubMed]
- Moore, L.D.; Le, T.; Fan, G. DNA methylation and its basic function. Neuropsychopharmacology 2013, 38, 23–38. [Google Scholar] [CrossRef] [PubMed]
- Lokk, K.; Modhukur, V.; Rajashekar, B.; Märtens, K.; Magi, R.; Kolde, R.; Koltsina, M.; Nilsson, T.K.; Vilo, J.; Salumets, A.; et al. DNA methylome profiling of human tissues identifies global and tissue-specific methylation patterns. Genome Boil. 2014, 15, r54. [Google Scholar] [CrossRef]
- Armstrong, D.A.; Lesseur, C.; Conradt, E.; Lester, B.M.; Marsit, C.J. Global and genespecific DNA methylation across multiple tissues in early infancy: implications for children’s health research. FASEB J. 2014, 28, 2088–2097. [Google Scholar] [CrossRef]
- Zukiel, R.; Nowak, S.; Barciszewska, A.-M.; Gawronska, I.; Keith, G.; Barciszewska, M.Z. A simple epigenetic method for the diagnosis and classification of brain tumors. Mol. Cancer Res. 2004, 2, 196–202. [Google Scholar] [PubMed]
- Barciszewska, M.Z.; Barciszewska, A.M.; Rattan, S.I.S. TLC-based detection of methylated cytosine: application to aging epigenetics. Biogerontology 2007, 8, 673–678. [Google Scholar] [CrossRef]
- Barciszewska, A.-M.; Nowak, S.; Naskręt-Barciszewska, M.Z. The Degree of Global DNA Hypomethylation in Peripheral Blood Correlates with That in Matched Tumor Tissues in Several Neoplasia. PLoS ONE 2014, 9, e92599. [Google Scholar] [CrossRef] [PubMed]
- Barciszewska, A.-M.; Gurda, D.; Głodowicz, P.; Nowak, S.; Naskręt-Barciszewska, M.Z. A New Epigenetic Mechanism of Temozolomide Action in Glioma Cells. PLoS ONE 2015, 10, e0136669. [Google Scholar] [CrossRef] [PubMed]
- Barciszewska, A.-M. Global DNA demethylation as an epigenetic marker of human brain metastases. Biosci. Rep. 2018, 38, 20180731. [Google Scholar] [CrossRef] [PubMed]
- Umer, M.; Herceg, Z. Deciphering the Epigenetic Code: An Overview of DNA Methylation Analysis Methods. Antioxidants Redox Signal. 2013, 18, 1972–1986. [Google Scholar] [CrossRef] [PubMed]
- Bhattacharjee, R.; Moriam, S.; Umer, M.; Nguyen, N.-T.; Shiddiky, M.J.A. DNA methylation detection: recent developments in bisulfite free electrochemical and optical approaches. Analyst 2018, 143, 4802–4818. [Google Scholar] [CrossRef] [PubMed]
- Lewandowska-Gnatowska, E.; Polkowska-Kowalczyk, L.; Szczegielniak, J.; Barciszewska, M.; Barciszewski, J.; Muszyńska, G. Is DNA methylation modulated by wounding-induced oxidative burstin maize? Plant. Physiol. Biochem. 2014, 82, 202–208. [Google Scholar] [CrossRef] [PubMed]
- Venter, J.C.; Adams, M.D.; Myers, E.W.; Li, P.W.; Mural, R.J.; Sutton, G.G.; Smith, H.O.; Yandell, M.; Evans, C.A.; Holt, R.A.; et al. The sequence of the human genome. Science 2001, 291, 1304–1351. [Google Scholar] [CrossRef] [PubMed]
- Michalak, M.; Barciszewska, M.Z.; Barciszewski, J.; Plitta, B.P.; Chmielarz, P. Global Changes in DNA Methylation in Seeds and Seedlings of Pyrus communis after Seed Desiccation and Storage. PLoS ONE 2013, 8, e70693. [Google Scholar] [CrossRef] [PubMed]
- Nakabeppu, Y. Cellular Levels of 8-Oxoguanine in either DNA or the Nucleotide Pool Play Pivotal Roles in Carcinogenesis and Survival of Cancer Cells. Int. J. Mol. Sci. 2014, 15, 12543–12557. [Google Scholar] [CrossRef] [PubMed]
- Siomek, A.; Gackowski, D.; Rozalski, R.; Dziaman, T.; Szpila, A.; Guz, J.; Olinski, R. Higher Leukocyte 8-Oxo-7,8-Dihydro-2’-Deoxyguanosine and Lower Plasma Ascorbate in Aging Humans? Antioxidants Redox Signal. 2007, 9, 143–150. [Google Scholar] [CrossRef] [PubMed]
- Khan, I.N.; Ullah, N.; Hussein, D.; Saini, K.S. Current and emerging biomarkers in tumors of the central nervous system: Possible diagnostic, prognostic and therapeutic applications. Semin. Cancer Boil. 2018, 52, 85–102. [Google Scholar] [CrossRef] [PubMed]
- Dong, Y.; Zhao, H.; Li, H.; Li, X.; Yang, S. DNA methylation as an early diagnostic marker of cancer (Review). Biomed. Rep. 2014, 2, 326–330. [Google Scholar] [CrossRef] [PubMed]
- Feinberg, A.P.; Tycko, B. The history of cancer epigenetics. Nat. Rev. Cancer 2004, 4, 143–153. [Google Scholar] [CrossRef] [PubMed]
- Birben, E.; Sahiner, U.M.; Sackesen, C.; Erzurum, S.; Kalayci, O. Oxidative Stress and Antioxidant Defense. World Allergy Organ. J. 2012, 5, 9–19. [Google Scholar] [CrossRef] [PubMed]
- Szatrowski, T.P.; Nathan, C.F. Production of large amounts of hydrogen peroxide by human tumor cells. Cancer Res. 1991, 51, 794–798. [Google Scholar]
- Liou, G.Y.; Storz, P. Reactive oxygen species in cancer. Free Radic. Res. 2010, 44, 479–496. [Google Scholar] [CrossRef]
- Conti, A.; Gulì, C.; La Torre, D.; Tomasello, C.; Angileri, F.F.; Aguennouz, M. Role of Inflammation and Oxidative Stress Mediators in Gliomas. Cancers 2010, 2, 693–712. [Google Scholar] [CrossRef] [PubMed]
- Salazar-Ramiro, A.; Ramírez-Ortega, D.; Pérez de la Cruz, V.; Hérnandez-Pedro, N.Y.; González-Esquivel, D.F.; Sotelo, J.; Pineda, B. Role of Redox Status in Development of Glioblastoma. Front. Immunol. 2016, 7, 156. [Google Scholar] [CrossRef]
- Nowak, S.; Zukiel, R.; Olsen, A.; Siboska, G.; Gawrońska, I.; Barciszewski, J. [8-oxoguanosine as a marker of neoplastic process in brain]. Neurol. Neurochir. Pol. 1999, 33, 1339–1348. [Google Scholar]
- Iida, T.; Furuta, A.; Kawashima, M.; Nishida, J.-I.; Nakabeppu, Y.; Iwaki, T. Accumulation of 8-oxo-2′-deoxyguanosine and increased expression of hMTH1 protein in brain tumors. Neuro-Oncology 2001, 3, 73–81. [Google Scholar]
- Hardiany, N.S.; Mulyawan, W.; Wanandi, S.I. Correlation between oxidative stress and tumor grade in glioma cells from patients in Jakarta. Med. J. Indones. 2012, 21, 122–127. [Google Scholar] [CrossRef]
- Sassa, A.; Çağlayan, M.; Dyrkheeva, N.S.; Beard, W.A.; Wilson, S.H. Base Excision Repair of Tandem Modifications in a Methylated CpG Dinucleotide. J. Boil. Chem. 2014, 289, 13996–14008. [Google Scholar] [CrossRef] [PubMed]
- Jha, P.; Patric, I.R.P.; Shukla, S.; Pathak, P.; Pal, J.; Sharma, V.; Thinagararanjan, S.; Santosh, V.; Suri, V.; Sharma, M.C.; et al. Genome-wide methylation profiling identifies an essential role of reactive oxygen species in pediatric glioblastoma multiforme and validates a methylome specific for H3 histone family 3A with absence of G-CIMP/isocitrate dehydrogenase 1 mutation. Neuro-Oncology 2014, 16, 1607–1617. [Google Scholar] [CrossRef] [PubMed][Green Version]
- Cadet, J.; Wagner, J.R. DNA Base Damage by Reactive Oxygen Species, Oxidizing Agents, and UV Radiation. Cold Spring Harb. Perspect. Boil. 2013, 5, a012559. [Google Scholar] [CrossRef] [PubMed]
- Winterbourn, C.C. Reconciling the chemistry and biology of reactive oxygen species. Nat. Methods 2008, 4, 278–286. [Google Scholar] [CrossRef] [PubMed]
- Radak, Z.; Boldogh, I. 8-oxo-7,8-dihydroguanine: Link to gene expression, aging and defense against oxidative stress. Free. Radic. Boil. Med. 2010, 49, 587–596. [Google Scholar] [CrossRef]
- Park, E.M.; Shigenaga, M.K.; Degan, P.; Korn, T.S.; Kitzler, J.W.; Wehr, C.M.; Kolachana, P.; Ames, B.N. Assay of excised oxidative DNA lesions: isolation of 8-oxoguanine and its nucleoside derivatives from biological fluids with a monoclonal antibody column. Proc. Natl. Acad. Sci. USA 1992, 89, 3375–3379. [Google Scholar] [CrossRef] [PubMed]
- Gedik, C.M.; Collins, A. ESCODD (European Standards Committee on Oxidative DNA Damage). Establishing the background level of base oxidation in human lymphocyte DNA: results of an interlaboratory validation study. FASEB J. 2005, 19, 82–84. [Google Scholar] [CrossRef] [PubMed]
- Ohno, M.; Sakumi, K.; Fukumura, R.; Furuichi, M.; Iwasaki, Y.; Hokama, M.; Ikemura, T.; Tsuzuki, T.; Gondo, Y.; Nakabeppu, Y. 8-oxoguanine causes spontaneous de novo germline mutations in mice. Sci. Rep. 2014, 4, 4689. [Google Scholar] [CrossRef]
- Pfaffeneder, T.; Spada, F.; Wagner, M.; Brandmayr, C.; Laube, S.K.; Eisen, D.; Truss, M.; Steinbacher, J.; Hackner, B.; Kotljarova, O.; et al. Tet oxidizes thymine to 5-hydroxymethyluracil in mouse embryonic stem cell DNA. Nat. Methods 2014, 10, 574–581. [Google Scholar] [CrossRef]
- Cooper, D.N.; Mort, M.; Stenson, P.D.; Ball, E.V.; A Chuzhanova, N. Methylation-mediated deamination of 5-methylcytosine appears to give rise to mutations causing human inherited disease in CpNpG trinucleotides, as well as in CpG dinucleotides. Hum. Genom. 2010, 4, 406–410. [Google Scholar] [CrossRef]
- Chen, L.; Liu, P.; Evans, T.C., Jr.; Ettwiller, L.M. DNA damage is a pervasive cause of sequencing errors.; directly confounding variant identification. Science 2017, 355, 752–756. [Google Scholar] [CrossRef] [PubMed]
- Weitzman, S.A.; Turk, P.W.; Milkowski, D.H.; Kozlowski, K. Free radical adducts induce alterations in DNA cytosine methylation. Proc. Natl. Acad. Sci. USA 1994, 91, 1261–1264. [Google Scholar] [CrossRef] [PubMed]
- Turk, P.W.; Laayoun, A.; Smith, S.S.; Weitzman, S.A. DNA adduct 8-hydroxyl-2′-deoxyguanosine (8-hydroxyguanine) affects function of human DNA methyltransferase. Carcinogenesis 1995, 16, 1253–1255. [Google Scholar] [CrossRef] [PubMed]
- Grollman, A.P.; Moriya, M. Mutagenesis by 8-oxoguanine: an enemy within. Trends Genet. 1993, 9, 246–249. [Google Scholar] [CrossRef]
- Wu, Q.; Ni, X. ROS-mediated DNA methylation pattern alterations in carcinogenesis. Curr. Drug Targets 2015, 16, 13–19. [Google Scholar] [CrossRef] [PubMed]
- Xu, G.-L.; Walsh, C.P. Enzymatic DNA oxidation: mechanisms and biological significance. BMB Rep. 2014, 47, 609–618. [Google Scholar] [CrossRef]
- Zhou, X.; Zhuang, Z.; Wang, W.; He, L.; Wu, H.; Cao, Y.; Pan, F.; Zhao, J.; Hu, Z.; Sekhar, C.; et al. OGG1 is essential in oxidative stress induced DNA demethylation. Cell. Signal. 2016, 28, 1163–1171. [Google Scholar] [CrossRef] [PubMed]
- Kafer, G.R.; Li, X.; Horii, T.; Suetake, I.; Tajima, S.; Hatada, I.; Carlton, P.M. 5-Hydroxymethylcytosine Marks Sites of DNA Damage and Promotes Genome Stability. Cell Rep. 2016, 14, 1283–1292. [Google Scholar] [CrossRef]
- López-Moyado, I.F.; Tsagaratou, A.; Yuita, H.; Seo, H.; Delatte, B.; Heinz, S.; Benner, C.; Rao, A. Paradoxical association of TET loss of function with genome-wide DNA hypomethylation. Proc. Natl. Acad. Sci. USA 2019, 116, 16933–16942. [Google Scholar] [CrossRef]
- Hashimoto, H.; Pais, J.E.; Zhang, X.; Saleh, L.; Fu, Z.Q.; Dai, N.; Corrêa, I.R., Jr.; Zheng, Y.; Cheng, X. Structure of a Naegleria Tet-like dioxygenase in complex with 5-methylcytosine DNA. Nature 2014, 506, 391–395. [Google Scholar] [CrossRef] [PubMed]
- Madugundu, G.S.; Cadet, J.; Wagner, J.R. Hydroxyl-radical-induced oxidation of 5-methylcytosine in isolated and cellular DNA. Nucleic Acids Res. 2014, 42, 7450–7460. [Google Scholar] [CrossRef] [PubMed]
- You, C.; Ji, D.; Dai, X.; Wang, Y. Effects of Tet-mediated Oxidation Products of 5-Methylcytosine on DNA Transcription in vitro and in Mammalian Cells. Sci. Rep. 2014, 4, 7052. [Google Scholar] [CrossRef] [PubMed]
- Fleming, A.M.; Ding, Y.; Burrows, C.J. Oxidative DNA damage is epigenetic by regulating gene transcription via base excision repair. Proc. Natl. Acad. Sci. USA 2017, 114, 2604–2609. [Google Scholar] [CrossRef] [PubMed]
- Ehrlich, M.; Lacey, M. DNA hypomethylation and hemimethylation in cancer. Adv. Exp Med. Biol. 2013, 754, 31–56. [Google Scholar]
- Yang, H.; Villani, R.M.; Wang, H.; Simpson, M.J.; Roberts, M.S.; Tang, M.; Liang, X. The role of cellular reactive oxygen species in cancer chemotherapy. J. Exp. Clin. Cancer Res. 2018, 37, 266. [Google Scholar] [CrossRef]
- Kurkjian, C.; Kummar, S.; Murgo, A. DNA Methylation: Its Role in Cancer Development and Therapy. Curr. Probl. Cancer 2008, 32, 187–235. [Google Scholar] [CrossRef]
- Singh, K.; Bhori, M.; Kasu, Y.A.; Bhat, G.; Marar, T. Antioxidants as precision weapons in war against cancer chemotherapy induced toxicity—Exploring the armoury of obscurity. Saudi. Pharm. J. 2018, 26, 177–190. [Google Scholar] [CrossRef]
- Puri, T.; Goyal, S.; Julka, P.; Nair, O.; Sharma, D.; Rath, G.; O, N.; T, P.; S, G.; Pk, J.; et al. Lycopene in treatment of high-grade gliomas: A pilot study. Neurol. India 2010, 58, 20. [Google Scholar] [CrossRef]
- André, P.; Villain, F. Free radical scavenging properties of mannitol and its role as a constituent of hyaluronic acid fillers: a literature review. Int. J. Cosmet. Sci. 2017, 39, 355–360. [Google Scholar] [CrossRef]
© 2019 by the authors. Licensee MDPI, Basel, Switzerland. This article is an open access article distributed under the terms and conditions of the Creative Commons Attribution (CC BY) license (http://creativecommons.org/licenses/by/4.0/).