Review

Analysis of Catecholamines and Pterins in Inborn Errors of Monoamine Neurotransmitter Metabolism—From Past to Future

by
Sabine Jung-Klawitter
* and
Oya Kuseyri Hübschmann
Department of General Pediatrics, Division of Neuropediatrics and Metabolic Medicine, University Hospital Heidelberg, 69120 Heidelberg, Germany
*
Author to whom correspondence should be addressed.
Cells 2019, 8(8), 867; https://doi.org/10.3390/cells8080867
Submission received: 30 June 2019 / Revised: 2 August 2019 / Accepted: 4 August 2019 / Published: 9 August 2019
(This article belongs to the Special Issue Metabolomics in Physiology and Diseases)

Abstract

:
Inborn errors of monoamine neurotransmitter biosynthesis and degradation belong to the rare inborn errors of metabolism. They are caused by monogenic variants in the genes encoding the proteins involved in (1) neurotransmitter biosynthesis (like tyrosine hydroxylase (TH) and aromatic amino acid decarboxylase (AADC)), (2) in tetrahydrobiopterin (BH4) cofactor biosynthesis (GTP cyclohydrolase 1 (GTPCH), 6-pyruvoyl-tetrahydropterin synthase (PTPS), sepiapterin reductase (SPR)) and recycling (pterin-4a-carbinolamine dehydratase (PCD), dihydropteridine reductase (DHPR)), or (3) in co-chaperones (DNAJC12). Clinically, they present early during childhood with a lack of monoamine neurotransmitters, especially dopamine and its products norepinephrine and epinephrine. Classical symptoms include autonomous dysregulations, hypotonia, movement disorders, and developmental delay. Therapy is predominantly based on supplementation of missing cofactors or neurotransmitter precursors. However, diagnosis is difficult and is predominantly based on quantitative detection of neurotransmitters, cofactors, and precursors in cerebrospinal fluid (CSF), urine, and blood. This review aims at summarizing the diverse analytical tools routinely used for diagnosis to determine quantitatively the amounts of neurotransmitters and cofactors in the different types of samples used to identify patients suffering from these rare diseases.

1. Introduction

Neurotransmitters belong to different classes of chemical substances which are involved in synaptic transmission in the central (CNS) or peripheral (PNS) nervous system. Based on their chemical structure, they can be classified into three groups: (1) Amino acid neurotransmitters (glycine, glutamate, γ-aminobutyric acid (GABA), monoamines/biogenic amines (dopamine, serotonin, norepinephrine, epinephrine)), (2) neuropeptides (oxytocin, vasopressin), and (3) atypical neurotransmitters (neurotrophic factors, cytokines, carbon monoxide (CO), nitric oxide (NO), adenosine, adenosine triphosphate (ATP), endogenous cannabinoids, and opioids). Inherited defects in monoamine neurotransmitter biosynthesis or degradation are rare metabolic diseases. In general, primary monoamine neurotransmitter deficiencies can be grouped into five distinct classes: Defects in (1) monoamine biosynthesis, (2) monoamine catabolism, (3) monoamine transport, (4) tetrahydrobiopterin (BH4) biosynthesis or recycling, and (5) chaperone associated defects (for a detailed review see [1]). Genes involved are tyrosine hydroxylase (TH), aromatic amino acid decarboxylase (AADC), monoamine oxidase (MAO-A/MAO-B), dopamine ß-hydroxylase (DBH), vesicular monoamine transporter 2 (VMAT2), and dopamine transporter (DAT) in monoamine biosynthesis, transport, and degradation, and GTP cyclohydrolase 1 (GTPCH), 6-pyruvoyl-tetrahydropterin synthase (PTPS), sepiapterin reductase (SR), pterin-4a-carbinolamine dehydratase (PCD), and dihydropteridine reductase (DHPR) in BH4 cofactor biosynthesis and regeneration. Recently, mutations in a co-chaperone (DNAJC12) have also been shown to induce a comparable neurological phenotype [2,3,4]. All of these deficiencies present with a broad clinical spectrum, going from moderate late-onset movement disorders to lethal early-onset encephalopathies. As these clinical symptoms often overlap with features also seen in other neurological diseases, this can lead to delayed diagnosis and treatment initiation. Diagnostic workup is usually based on three different sample types: Urine, cerebrospinal fluid (CSF), and blood/dried blood spots (DBS). CSF still represents the gold standard, as diagnosis relies mostly on the quantification of distinct neurotransmitters or pterins, their precursors, or degradation products in the CSF. Treatment is mainly based on supplementation with the missing cofactors or neurotransmitter precursors. The outcome varies, depending on the underlying disorder, the time of diagnosis, and the commencement of treatment. For further details on the clinical symptoms and the treatment options, we refer the readers to [1]. This review will focus on the analytical tools used to establish a proper diagnosis in inborn errors of neurotransmitter biosynthesis and degradation with focus on monoamine and BH4 deficiencies.

2. Biosynthesis of Catecholamines, Serotonin, and Pterins

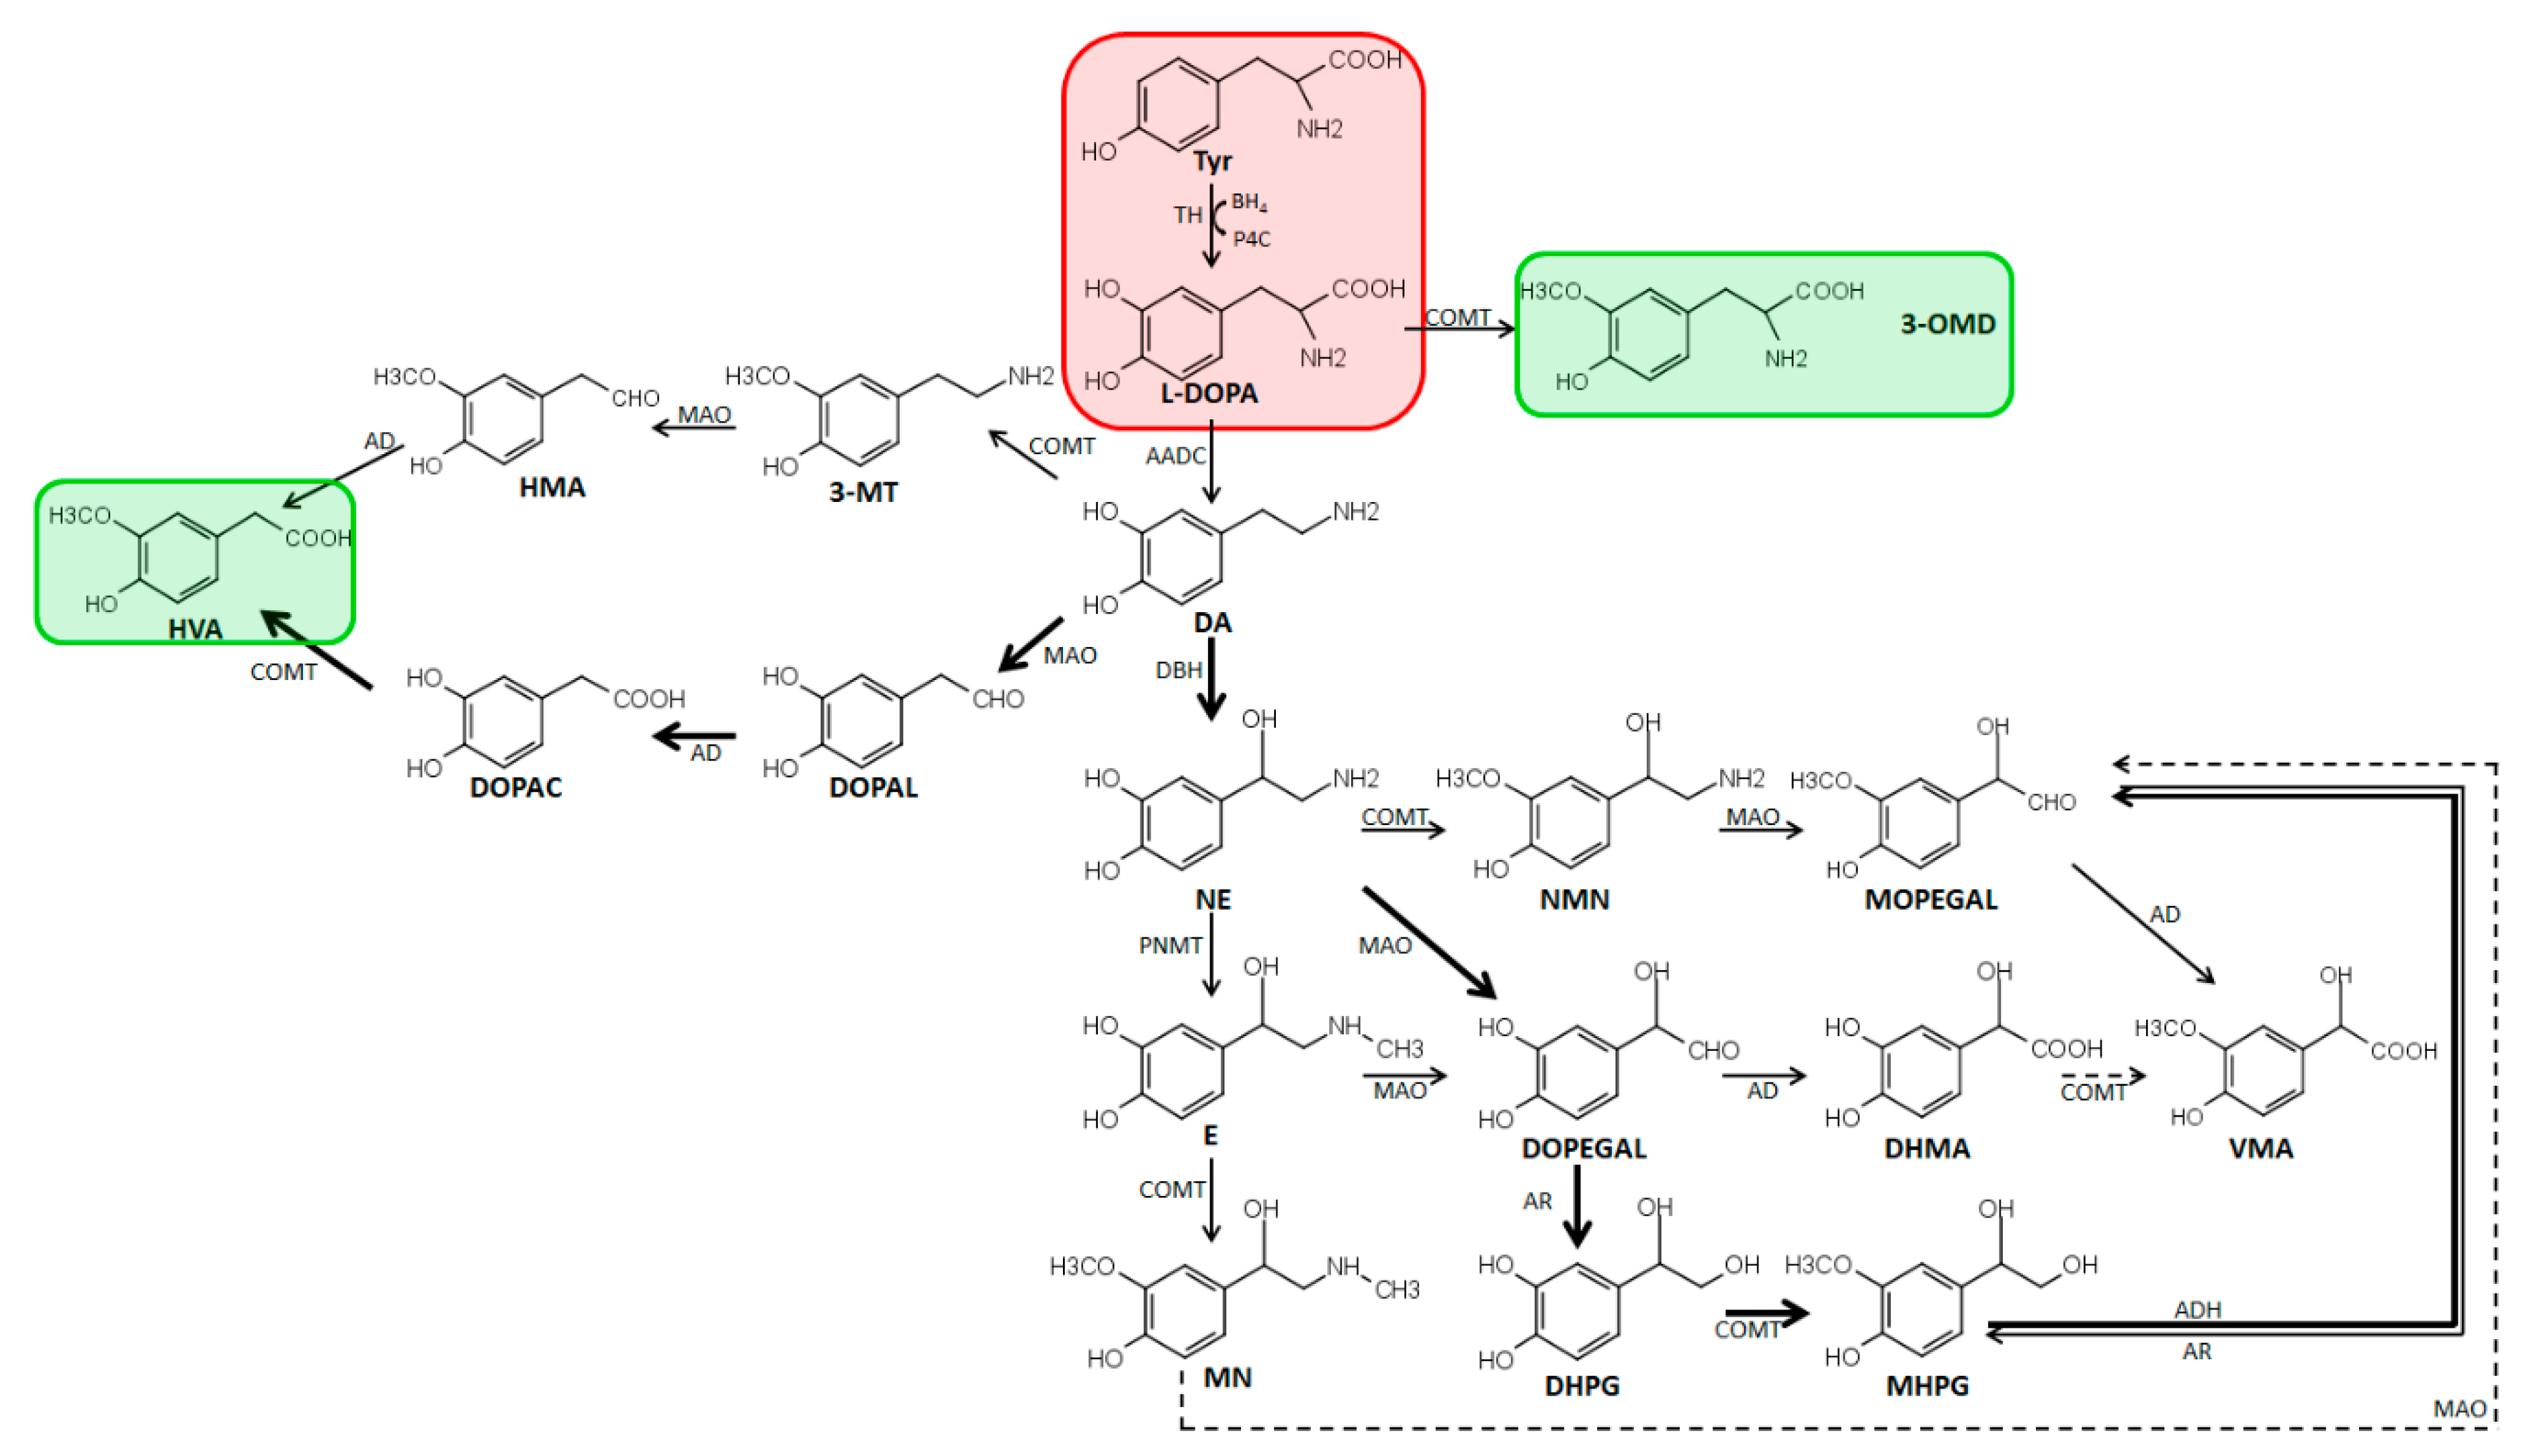
2.1. Metabolism and Biosynthesis of Catecholamines

Catecholamines are comprised of a catechol group constituted by a benzene ring with hydroxyl groups at position 3 and 4 and an amine [5]. Physiologically, there exist the three catecholamines dopamine, norepinephrine, and epinephrine. Biochemically, these monoamine neurotransmitters are generated from aromatic amino acids (Figure 1). Therefore, l-phenylalanine is first converted to l-tyrosine by phenylalanine hydroxylase (PAH), which is then converted to l-3,4-dihydroxyphenylalanine (L-DOPA) by TH, which is the rate-limiting enzyme of the pathway [6]. l-DOPA is decarboxylated by AADC to produce dopamine, which is then converted by DBH to norepinephrine. Subsequently, phenyl ethanolamine-N-methyltransferase (PNMT) N-methylates norepinephrine leading to the formation of epinephrine [7]. Catecholamines are mainly metabolized by MAO A/B and catechol-O-methyltransferase (COMT). First, dopamine is deaminated by MAO A/B to 3,4-dihydrophenylacetaldehyde (DOPAL). DOPAL is subsequently oxidized to 3,4 dihydroxyphenylacetic acid (DOPAC) by aldehyde dehydrogenase (AD). Then, DOPAC is O-methylated by COMT, generating the homovanillic acid (HVA) that is used for diagnosis in monoamine neurotransmitter deficiencies and excreted in urine [8]. Dopamine can also be converted by COMT to 3-methoxytyramine (3-MT), which is a biomarker for dopamine release [9]. Moreover, COMT can also convert l-Dopa to 3-methoxytyrosine (also known as 3-methyldopa, 3-MD). Norepinephrine and epinephrine are mainly metabolized by MAO A/B to 3,4 dihydroxyphenylglycoaldehyde (DOPEGAL), which is readily reduced by aldehyde reductase (AR) to 3,4-dihydroxyphenylglycol (DHPG). DHPG is converted by COMT to 3-methoxy-4-hydroxyphenylglycol (MHPG), which is the major metabolite of norepinephrine in the human plasma [6]. In the liver, MHPG is oxidized to form vanillylmandelic acid (VMA), which is the principal end product of norepinephrine and epinephrine metabolism. Furthermore, COMT is able to convert epinephrine and norepinephrine to metanephrine (MN) and normetanephrine (NMN), respectively. Moreover, sulfation and glucuronidation also play a role in catecholamine metabolism [10]. As the exact quantification of free catecholamines, metanephrines, and their sulfate conjugates are highly important, sample storage and preparation have to circumvent any process leading to the deconjugation of catecholamine or metanephrine sulfates. Generally, in human plasma, endogenous catechol concentration varies widely and is based on the balance between the entry rate into and the clearance from plasma. Free plasma catecholamines are rapidly cleared and, therefore, exhibit only a short half-life and very low levels in plasma, whereas the sulfate conjugated metabolites have a generally higher level due to slower clearance [6].

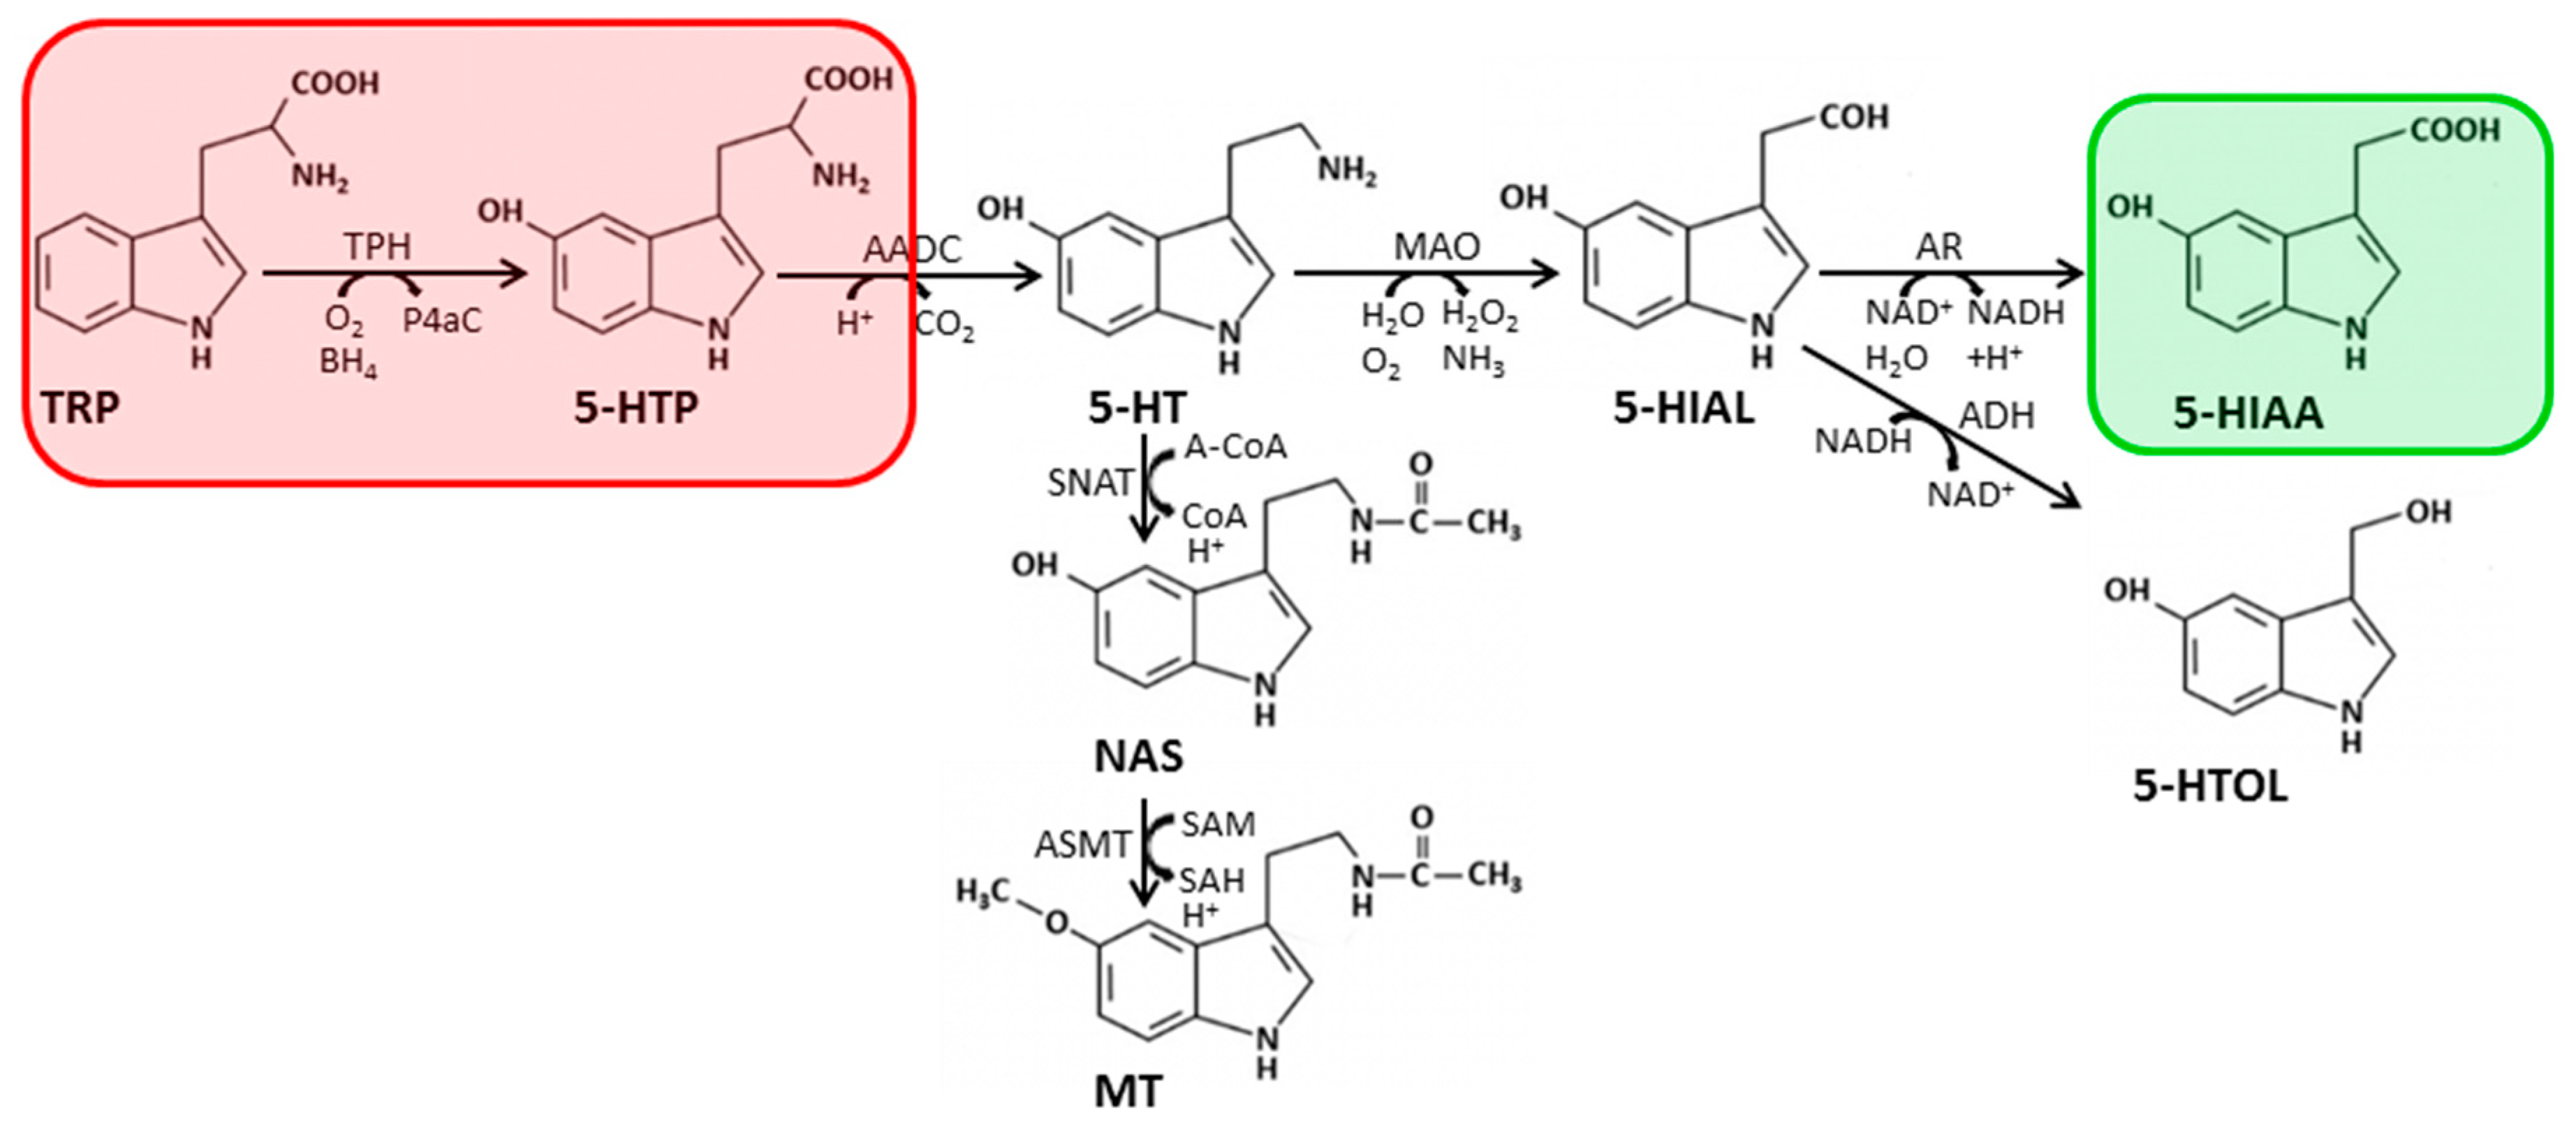
2.2. Biosynthesis and Metabolism of Serotonin

Serotonin, or 5-hydroxytryptamine (5-HT), chemically belongs to the group of indolamines. It is generated from tryptophan by the successive action of tryptophan hydroxylases (TPH; leading to the formation of 5-hydroxytryptophan) and AADC (Figure 2). 5-HT can be further metabolized by MAO A/B to 5-hydroxyindolacetaldehyde (5-HIAL), which is then used by AR to form 5-hydroxyindolacetic acid (5-HIAA), the most important metabolite of serotonin degradation used for diagnosis in CSF analysis. Nevertheless, 5-HIAL can also be oxidized to 5-hydroxytryptophol (5-HTOL), which is a sensitive marker of recent alcohol consumption in human urine. Moreover, serotonin can serve as building block for the synthesis of melatonin (MT; Figure 2). First, serotonin is converted to N-acetyl-serotonin (NAS) by serotonin-N-acetyltransferase (SNAT). Subsequently, NAS is further metabolized to MT by N-acetyl-serotonin-O-methyltransferase (ASMT). Furthermore, TRP is also used as a substrate in the kynurenine pathway (not shown).

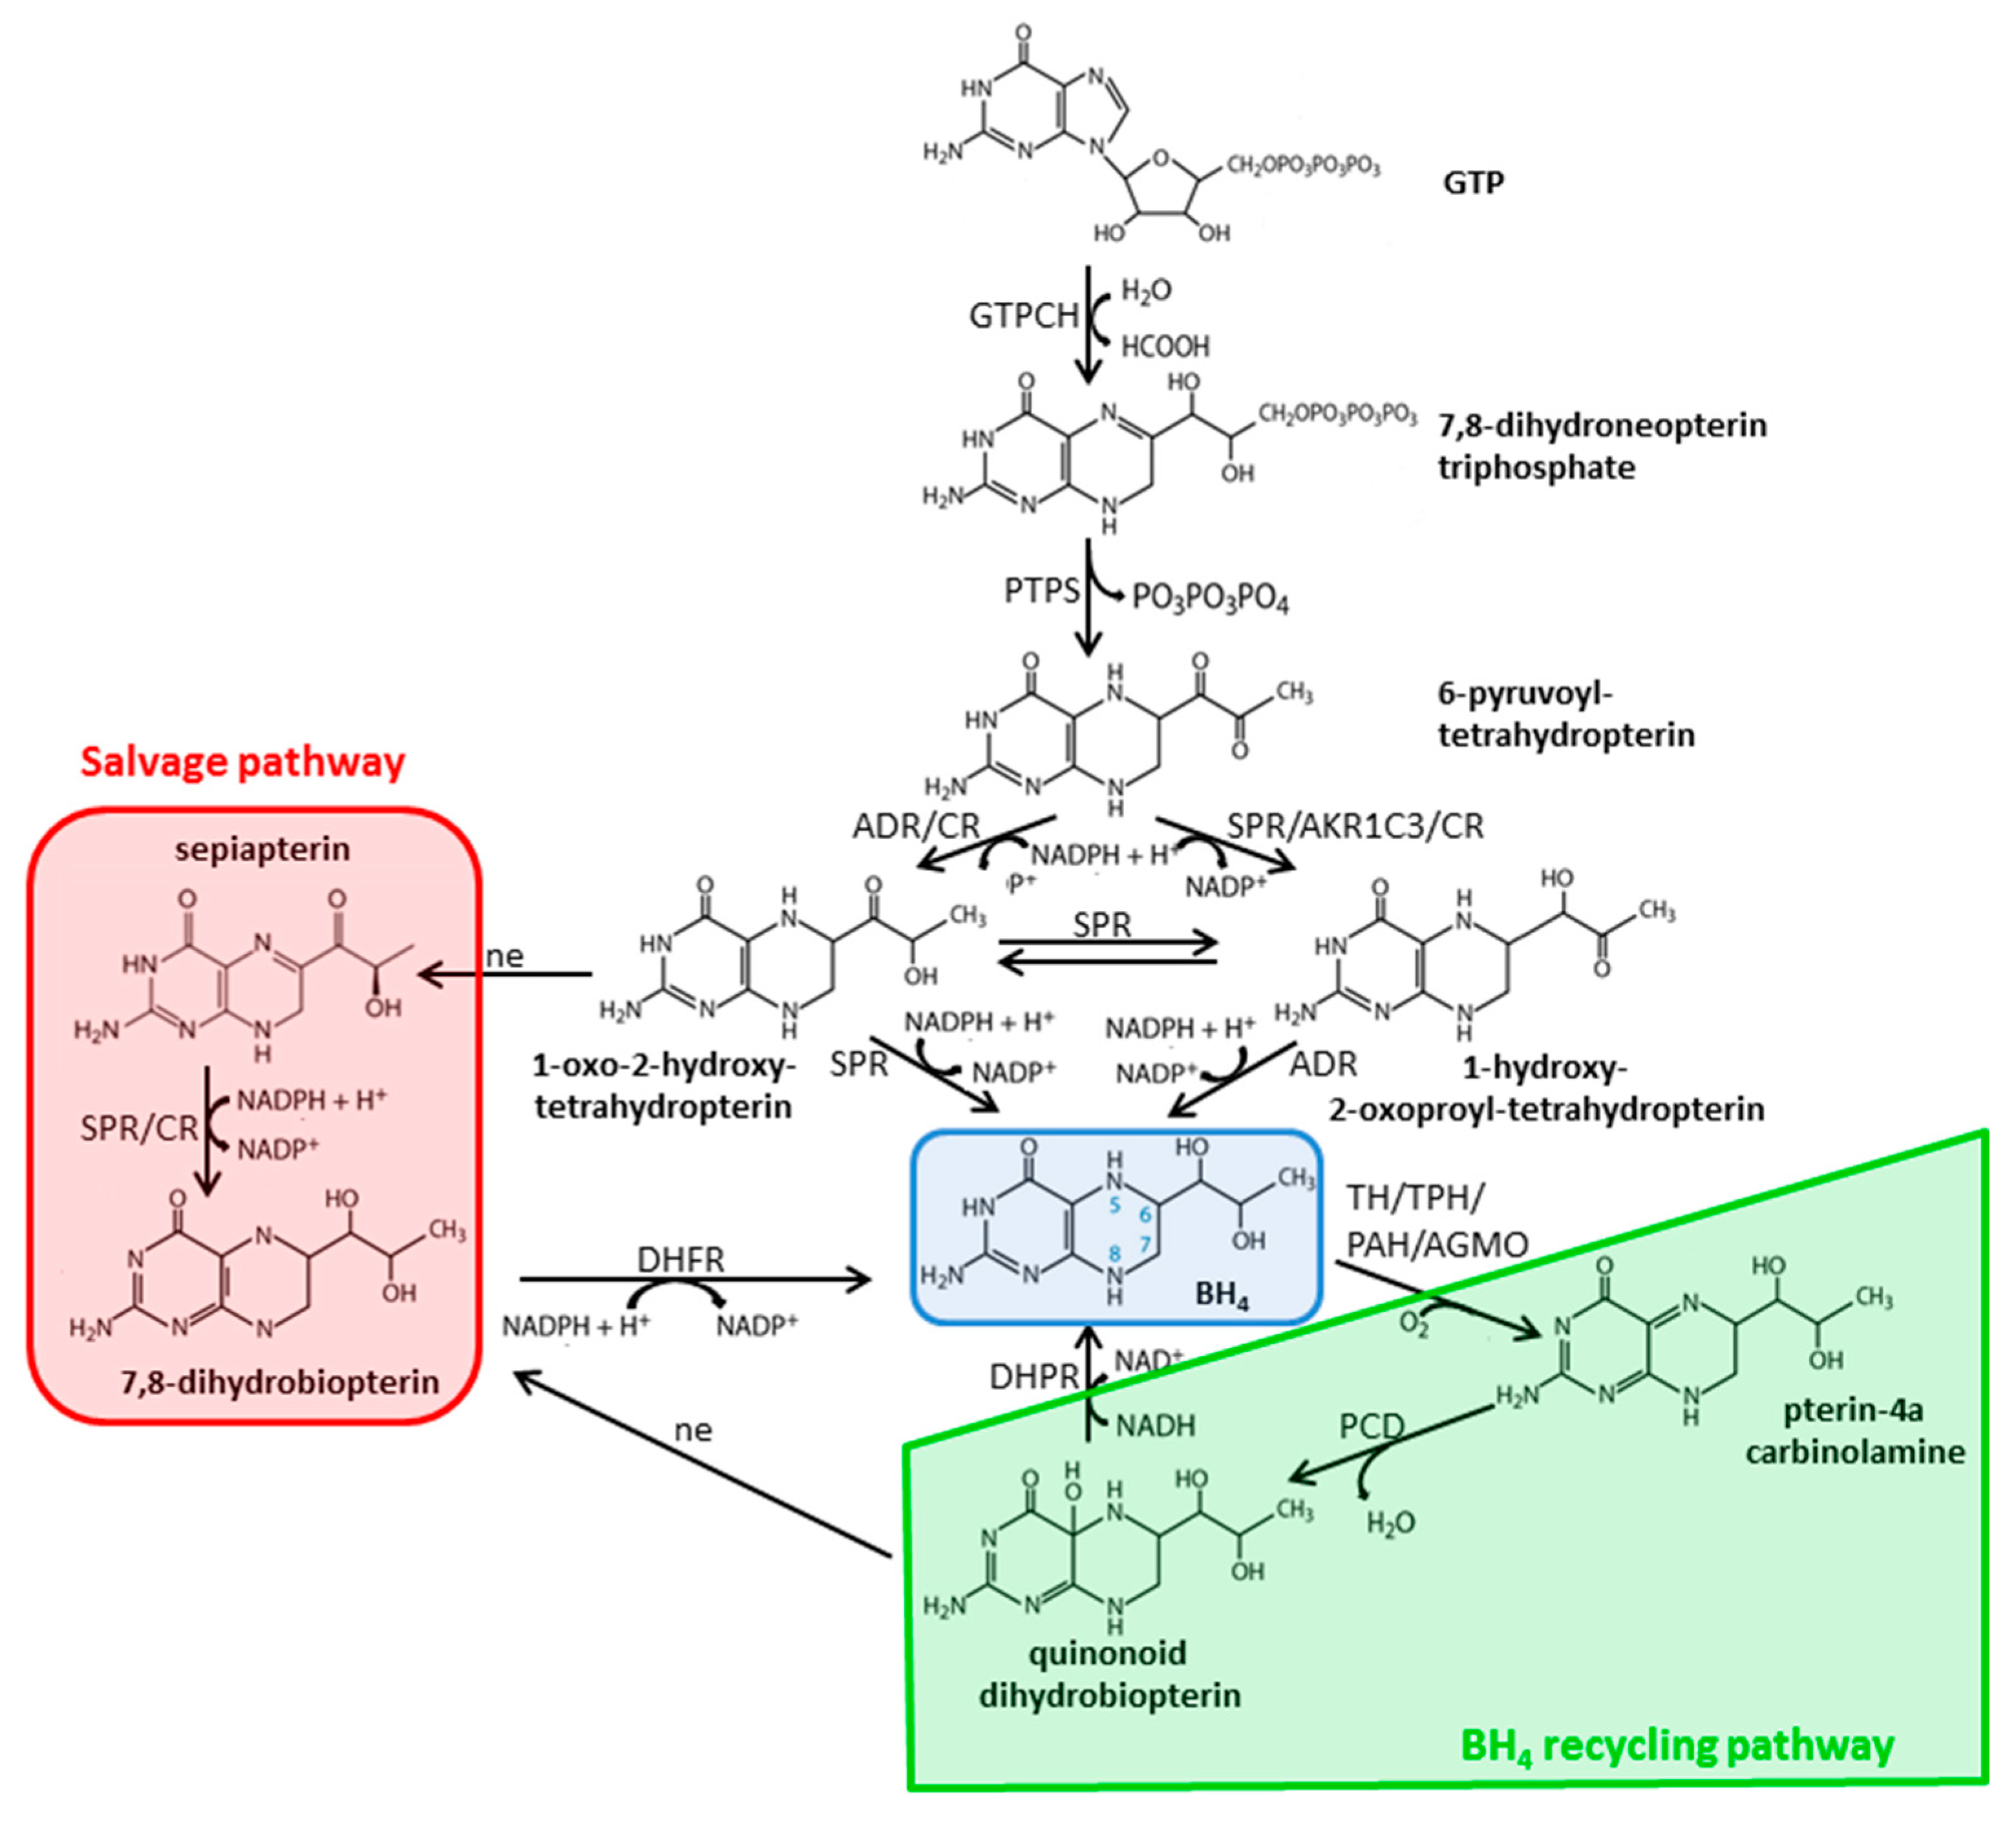
2.3. Biosynthesis and Metabolism of Pterins

Chemically, pterins are pteridines containing 2-amino-4-oxo structures. They are essential for the biosynthesis of vitamins and cofactors, including BH4 and riboflavin. Two groups of pterins exist: (1) Conjugated pterins which have glutamate or p-aminobenzoate linked to the pterin moiety, and (2) unconjugated ones with substitutions at the 6- and/or 7- position of the pterin ring by aliphatic side chains. BH4 is the major unconjugated pterin in vertebrates. It is an essential cofactor for PAH, TH, tryptophan hydroxylases (TPH1/2), alkylglycerol monooxygenase (AGMO), and nitric oxide synthases (NOS 1-3). De novo biosynthesis of BH4 involves three different enzymes—GTPCH, PTPS, and SPR (Figure 3). In the first and rate-limiting step, GTPCH converts GTP in a Zn2+-dependent reaction to 7,8-dihydroneopterin triphosphate, which is then metabolized by PTPS to 6-pyruvoyl-tetrahydropterin in a Mg2+ and Zn2+-dependent reaction. In the last step, SPR reduces 6-pyruvoyl-tetrahydropterin in an NADPH-dependent reaction to BH4. Furthermore, there exists a salvage pathway catalyzed by SPR or carbonyl reductase (CR) and dihydrofolate reductase (DHFR), which is important especially in peripheral tissues. Here, SPR/CR catalyzes the conversion of sepiapterin to 7,8-dihydrobiopterin, which is then converted into BH4 by DHFR (salvage pathway; [12]). Moreover, alternative pathways for BH4 biosynthesis have also been described. Without a functional SPR, aldose reductase (ADR) and CR metabolize 6-pyruvoyltetrahydropterin into 1′-oxo-2′-hydroxyetrahydropterin, which rearranges spontaneously to sepiapterin. Sepiapterin is reduced by CR to 7,8-dihydrobiopterin, which is then reduced to BH4 by DHFR [13,14]. Alternatively, BH4 can be produced via 1′-hydroxy-2′-oxoproyltetrahydropterin by 3α-hydroxysteroid dehydrogenase type 2 (AKR1C3) and CR [15]. Regeneration of BH4 is mediated by the concerted action of PCD and DHPR (Figure 3). During the hydroxylation reaction catalyzed by PAH, TH, or TPH’s, BH4 is oxidized to 4a-hydroxytetrahydrobiopterin/pterin-4a-carbinolamine, which is dehydrated to quinoid-dihydrobiopterin (qBH2) by PCD. qBH2 is the substrate of DHPR and converted back to BH4 in a NADH-dependent reaction. Without PCD activity, dehydration of pterin-4a-carbinolamine can also occur non-enzymatically, but at a very low rate, which is insufficient for the maintenance of normal BH4 levels. Hence, pterin-4a-carbinolamine is rearranged to dihydroprimapterin in PCD deficiency and can be measured in urine. In the case of low DHPR activity, qBH2 rearranges non-enzymatically to 7,8-dihydrobiopterin, which can be reduced to BH4 by DHFR. For a detailed description of the regulation of BH4 metabolism, we refer the reader to [16].

3. Diagnostic Methods

3.1. Quantification of Catecholamines and Catecholamine Metabolites

The quantification and analysis of catecholamines and their metabolites in biological samples and specimen is still analytically challenging due to their very low quantities in biological samples and their high tendency to oxidize. Moreover, the clean-up procedures are still elaborate and labor intensive due to the presence of interfering compounds in the samples and the complexity of the matrices analyzed. Table 1 gives an overview on the different types of pre-treatment used in catecholamine analysis. Samples can either be generated by harvesting a fluid of interest or by extracting tissue. It is important to keep in mind that a specific sampling site cannot provide a representative value of catecholamine concentration for the whole body. For example, in plasma there exists a difference in catecholamine concentration depending on the sampling site (arterial versus venous). These differences are due to local release or extraction of the compounds in different parts of the body [8]. Generally, there are three significant variables affecting the stability of a compound during storage. Namely (1) temperature, (2) sample pH, and (3) storage time. For catecholamines, sample integrity is highly dependent on low pH values, especially for long-term storage [17,18]. The standard method for the separation and quantification of catecholamines is high-performance liquid chromatography (HPLC) coupled with fluorescence (FD), chemiluminescence (CL), electrochemical (ECD), or mass spectrometric (MS) detection. Generally, sample preparation is highly dependent on the detection system used. For example, as several compounds in human plasma exhibit absorption and emission maxima which resemble those of catecholamines, a specific isolation method has to be applied to plasma samples if using FD.

3.1.1. Pre-processing of Biological Fluids

The extraction of catecholamines using aluminium oxide (alumina) is one of the oldest methods described. Alumina forms cyclic complexes with catechol moieties, thereby isolating all compounds containing this moiety—including catecholamines—from complex mixtures. Unfortunately, all substances carrying a catechol moiety are also bound and eluted. Moreover, alumina must first be activated with hydrochloric acid and then be brought to a pH of 8.6. Furthermore, alumina has to be washed extensively after sample binding to remove interfering substances. Desorption of catecholamines is usually done by addition of acids like perchloric acid [19], phosphoric acid, formic acid [20,21], and acetic acid [22]. Taken together, the different steps required for preparation and the instability of catecholamines in contact with alumina leads to low extraction yields for l-Dopa, dopamine, DOPAC, norepinephrine, and epinephrine. Therefore, the most common sample preparation methodology used to date for biological fluids (CSF, plasma, urine, microdialysis) is solid-phase extraction (SPE). SPE is highly selective and results in high extraction yields [23,24]. It is based on the principles of chromatography, but here most of the components are adsorbed to the stationary phase. Catecholamines are eluted after washing with an adequate elution solvent [23]. Several types of cartridges are available, including phenylboronic acid (PCA) cartridges [25,26], alumina cartridges [27], strong or weak cation exchange cartridges [28], hydrophilic-lipophilic balance cartridges (HLB; [24,29]), and C8, C18, or C30 cartridges [24,29,30]. Another method available is liquid-liquid extraction (LLE). The major drawbacks of LLE lie in its low sensitivity and low extraction yields. Moreover, LLE is time consuming and labor-intensive, as it is based on the extraction first into an organic phase and a second extraction step using an acid phase [30]. Other types of pre-treatment include cationic exchange resins, freeze-drying/lyophilization, and protein precipitation (although never used alone). Table 1 summarizes the different types of sample pre-treatments used for recovery and analysis of catecholamines and their metabolites from biological fluids in humans.

3.1.2. Pre-Processing of Tissue Samples

Quantification of catecholamines and their metabolites from tissue and cell culture samples is less frequent than the usage of fluid samples from patients. Most of the protocols available for the extraction of catecholamines from tissues and cells are based on using brain or adrenal gland samples. This simply reflects the fact that the main target for the analysis of neuropathologies associated with catecholamine metabolism is the brain, whereas the main site of peripheral catecholamine biosynthesis is the adrenal gland. Extraction of catecholamines from tissues and cells needs tissue homogenization or sonication in the presence of a buffer solution. Usually, phosphate or sodium phosphate-based buffers are used [31,32,33]. Alternatively, perchloric acid is used to disrupt the tissue [34]. Additionally, preservatives are added to the homogenate. These include ascorbic acid [35], 1,4-dithiothreitol (DTT; [31]), or sodium bisulfite [34]. All procedures are carried out at low temperatures (4 °C; [36]) or on ice, and the extracts need to be filtered before injection into the chromatographic system [33,35].

3.1.3. Chromatographic Columns, Mobile Phases, and Detection Used

Table 2 summarizes columns, mobile phases, and detection methods used for the quantification of catecholamines. The standard columns used for chromatographic separation of catecholamines are either reversed phase C18 or octadecylsilane (ODS) columns. They are characterized by a relatively short run time based on a fast elution of polar compounds. To avoid excessively fast elution and/or poor peak separation, new columns have been invented with lower density. This allows for a quicker access of the analytes to the pores, thereby elongating retention [59]. Moreover, C18 monolithic columns can also be used for analysis. These columns contain no silica particles, but a porous rod of silica. The second type of column often utilized is the less hydrophobic C8-type column. These columns are used to improve peak separation and resolution [29] and to increase the reproducibility of retention times [60]. Other columns applied include base-deactivated silica (BDS) and C30 stationary phases [47], porous graphitic carbon (PGC) columns [41,42], Kromasyl Cyano columns [61], Allure Basix columns [55], pentafluorophenyl propyl columns [10,26,50], and strong cation-exchange (SCX) columns [62,63,64,65]. Another alternative to traditional phase separations is hydrophilic interaction liquid chromatography (HILIC) or aqueous normal phase chromatography. These columns have a water-rich layer over the polar stationary phase, which leads to interactions of the analytes with the hydrophilic environment and the mobile phase via electrostatic and hydrogen bonds. Frequently, these columns are coupled to MS detection [42,43,44] or coulometric detection [51]. Moreover, during the last years, sub-2 µM particle columns have also become more often used for ultra-fast HPLC applications, in combination with amperometric or MS detection—for example, in human plasma and brain tissue [66,67].
There are several important parameters which have to be considered when looking for the optimal mobile phase. These include the composition of the buffer solution (qualitatively and quantitatively), the use of an ion-pairing reagent, the use of an organic modifier, and the used pH value [63]. The pH of the mobile phase is dependent on the ionization degree of the analytes, which depends on the pKa values [34]. Depending on the pKa values of the analytes and the pH of the solvent, differentially charged forms of the analytes can be present with different chromatographic behaviors. Therefore, the pH of the mobile phase must be checked before chromatography to avoid that small pH shift inducing large shifts in retention time or peak shape [46]. In the literature, pH values ranging from pH 2.32 to 7.5 have been described for analysis.
Ion-pairing reagents are usually used to improve the retention time of basic, but not acidic, catecholamines and the chromatographic separation of ionizable compounds in reversed-phase HPLC [22]. Higher concentrations of these reagents increases not only the retention times of basic analytes [34,68], but also the column equilibration time and the costs, due to higher demand of cleaning the system because of high salt content.
When comparing the different methods described in the literature, isocratic elution is more commonly used than gradient elution, probably due to the fact that this method is simpler and does not depend on extra time for the re-equilibration of the column between two runs. Furthermore, isocratic elution circumvents the baseline drift, which can be found when using gradient elution. Nevertheless, if peak resolution is weak under isocratic conditions, gradient elution can be the solution.
Detection of catecholamines can be performed using diverse detection methods. These include ECD, FD, CLD, and MS detection [69]. Catecholamines and their metabolites are electroactive compounds, which can be easily detected using ECD. ECD is considered to be highly sensitive and selective [7,61,70]. Classically, the detector includes a working electrode operated versus a reference electrode, and a counter electrode. There are two forms of ECD: Coulometry and amperometry. In both methods the current generated by the reaction is directly proportional to the concentration of the respective analyte in the solution. In coulometry, the majority of the electroactive species is oxidized or reduced. In contrast, in amperometry, this is only the case for a fraction of the electroactive compounds. Therefore, coulometric detection is more sensitive [29] and specific, and has a lower limit of detection, which allows for smaller sample volumes. A coulometric detector consists of one analytical cell with two electrodes at different voltages, which can be coupled to a guard cell [20,22,37] or a conditioning cell [24,46]. As catecholamines reversibly oxidize, a two-electrode detector enhances sensitivity by oxidizing the compounds at the first electrode and then reducing the compounds back at the second electrode. This coupling can also be used to get rid of substances without a reversible oxidation process, like ascorbate and oxygen [29]. Moreover, ECD does not need any derivatization in advance and therefore, the pre-treatment is often simpler when a HPLC step is combined with ECD [44]. However, electrochemical detectors are highly susceptible to fluctuations in the pumping rate (increase in signal-to-noise ratio) and can be impaired by electrode fouling, which is induced when functional groups of an analyte cause its adsorption to the electrode [61]. As this can lead to an attenuation of the signal, it is necessary to perform electrochemical cleaning of the electrode to avoid a drastic reduction in overall sensitivity [71].
Catecholamines emit a native fluorescence in UV light, but this is not sufficient for quantification in real biological samples [7,72]. Therefore, as catecholamine concentration and emission intensity are low, usually a derivatization step (pre- or post-column) is included when fluorescence detection is used. Again, the derivatization procedure has to be optimized concerning the concentration of the derivatization agent used, the temperature, and the time of reaction [31,72]. Different derivatization agents are described in the literature. They can be specific for certain functional groups, such as the carboxylic acid group or the amino group (2-(perfluorooctyl)-ethylisocyanate), or recognize specific chemical structures, like benzylamine for 5-hydroxyindols [73]. Classically, the catechol group is first oxidized and subsequently either tautomerized to form trihydroxyindol (THI) derivatives or used for the reaction with meso-1,2-diphenylethylenediamine (DPE) or ethylenediamine. THI cannot be used for derivatization with dopamine [54,74], but is well suited for the detection of epinephrine and norepinephrine. In contrast, DPE is highly sensitive and selective [7,75] and has been used for the quantification of catecholamines in plasma [76], urine [77], brain tissue, and dialysate [68,72], amongst others. Unfortunately, reaction products are only stable for 30 min [74], but addition of glycine to the reaction leads to an acceleration and the solution is at least stable for two weeks at room temperature [75]. Ethylenediamine can also be used for post-column derivatization combined with electrochemical oxidation [31,32,78,79]. Moreover, other derivatization reagents have also been described in literature, including benzylamine [80], fluorenylmethyloxycarbonyl chloride (FMOC-CI; [74]), and terbium (III) chloride [54]. Depending on the derivatization reagent used and the derivative generated, excitation and emission wavelengths differ. Usually, ethylenediamine derivatives have an excitation wavelength of 430 nm and an emission wavelength of 505 nm [79,81]. DPE derivatives can be excited at a wavelength of 345 nm and emit at 480 nm [35,75]. In contrast, FMOC-CI derivatives are characterized by excitation and emission wavelengths of 200 nm and 300 nm, respectively [74]. Taken together, fluorescence detection is sensitive and selective and considered to be more reliable than ECD, because the analytical system is less prone to interference and is simpler [35,75], but due to the derivatization step more time-consuming and laborious.
Chemiluminescence detection with HPLC is also highly selective and sensitive, but needs a post-column system that can initiate and detect the chemoluminescence [53]. The most commonly used detection method is peroxyoxalate chemoluminescence (POCL), which is based on the oxidation of an aryl oxalate ester together with a fluorophore. After HPLC, the catecholamines are electrochemically oxidized, thereby generating o-quinones. These then react with ethylenediamine, and these fluorophores are combined with the chemiluminescence solution and detected [82]. In some publications, inhibition of chemiluminescence of oxidized luminol by catecholamines has also been used for detection [49]—a technique which is only suitable for urine samples, but not plasma [60].
MS detection associates the retention times of specific compounds with structural information based on the mass-dependent transition between precursor ion and product ions in tandem mass spectrometry (MS/MS). This allows for the quantification and specific identification of the compounds. Usually, acidic analytes like VMA, DOPAC, DHMA, HVA, and MHPG are detected in the negative ion-electrospray mode, whereas basic analytes, including l-Dopa, dopamine, 3-MT, MN, NMN, norepinephrine, and epinephrine, are detected in the positive mode [36,61]. Sensitivity depends on efficient ionization, which can be affected by different variables, including chromatographic variables, the characteristics of the analyte itself, and matrix interference (matrix effect; [55]). It has to be kept in mind that very polar and small molecules are susceptible to ion suppression, which means that at the ionization source there is a competition for ionization efficiency between the analytes of interest and other species in the sample, which can lead to reduction in precision, accuracy of measurement, and limit of detection if both elute at a similar time point. It has been shown that molecules with a higher mass can suppress the signal of smaller molecules. Therefore, suppression or enhancement of ionization by a matrix effect and influence of the mobile phase on ionization of catecholamines have to be monitored when establishing a new method. Nevertheless, MS and MS/MS detection methods are versatile alternatives to ECD, FD, or CLD as they are capable of unequivocal identification of specific analytes [83] and can be automated.

3.1.4. Analysis of Catecholamines in CSF

To ascertain the diagnosis of an inborn error of biogenic amine metabolism, the first investigation is the analysis of CSF profiles for HVA, 5-HIAA, and 3-OMD. As there is a rostrocaudal gradient for HVA and 5-HIAA, it is essential for the sampling of CSF that the first 0.5 mL of fluid from the spinal tap is collected for analysis, immediately frozen at bedside in liquid nitrogen or dry ice, and stored at −80 °C until further analysis. Blood contaminations have to be removed prior to freezing by short centrifugation at 4 °C, as hemolysis will result in the degradation of HVA and 5-HIAA. All metabolites are stable for up to five years in frozen CSF samples at −70 °C, without antioxidants [87] and without protection from light [88]. Generally, HVA and 5-HIAA can be used as indirect markers to explore the functionality of the dopamine and serotonin pathway in the brain (Table 3). Moreover, the analysis of 3-OMD and MHPG (as marker metabolites for dopamine and norepinephrine pathways), together with 5-HTP (as a serotonin precursor), have been proven to be quite valuable for the identification and differentiation of the underlying biogenic amine disorder in one single analysis. Classically, HVA, 5-HIAA, and 3-OMD are analyzed via reverse-phase high HPLC on an ODS column, followed by electrochemical detection. The analytes elute on a reverse-phase HPLC column in order of increasing hydrophobicity. The mobile phase at an acidic pH suppresses ionization of the analytes. Molecules with a catechol ring remain positively charged, even at pH 2.0. Therefore, an ion-pairing reagent (sodium octane sulphonic acid (OSS)) is added to the mobile phase to optimize the interaction with the stationary phase. The mobile phase usually contains methanol to decrease the retention time of the analysis. As CSF does not contain a lot of compounds disturbing the analysis, only a little sample preparation is required before analysis. Nevertheless, as these compounds are very easy to oxidize, a careful sample collection and storage is absolutely required. In 2017, [39] published a method for the determination of HVA, 5-HIAA, 3-OMD, and MHPG in CSF without the need for time-consuming pre-processing of the samples. Here, CSF freshly frozen at bedside without blood contaminations is directly diluted in the mobile phase, shortly centrifuged, and filtered through a nylon filter to remove greater particles and contaminants. Then, the sample is directly injected into the HPLC and analyzed using ED. Typical CSF profiles in inborn errors of biogenic amine metabolism are summarized in Table 3.

3.1.5. Analysis of Catecholamines in Urine

For analysis in urine, the samples should have a pH of less than 4.0 [17,18], as this type of acidification is an effective means to prevent the decomposition of catecholamines. It should be performed after voiding or within 24 h after voiding [89]. Usually, sulphuric acid, acetic acid, or hydrochloric acid are used. Generally, acidification is the best method for prolonged preservation [90]. Nevertheless, acidification below pH 2.0 has to be avoided as this would lead to the hydrolysis of conjugated forms of catecholamines, thereby increasing the concentration of the free forms [18]. Alternatively, antioxidants can be added during sample collection and the acidification step can be done later [89]. Some publications report that addition of EDTA or sodium metabisulfite is also sufficient to stabilize catecholamines in urine samples for two weeks at −20 °C [91]. As urinary levels of HVA and 5-HIAA can vary considerably, not only due to an underlying genetic defect, but also caused by external factors such as neuroblastoma, pheochromocytoma, or other neural crest tumors showing high HVA besides high vanillylmandelic acid and carcinoid tumors producing serotonin and 5-HIAA, these metabolites are usually not used for the diagnosis of a genetic defect.

3.1.6. Analysis of Catecholamines in Blood Samples

Several protocols for the measurement of catecholamines in blood have been published (Table 2). Generally, blood samples (2 mL) should be centrifuged at 4 °C immediately or at least within 1 h after collection for the separation of plasma from the blood cells [46,47,49,82,92]. The plasma should be transferred to a new vial and immediately frozen at −20 °C. In the past, different antioxidants have been added to the sample prior to centrifugation, but today, most laboratories do not include an antioxidant. Without addition of an antioxidant, catecholamines are stable at −20 °C for six weeks, or for one year at −80 °C. Therefore, plasma should always be stored at −80 °C if possible [17]. Ideally, blood samples (2 mL) should be collected into a tube containing an anticoagulant (EDTA or heparin), transported on ice, centrifuged at 4 °C, and plasma stored at −80 °C until measurement.

3.1.7. Enzyme Activity Assays

TH activity has been determined in tissue samples [93] and on overexpressed protein extracts generated in Escherichia coli [94,95]. Classically, the enzymatic activity is determined using radioactively labelled l-tyrosine [93,96,97]. In the meantime, non-radioactive assays have also been developed measuring the formation of l-tyrosine by TH, either based on HPLC coupled to fluorimetric detection [95] or plate-reader based assays [94]. The first assay to determine AADC activity was published in 1985 by [98]. Here, the activity was determined based on the formation of dopamine, which was detected via HPLC and ED.

3.2. Quantification of Pterins

Measurement of pterins in CSF, blood, and urine is the most common method used to screen for inborn errors of BH4 metabolism. Moreover, neopterin can serve as a marker for immune activation. BH4 deficiencies in humans are the result of defects in the metabolism or recycling of BH4 as a consequence of mutations in the abovementioned enzymes involved in BH4 metabolism. The resulting lack of BH4 is associated with neurological aggravation, including central hypotonia, progressive mental and physical retardation, peripheral spasticity, seizures, and, in some cases, microcephaly [99]. Diagnosis is based on different biochemical and analytical approaches, which depend on the mode of inheritance and the underlying enzyme defect. All newborns presenting with plasma levels of phenylalanine higher than 120 µmol/L and children with suspicious neurologic symptoms should be analyzed for the presence of a BH4 deficiency. Usually, these tests include the measurement of pterins in urine and/or DBS, the measurement of DHPR activity in DBS, a BH4 loading test, measurement of pterins and biogenic amins in CSF, and the determination of enzyme activity [100,101,102]. The first two tests are essential and sufficient to differentiate all BH4 defects presenting with hyperphenylalaninemia.
Diagnostically relevant pterins include BH4, dihydrobiopterin (BH2), biopterin, and dihydroneopterin—but also neopterin, sepiapterin, and primapterin. Each BH4 defect has its unique pterin pattern (Table 6 based on personal communication with the “BH4 deficiencies guideline” group of the “International Working Group on Neurotransmitter Related Disorders” (iNTD; www.intd-online.org)). In patients suffering from autosomal-recessive GTPCH deficiency, the amounts of neopterin and biopterin are decreased, whereas in autosomal-dominant forms, normal concentrations can be measured. PTPS deficiency is characterized by very high levels of neopterin and very low amounts of biopterin. In contrast, sepiapterin deficiency shows no changes in neopterin and biopterin levels, but high levels of BH2. Moreover, [103] could show that patients suffering from SRD also show high levels of sepiaterin not only in CSF, but also in urine, thereby providing a new non-invasive diagnostic tool. DHPR deficiency presents with mostly normal levels of neopterin and biopterin. The measurement of DHPR activity should be performed in the case of hyperphenylalaninemia and normal pterin profile. Neopterin measurements are also used for monitoring of HIV therapy, in patients with autoimmune diseases, and in cancer patients.
Generally, pterins have poor solubility in organic solvents and water. Depending on the substituents and their positions on the pteridine ring, solubility can dramatically change. Pterins are also very easy to oxidize and to reduce. Fully oxidized pterins show either yellow (sepiapterin, 3-hydroxysepiapterin) or blue (neopterin, monapterin, biopterin, pimapterin, pterin, isoxanthopterin) fluorescence, which is used for their measurement in biological fluids [104,105]. Reduced pterins like BH4 are extremely sensitive to oxygen and light and dissociate rapidly to pterin, pterin-6-carboxylic acid, isoxanthopterin, and orxanthopterin. In body fluids, most of the naturally occurring pterins are present in their reduced forms and must be oxidized to the highly fluorescent oxidized forms prior to HPLC and further analysis. Classically, pterins are detected using HPLC coupled either to a FL or an EC detector, GC-MS, or MS/MS. The most widely used method for the determination of pterins, especially in CSF, is HPLC coupled to fluorescence detection. This method is quite widely used due to its appropriate sensitivity.

3.2.1. Pre-Processing of Biological Fluids

For the preprocessing of biological samples, several protocols have been developed (Table 4). As mentioned above, BH4 and BH2 coexist in biological samples but are hardly fluorescent. Therefore, their direct determination is not possible. To prevent BH4 and BH2 from oxidizing before analysis, different antioxidants like dithioerythritol (DTE), DTT, or diethylenetraminepentaacetic acid (DETAPAC) are usually included into the samples [106,107,108]. For analysis, BH4 and BH2 are indirectly determined as strongly fluorescent biopterin and pterin after pre-column oxidation using either iodine [109,110] or MnO2 [111]. Iodine oxidation consists of two independent steps. By acidic iodine oxidation, BH4 and BH2 are both oxidized to biopterin, whereas dihydroneopterin is oxidized to neopterin. By using alkaline iodine oxidation, BH4 is oxidized to pterin and BH2 to biopterin. To determine the amount of BH4 in the analyzed sample, the difference between the amounts of biopterin received by acidic and alkaline oxidation is calculated. Therefore, the iodine oxidation method is classically used for differential oxidation of the pterins and the quantification of BH4 [109,110]. Oxidation in the presence of MnO2 in acidic conditions is a routine method to determine total pterin levels (fully oxidized neopterin, pterin, biopterin, isoxanthopterin, monapterin, primapterin), but does not allow for distinguishing between BH4 and BH2 [111]. Ref. [112] reported on the generation of biopterin from BH4 and BH2 by using UV photo irradiation. This method included one off-line irradiation step before injection into the HPLC system. In 2009, the group presented an on-line UV photo irradiation HPLC system using a diode array coupled to a fast scanning fluorescence detector, which directly allowed for the determination of BH4, BH2, biopterin, pterin, neopterin, and isoxanthopterin simultaneously from the same sample [113]. Generally, most protocols include a precipitation or filtration step before HPLC analysis in order to filter out proteins in the samples which may adhere to the HPLC columns and therefore hinder separation.

3.2.2. Pre-Processing of Tissue Samples

Pterins are predominantly measured in biological fluids, but there are also protocols available for the determination of pterin levels in cells. Classically, patient-derived fibroblasts or mononuclear cells from patient blood are used to verify diagnosis by performing enzyme specific activity assays (see also below) or measurement of neopterin and biopterin levels directly in the cells. Therefore, the cells are first stimulated with cytokines (classically interferon γ and TNF α or phytohemagglutinin) to induce BH4 biosynthesis, and then lysed in a lysis buffer [114,115,116]. To determine neopterin and biopterin in patient-derived fibroblasts, the cell lysate is oxidized under acidic conditions using the iodine oxidation method [109,110], and the generated neopterin trisphophate is dephosphorylated. After a deproteinization step using Ultrafree MC filters, the resulting solution is subjected to HPLC analysis [115]. In 2012, ref. [117] described another preparation method for HUVEC cells. Here, the cells were trypsinized from the cell culture plate and lysed in ice-cold TCA (0.2M) containing 1 mM EDTA, 50 mM ascorbic acid, and 6.5 mM DTE by freezing and ultrasonication. For analysis, they included internal standards into the lysate and applied the samples to HPLC analysis for biopterin.

3.2.3. Chromatographic Columns, Mobile Phases, and Detection Used

The classical columns used for separation of pterins are either reversed phase C18 or ODS columns (Table 5). Other columns which have also been used for separation include phenyl-hexyl columns [126], AquitiyUPLC HSS T3 columns [124], Partisil-10 SCX columns [130], and Zorbax-Eclipse XDB columns [122]. Also, hydrophilic interaction liquid chromatography (HILIC) can be used, coupled to either MS [119,125] or fluorescence detection [127].
In the literature, a long list of different mobile phases has been described (Table 5). Generally, mobile phases containing acetonitrile or methanol—often in combination with low amounts of formic acid and aqueous buffers, like citrate buffer and phosphate buffers—are used for separation. pH values ranging from pH 2.8 to 5.0 have been described for the quantification of pterins. Some protocols also use ion-pairing reagents [117], but most do not include these compounds. Based on the literature, isocratic and gradient elution are equally used for analysis.
Detection of pterins can be performed with diverse detection methods. In the early days of analysis radioenzymatic assays [135], electrophoresis [136], thin layer chromatography [137], and even a growth factor assay in Crithidia fasciculata [138] were used for determination. Today, most protocols are based on ECD, FD, ECD coupled with FD, and mass spectrometry detection. Especially for the detection of BH4 in CSF, together with other pterins, ECD coupled with FD is used [139,140,141]. In that case, BH4 is detected electrochemically, whereas BH2 and dihydroneopterin are measured via fluorescence after post-column coulometric oxidation into biopterin and neopterin. As CSF also contains a lot of other electroactive compounds, this method for the quantification of BH4 is quite challenging [142]. The most commonly used method for the detection of pterins in the diagnostic setup in urine, blood, and DBS is the indirect oxidation method originally described by [109,110], which is based on the high fluorescence of fully oxidized pteridines. As described in Section 3.2.1, the samples have to be oxidized before separation, using iodine/iodide solution under acidic and alcaline conditions. Separation of the different samples is then performed using either an HPLC system with column switching [132], without the need for sample pre-treatments for the analysis of total pterins in amniotic fluid, serum, urine, and CSF, or with a simple isocratic HPLC system coupled to FD. In 2017, ref. [39] published a protocol, allowing for the determination of BH4 and other pterins (besides catecholamines and derivates) in CSF without the need for complex pre-preparation steps using HPLC coupled to coulometric and fluorescence detection. Mass spectrometry is also applied to quantify pterin levels in the samples, as it allows for the specific identification of the compounds. Most protocols use the positive ion-electrospray mode for detection [108,119,124,126], but usage of the negative mode has also been described [105,125].

3.2.4. Analysis of Pterins in CSF

As mentioned above, BH4 in the CSF is highly sensitive to auto-oxidation. Therefore, correct sample collection and storage is a prerequisite for a valid measurement. Interestingly, it has been suggested that there exists no rostrocaudal gradient for neopterin and biopterin in contrast to the situation described for catecholamines [38]. To prevent auto-oxidation, antioxidants like DTE and DETAPAC should be added to the freshly gathered sample, and the samples should be immediately frozen at −80 °C or dry ice, as was described for catecholamines. For further analysis, large proteins are removed by filtration using different types of filter units, like the Ultrafree 10000 filter unit. Smaller proteins are usually precipitated using TCA precipitation and the samples are oxidized using either the MnO2 or iodine/iodide method. This oxidation step is not recommended for the measurement of sepiapterin. Reduced pterins like BH4 are often analyzed directly by HPLC coupled to electrochemical detection. Generally, a careful sample collection and storage is absolutely required. Recently, ref. [39] described a method for the determination of pterins in the CSF without the need of time-consuming sample pre-preparation. For measurement, they used HPLC separation coupled to coulometric and fluorescence detection. In brief, freshly frozen CSF samples (200 µL) are prepared without pre-processing. In the case of high protein content or colored samples, the authors advise to filter the samples through 10 kDA centrifugal filter prior to analysis. Subsequently, the sample is injected into the HPLC device coupled to in-line ED and FD. Neopterin, BH2, and BH4 are separated in the HPLC column. BH4 is oxidized by the first electrode in the analytical cell to quinonoid dihydrobiopterin, and reduced to BH2 by the second electrode. BH2 and total neopterin (neopterin and dihydroneopterin) are measured in the same run by FD. A postcolumn oxidation step oxidizes dihydroneopterin to neopterin, and BH2 to biopterin—all of which are analyzed by FD. Table 6 summarizes characteristic pterin profiles measured in CSF depending on the underlying defect.

3.2.5. Analysis of Pterins in Urine

Urinary pterin determination is used for diagnosis in several medical fields, including immunology, oncology, psychobiology, and metabolic disorders. Regarding sample preparation, native urine should be protected from light and stored at least at −20 °C (up to −80 °C) until processed for analysis. Classically, two different procedures for oxidation of urine are commonly used. The first one is the oxidation with MnO2 under acidic conditions. This oxidation method is routinely used for the determination of total pterins (fully oxidized neopterin, pterin, biopterin, primapterin, monapterin, and isoxanthopterin). It cannot be used for the quantification of BH4. To quantify BH4, differential oxidation with iodine/potassium iodide under basic conditions and acidic is necessary [109,110]. The concentration of BH4 present in the sample is calculated by determining the difference in biopterin content between the two different oxidation procedures. Most protocols are based on HPLC coupled to fluorescence detection, but there are also newer protocols available combining the separation via HPLC with MS/MS [126,128]. Analysis of urinary sepiapterin content has been shown to be a useful non-invasive tool to identify patients suffering from SRD [103]. Here, morning urine is sampled and an aliquot is used for analysis. To the sample, ascorbic acid is added as antioxidant and then the sample is ultra-filtered prior to injection into the HPLC column using a gradient protocol for separation and subsequent FD. Table 6 gives an overview on characteristic pterin profiles measured in urine depending on the underlying defect.

3.2.6. Analysis of Pterins in Blood Samples

Detection of pterins can also be performed in plasma and serum, but also from dried blood spots (Guthrie cards). Plasma and serum samples should be immediately frozen in dry ice and stored at −80 °C until further analysis. DBS should be dried completely before shipment. If Guthrie cards are used, for every measurement, 4–6 blood spots with a diameter of 6 mm are cut out and the pterins are extracted from the spots. The extract is often ultra-filtered before injection into the HPLC. Classically, no prior oxidation is performed when dried blood spots are analyzed, and analysis is predominantly based on HPLC coupled to fluorescence detection [123]. Recently, a UPLC-MS/MS-based method has also been described by [124]. Analysis of pterin levels in human plasma and serum usually involves oxidation with either MnO2 or differential oxidation with iodide/iodine after a filtration step [121]. Recently, a new protocol containing a derivatization step for the precise measurement of BH4 has been published by [119]. Here, BH4 is directly derivatized with benzoyl-chloride and analyzed by MS/MS. In Table 6 on overview is given on the characteristic pterin profiles measured in DBS depending on the underlying defect.

3.2.7. Enzyme Activity Assays

For the enzymes involved in BH4 synthesis and regeneration, enzyme activity essays have been established. GTPCH, the first and rate-limiting enzyme, is expressed in peripheral tissues and in the brain. Its expression can be induced in T lymphocytes, macrophages, or in fibroblasts by cytokines. [143] showed that GTPCH is also measurable in liver tissue. Reference values and age-dependent changes in GTPCH activity in stimulated mononuclear blood cells measured by HPLC have been reported by [116]. Of note, this test must be performed within 20 h after sampling and is quite complex. Generally, interferon-γ has been described to be a valid stimulus for the induction of GTPCH activity in fibroblasts, macrophages, but also THP-1 and T 24 cells [114,115,144]. Tissue samples should be shock-frozen in liquid nitrogen and stored at −80 °C for long term. Tissue lysates should be prepared by grinding the frozen piece of tissue to powder under liquid nitrogen before adding ice-cold homogenization buffer. Repeated freeze-thaw cycles of lysates must be avoided as this will decrease GTPCH enzyme activity. Therefore, activity assays should be performed from fresh lysates. Classically, GTPCH activity is determined by measuring the formation of neopterin, which is generated by complete oxidation and dephosphorylation of dihydroneopterinphosphate, starting from GTP. Conversion of dihydroneopterinphosphate to neopterin is performed by acidic oxidation using iodine/iodide, followed by dephosphorylation using alkaline phosphatase (at pH 8.5–9.0), and generated neopterin is detected fluorometrically at 350/440 nm after HPLC separation [145,146]. Reference values for cytokine-stimulated fibroblasts have been established [147], and are 2.6 µU/mg protein for control cells, 0.8 µU/mg protein for autosomal-recessive GTPCH deficiency, and 0.4 µU/mg protein for l-Dopa responsive dystonia (DRD). Non-stimulated fibroblasts have no detectable GTPCH activity.
PTPS, SR, and DHPR are constitutively expressed in different cell types, including fibroblasts. Activity assays for all three enzymes in erythrocytes, amniocytes, fibroblasts, and lysates of tissue samples have been published [115,148,149,150,151]. Generally, to measure PTPS activity in erythrocytes, heparinized blood should be used. If only EDTA-treated blood samples are available, manganese must be added in excess to ensure full activity of the manganese-dependent PTPS. Furthermore, to avoid oxidation of the generated BH4 in the assay, O2 has to be displaced from hemoglobin (Hb) using CO. In the assay, PTPS converts 7,8-dihydroneopterintriphosphate to 6-pyruvoyltetrahydropterin, which is further metabolized by SPR in the reaction buffer to BH4. The BH4 is then chemically oxidized to biopterin, which is quantified using HPLC coupled to FD or MS/MS. Reference values for unstimulated dermal fibroblasts are 0.7 µU/mg protein for healthy controls and <0.05 mU/mg protein for autosomal recessive PTPS. For erythrocytes, normal values for PTPS are 35–77 µU/g Hb (fetus), 34–64 µU/g Hb (newborns up to one month), and 11–29 µU/g Hb (children and adults), respectively. In amniocytes, the reference value is 3.0 µU/mg protein [147].
To measure the activity of SPR, conversion of sepiapterin to BH2 is used, followed by an oxidation step in the presence of iodine solution, leading to the formation of biopterin which can easily be detected fluorometrically [148]. Reference values for SPR activity are 138 µU/mg protein for non-stimulated dermal fibroblasts, <10 µU/mg protein for autosomal recessive SPR deficiency, and 143 µU/mg protein for amniocytes, respectively [147].
DHPR activity has been determined in peripheral blood cells, erythrocytes, fibroblasts, amniocytes, and tissue lysates [115,149,152,153]. Activity of DHPR is measured by monitoring the reduction of NADH during catalysis at 340 nm. This assay is highly sensitive but, due to interference with Hb, not recommended for the analysis of erythrocytes. Here, the non-enzymatic coupling of the oxidation of 6-methyltetrahydropterin to quinonoid 6-methyldihydropterin with the reduction of ferricytochrome c to ferrocytochrome c is recommended and measured at 550 nm [149]. Reference values for DHPR activity in unstimulated dermal fibroblasts are 6.7 mU/mg protein in control cells, <0.3 mU/mg protein in autosomal recessive DHPR deficiency, 7.5 mU/mg in amniocytes, and 1.8–3.8 mU/mg Hb in dried blood spots with a decrease in activity observed after one year of life (from 5.4–8.9 mU/mg to 4.2–7.0 mU/mg; [147]). Clinically, the measurement of DHPR activity in dried blood spots is more relevant, since pterins in urine or in blood can be normal in DHPR deficient patients [149,154].
PCD activity has first been analyzed in rat liver homogenates [155]. For analysis, 6(S)-propyl-4a-hydroxy-tetrahydropterin is used as substrate in the presence of excess DHPR and NADH and the reduction of NADH during catalysis is monitored at 340 nm [155,156]. The assay has also been used for the characterization of patient-specific mutations in PCD in an E. coli-based overexpression system [157], and to determine the activity of PCD in human fetal tissues [158] and duodenal mucosa [159]. Currently, no good reference values are available for PCD.

4. Pitfalls

4.1. Pre-Analytical and Methodological Pitfalls

Several pitfalls have to be kept in mind when performing the analysis of catecholamines and pterins in biological samples. Sample collection should be performed with caution and attention. Catecholamines are easy to oxidize, and are temperature- and pH-sensitive. Therefore, acidification below pH 2.0 has to be avoided. Pterins are sensitive to UV light and also very easy to oxidize and reduce. Especially the reduced pterin like BH4 decompose rapidly to pterin, pterin-6-carboxylic acid, isoxanthopterin, or xanthopterin. Therefore, to prevent BH4 and BH2 from oxidation before analysis, antioxidants (DTE, DETAPAC) need to be added and the samples should be protected from light. No single sampling side can provide the “real” value of the concentration of the respective metabolite under investigation. For example, in the CSF there exists a rostrocaudal gradient of HVA and 5-HIAA, and in plasma there are significant differences in catecholamine concentrations depending on the site of sampling (arterial versus venous). Furthermore, other endogenous—but also exogenous—compounds like drugs and their metabolites have similar absorption and emission maxima as catecholamines and pterins (for example vitamin B6 and BH2).
Critical factors for the acquisition of CSF samples are the time point of sampling (best in the morning), the rostrocaudal gradient (higher concentrations of some metabolites in the final fraction than in the first one), the light sensitivity of some analytes, and the avoidance of blood contaminations. Therefore, a standardized lumbar puncture protocol under the highest clinical standards should be used, and analysis should be performed in a standardized CSF fraction. As CSF leaves the spine dropwise, counting the number of drops might be useful for estimating the sample volume. Samples must be frozen immediately at bedside and stored at −80 °C until analysis to prevent degradation of metabolites. Contaminations with blood have to be removed immediately by centrifugation at 4 °C prior to freezing, as hemolysis will result in a reduced level of HVA and 5-HIAA due to oxidation. In the CSF, pterins, 5-MTHF, and amino acids should always be included into analysis and, depending on the neurotransmitter pattern, also sepiapterin [1]. Moreover, it is important for interpretation to compare the patient’s values to age-matched reference values and to the patient´s own values [39]. Technically, as CSF does not contain as much interfering substances as are present in blood, plasma, urine, or tissue extracts, no extensive purification is necessary. Nevertheless, to ensure a good analytical performance, guard columns and graphite filters should be replaced regularly. Urine samples should always be protected from light until analysis, which should be performed best immediately within 24 h after voiding. To prevent decomposition of catecholamines, urine samples should have a pH of less than 4.0 but more than 2.0. If storage is necessary, urine should be kept at 20 °C up to −80 °C. Dried blood spots should always be dried completely before shipment or analysis.
For analysis, it is important to keep in mind that the separation conditions used can dramatically change the elution time of a compound. The most important factors include the pH value of the mobile phase and the ion-pairing reagent used. The pH of the mobile phase is related to the ionization degree of the analytes, depending on their pKa values [34]. As a function of the pH of the solvent and the pKa values of the analyte, differentially charged forms of the analytes can be present, which exhibit different chromatographic behaviors. Therefore, it is of highest importance to check the pH of the mobile phase before use in order to avoid small pH shifts, which can induce large shifts in retention time or peak shape [46]. The composition and the pH of the mobile phase is also important for the sensitivity of the electrodes in ECD. When using ECD, it is very important to identify the appropriate setting to achieve complete oxidation of the analyte of interest. The optimal potential is usually identified using a hydrodynamic voltagramm, which relates the generated current with applied potentials [34,47,160,161] after injection of a compound into the HPLC system and subsequent analysis over a range of different voltages with fixed increments [37]. For analysis, the lowest current producing the highest response of the analyte to the electrode should be used as this also reduces the background signal. As pH of the mobile phase can influence these conditions and the redox behavior of the analytes, the optimal pH has to be identified for analysis. The ideal pH value is the result of a balance between the pH value necessary for efficient oxidation of the analytes and the pH value suitable for efficient electrochemical reduction.

4.2. Diagnostic Pitfalls

Correct interpretation of the measurement results discussed above requires detailed clinical information focusing on patient history, prominent clinical symptoms, and radiological and genetic findings, as well as current drug therapy. As an example for measurement results we have included in the appendix example chromatograms for TH- and PTPS-deficiency before and after initiation of the therapy (Figure A1 and Figure A2). There are multiple neurological conditions other than primary neurotransmitter disorders showing alterations in biogenic amines (HVA, 5-HIAA) and pterins (especially neopterin) in CSF.
Ref. [162] showed in a cohort of 56 infants that there exist patients without a primary defect in neurotransmitter metabolism, but with low levels of HVA and 5-HIAA. Here, HVA deficiency was associated with severe motor impairment and importantly neurodegenerative disorders. In contrast, 5-HIAA levels were decreased in patients with brain cortical atrophy [162]. In line with this, [163] could show in 2013 in their cohort of 1388 patients with neurological disorders that 20% of the cohort showed altered levels of HVA. Low levels of HVA were frequently found in patients with CNS infections, perinatal hypoxic ischemic encephalopathy, mitochondrial disorders, and pontocerebellar hypoplasia type 2. In contrast, high HVA levels were present predominantly in patients suffering from mitochondrial diseases and intraventricular hemorrhage in preterm infants. Moreover, reduced levels of HVA have also been reported in epilepsy [164,165], febrile convulsion [166], postural tremor with dystonia [167], supranuclear palsy [167], dystonia [168](Tabaddor et al., 1978), rapid-onset dystonia-parkinsonism [169], depression [170,171], dementia [172], Lesh-Nyhan syndrome, Niemann Pick type C, and Multiple Sclerosis [173]. Supporting these findings, [174] found in 2015 also in patients with Allen-Herdon-Dudley syndrome, Prader-Willi syndrome, or asparagine synthetase deficiency lowered levels of HVA and/or 5-HIAA. Generally, low HVA and/or 5-HIAA or high HVA and normal 5-HIAA have been shown in 6–20% of patients suffering from encephalopathies, meningitis, mitochondrial diseases, pontocerebellar hypoplasia, leukodystrophies, de-/hypomyelination, neuropsychiatric conditions, Rett syndrome, Angelman syndrome, and hypoxic ischemic encephalopathy.
High levels of neopterin in CSF have been reported in different conditions not based on primary neurotransmitter biosynthesis defects. These include early infantile epileptic encephalopathy, Aicardi–Goutières syndrome, HIV infection (also reported with high neopterin and low 5-MTHF), and other immune disorders, as well as inflammation. It has been shown by [175] in 2003 that patients suffering from Aicardi-Goutières Syndrome can present with extremely high levels of neopterin in combination with lowered levels of 5-MTHF. Moreover, in untreated HIV patients, CSF neopterin levels are, in most cases, elevated and increase as immunosuppression becomes worse and the counts for CD4+ cells drop [176]. Patients suffering from HIV dementia have particularly high levels of CSF neopterin, which are higher than those measured in infected patients without neurological symptoms. HIV patients with opportunistic infections also show a high level of CSF neopterin. In patients under treatment, intrathecal immunactivation becomes reduced, and CSF neopterin levels are lowered. Nevertheless, neopterin levels in treated patients still remain mildly elevated compared to healthy controls. Neopterin can also be used as marker to distinguish between CNS and peripheral infections in children [177]. The group could show that serum levels of neopterin can be used to identify system infections, but not CNS-localized infections. In contrast, they found high levels of neopterin only in CSF samples of patients suffering from infections present in the CNS, compared to the values of healthy controls. The study also confirmed previous studies showing that peripheral and CNS levels of neopterin are not correlated. Taken together, the authors suggest the use of serum and CNS neopterin levels as an aid in distinguishing between inflammatory versus non-inflammatory disease and between CNS versus peripheral infection. Moreover, neurodegenerative diseases like Parkinson´s disease (PD) are also associated with changes in monoamine neurotransmitter levels. PD is mainly caused by dopamine deficiency in the striatum, which is considered to be due to the loss of nigro-striatal dopaminergic neurons with disease progression.
Current medication should also be taken into consideration when interpreting the laboratory results initially, but also during treatment monitoring. Drug treatment close to the date of CFS sampling can influence analysis. For example, levodopa (with or without aromatic amino acid decarboxylase inhibitors) can increase l-Dopa, 5-HIAA, and 5-HTOL. Methotrexate can result in a high CSF concentration of phenylalanine combined with low levels of 5-MTHF. Supplementation with folinic acid and sapropterin dihydrochloride (Kuvan®) leads to high levels of the related metabolites in the CSF. Also, monoamine oxidase inhibitors and serotonin re-uptake inhibitors can influence biogenic amine levels [87,178,179,180,181].
It should be mentioned that pyridoxal phosphate and 5-MTHF should be determined in addition to catecholamines and pterins, in case of suspicion of AADC deficiency and pyridoxine 5’-phosphate oxidase (PNPO) deficiency. In these disorders, high levels of vanillylactic acid in urine can occur besides the classical CSF pattern (low HVA, 5-HIAA, MHPG, elevated 3-OMD) [182]. Generally, patients suffering from AADC deficiency not only suffer from central catecholamine depletion, but also from depletion of 5-HT, because AADC converts both l-Dopa and 5-HTP to dopamine and 5-HT, respectively. As a consequence, in the patients, besides low levels of HVA, 5-HIAA and MHPG, high levels of 5-HTP and 3-OMD can be measured. 3-OMD accumulates if l-Dopa is not converted by AADC but by COMT. Furthermore, monitoring of 5-MTHF should be considered under AADC inhibition and 5-HTP therapy because of secondary folate depletion.
As a marker of central dopaminergic deficiency, high prolactin levels in plasma can be used, but normal prolactin levels do not exclude a neurotransmitter disorder [183]. It should be taken into consideration that hyperprolactinemia can have other reasons such as physiological or pathological endocrine conditions (hyperhtyroidism, prolactinoma), hypothalamus and pituitary disorders, systemic disorders, infections, drug related changes, renal failure, cirrhosis, and post-ictal status [184,185,186,187].

5. Conclusions and Future Perspective

There exists a broad spectrum of analytical tools for the determination of biogenic amines and pterins in clinically relevant specimen, including urine, blood, CSF, and patient-derived fibroblasts. This allows for choosing the best method that applies to a specific project or clinical application. Nevertheless, development of new and fast techniques is ongoing. These include targeted and untargeted metabolomics applications and NMR analyses. However, new techniques have also been developed, including the usage of quantum dots [188,189], Cu (II)-based metal-organic xerogels [190], or gold nanorods [191], for the determination of dopamine in human samples or fluorescence sensor arrays for the quantification of different neurotransmitters [192]. The practicability of these new methods in the context of clinical application has to be determined but holds great promise for a faster and more precise analysis. Moreover, with the dropping costs for next generation sequencing applications, whole genome and whole exome sequencing becomes more and more clinical routine. This allows—and will allow in the future—for the identification of patient-specific yet unknown disease-causing variants, and even new disease entities not directly linked to metabolic pathways but sharing features with metabolic diseases. One example is the recently described DNAJC12 deficiency, which is based on the mutation of a co-chaperone but presenting with hyperphenylalaninemia usually associated with PKU [2,3,4]. In the future, more and more of these “non-metabolic” causes of metabolic disorders are to be discovered. These might also include defects in genes involved in signal transduction or gene regulation (like the proteins involved in DNA methylation and demethylation). Nevertheless, it has to be kept in mind that every variant of unknown significance (VUS) which is identified in a patient has to be thoroughly analyzed on a functional level for its role in disease generation and/or progression. To achieve this, highly specific methods for the determination of enzymatic activity based on the measurement of the amount of the product have to be applied or, if not already present, need to be developed based on already available methods. For “non-metabolic” causes (e.g., not based on variants in an enzyme or transporter), as is the case for DNAJC12 deficiency, new routes to monitor protein activity/functionality have to be established.
Also, other high throughput analytical methods, including metabolomics (targeted and untargeted), will play an important role for diagnostic and therapeutic purposes in the future, and allow for a more precise surveillance of the applied therapies. This will provide new applications for personalized medicine, starting from the identification of an individual VUS, going via precise metabolic profiling in the patient, and leading to a personalized therapy and therapy monitoring based on the genetic and metabolic data of the patient, with the help of highly sensitive new analytical methods like quantum dots, nanorods, xerogels [190,191,192], newly developed ELISA assays, but also ultrafast HPLC methods like the pterinomics workflow described by Burton et al. in 2016 or the single-step protocol for the rapid analysis of catecholamines, pterins, and serotonin in one sample [40].

Author Contributions

S.J.-K. and O.K.H. wrote the paper.

Funding

This research received no external funding.

Acknowledgments

We thank Glynis Klinke and Thomas Opladen for their careful reading of the manuscript and insightful discussions. We acknowledge the financial support of the Deutsche Forschungsgemeinschaft (DFG, German Research Foundation) and Ruprecht Karls University Heidelberg within the funding program Open Access Publishing. We would like to apologize to researchers whose primary work cannot be cited due to space constraints.

Conflicts of Interest

The authors declare no conflict of interest.

Appendix A

Figure A1. Example chromatogram of a TH-deficient patient. (A) An example chromatogram of a patient suffering from TH-deficiency, as shown by the reduced levels of 3-OMD and HVA. (B) A chromatogram of the same patient three months after initiation of the therapy. The level of HVA has normalized, while the 3-OMD levels increased following L-Dopa supplementation. All measurements were performed as described in [149].
Cells 08 00867 g0a1
Figure A2. Example chromatograms of a patient suffering from PTPS-deficiency. (A) The characteristic reduction of both HVA and 5-HIAA in CSF before treatment initiation. (B) The characteristic low level of BH4 before treatment in CSF. (C) The high peak for neopterin present in the CSF before treatment. (D) The biogenic amines in the CSF of the same patients after treatment initiation. Levels of HVA and 5-HIAA have normalized and dopamine is detectable. (E) The BH4 level in the patient under treatment in CSF. (F) The level of neopterin in the CSF under treatment. (G) The neopterin level of the patient measured in urine before treatment and (H) under treatment. All measurements were performed according to [149].
Cells 08 00867 g0a2

References

  1. Brennenstuhl, H.; Jung-Klawitter, S.; Assmann, B.; Opladen, T. Inherited disorders of neurotransmitters: Classification and practical approaches for diagnosis and treatment. Neuropediatrics 2019, 50, 2–14. [Google Scholar] [CrossRef]
  2. Anikster, Y.; Haack, T.B.; Vilboux, T.; Pode-Shakked, B.; Thony, B.; Shen, N.; Guarani, V.; Meissner, T.; Mayatepek, E.; Trefz, F.K.; et al. Biallelic mutations in dnajc12 cause hyperphenylalaninemia, dystonia, and intellectual disability. Am. J. Hum. Genet. 2017, 100, 257–266. [Google Scholar] [CrossRef]
  3. Blau, N.; Martinez, A.; Hoffmann, G.F.; Thony, B. Dnajc12 deficiency: A new strategy in the diagnosis of hyperphenylalaninemias. Mol. Genet. Metab. 2018, 123, 1–5. [Google Scholar] [CrossRef]
  4. Straniero, L.; Guella, I.; Cilia, R.; Parkkinen, L.; Rimoldi, V.; Young, A.; Asselta, R.; Solda, G.; Sossi, V.; Stoessl, A.J.; et al. Dnajc12 and dopa-responsive nonprogressive parkinsonism. Ann. Neurol. 2017, 82, 640–646. [Google Scholar] [CrossRef]
  5. Bergquist, J.; Sciubisz, A.; Kaczor, A.; Silberring, J. Catecholamines and methods for their identification and quantitation in biological tissues and fluids. J. Neurosci. Methods 2002, 113, 1–13. [Google Scholar] [CrossRef]
  6. Goldstein, D.S.; Eisenhofer, G.; Kopin, I.J. Sources and significance of plasma levels of catechols and their metabolites in humans. J. Pharmacol. Exp. Ther. 2003, 305, 800–811. [Google Scholar] [CrossRef]
  7. Tsunoda, M. Recent advances in methods for the analysis of catecholamines and their metabolites. Anal. Bioanal. Chem. 2006, 386, 506–514. [Google Scholar] [CrossRef]
  8. Eisenhofer, G.; Kopin, I.J.; Goldstein, D.S. Catecholamine metabolism: A contemporary view with implications for physiology and medicine. Pharmacol. Rev. 2004, 56, 331–349. [Google Scholar] [CrossRef]
  9. Antkiewicz-Michaluk, L.; Ossowska, K.; Romanska, I.; Michaluk, J.; Vetulani, J. 3-methoxytyramine, an extraneuronal dopamine metabolite plays a physiological role in the brain as an inhibitory regulator of catecholaminergic activity. Eur. J. Pharmacol. 2008, 599, 32–35. [Google Scholar] [CrossRef]
  10. Uutela, P.; Reinila, R.; Harju, K.; Piepponen, P.; Ketola, R.A.; Kostiainen, R. Analysis of intact glucuronides and sulfates of serotonin, dopamine, and their phase i metabolites in rat brain microdialysates by liquid chromatography-tandem mass spectrometry. Anal. Chem. 2009, 81, 8417–8425. [Google Scholar] [CrossRef]
  11. Bicker, J.; Fortuna, A.; Alves, G.; Falcão, A. Liquid chromatographic methods for the quantification of catecholamines and their metabolites in several biological samples. Anal. Chim. Acta 2013, 768, 12–34. [Google Scholar] [CrossRef]
  12. Nichol, C.A.; Smith, G.K.; Duch, D.S. Biosynthesis and metabolism of tetrahydrobiopterin and molybdopterin. Annu. Rev. Biochem. 1985, 54, 729–764. [Google Scholar] [CrossRef]
  13. Milstien, S.; Kaufman, S. Tetrahydro-sepiapterin is an intermediate in tetrahydrobiopterin biosynthesis. Biochem. Biophys. Res. Commun. 1983, 115, 888–893. [Google Scholar] [CrossRef]
  14. Milstien, S.; Kaufman, S. Immunological studies on the participation of 6-pyruvoyl tetrahydropterin (2’-oxo) reductase, an aldose reductase, in tetrahydrobiopterin biosynthesis. Biochem. Biophys. Res. Commun. 1989, 165, 845–850. [Google Scholar] [CrossRef]
  15. Iino, T.; Tabata, M.; Takikawa, S.; Sawada, H.; Shintaku, H.; Ishikura, S.; Hara, A. Tetrahydrobiopterin is synthesized from 6-pyruvoyl-tetrahydropterin by the human aldo-keto reductase akr1 family members. Arch. Biochem. Biophys. 2003, 416, 180–187. [Google Scholar] [CrossRef]
  16. Werner, E.R.; Blau, N.; Thony, B. Tetrahydrobiopterin: Biochemistry and pathophysiology. Biochem. J. 2011, 438, 397–414. [Google Scholar] [CrossRef]
  17. Peaston, R.T.; Weinkove, C. Measurement of catecholamines and their metabolites. Ann. Clin. Biochem. 2004, 41, 17–38. [Google Scholar] [CrossRef] [Green Version]
  18. Roberts, N.B.; Higgins, G.; Sargazi, M. A study on the stability of urinary free catecholamines and free methyl-derivatives at different ph, temperature and time of storage. Clin. Chem. Lab. Med. 2010, 48, 81–87. [Google Scholar] [CrossRef]
  19. Smith, E.A.; Schwartz, A.L.; Lucot, J.B. Measurement of urinary catecholamines in small samples for mice. J. Pharmacol. Toxicol. Methods 2013, 67, 45–49. [Google Scholar] [CrossRef]
  20. Li, W.; Rossi, D.T.; Fountain, S.T. Development and validation of a semi-automated method for l-dopa and dopamine in rat plasma using electrospray lc/ms/ms. J. Pharm. Biomed. Anal. 2000, 24, 325–333. [Google Scholar] [CrossRef]
  21. Neubecker, T.A.; Coombs, M.A.; Quijano, M.; O’Neill, T.P.; Cruze, C.A.; Dobson, R.L. Rapid and selective method for norepinephrine in rat urine using reversed-phase ion-pair high-performance liquid chromatography-tandem mass spectrometry. J. Chromatogr. B Biomed. Sci. Appl. 1998, 718, 225–233. [Google Scholar] [CrossRef]
  22. Wang, Y.; Fice, D.S.; Yeung, P.K. A simple high-performance liquid chromatography assay for simultaneous determination of plasma norepinephrine, epinephrine, dopamine and 3,4-dihydroxyphenyl acetic acid. J. Pharm. Biomed. Anal. 1999, 21, 519–525. [Google Scholar] [CrossRef]
  23. Cakal, C.; Ferrance, J.P.; Landers, J.P.; Caglar, P. Microchip extraction of catecholamines using a boronic acid functional affinity monolith. Anal. Chim. Acta 2011, 690, 94–100. [Google Scholar] [CrossRef]
  24. Raggi, M.A.; Sabbioni, C.; Casamenti, G.; Gerra, G.; Calonghi, N.; Masotti, L. Determination of catecholamines in human plasma by high-performance liquid chromatography with electrochemical detection. J. Chromatogr. B Biomed. Sci. Appl. 1999, 730, 201–211. [Google Scholar] [CrossRef]
  25. Rozet, E.; Morello, R.; Lecomte, F.; Martin, G.B.; Chiap, P.; Crommen, J.; Boos, K.S.; Hubert, P. Performances of a multidimensional on-line spe-lc-ecd method for the determination of three major catecholamines in native human urine: Validation, risk and uncertainty assessments. J. Chromatogr. B Anal. Technol. Biomed. Life Sci. 2006, 844, 251–260. [Google Scholar] [CrossRef]
  26. De Jong, W.H.; de Vries, E.G.; Wolffenbuttel, B.H.; Kema, I.P. Automated mass spectrometric analysis of urinary free catecholamines using on-line solid phase extraction. J. Chromatogr. B Anal. Technol. Biomed. Life Sci. 2010, 878, 1506–1512. [Google Scholar] [CrossRef]
  27. Zhang, G.; Zhang, Y.; Ji, C.; McDonald, T.; Walton, J.; Groeber, E.A.; Steenwyk, R.C.; Lin, Z. Ultra sensitive measurement of endogenous epinephrine and norepinephrine in human plasma by semi-automated spe-lc-ms/ms. J. Chromatogr. B Anal. Technol. Biomed. Life Sci. 2012, 895, 186–190. [Google Scholar] [CrossRef]
  28. Raggi, M.A.; Sabbioni, C.; Nicoletta, G.; Mandrioli, R.; Gerra, G. Analysis of plasma catecholamines by liquid chromatography with amperometric detection using a novel spe ion-exchange procedure. J. Sep. Sci. 2003, 26, 1141–1146. [Google Scholar] [CrossRef]
  29. Sabbioni, C.; Saracino, M.A.; Mandrioli, R.; Pinzauti, S.; Furlanetto, S.; Gerra, G.; Raggi, M.A. Simultaneous liquid chromatographic analysis of catecholamines and 4-hydroxy-3-methoxyphenylethylene glycol in human plasma. Comparison of amperometric and coulometric detection. J. Chromatogr. A 2004, 1032, 65–71. [Google Scholar] [CrossRef]
  30. Talwar, D.; Williamson, C.; McLaughlin, A.; Gill, A.; O’Reilly, D.S. Extraction and separation of urinary catecholamines as their diphenyl boronate complexes using c18 solid-phase extraction sorbent and high-performance liquid chromatography. J. Chromatogr. B Anal. Technol. Biomed. Life Sci. 2002, 769, 341–349. [Google Scholar] [CrossRef]
  31. Hirano, Y.; Tsunoda, M.; Funatsu, T.; Imai, K. Rapid assay for catechol-o-methyltransferase activity by high-performance liquid chromatography-fluorescence detection. J. Chromatogr. B Anal. Technol. Biomed. Life Sci. 2005, 819, 41–46. [Google Scholar] [CrossRef]
  32. Masuda, M.; Tsunoda, M.; Imai, K. High-performance liquid chromatography-fluorescent assay of catechol-o-methyltransferase activity in rat brain. Anal. Bioanal. Chem. 2003, 376, 1069–1073. [Google Scholar] [CrossRef]
  33. Chi, J.D.; Odontiadis, J.; Franklin, M. Simultaneous determination of catecholamines in rat brain tissue by high-performance liquid chromatography. J. Chromatogr. B Biomed. Sci. Appl. 1999, 731, 361–367. [Google Scholar] [CrossRef]
  34. Vaarmann, A.; Kask, A.; Maeorg, U. Novel and sensitive high-performance liquid chromatographic method based on electrochemical coulometric array detection for simultaneous determination of catecholamines, kynurenine and indole derivatives of tryptophan. J. Chromatogr. B Anal. Technol. Biomed. Life Sci. 2002, 769, 145–153. [Google Scholar] [CrossRef]
  35. Yoshitake, T.; Kehr, J.; Yoshitake, S.; Fujino, K.; Nohta, H.; Yamaguchi, M. Determination of serotonin, noradrenaline, dopamine and their metabolites in rat brain extracts and microdialysis samples by column liquid chromatography with fluorescence detection following derivatization with benzylamine and 1,2-diphenylethylenediamine. J. Chromatogr. B Anal. Technol. Biomed. Life Sci. 2004, 807, 177–183. [Google Scholar] [CrossRef]
  36. Tornkvist, A.; Sjoberg, P.J.; Markides, K.E.; Bergquist, J. Analysis of catecholamines and related substances using porous graphitic carbon as separation media in liquid chromatography-tandem mass spectrometry. J. Chromatogr. B Anal. Technol. Biomed. Life Sci. 2004, 801, 323–329. [Google Scholar] [CrossRef]
  37. Hubbard, K.E.; Wells, A.; Owens, T.S.; Tagen, M.; Fraga, C.H.; Stewart, C.F. Determination of dopamine, serotonin, and their metabolites in pediatric cerebrospinal fluid by isocratic high performance liquid chromatography coupled with electrochemical detection. Biomed. Chromatogr. 2010, 24, 626–631. [Google Scholar] [CrossRef]
  38. Verbeek, M.M.; Blom, A.M.; Wevers, R.A.; Lagerwerf, A.J.; van de Geer, J.; Willemsen, M.A. Technical and biochemical factors affecting cerebrospinal fluid 5-mthf, biopterin and neopterin concentrations. Mol. Genet. Metab. 2008, 95, 127–132. [Google Scholar] [CrossRef]
  39. Batllori, M.; Molero-Luis, M.; Ormazabal, A.; Casado, M.; Sierra, C.; Garcia-Cazorla, A.; Kurian, M.; Pope, S.; Heales, S.J.; Artuch, R. Analysis of human cerebrospinal fluid monoamines and their cofactors by hplc. Nat. Protoc. 2017, 12, 2359–2375. [Google Scholar] [CrossRef]
  40. Lo, A.; Guibal, P.; Doummar, D.; Rodriguez, D.; Hautem, J.Y.; Couderc, R.; Billette De Villemeur, T.; Roze, E.; Chaminade, P.; Moussa, F. Single-step rapid diagnosis of dopamine and serotonin metabolism disorders. ACS Omega 2017, 2, 5962–5972. [Google Scholar] [CrossRef]
  41. He, X.; Kozak, M. Development of a liquid chromatography-tandem mass spectrometry method for plasma-free metanephrines with ion-pairing turbulent flow online extraction. Anal. Bioanal. Chem. 2012, 402, 3003–3010. [Google Scholar] [CrossRef]
  42. Petteys, B.J.; Graham, K.S.; Parnas, M.L.; Holt, C.; Frank, E.L. Performance characteristics of an lc-ms/ms method for the determination of plasma metanephrines. Clin. Chim. Acta 2012, 413, 1459–1465. [Google Scholar] [CrossRef]
  43. He, X.; Gabler, J.; Yuan, C.; Wang, S.; Shi, Y.; Kozak, M. Quantitative measurement of plasma free metanephrines by ion-pairing solid phase extraction and liquid chromatography-tandem mass spectrometry with porous graphitic carbon column. J. Chromatogr. B Anal. Technol. Biomed. Life Sci. 2011, 879, 2355–2359. [Google Scholar] [CrossRef]
  44. Peaston, R.T.; Graham, K.S.; Chambers, E.; van der Molen, J.C.; Ball, S. Performance of plasma free metanephrines measured by liquid chromatography-tandem mass spectrometry in the diagnosis of pheochromocytoma. Clin. Chim. Acta 2010, 411, 546–552. [Google Scholar] [CrossRef]
  45. Tsunoda, M.; Nagayama, M.; Funatsu, T.; Hosoda, S.; Imai, K. Catecholamine analysis with microcolumn LC-peroxyoxylate chemiluminescence reaction detection. Clin. Chim. Acta 2005, 366, 168–173. [Google Scholar] [CrossRef]
  46. Karimi, M.; Carl, J.L.; Loftin, S.; Perlmutter, J.S. Modified high-performance liquid chromatography with electrochemical detection method for plasma measurement of levodopa, 3-o-methyldopa, dopamine, carbidopa and 3,4-dihydroxyphenyl acetic acid. J. Chromatogr. B Anal. Technol. Biomed. Life Sci. 2006, 836, 120–123. [Google Scholar] [CrossRef]
  47. Machida, M.; Sakaguchi, A.; Kamada, S.; Fujimoto, T.; Takechi, S.; Kakinoki, S.; Nomura, A. Simultaneous analysis of human plasma catecholamines by high-performance liquid chromatography with a reversed-phase triacontylsilyl silica column. J. Chromatogr. B Anal. Technol. Biomed. Life Sci. 2006, 830, 249–254. [Google Scholar] [CrossRef]
  48. Ragab, G.H.; Nohta, H.; Zaitsu, K. Chemiluminescence determination of catecholamines in human blood plasma using 1,2-bis(3-chlorophenyl)ethylenediamine as pre-column derivatizing reagent for liquid chromatography. Anal. Chim. Acta 2000, 403, 155–160. [Google Scholar] [CrossRef]
  49. Hollenbach, E.; Schulz, C.; Lehnert, H. Rapid and sensitive determination of catecholamines and the metabolite 3-methoxy-4-hydroxyphen-ethyleneglycol using hplc following novel extraction procedures. Life Sci. 1998, 63, 737–750. [Google Scholar] [CrossRef]
  50. Clark, Z.D.; Frank, E.L. Urinary metanephrines by liquid chromatography tandem mass spectrometry: Using multiple quantification methods to minimize interferences in a high throughput method. J. Chromatogr. B Anal. Technol. Biomed. Life Sci. 2011, 879, 3673–3680. [Google Scholar] [CrossRef]
  51. Kumar, A.; Hart, J.P.; McCalley, D.V. Determination of catecholamines in urine using hydrophilic interaction chromatography with electrochemical detection. J. Chromatogr. A 2011, 1218, 3854–3861. [Google Scholar] [CrossRef]
  52. Sakaguchi, Y.; Yoshida, H.; Hayama, T.; Itoyama, M.; Todoroki, K.; Yamaguchi, M.; Nohta, H. Selective liquid-chromatographic determination of native fluorescent biogenic amines in human urine based on fluorous derivatization. J. Chromatogr. A 2011, 1218, 5581–5586. [Google Scholar] [CrossRef]
  53. Thomas, D.H.; Taylor, J.D.; Barnaby, O.S.; Hage, D.S. Determination of free catecholamines in urine by tandem affinity/ion-pair chromatography and flow injection analysis. Clin. Chim. Acta 2008, 398, 63–69. [Google Scholar] [CrossRef] [Green Version]
  54. Fotopoulou, M.A.; Ioannou, P.C. Post-column terbium complexation and sensitized fluorescence detection for the determination of norepinephrine, epinephrine and dopamine using high-performance liquid chromatography. Anal. Chim. Acta 2002, 462, 179–185. [Google Scholar] [CrossRef]
  55. Kushnir, M.M.; Urry, F.M.; Frank, E.L.; Roberts, W.L.; Shushan, B. Analysis of catecholamines in urine by positive-ion electrospray tandem mass spectrometry. Clin. Chem. 2002, 48, 323–331. [Google Scholar]
  56. Chan, E.C.; Ho, P.C. High-performance liquid chromatography/atmospheric pressure chemical ionization mass spectrometric method for the analysis of catecholamines and metanephrines in human urine. Rapid Commun. Mass Spectrom. 2000, 14, 1959–1964. [Google Scholar] [CrossRef]
  57. Chan, E.C.; Wee, P.Y.; Ho, P.C. Evaluation of degradation of urinary catecholamines and metanephrines and deconjugation of their sulfoconjugates using stability-indicating reversed-phase ion-pair hplc with electrochemical detection. J. Pharm. Biomed. Anal. 2000, 22, 515–526. [Google Scholar] [CrossRef]
  58. Blau, N.; Kierat, L.; Matasovic, A.; Leimbacher, W.; Heizmann, C.W.; Guardamagna, O.; Ponzone, A. Antenatal diagnosis of tetrahydrobiopterin deficiency by quantification of pterins in amniotic fluid and enzyme activity in fetal and extrafetal tissue. Clin. Chim. Acta 1994, 226, 159–169. [Google Scholar] [CrossRef]
  59. Gabler, J.; Miller, A.; Wang, S. A simple liquid chromatography-tandem mass spectrometry method for measuring metanephrine and normetanephrine in urine. Clin. Chem. Lab. Med. 2011, 49, 1213–1216. [Google Scholar] [CrossRef]
  60. Nalewajko, E.; Wiszowata, A.; Kojlo, A. Determination of catecholamines by flow-injection analysis and high-performance liquid chromatography with chemiluminescence detection. J. Pharm. Biomed. Anal. 2007, 43, 1673–1681. [Google Scholar] [CrossRef]
  61. Gu, Q.S.; Shi, Y.; Yin, P.; Gao, P.; Lu, X.; Xu, G. Analysis of catecholamines and their metabolites in adrenal gland by liquid chromatography tandem mass spectrometry. Anal. Chim. Acta 2008, 609, 192–200. [Google Scholar] [CrossRef]
  62. Tsunoda, M.A.; Aoyama, C.; Nomura, H.; Toyoda, T.; Masuki, N.; Funatsu, T. Simultaneous determination of dopamine and 3,4-dihydroxyphenylacetic acid in mouse striatum using mixed-mode reversed-phase and cation-exchange high-performance liquid chromatography. J. Pharm. Biomed. Anal. 2010, 51, 712–715. [Google Scholar] [CrossRef]
  63. Heidbreder, C.A.; Lacroix, L.; Atkins, A.R.; Organ, A.J.; Murray, S.; West, A.; Shah, A.J. Development and application of a sensitive high performance ion-exchange chromatography method for the simultaneous measurement of dopamine, 5-hydroxytryptamine and norepinephrine in microdialysates from the rat brain. J. Neurosci. Methods 2001, 112, 135–144. [Google Scholar] [CrossRef]
  64. Okumura, T.; Nakajima, Y.; Matsuoka, M.; Takamatsu, T. Study of salivary catecholamines using fully automated column-switching high-performance liquid chromatography. J. Chromatogr. B Biomed. Sci. Appl. 1997, 694, 305–316. [Google Scholar] [CrossRef]
  65. Tsunoda, M.; Funatsu, T. Catecholamine analysis with strong cation exchange column liquid chromatography-peroxyoxalate chemiluminescence reaction detection. Anal. Bioanal. Chem. 2012, 402, 1393–1397. [Google Scholar] [CrossRef]
  66. Ji, C.; Walton, J.; Su, Y.; Tella, M. Simultaneous determination of plasma epinephrine and norepinephrine using an integrated strategy of a fully automated protein precipitation technique, reductive ethylation labeling and uplc-ms/ms. Anal. Chim. Acta 2010, 670, 84–91. [Google Scholar] [CrossRef]
  67. Parrot, S.; Neuzeret, P.C.; Denoroy, L. A rapid and sensitive method for the analysis of brain monoamine neurotransmitters using ultra-fast liquid chromatography coupled to electrochemical detection. J. Chromatogr. B Anal. Technol. Biomed. Life Sci. 2011, 879, 3871–3878. [Google Scholar] [CrossRef]
  68. Chaurasia, C.S.; Chen, C.E.; Ashby, C.R., Jr. In vivo on-line hplc-microdialysis: Simultaneous detection of monoamines and their metabolites in awake freely-moving rats. J. Pharm. Biomed. Anal. 1999, 19, 413–422. [Google Scholar] [CrossRef]
  69. Ormazabal, A.; García-Cazorla, A.; Fernández, Y.; Fernández-Álvarez, E.; Campistol, J.; Artuch, R. Hplc with electrochemical and fluorescence detection procedures for the diagnosis of inborn errors of biogenic amines and pterins. J. Neurosci. Methods 2005, 142, 153–158. [Google Scholar] [CrossRef]
  70. Patel, B.A.; Arundell, M.; Allen, M.C.; Gard, P.; O’Hare, D.; Parker, K.; Yeoman, M.S. Changes in the properties of the modulatory cerebral giant cells contribute to aging in the feeding system of lymnaea. Neurobiol. Aging 2006, 27, 1892–1901. [Google Scholar] [CrossRef]
  71. Manica, D.P.; Mitsumori, Y.; Ewing, A.G. Characterization of electrode fouling and surface regeneration for a platinum electrode on an electrophoresis microchip. Anal. Chem. 2003, 75, 4572–4577. [Google Scholar] [CrossRef]
  72. Yoshitake, M.; Nohta, H.; Yoshida, H.; Yoshitake, T.; Todoroki, K.; Yamaguchi, M. Selective determination of native fluorescent bioamines through precolumn derivatization and liquid chromatography using intramolecular fluorescence resonance energy transfer detection. Anal. Chem. 2006, 78, 920–927. [Google Scholar] [CrossRef]
  73. Todoroki, K.; Yoshida, H.; Hayama, T.; Itoyama, M.; Nohta, H.; Yamaguchi, M. Highly sensitive and selective derivatization-lc method for biomolecules based on fluorescence interactions and fluorous separations. J. Chromatogr. B Anal. Technol. Biomed. Life Sci. 2011, 879, 1325–1337. [Google Scholar] [CrossRef]
  74. Chan, E.C.; Wee, P.Y.; Ho, P.Y.; Ho, P.C. High-performance liquid chromatographic assay for catecholamines and metanephrines using fluorimetric detection with pre-column 9-fluorenylmethyloxycarbonyl chloride derivatization. J. Chromatogr. B Biomed. Sci. Appl. 2000, 749, 179–189. [Google Scholar] [CrossRef]
  75. Fujino, K.; Yoshitake, T.; Kehr, J.; Nohta, H.; Yamaguchi, M. Simultaneous determination of 5-hydroxyindoles and catechols by high-performance liquid chromatography with fluorescence detection following derivatization with benzylamine and 1,2-diphenylethylenediamine. J. Chromatogr. A 2003, 1012, 169–177. [Google Scholar] [CrossRef]
  76. Umegae, Y.; Nohta, H.; Lee, M.; Ohkura, Y. 1,2-diarylethylenediamines as pre-column fluorescence derivatization reagents in high-performance liquid chromatographic determination of catecholamines in urine and plasma. Chem. Pharm. Bull. (Tokyo) 1990, 38, 2293–2295. [Google Scholar] [CrossRef]
  77. Jeon, H.K.; Nohta, H.; Ohkura, Y. High-performance liquid chromatographic determination of catecholamines and their precursor and metabolites in human urine and plasma by postcolumn derivatization involving chemical oxidation followed by fluorescence reaction. Anal. Biochem. 1992, 200, 332–338. [Google Scholar] [CrossRef]
  78. Tsunoda, M.; Mitsuhashi, K.; Masuda, M.; Imai, K. Simultaneous determination of 3,4-dihydroxyphenylacetic acid and homovanillic acid using high performance liquid chromatography-fluorescence detection and application to rat kidney microdialysate. Anal. Biochem. 2002, 307, 153–158. [Google Scholar] [CrossRef]
  79. Aoyama, N.; Tsunoda, M.; Nakagomi, K.; Imai, K. A rapid assay method for catechol-o-methyltransferase activity by flow injection analysis. Biomed. Chromatogr. 2002, 16, 255–260. [Google Scholar] [CrossRef]
  80. Yamaguchi, M.; Yoshitake, T.; Fujino, K.; Kawano, K.; Kehr, J.; Ishida, J. Determination of norepinephrine in microdialysis samples by microbore column liquid chromatography with fluorescence detection following derivatization with benzylamine. Anal. Biochem. 1999, 270, 296–302. [Google Scholar] [CrossRef]
  81. Tsunoda, M.; Takezawa, K.; Masuda, M.; Imai, K. Rat liver and kidney catechol-o-methyltransferase activity measured by high-performance liquid chromatography with fluorescence detection. Biomed. Chromatogr. 2002, 16, 536–541. [Google Scholar] [CrossRef]
  82. Tsunoda, M.; Takezawa, K.; Santa, T.; Imai, K. Simultaneous automatic determination of catecholamines and their 3-o-methyl metabolites in rat plasma by high-performance liquid chromatography using peroxyoxalate chemiluminescence reaction. Anal. Biochem. 1999, 269, 386–392. [Google Scholar] [CrossRef]
  83. Zhang, M.Y.; Beyer, C.E. Measurement of neurotransmitters from extracellular fluid in brain by in vivo microdialysis and chromatography-mass spectrometry. J. Pharm. Biomed. Anal. 2006, 40, 492–499. [Google Scholar] [CrossRef]
  84. Zhang, W.; Xie, Y.; Ai, S.; Wan, F.; Wang, J.; Jin, L.; Jin, J. Liquid chromatography with amperometric detection using functionalized multi-wall carbon nanotube modified electrode for the determination of monoamine neurotransmitters and their metabolites. J. Chromatogr. B Anal. Technol. Biomed. Life Sci. 2003, 791, 217–225. [Google Scholar] [CrossRef]
  85. Forster, C.D.; Macdonald, I.A. The assay of the catecholamine content of small volumes of human plasma. Biomed. Chromatogr. 1999, 13, 209–215. [Google Scholar] [CrossRef]
  86. Liu, L.; Li, Q.; Li, N.; Ling, J.; Liu, R.; Wang, Y.; Sun, L.; Chen, X.H.; Bi, K. Simultaneous determination of catecholamines and their metabolites related to alzheimer’s disease in human urine. J. Sep. Sci. 2011, 34, 1198–1204. [Google Scholar] [CrossRef]
  87. Hyland, K. Clinical utility of monoamine neurotransmitter metabolite analysis in cerebrospinal fluid. Clin. Chem. 2008, 54, 633–641. [Google Scholar] [CrossRef]
  88. Strawn, J.R.; Ekhator, N.N.; Geracioti, T.D., Jr. In-use stability of monoamine metabolites in human cerebrospinal fluid. J. Chromatogr. B Biomed. Sci. Appl. 2001, 760, 301–306. [Google Scholar] [CrossRef]
  89. Willemsen, J.J.; Ross, H.A.; Lenders, J.W.; Sweep, F.C. Stability of urinary fractionated metanephrines and catecholamines during collection, shipment, and storage of samples. Clin. Chem. 2007, 53, 268–272. [Google Scholar] [CrossRef]
  90. Boomsma, F.; Alberts, G.; van Eijk, L.; Man in’t Veld, A.J.; Schalekamp, M.A. Optimal collection and storage conditions for catecholamine measurements in human plasma and urine. Clin. Chem. 1993, 39, 2503–2508. [Google Scholar]
  91. Moleman, P. Preservation of urine samples for assay of catecholamines and their metabolites. Clin. Chem. 1985, 31, 653–654. [Google Scholar]
  92. Ellingson, T.; Duddempudi, S.; Greenberg, B.D.; Hooper, D.; Eisenhofer, G. Determination of differential activities of soluble and membrane-bound catechol-o-methyltransferase in tissues and erythrocytes. J. Chromatogr. B Biomed. Sci. Appl. 1999, 729, 347–353. [Google Scholar] [CrossRef]
  93. Nagatsu, T.; Levitt, M.; Udenfriend, S. Tyrosine hydroxylase. The initial step in norepinephrine biosynthesis. J. Biol. Chem. 1964, 239, 2910–2917. [Google Scholar]
  94. Vermeer, L.M.; Higgins, C.A.; Roman, D.L.; Doorn, J.A. Real-time monitoring of tyrosine hydroxylase activity using a plate reader assay. Anal. Biochem. 2013, 432, 11–15. [Google Scholar] [CrossRef]
  95. Fossbakk, A.; Kleppe, R.; Knappskog, P.M.; Martinez, A.; Haavik, J. Functional studies of tyrosine hydroxylase missense variants reveal distinct patterns of molecular defects in dopa-responsive dystonia. Hum. Mutat. 2014, 35, 880–890. [Google Scholar] [CrossRef]
  96. Nagatsu, T.; Levitt, M.; Udenfriend, S. A rapid and simple radioassay for tyrosine hydroxylase activity. Anal. Biochem. 1964, 9, 122–126. [Google Scholar] [CrossRef]
  97. Nagatsu, T.; Levitt, M.; Udenfriend, S. Conversion of l-tyrosine to 3,4-dihydroxyphenylalanine by cell-free preparations of brain and sympathetically innervated tissues. Biochem. Biophys. Res. Commun. 1964, 14, 543–549. [Google Scholar] [CrossRef]
  98. Nagatsu, T.; Ichinose, H.; Kojima, K.; Kameya, T.; Shimase, J.; Kodama, T.; Shimosato, Y. Aromatic l-amino acid decarboxylase activities in human lung tissues: Comparison between normal lung and lung carcinomas. Biochem. Med. 1985, 34, 52–59. [Google Scholar] [CrossRef]
  99. Hoekstra, R.; Fekkes, D. Pteridines and affective disorders. Acta Neuropsychiatr. 2002, 14, 120–126. [Google Scholar] [CrossRef]
  100. Perry, M.; Li, Q.; Kennedy, R.T. Review of recent advances in analytical techniques for the determination of neurotransmitters. Anal. Chim. Acta 2009, 653, 1–22. [Google Scholar] [CrossRef] [Green Version]
  101. Blau, N.; Thony, B. Pterins and related enzymes. In Laboratory Guide to the Methods in Biochemical Genetics; Blau, N.D.M., Gibson, K.M., Eds.; Springer: Heidelberg, Germany, 2008; pp. 665–702. [Google Scholar]
  102. Opladen, T.; Abu Seda, B.; Rassi, A.; Thony, B.; Hoffmann, G.F.; Blau, N. Diagnosis of tetrahydrobiopterin deficiency using filter paper blood spots: Further development of the method and 5 years experience. J. Inherit. Metab. Dis. 2011, 34, 819–826. [Google Scholar] [CrossRef]
  103. Carducci, C.; Santagata, S.; Friedman, J.; Pasquini, E.; Carducci, C.; Tolve, M.; Angeloni, A.; Leuzzi, V. Urine sepiapterin excretion as a new diagnostic marker for sepiapterin reductase deficiency. Mol. Genet. Metab. 2015, 115, 157–160. [Google Scholar] [CrossRef]
  104. Bourcier, S.; Benoist, J.F.; Clerc, F.; Rigal, O.; Taghi, M.; Hoppilliard, Y. Detection of 28 neurotransmitters and related compounds in biological fluids by liquid chromatography/tandem mass spectrometry. Rapid Commun. Mass Spectrom. 2006, 20, 1405–1421. [Google Scholar] [CrossRef]
  105. Zhao, Y.; Cao, J.; Chen, Y.S.; Zhu, Y.; Patrick, C.; Chien, B.; Cheng, A.; Foehr, E.D. Detection of tetrahydrobiopterin by lc-ms/ms in plasma from multiple species. Bioanalysis 2009, 1, 895–903. [Google Scholar] [CrossRef]
  106. Fiege, B.; Ballhausen, D.; Kierat, L.; Leimbacher, W.; Goriounov, D.; Schircks, B.; Thony, B.; Blau, N. Plasma tetrahydrobiopterin and its pharmacokinetic following oral administration. Mol. Genet. Metab. 2004, 81, 45–51. [Google Scholar] [CrossRef]
  107. Fekkes, D.; Voskuilen-Kooijman, A. Quantitation of total biopterin and tetrahydrobiopterin in plasma. Clin. Biochem. 2007, 40, 411–413. [Google Scholar] [CrossRef]
  108. Arning, E.; Bottiglieri, T. Lc-ms/ms analysis of cerebrospinal fluid metabolites in the pterin biosynthetic pathway. JIMD Rep. 2016, 29, 1–9. [Google Scholar]
  109. Fukushima, T.; Nixon, J.C. Analysis of reduced forms of biopterin in biological tissues and fluids. Anal. Biochem. 1980, 102, 176–188. [Google Scholar] [CrossRef]
  110. Fukushima, T.; Nixon, J.C. Chromatographic analysis of pteridines. Methods Enzymol. 1980, 66, 429–436. [Google Scholar]
  111. Werner, E.R.; Werner-Felmayer, G.; Wachter, H. High-performance liquid chromatographic methods for the quantification of tetrahydrobiopterin biosynthetic enzymes. J. Chromatogr. B Biomed. Appl. 1996, 684, 51–58. [Google Scholar] [CrossRef]
  112. Espinosa-Mansilla, A.M.; de la Pena, A.M.; Canada-Canada, F.; Mancha de Llanos, A. Lc determination of biopterin reduced forms by uv-photogeneration of biopterin and fluorimetric detection. Talanta 2008, 77, 844–851. [Google Scholar] [CrossRef]
  113. Canada-Canada, F.; Espinosa-Mansilla, A.; Munoz de la Pena, A.; Mancha de Llanos, A. Determination of marker pteridins and biopterin reduced forms, tetrahydrobiopterin and dihydrobiopterin, in human urine, using a post-column photoinduced fluorescence liquid chromatographic derivatization method. Anal. Chim. Acta 2009, 648, 113–122. [Google Scholar] [CrossRef]
  114. Milstien, S.; Kaufman, S.; Sakai, N. Tetrahydrobiopterin biosynthesis defects examined in cytokine-stimulated fibroblasts. J. Inherit. Metab. Dis. 1993, 16, 975–981. [Google Scholar] [CrossRef]
  115. Bonafe, L.; Thony, B.; Penzien, J.M.; Czarnecki, B.; Blau, N. Mutations in the sepiapterin reductase gene cause a novel tetrahydrobiopterin-dependent monoamine-neurotransmitter deficiency without hyperphenylalaninemia. Am. J. Hum. Genet. 2001, 69, 269–277. [Google Scholar] [CrossRef]
  116. Hibiya, M.; Ichinose, H.; Ozaki, N.; Fujita, K.; Nishimoto, T.; Yoshikawa, T.; Asano, Y.; Nagatsu, T. Normal values and age-dependent changes in gtp cyclohydrolase i activity in stimulated mononuclear blood cells measured by high-performance liquid chromatography. J. Chromatogr. B Biomed. Sci. Appl. 2000, 740, 35–42. [Google Scholar] [CrossRef]
  117. Fismen, L.; Eide, T.; Djurhuus, R.; Svardal, A.M. Simultaneous quantification of tetrahydrobiopterin, dihydrobiopterin, and biopterin by liquid chromatography coupled electrospray tandem mass spectrometry. Anal. Biochem. 2012, 430, 163–170. [Google Scholar] [CrossRef]
  118. Guibal, P.; Leveque, N.; Doummar, D.; Giraud, N.; Roze, E.; Rodriguez, D.; Couderc, R.; Billette De Villemeur, T.; Moussa, F. Simultaneous determination of all forms of biopterin and neopterin in cerebrospinal fluid. ACS Chem. Neurosci. 2014, 5, 533–541. [Google Scholar] [CrossRef]
  119. Yuan, T.F.; Huang, H.Q.; Gao, L.; Wang, S.T.; Li, Y. A novel and reliable method for tetrahydrobiopterin quantification: Benzoyl chloride derivatization coupled with liquid chromatography-tandem mass spectrometry analysis. Free Radic. Biol. Med. 2018, 118, 119–125. [Google Scholar] [CrossRef]
  120. Ponzone, A.; Guardamagna, O.; Spada, M.; Ponzone, R.; Sartore, M.; Kierat, L.; Heizmann, C.W.; Blau, N. Hyperphenylalaninemia and pterin metabolism in serum and erythrocytes. Clin. Chim. Acta 1993, 216, 63–71. [Google Scholar] [CrossRef]
  121. Slazyk, W.E.; Spierto, F.W. Liquid-chromatographic measurement of biopterin and neopterin in serum and urine. Clin. Chem. 1990, 36, 1364–1368. [Google Scholar]
  122. Tornero, E.M.; Meras, I.; Espinosa-Mansilla, A. HPLC determination of serum pteridine pattern as biomarkers. Talanta 2014, 128, 319–326. [Google Scholar] [CrossRef]
  123. Zurfluh, M.R.; Giovannini, M.; Fiori, L.; Fiege, B.; Gokdemir, Y.; Baykal, T.; Kierat, L.; Gartner, K.H.; Thony, B.; Blau, N. Screening for tetrahydrobiopterin deficiencies using dried blood spots on filter paper. Mol. Genet. Metab. 2005, 86 (Suppl. 1), S96–S103. [Google Scholar] [CrossRef]
  124. Santagata, S.; Di Carlo, E.; Carducci, C.; Leuzzi, V.; Angeloni, A.; Carducci, C. Development of a new uplc-esi-ms/ms method for the determination of biopterin and neopterin in dried blood spot. Clin. Chim. Acta 2017, 466, 145–151. [Google Scholar] [CrossRef]
  125. Allegri, G.; Costa Netto, H.J.; Ferreira Gomes, L.N.; Costa de Oliveira, M.L.; Scalco, F.B.; de Aquino Neto, F.R. Determination of six pterins in urine by lc-ms/ms. Bioanalysis 2012, 4, 1739–1746. [Google Scholar] [CrossRef]
  126. Burton, C.; Shi, H.; Ma, Y. Simultaneous detection of six urinary pteridines and creatinine by high-performance liquid chromatography-tandem mass spectrometry for clinical breast cancer detection. Anal. Chem. 2013, 85, 11137–11145. [Google Scholar] [CrossRef]
  127. Koslinski, P.; Jarzemski, P.; Markuszewski, M.J.; Kaliszan, R. Determination of pterins in urine by hplc with uv and fluorescent detection using different types of chromatographic stationary phases (hilic, rp c8, rp c18). J. Pharm. Biomed. Anal. 2014, 91, 37–45. [Google Scholar] [CrossRef]
  128. Burton, C.; Shi, H.; Ma, Y. Development of a high-performance liquid chromatography—tandem mass spectrometry urinary pterinomics workflow. Anal. Chim. Acta 2016, 927, 72–81. [Google Scholar] [CrossRef]
  129. Antonozzi, I.; Carducci, C.; Vestri, L.; Pontecorvi, A.; Moretti, F. Rapid and sensitive method for high-performance liquid chromatographic analysis of pterins in biological fluids. J. Chromatogr. 1988, 459, 319–324. [Google Scholar] [CrossRef]
  130. Dhondt, J.L.; Largilliere, C.; Ardouin, P.; Farriaux, J.P.; Dautrevaux, M. Diagnosis of variants of hyperphenylalaninemia by determination of pterins in urine. Clin. Chim. Acta 1981, 110, 205–214. [Google Scholar] [CrossRef]
  131. Niederwieser, A.; Staudenmann, W.; Wetzel, E. High-performance liquid chromatography with column switching for the analysis of biogenic amine metabolites and pterins. J. Chromatogr. 1984, 290, 237–246. [Google Scholar] [CrossRef]
  132. Tomsikova, H.; Solich, P.; Novakova, L. Sample preparation and uhplc-fd analysis of pteridines in human urine. J. Pharm. Biomed. Anal. 2014, 95, 265–272. [Google Scholar] [CrossRef]
  133. Dhondt, J.C.; Hayte, J.M.; Forzy, G.; Delcroix, M.; Farriaux, J.P. Unconjugated pteridins in amniotic fluid during gestation. Clin. Chim. Acta 1986, 161, 269–273. [Google Scholar] [CrossRef]
  134. Niederwieser, A.; Shintaku, H.; Hasler, T.; Curtius, H.C.; Lehmann, H.; Guardamagna, O.; Schmidt, H. Prenatal diagnosis of "dihydrobiopterin synthetase" deficiency, a variant form of phenylketonuria. Eur. J. Pediatr. 1986, 145, 176–178. [Google Scholar] [CrossRef]
  135. Guroff, G.; Rhoads, C.A.; Abramowitz, A. A simple radioisotope assay for phenylalanine hydroxylase cofactor. Anal. Biochem. 1967, 21, 273–278. [Google Scholar] [CrossRef]
  136. Niederwieser, A.; Curtius, H.C.; Bettoni, O.; Bieri, J.; Schircks, B.; Viscontini, M.; Schaub, J. Atypical phenylketonuria caused by 7, 8-dihydrobiopterin synthetase deficiency. Lancet 1979, 1, 131–133. [Google Scholar] [CrossRef]
  137. Schlesinger, P.; Watson, B.M.; Cotton, R.G.; Danks, D.M. Urinary dihydroxanthopterin in the diagnosis of malignant hyperphenylalaninemia and phenylketonuria. Clin. Chim. Acta 1979, 92, 187–195. [Google Scholar] [CrossRef]
  138. Leeming, R.J.; Blair, J.A.; Green, A.; Raine, D.N. Biopterin derivatives in normal and phenylketonuric patients after oral loads of l-phenylalanine, l-tyrosine, and l-tryptophan. Arch. Dis. Child. 1976, 51, 771–777. [Google Scholar] [CrossRef]
  139. Hyland, K. Estimation of tetrahydro, dihydro and fully oxidised pterins by high-performance liquid chromatography using sequential electrochemical and fluorometric detection. J. Chromatogr. 1985, 343, 35–41. [Google Scholar] [CrossRef]
  140. Hyland, K.; Surtees, R.A.; Heales, S.J.; Bowron, A.; Howells, D.W.; Smith, I. Cerebrospinal fluid concentrations of pterins and metabolites of serotonin and dopamine in a pediatric reference population. Pediatr. Res. 1993, 34, 10–14. [Google Scholar] [CrossRef]
  141. Howells, D.W.; Smith, I.; Hyland, K. Estimation of tetrahydrobiopterin and other pterins in cerebrospinal fluid using reversed-phase high-performance liquid chromatography with electrochemical and fluorescence detection. J. Chromatogr. 1986, 381, 285–294. [Google Scholar] [CrossRef]
  142. Guibal, P.; Lo, A.; Maitre, P.; Moussa, F. Pterin determination in cerebrospinal fluid: State of the art. Pteridines 2017, 28, 83–89. [Google Scholar] [CrossRef]
  143. Blau, N.; Niederwieser, A. Guanosine triphosphate cyclohydrolase i assay in human and rat liver using high-performance liquid chromatography of neopterin phosphates and guanine nucleotides. Anal. Biochem. 1983, 128, 446–452. [Google Scholar] [CrossRef]
  144. Werner, E.R.; Werner-Felmayer, G.; Fuchs, D.; Hausen, A.; Reibnegger, G.; Yim, J.J.; Pfleiderer, W.; Wachter, H. Tetrahydrobiopterin biosynthetic activities in human macrophages, fibroblasts, thp-1, and t 24 cells. Gtp-cyclohydrolase i is stimulated by interferon-gamma, and 6-pyruvoyl tetrahydropterin synthase and sepiapterin reductase are constitutively present. J. Biol. Chem. 1990, 265, 3189–3192. [Google Scholar]
  145. Viveros, O.H.; Lee, C.L.; Abou-Donia, M.M.; Nixon, J.C.; Nichol, C.A. Biopterin cofactor biosynthesis: Independent regulation of gtp cyclohydrolase in adrenal medulla and cortex. Science 1981, 213, 349–350. [Google Scholar] [CrossRef]
  146. Hatakeyama, K.; Yoneyama, T. A sensitive assay for the enzymatic activity of GTP cyclohydrolase I. Methods Mol. Biol. 1998, 100, 265–272. [Google Scholar]
  147. Laboratory Guide to the Methods in Biochemical Genetics; Blau, N.; Duran, M.; Gibson, K.M. (Eds.) Springer: Bwelin, Germany, 2008. [Google Scholar]
  148. Ferre, J.; Naylor, E.W. Sepiapterin reductase in human amniotic and skin fibroblasts, chorionic villi, and various blood fractions. Clin. Chim. Acta 1988, 174, 271–282. [Google Scholar] [CrossRef]
  149. Arai, N.; Narisawa, K.; Hayakawa, H.; Tada, K. Hyperphenylalaninemia due to dihydropteridine reductase deficiency: Diagnosis by enzyme assays on dried blood spots. Pediatrics 1982, 70, 426–430. [Google Scholar]
  150. Werner, E.R.; Werner-Felmayer, G.; Fuchs, D.; Hausen, A.; Reibnegger, G.; Wachter, H. Parallel induction of tetrahydrobiopterin biosynthesis and indoleamine 2,3-dioxygenase activity in human cells and cell lines by interferon-gamma. Biochem. J. 1989, 262, 861–866. [Google Scholar] [CrossRef]
  151. Shintaku, H.; Niederwieser, A.; Leimbacher, W.; Curtius, H.C. Tetrahydrobiopterin deficiency: Assay for 6-pyruvoyl-tetrahydropterin synthase activity in erythrocytes, and detection of patients and heterozygous carriers. Eur. J. Pediatr. 1988, 147, 15–19. [Google Scholar] [CrossRef]
  152. Firgaira, F.A.; Cotton, R.G.; Danks, D.M. Dihydropteridine reductase deficiency diagnosis by assays on peripheral blood cells. Lancet 1980, 1, 160. [Google Scholar] [CrossRef]
  153. Lipson, A.; Yu, J.; O’Halloran, M.; Potter, M.; Wilken, B. Dihydropteridine reductase deficiency: Non-response to oral tetrahydrobiopterin load test. J. Inherit. Metab. Dis. 1984, 7, 69–71. [Google Scholar] [CrossRef]
  154. Blau, N.; Hennermann, J.B.; Langenbeck, U.; Lichter-Konecki, U. Diagnosis, classification, and genetics of phenylketonuria and tetrahydrobiopterin (bh4) deficiencies. Mol. Genet. Metab. 2011, 104, S2–S9. [Google Scholar] [CrossRef]
  155. Rebrin, I.; Bailey, S.W.; Boerth, S.R.; Ardell, M.D.; Ayling, J.E. Catalytic characterization of 4a-hydroxytetrahydropterin dehydratase. Biochemistry 1995, 34, 5801–5810. [Google Scholar] [CrossRef]
  156. Bailey, S.W.; Rebrin, I.; Boerth, S.R.; Auling, J.E. Synthesis of 4a-hydroxytetrahydropterins and the mechanism of their nonenzymatic dehydration to quinoid dihydropterins. J. Am. Chem. Soc. 1995, 117, 10203–10211. [Google Scholar] [CrossRef]
  157. Thony, B.; Neuheiser, F.; Kierat, L.; Blaskovics, M.; Arn, P.H.; Ferreira, P.; Rebrin, I.; Ayling, J.; Blau, N. Hyperphenylalaninemia with high levels of 7-biopterin is associated with mutations in the pcbd gene encoding the bifunctional protein pterin-4a-carbinolamine dehydratase and transcriptional coactivator (dcoh). Am. J. Hum. Genet. 1998, 62, 1302–1311. [Google Scholar] [CrossRef]
  158. Rebrin, I.; Bailey, S.W.; Ayling, J.E. Activity of the bifunctional protein 4a-hydroxy-tetrahydropterin dehydratase/dcoh during human fetal development: Correlation with dihydropteridine reductase activity and tetrahydrobiopterin levels. Biochem. Biophys. Res. Commun. 1995, 217, 958–965. [Google Scholar] [CrossRef]
  159. Ayling, J.E.; Bailey, S.W.; Boerth, S.R.; Giugliani, R.; Braegger, C.P.; Thony, B.; Blau, N. Hyperphenylalaninemia and 7-pterin excretion associated with mutations in 4a-hydroxy-tetrahydrobiopterin dehydratase/dcoh: Analysis of enzyme activity in intestinal biopsies. Mol. Genet. Metab. 2000, 70, 179–188. [Google Scholar] [CrossRef]
  160. Schwarz, M.A. Enzyme-catalyzed amperometric oxidation of neurotransmitters in chip-capillary electrophoresis. Electrophoresis 2004, 25, 1916–1922. [Google Scholar] [CrossRef]
  161. Cosentino, M.; Bombelli, R.; Ferrari, M.; Marino, F.; Rasini, E.; Maestroni, G.J.; Conti, A.; Boveri, M.; Lecchini, S.; Frigo, G. Hplc-ed measurement of endogenous catecholamines in human immune cells and hematopoietic cell lines. Life Sci. 2000, 68, 283–295. [Google Scholar] [CrossRef]
  162. Garcia-Cazorla, A.; Duarte, S.; Serrano, M.; Nascimento, A.; Ormazabal, A.; Carrilho, I.; Briones, P.; Montoya, J.; Garesse, R.; Sala-Castellvi, P.; et al. Mitochondrial diseases mimicking neurotransmitter defects. Mitochondrion 2008, 8, 273–278. [Google Scholar] [CrossRef]
  163. Molero-Luis, M.; Serrano, M.; Ormazabal, A.; Perez-Duenas, B.; Garcia-Cazorla, A.; Pons, R.; Artuch, R.; Neurotransmitter Working, G. Homovanillic acid in cerebrospinal fluid of 1388 children with neurological disorders. Dev. Med. Child. Neurol. 2013, 55, 559–566. [Google Scholar] [CrossRef]
  164. Shaywitz, B.A.; Cohen, D.J.; Bowers, M.B. Reduced cerebrospinal fluid 5-hydroxyindoleacetic acid and homovanillic acid in children with epilepsy. Neurology 1975, 25, 72–79. [Google Scholar] [CrossRef]
  165. Devinsky, O.; Emoto, S.; Goldstein, D.S.; Stull, R.; Porter, R.J.; Theodore, W.H.; Nadi, N.S. Cerebrospinal fluid and serum levels of dopa, catechols, and monoamine metabolites in patients with epilepsy. Epilepsia 1992, 33, 263–270. [Google Scholar] [CrossRef]
  166. Giroud, M.; Dumas, R.; Dauvergne, M.; D’Athis, P.; Rochette, L.; Beley, A.; Bralet, J. 5-hydroxyindoleacetic acid and homovanillic acid in cerebrospinal fluid of children with febrile convulsions. Epilepsia 1990, 31, 178–181. [Google Scholar] [CrossRef]
  167. Papeschi, R.; Molina-Negro, P.; Sourkes, T.L.; Erba, G. The concentration of homovanillic and 5-hydroxyindoleacetic acids in ventricular and lumbar csf. Studies in patients with extrapyramidal disorders, epilepsy, and other diseases. Neurology 1972, 22, 1151–1159. [Google Scholar] [CrossRef]
  168. Tabaddor, K.; Wolfson, L.I.; Sharpless, N.S. Diminished ventricular fluid dopamine metabolites in adult-onset dystonia. Neurology 1978, 28, 1254–1258. [Google Scholar] [CrossRef]
  169. Dobyns, W.B.; Ozelius, L.J.; Kramer, P.L.; Brashear, A.; Farlow, M.R.; Perry, T.R.; Walsh, L.E.; Kasarskis, E.J.; Butler, I.J.; Breakefield, X.O. Rapid-onset dystonia-parkinsonism. Neurology 1993, 43, 2596–2602. [Google Scholar] [CrossRef]
  170. Banki, C.M.; Molnar, G.; Vojnik, M. Cerebrospinal fluid amine metabolites, tryptophan and clinical parameters in depression. Part 2. Psychopathological symptoms. J. Affect. Disord. 1981, 3, 91–99. [Google Scholar] [CrossRef]
  171. Banki, C.M.; Vojnik, M.; Molnar, G. Cerebrospinal fluid amine metabolites, tryptophan and clinical parameters in depression. Part 1. Background variables. J. Affect. Disord. 1981, 3, 81–89. [Google Scholar] [CrossRef]
  172. Sjogren, M.; Minthon, L.; Passant, U.; Blennow, K.; Wallin, A. Decreased monoamine metabolites in frontotemporal dementia and alzheimer’s disease. Neurobiol. Aging 1998, 19, 379–384. [Google Scholar] [CrossRef]
  173. Van Der Heyden, J.C.; Rotteveel, J.J.; Wevers, R.A. Decreased homovanillic acid concentrations in cerebrospinal fluid in children without a known defect in dopamine metabolism. Eur. J. Paediatr. Neurol. 2003, 7, 31–37. [Google Scholar] [CrossRef]
  174. Mercimek-Mahmutoglu, S.; Sidky, S.; Hyland, K.; Patel, J.; Donner, E.J.; Logan, W.; Mendoza-Londono, R.; Moharir, M.; Raiman, J.; Schulze, A.; et al. Prevalence of inherited neurotransmitter disorders in patients with movement disorders and epilepsy: A retrospective cohort study. Orphanet J. Rare Dis. 2015, 10, 12. [Google Scholar] [CrossRef]
  175. Blau, N.; Bonafe, L.; Krageloh-Mann, I.; Thony, B.; Kierat, L.; Hausler, M.; Ramaekers, V. Cerebrospinal fluid pterins and folates in aicardi-goutieres syndrome: A new phenotype. Neurology 2003, 61, 642–647. [Google Scholar] [CrossRef]
  176. Hagberg, L.; Cinque, P.; Gisslen, M.; Brew, B.J.; Spudich, S.; Bestetti, A.; Price, R.W.; Fuchs, D. Cerebrospinal fluid neopterin: An informative biomarker of central nervous system immune activation in hiv-1 infection. AIDS Res. Ther. 2010, 7, 15. [Google Scholar] [CrossRef]
  177. Millner, M.M.; Franthal, W.; Thalhammer, G.H.; Berghold, A.; Aigner, R.M.; Fuger, G.F.; Reibnegger, G. Neopterin concentrations in cerebrospinal fluid and serum as an aid in differentiating central nervous system and peripheral infections in children. Clin. Chem. 1998, 44, 161–167. [Google Scholar] [Green Version]
  178. Sheline, Y.; Bardgett, M.E.; Csernansky, J.G. Correlated reductions in cerebrospinal fluid 5-hiaa and mhpg concentrations after treatment with selective serotonin reuptake inhibitors. J. Clin. Psychopharmacol. 1997, 17, 11–14. [Google Scholar] [CrossRef]
  179. Potter, W.Z.; Scheinin, M.; Golden, R.N.; Rudorfer, M.V.; Cowdry, R.W.; Calil, H.M.; Ross, R.J.; Linnoila, M. Selective antidepressants and cerebrospinal fluid. Lack of specificity on norepinephrine and serotonin metabolites. Arch. Gen. Psychiatry 1985, 42, 1171–1177. [Google Scholar] [CrossRef]
  180. Burlina, A.B.; Celato, A.; Polo, G.; Edini, C.; Burlina, A.P. The utility of csf for the diagnosis of primary and secondary monoamine neurotransmitter deficiencies. EJIFCC 2017, 28, 64–76. [Google Scholar]
  181. Bowden, C.L.; Koslow, S.H.; Hanin, I.; Maas, J.W.; Davis, J.M.; Robins, E. Effects of amitriptyline and imipramine on brain amine neurotransmitter metabolites in cerebrospinal fluid. Clin. Pharmacol. Ther. 1985, 37, 316–324. [Google Scholar] [CrossRef]
  182. Brun, L.; Ngu, L.H.; Keng, W.T.; Ch’ng, G.S.; Choy, Y.S.; Hwu, W.L.; Lee, W.T.; Willemsen, M.A.; Verbeek, M.M.; Wassenberg, T.; et al. Clinical and biochemical features of aromatic l-amino acid decarboxylase deficiency. Neurology 2010, 75, 64–71. [Google Scholar] [CrossRef]
  183. Aitkenhead, H.; Heales, S.J. Establishment of paediatric age-related reference intervals for serum prolactin to aid in the diagnosis of neurometabolic conditions affecting dopamine metabolism. Ann. Clin. Biochem. 2013, 50, 156–158. [Google Scholar] [CrossRef] [PubMed]
  184. Capozzi, A.; Scambia, G.; Pontecorvi, A.; Lello, S. Hyperprolactinemia: Pathophysiology and therapeutic approach. Gynecol. Endocrinol. 2015, 31, 506–510. [Google Scholar] [CrossRef] [PubMed]
  185. Verhelst, J.; Abs, R. Hyperprolactinemia: Pathophysiology and management. Treat. Endocrinol. 2003, 2, 23–32. [Google Scholar] [CrossRef] [PubMed]
  186. Banerjee, S.; Paul, P.; Talib, V.J. Serum prolactin in seizure disorders. Indian Pediatr. 2004, 41, 827–831. [Google Scholar] [PubMed]
  187. Leucht, S.; Cipriani, A.; Spineli, L.; Mavridis, D.; Orey, D.; Richter, F.; Samara, M.; Barbui, C.; Engel, R.R.; Geddes, J.R.; et al. Comparative efficacy and tolerability of 15 antipsychotic drugs in schizophrenia: A multiple-treatments meta-analysis. Lancet 2013, 382, 951–962. [Google Scholar] [CrossRef]
  188. Liu, H.; Li, N.; Zhang, H.; Zhang, F.; Su, X. A simple and convenient fluorescent strategy for the highly sensitive detection of dopamine and ascorbic acid based on graphene quantum dots. Talanta 2018, 189, 190–195. [Google Scholar] [CrossRef]
  189. Kanagasubbulakshmi, S.; Kadirvelu, K. Photoinduced holes transfer based visual determination of dopamine in human serum. Spectrochim. Acta A Mol. Biomol. Spectrosc. 2019, 206, 512–519. [Google Scholar] [CrossRef] [PubMed]
  190. Guo, M.X.; Li, Y.F. Cu (ii)-based metal-organic xerogels as a novel nanozyme for colorimetric detection of dopamine. Spectrochim. Acta A Mol. Biomol. Spectrosc. 2019, 207, 236–241. [Google Scholar] [CrossRef] [PubMed]
  191. Jafarinejad, S.; Ghazi-Khansari, M.; Ghasemi, F.; Sasanpour, P.; Hormozi-Nezhad, M.R. Colorimetric fingerprints of gold nanorods for discriminating catecholamine neurotransmitters in urine samples. Sci. Rep. 2017, 7, 8266. [Google Scholar] [CrossRef]
  192. Ghasemi, F.; Hormozi-Nezhad, M.R.; Mahmoudi, M. Identification of catecholamine neurotransmitters using fluorescence sensor array. Anal. Chim. Acta 2016, 917, 85–92. [Google Scholar] [CrossRef]
Figure 1. Catecholamine biosynthesis and metabolism. AADC, aromatic amino acid decarboxylase; AD, aldehyde dehydrogenase; ADH, alcohol dehydrogenase; AR, aldehyde reductase; COMT, catechol-O-methyltransferase; DA; dopamine; DBH, dopamine ß-hydroxylase; DHPG, 3,4-dihydroxyphenylglycol; DHMA, 3,4-dihydroxymandelic acid; DOPAC, 3,4-dihydroxyphenylacetic acid; DOPAL, 3,4-dihydroxyphenylacetaldehyde; DOPEGAL, 3,4-dihydroxyphenylglycolaldehyde; E, epinephrine; 5HIAA, 5-hydroxyindolacetic acid; HMA, 4-hydroxy-3-methoxyphenylacetaldehyde; HVA, homovanillic acid; L-DOPA, L-3,4-dihydroxyphenylalanine; MAO, monoamine oxidase; MHPG, 3-methoxy-4-hydroxyphenylglycol; 3-O-MD, 3-O-methyl-DOPA; MN, metanephrine; 3-MT, 3-methoxytyramine; MOPEGAL, 3-methoxy-4-hydroxyphenylglycolaldehyde; NE, norepinephrine; NMN, normetanephrine; PNMT, phenolethanolamine-N-methyltransferase; TH, tyrosine hydroxylase; Tyr, tyrosine; VMA, vanillylmandelic acid. Marked in red is the BH4 consuming reaction forming L-DOPA. Boxed in green are the most important analytes used for diagnosis in cerebrospinal fluid (CSF). Adapted from [11].
Cells 08 00867 g001
Figure 2. Biosynthesis and catabolism of tryptophan. A-CoA, acetyl coenzyme A; AADC, aromatic amino acid decarboxylase; ADH, alcohol dehydrogenase; AR, aldehyde reductase; ASMT, N-acetyl-serotonin-O-methyltransferase; CO2, carbon dioxide; CoA, coenzyme A; 5-HIAA, 5-hydroxyindolacetic acid; 5-HIAL, 5-hydroxyindolacetaldehyde; 5-HT, 5-hydroxytryptamine (serotonin); 5-HTOL, 5-hydroxytryptophol; 5-HTP, 5-hydroxytryptophan; H+, proton; H2O, water; H2O2, hydrogen peroxide; MAO, monoamine oxidase; MT, melatonin; NAD, nicotinamide dinucleotide; NAS, N-acetyl-serotonin; NH3, ammonia; O2, oxygen; P4aC, pterin-4-carbinolamine; SAM, S-adenosyl-methionine; SAH, S-adenosyl homocysteine; SNAT, serotonin-N-acetyltransferase; TRP, tryptophan. Marked in red is the BH4 consuming reaction forming 5-HTP. Boxed in green is 5-HIAA, the most important analyte used for diagnosis in CSF.
Cells 08 00867 g002
Figure 3. Biosynthesis and recycling of BH4. ADR, aldose reductase; AGMO, alkylglycerolether monooxygenase; AKR1C3, 3α-hydroxysteroid dehydrogenase type 2; BH4, 5,6,7,8 tetrahydrobiopterin; CR, carbonyl reductase; DHFR, dihydrofolate reductase; DHPR, dihydropteridine reductase; GTP, guanosine triphosphate; GTPCH, GTP cyclohydrolase 1; H2O, water; NAD, nicotinamide dinucleotide; NADPH, nicotinamide dinucleotide phosphate; ne, non-enzymatic; O2, oxygen; PAH, phenylalanine hydroxylase; PCD, pterin-4-carbinolamine dehydratase; PTPS, 6-pyruvoyl tetrahydrobiopterin synthase; SPR, sepiapterin reductase; TH, tyrosine hydroxylase; TPH, tryptophan hydroxylase.
Cells 08 00867 g003
Table 1. Sample pre-treatment for the quantification of catecholamines and some of their metabolites in different human fluids.
MatrixVolume (mL)Sample PreparationSolventAnalytesRef.
Human CSF1.0Dilution6 mM L-cysteine/2 mM oxalic acid/1.3% glacial acetic acidDA; DOPAC; HVA; HT; HIAA[37]
6th–8th mLDilution0.03% formic acidL-Dopa; 3-MT; HVA; HIAA; MHPG; 5-HTP[38]
2nd tube (400th–800th µL)Dilution; filtrationNAHVA; 5-HIAA; 3-OMD; MHPG; 5-HTP[39]
50 µLDilution; filtration250 nM 2,5-dihdroxybenzoic acid; 5000 MWCO PES Vivaspin 500 filterHVA; 5-HIAA; 3-OMD; 5-HTP; MHPG[40]
Human plasma0.5SPEWater/acetonitrile (40:60, v/v) with 2.5% formic acidNE; E[27]
0.5PP, TFC10% TCA; A: Water/0.1% perfluoroheptanoic acid; B: Water/acetonitrile (40:60, v/v); C: Isopropanol/acetone/acetonitrile (1:1:1) with 0.3% formic acid; D: Water/5 mM ammonium acetate/50% acetonitrileNMN/MN[41]
0.2SPEAcetonitrile with 2% formic acidNMN; MN[42]
0.5SPEWater/acetonitrile (40:60, v/v)NMN; MN[43]
0.1SPEWater/acetonitrile (5:95, v/v) with 2% formic acidNMN; MN; 3-MT[44]
0.015Dilution10 mM glutathione/10 mM citric acid/100 mgL−1 EDTA pH4.5DA; NE; E; NMN; MN; 3-MT[45]
0.5PP/filtration1.2 M perchloric acidL-Dopa; DA; DOPAC[46]
0.5SPEAqueous solution (10.5 g L−1 citric acid/20 mg L−1 EDTA)/acetonitrile (98:2, v/v); pH 2.8, 1 M NaOHL-Dopa; DA; NE; E; DHPG[47]
0.02SPE0.6 M potassium chloride/acetonitrile (2:3, v/v)DA; NE; E[48]
0.5SPE10.5 g L−1 citric acid/20 mg L−1 OSA/20 mg L−1 EDTA/methanol (97.5:2.5, v/v) pH 2.9, 1 M NaOHDA; NE; E;[24]
0.5SPE10.5 g L−1 citric acid/20 mg L−1 OSA/20 mg L−1 EDTA/methanol (95:5, v/v) pH 3.5, 1 M NaOH; MHPG: methanolDA; NE/E; MHPG[29]
0.1/0.5LLEAmmonia buffer/heptane mixture; 80 mM acetic acid/octanol; MHPG: Ethyl acetateDA; NE; E; MHPG (free and conjugated)[49]
Human urine0.25SPEWater/methanol (95:5, v/v) with 2% formic acidNMN; MN[50]
3.0SPEWater/acetonitrile (20:80, v/v) with 1% formic acidDA; NE; E[51]
0.04FiltrationNRL-Dopa; DA; NE; E, MN[52]
20PBA affinity column0.1 M phosphate buffer/1 mM EDTA/300 mg L-1 SOS/ methanol (10:1, v/v), pH 2.5DA/NE/E[53]
0.02SPE50 mM potassium dihydrogenphosphate/2.5 mM OSA/0.1 g L-1 EDTA/acetonitrile (96.5:3.5, v/v); pH 3.5, phosphoric acidDA; NE; E[25]
5.0SPE6 M acetic acidDA/NE/E[54]
0.3LLEAmmonia buffer/heptane mixture; 166 mM aqueous acetic acid/1-octanolDA/NE/E[55]
1.0SPE1 M acetic acidDA; NE; E[30]
5.0Bio-Rex 70 resin4 M formic acidDA; NE; E; NMN; MN[56]
5.0Bio-Rex 70 resin4 M formic acidDA; NE; E; NMN; MN[57]
0.5LLEAmmonia buffer/heptane mixture; 80 mM acetic acid/1-octanol; MHPG: Ethyl acetateDA; NE; E; MHPG (free and conjugated)[49]
Amniotic fluid0.2Dilution20 mM phosphate buffer; pH 3.0; 0.5 mM heptasulfonic acid; 0.12 mM EDTA; 0.28% perchloric acid; 15% methanolHIAA; HVA[58]
DA, dopamine; DOPAC, 3,4-dihydroxyphenylacetic acid; E, epinephrine; EDTA, ethylenediaminetetraacetic acid; 5-HIAA, 5-hydroxyindoleacetic acid; 5-HT, 5-hydroxytryptamine; 5-HTP, 5-hydroxytryptophane; HVA, homovanillic acid; L-DOPA, L-3,4-dihydroxyphenylalanine; LLE, liquid–liquid extraction; MHPG, 3-methoxy-4-hydroxyphenylglycol; MN, metanephrine; NE, norepinephrine; NMN, normetanephrine; NR, not reported; OSA, 1-octanesulfonic acid sodium salt monohydrate; PBA, phenylboronic acid; PP, protein precipitation; SDS, sodium dodecyl sulphate; SOS, sodium octylsulphate; SPE, solid-phase extraction.
Table 2. Liquid chromatography techniques for the quantitative measurement of catecholamines and some of their metabolites in different human fluids.
MatrixTechniqueAnalytesSample PreparationInternal StandardColumnMobile PhaseElutionDetectionRef.
Human CSFHPLCDA; DOPAC; HVA; 5-HT; 5-HIAADilutionNRESA MD-150 C1875 mM monobasic sodium phosphate buffer/0.5 mM EDTA/0.81 mM OSA/5% tetrahydrofuran/acetonitrile (95:5, v/v) pH 3.1; phosphoric acidIsocraticCoulometric[37]
HPLCDA; NE; DOPAC; HVA; MHPG; 5-HT; 5-HIAADirect injection dialysateNRLuna C180.2 M phosphate buffer pH 5.0IsocraticAmperometric[84]
HPLC3-OMD; HVA; 5-HIAA; MHPG; 5-HTPDilution, filtration3-OMD, HVA; 5-HIAA; MHPG; 5-HTPODS (C18)0.1 M sodium acetate; 0.1 M citric acid; 1.2 mmol/l EDTA, 1.2 mmol/l 1-heptanosulfonic acid; 75 mL methanol; adjusted to pH 4.0IsocraticCoulometric[39]
UHPLCHVA; 5-HIAA; 3-OMD; 5-HTP; MHPGDirect injectionHVA; 5-HIAA; MHPG; 3-OMD; 5-HTPACQUITY UPLC HSS T3 0.05 M citrate buffer; pH 5.2; methanol (97:3, v/v)IsocraticCoulometric; FL ex: 350 nm; em: 450 nm[40]
Human plasmaLCNE; ESPEd6-NE; d6-EC18A: 10 mM ammonium formate in water; B: MethanolGradientMS/MS; [positive ionization electrospray][27]
LCNMN; MNPP; TFCd3-NMN; d3-MNHypercarb PGCA: 50 mM ammonium formate/1% formic acid in water; B: 0.1% formic acid in acetonitrile; C: Isopropanol/acetone/acetonitrile (9:2:9, v/v/v); D: 0.1% perfluoroheptanoic acid in waterGradientMS/MS; [positive ionization electrospray][41]
UHPLCNMN; MNSPEd3-NMN; d3-MNAtlantis HILICA: Acetonitrile; B: 200 mM ammonium formate pH 3.0GradientMS/MS; [positive ionization electrospray][42]
LCNMN; MNSPEd3-NMN; d3-MNHypercarb PGC
Hypersil Gold
HILIC
A: 50 mM ammonium formate/1% formic acid in water; B: 0.1% formic acid in acetonitrile; C: Isopropanol/acetone/acetonitrile (9:2:9, v/v/v) A: 100 mM ammonium formate/acetonitrile (5:95, v/v) pH 3.2; B: Acetonitrile/water/100 mM ammonium formate (50:45:5, v/v/v) pH 3.2GradientMS/MS; [positive ionization electrospray][43]
HPLCNMN; MN; 3-MTSPEd3-NMN; d3-MN; d4-3-MTAtlantis HILICA: 100 mM ammonium formate in water pH 3.0; formic acid; B: AcetonitrileGradientMS/MS; [positive ionization electrospray][44]
HPLCDA; NE; E; NMN; MN; 3-MTDilutionMHBAUnison UK-C1875 mM potassium acetate buffer/100 mM potassium phosphate buffer/8 mM sodium 1-hexanesulfonate/acetonitrile (93.1:4.9:2, v/v/v); pH 3.2IsocraticCL; [TDPO/H2O2][45]
HPLCL-DOPA; DA; DOPAC; 3-O-MD; CarbidopaPP/FiltrationDHBAESA HR-80 C18Modified CAT-A-PHASE buffer: Phosphate buffer/patented ion-pairing agent/methanol/acetonitrile (99.7:0.3, v/v); pH 3.2; 2 N NaOHIsocraticCoulometric[46]
HPLCL-DOPA; DA; NE; E; DHPGSPEDHBADeverosil RPAQUEOUS-AR-5 C30Aqueous solution of 10.5 g L−1 citric acid/20 mg L−1 EDTA/acetonitrile (98:2, v/v); pH 2.8; 1 M NaOHIsocraticAmperometric[47]
HPLCDA; NE; E; MHPGSPEDHBAMicrosorb C810.5 g L−1 citric acid/20 mg L−1 EDTA/20 mg L−1 OSA/methanol (95:5, v/v); pH 3.5; 1 M NaOHIsocraticAmperometric[29]
HPLCDA; NE; ESPEDHBARainin C825 mM citric acid/20 mg L−1 EDTA/20 mg L−1 OSA/methanol (97:3, v/v) pH 2.9; 1 M NaOHIsocraticAmperometric[28]
HPLCDA; NE; ESPEIPTTSK gel ODS-120 T120 mM imidazole buffer/methanol/acetonitrile (13:4:18, v/v/v) pH 5.8IsocraticCL[48]
HPLCDA; NE; ESPEDHBAJones Apex C810.5 g L−1 citric acid/20 mg L−1 EDTA/20 mg L−1 OSA/methanol (97.5:2.5, v/v); pH 2.9; 1 M NaOHIsocraticCoulometric[24]
HPLCNE; ELLEDHBAHypersil ODS9.02 g sodium acetate/0.372 g EDTA/100 mg SDS/methanol (85:15) or (80:20) pH 5.1; glacial acetic acidIsocraticAmperometric[85]
Human urineLCNMN; MNSPEd3-NMN d3-MNUltra II PFP propyl0.2% formic acid/methanol (95:5, v/v)IsocraticMS/MS; [positive ionization electrospray][50]
HPLCL-DOPA; DA; NE; E; MN; 5-HT; tryptophan; andderivativeFiltrationNRFluofix-II 120EWater/acetonitrile/trifluoroacetic acid (40:60:0.05, v/v/v)IsocraticFL; [PFOEI]; ex: 280 nm; em: 320 nm[52]
HPLCL-DOPA; DA; NE; E; DOPACDilutionIPTKromasil C18A: Methanol; B: 0.1 M sodium acetate buffer pH 5.0; acetic acidGradientFL; [DPE]; ex: 350 nm; em: 480 nm[86]
HPLCDA; NE; ESPENRZIC-HILIC; BEH-amide6.5 mM ammonium formate/acetonitrile (25:75, v/v) pH 3.0; 6.5 mM ammonium formate/acetonitrile (15:85, v/v) pH 3.0IsocraticCoulometric[51]
LCNMN; MNSPEd3-NMN d3-MNAtlantis T3 C18A: 10 mM ammonium formate/1% formic acid; B: MethanolGradientMS/MS; [positive ionization electrospray][59]
HPLCDA; NE; ESPEd4-DA; d3-NE; d3-EAllure PFP propylA: 25 mM ammonium formate in water pH 3.0; formic acid; B: MethanolGradientMS/MS; [positive ionization electrospray][26]
HPLCDA; NE; EPBA affinity columnNRNucleosil C180.1 M phosphate buffer/1 mM EDTA/300 mg L−1 SOS/methanol (10:1, v/v) pH 2.5IsocraticAmperometric[53]
HPLCDA; NE; ESPENRLichrosorb LC-8 C850 mM potassium dihydrogen phosphate/500 mg L−1 SDS/250 mg L−1 EDTA/100 mL L−1 methanol/ 200 mL L−1 acetonitrile pH 3.5; orthophosphoric acidIsocraticCL; [luminol–I2][60]
HPLCDA; NE; ESPEDHBARECIPE reversed-phase50 mM potassium dihydrogen phosphate/2.5 mM OSA/0.1 g L−1 EDTA/acetonitrile (96.5:3.5, v/v) pH 3.5; phosphoric acidIsocraticAmperometric[25]
HPLCDA; NE; ESPEDHBAHypersil-BDS50 mM acetate buffer/0.11 mM EDTA/1.1 mM OSA/methanol (85:15, v/v) pH 4.7; 8.5 M acetic acidIsocraticFL [TbCl3]; ex: 300 nm; em: 545 nm[54]
HPLCDA; NE; ELLEd4-DA; d3-NE; d3-EAllure Basix6.5 mM aqueous formic acid/tetrahydrofuran (2:3, v/v)IsocraticMS/MS; [positive ionization electrospray][55]
HPLCDA; NE; ESPEDHBALuna C1850 mM dihydrogen phosphate buffer/500 mg L−1 SDS/250 mg L−1 EDTA/100 mL L−1 methanol/200 mL L−1 acetonitrile pH 2.9; 6 M orthophosphoric acidIsocraticCoulometric[30]
HPLCDA; NE; E; NMN; MNLLEDHBASpherisorb C8A: Acetonitrile; B: 3.0 g L−1 acetic acid solutionGradientFL; [FMOC-Cl]; ex: 263 nm; em: 313 nm[74]
HPLCDA; NE; E; NMN; MNSPEDHBANova-Pak C1850 mM ammonium formate; pH 3.0; formic acidIsocraticAPcI-MS[56]
HPLCDA; NE; E; NMN; MNCation exchange resinDHBANova-Pak C18200 mM NaH2PO4·H2O/0.2 g L−1 EDTA/4 mM sodium 1-heptanesulfonate/acetonitrile (97.8:2.2, v/v) pH 3.0; 1 M orthophosphoric acidIsocraticAmperometric[57]
HPLCNE; E; 5-HIsDilution/filtration5-HIACosmosil 5C1810 mM acetate buffer/acetonitrile (65:35, v/v) pH 6.0IsocraticFL; [benzylamine]; ex: 345 nm; em: 480 nm[80]
Amniotic fluidHPLC5-HIAA; HVANANAHypersil 3MOS20 mM phosphate buffer; pH 3.0; 0.5 mM heptasulfonic acid; 0.12 mM EDTA; 0.28% perchloric acid; 15% methanolIsocraticAmperometric[58]
APcI-MS, atmospheric pressure chemical ionization mass spectrometry; CL, chemiluminescence; CSF, cerebrospinal fluid; DA, dopamine; DHBA, 3,4-dihydroxybenzylamine; E, epinephrine; EDTA, ethylenediaminetetraacetic acid; FL, fluorescence; 5-HIA, 5-hydroxyindole-3-acetamide; 5-HIs, 5-hydroxyl indoles; 5-HIAA, 5-hydroxyindoleacetic acid; 5-HTP, 5-hydryxytryptophane; HPLC, high performance liquid chromatography; 5-HT, 5-hydroxytryptamine; HVA, homovanillic acid; IPT, isoproterenol; IS, internal standard; LC, liquid chromatography; l-DOPA, 3,4-dihydroxyphenylalanine; LLE, liquid–liquid extraction; 3-OMD, 3-O-methyl-DOPA; MHBA, 3-methoxy-4-hydroxybenzylamine; MN, metanephrine; MS/MS, tandem mass spectrometry; 3-MT, 3-methoxytyramine; NE, norepinephrine; N-MeDA, N-methyldopamine; NMN, normetanephrine; NR, not reported; OSA, 1-octanesulfonic acid sodium salt; SPE, solid-phase extraction; TDPO, bis[2-(3,6,9-trioxadecanyloxycarbonyl)-4-nitrophenyl]oxalate.
Table 3. Typical CSF profiles of HVA, 5-HIAA, and 3-OMD in inborn errors of biogenic amine metabolism (before treatment initiation).
DeficiencyHVA5-HIAA3-OMD
Tyrosine hydroxylaselownormalnormal
AADClowlow high
DBHhighnormalnormal
Pterin deficiency (recessive)lowlow normal
Pterin deficiency (dominant)normal to lownormal to lownormal
DAT highnormal NR
VMAT2normalnormalNR
3-OMD, 3-O-methyl DOPA; AADC, aromatic amino acid decarboxylase; DAT; dopamine transporter; DBH, dopamine ß hydroxylase; 5-HIAA, 5 hydroxyindolacetic acid; HVA, homovanillic acid; NR, not reported; VMAT2, vesicular monoamine transporter 2.
Table 4. Sample pre-treatment for the measurement of pterins in different human fluids.
MatrixVolume (mL)Sample PreparationSolventAnalytesRef.
Human CSF1 mLPrecipitation; oxidation33 mg TCA/1 mg DTT per mL CSF; 0.1 mL HCl (0.1 M)/0.2% iodione/0.4% potassium iodide; 1% ascorbic acid; 1 M HCl/1 mg MnO2 per 200 µL CSFN; B[38]
30 µLStabilization; oxidationDTT; DETAPACBH4; BH2; N; S[108]
100 µLFiltrationNABH4; BH2; DHN; B; N[118]
3rd tube (800th–1200th µL)Dilution; filtrationNABH4; BH2; N[39]
50 µLDilution; filtration250 nM 2,5-dihdroxybenzoic acid; 5000 MWCO PES Vivaspin 500 filterBH4; BH2; B; N; DHN[40]
Human plasma400 µLPrecipitation; oxidation1 M TCA; 0.5% iodine/1% potassium iodide/0.2 M TCA, 1% ascorbic acid (biopterin); 6; sodium hydroxide/0.5% iodine/1% potassium iodide/0.2 M TCA; 1% ascorbic acid/6 M sodium hydroxide (BH4)B; BH4[107]
100 µLProtein precipitation; derivatization; liquid phase extraction; drying; reconstitutionIce-cold acetonitrile; 500 mM ammonium carbonate; benzoyl chloride; ethyl acetate; hexane; acetonitrileBH4[119]
4 mLPrecipitation; oxidation; purification2N TCA/0.5% iodione/1% potassium iodide in 0.2 N TCA; Dowex 50 columnB; N[110]
Human serum200 µLOxidation; deproteinization 1 M HCl with 1 mg MnO2; Ultrafree (NMWL 10000)B; N[120]
2 mLOxidation; ion exchangeI2 (5 g/L) in 0.2 M TCA or I2 (5 g/L) and KI (10 g/L) in 0.1 M NaOH; AGMP-50 (200–400 mesh (H+))B; N[121]
3 mLFiltration; oxidation; ion exchange; evaporation0.22 µM nylon mesh; 3 M TCA/2% iodione/4% potassium iodide; ISOLUTEENV; elution in acetonitrile/water (80/29, v/v); dissolved in mobile phasePCA; X; N; M; ISO; P; 6-B; 7-B; 6-HMP [122]
Dried blood spots4 blood spotsExtraction; sonication; ultrafiltration250 µL 20 mM HCl; Ultrafree (NMWL 10000)N; B; ISO; P[123]
2 blood spotsExtraction; sonication; ultrafiltration250 µL 20 mM HCl; Ultrafree Nanosep 10 ΩB; N[124]
ErythrocytesNAWashing; lysis; deproteinization; oxidation154 mM NaCl; water; 1.84 M TCA; 1 M HCl with 1 mg MnO2B; N[120]
Human urine500 µLOxidation; filtration6 M HCl/10 mg MnO2P; ISO; 6-B; 7-B; 6-N; 7-N[125]
100 µLOxidation; filtration4% potassium iodide/2% iodine solution (w/v)6-B; 6-HMP; N; P; ISO; X[126]
400 µLOxidation; filtrationA: 2 M NaOH, iodide/iodine solution; B: 5 mM KMnO4 B; N; P; PCA; 6,7 DMP; ISO; X; 6-HMP[127]
100 µLFiltrationA: Lugol’s solution (4% iodide/2% iodine solution (w/v)), B: MnO2; C: Potassium permanganateP; X; 7,8-DX; ISO; 6-B; S; N; M; 6-CP; 6-HMP; 6,7-DMP; 6-MP; 6-HLU; 7-HLU; 6-FP; L[128]
100 µLAcidification of urine; oxidation0.5% iodine/1% iodide in alkaline and acidic solutionB; N; P; BH4; BH2[129]
360 µLStabilization; filtration1% ascorbic acid; Nanosep 10ΩS[103]
500 µLDilutionCitrate buffer 10 mM; pH 5.5N; B; P; ISO[113]
1 mLAcidification; oxidation; extraction6N HCl; iodide/iodine solution (in 0.1 N NaOH or 0.1 N HCl); Dowex 50W X8, elution with 0.5 M NH4OH; Dowex 1 X8, elution in 1 N acetic acidX; N; B; BH4[130]
500 µLAcidification; oxidation6 M hydrochloric acid; MnO2 (10 mg); B; N; M[131]
1 µL (injection volume)Dilution; SPE20× in 1% DTTBH4; BH2; N; DHN[132]
Amniotic fluid200 µLAcidic oxidation; deproteinizationMnO2; 30% TCAN; M; ISO; B; PR; P[58]
Oxidation; clean-up with ion exchange resinIodide/iodine at pH 1.0B; N[133]
200 µLOxidation; precipitation1 M hydrochloric acid; 2 m MnO2; 30% TCAB; N[134]
Cell lysates80 µLLysis and sonication0.2 M TCA, 50 mM ascorbic acid; 1 mM EDTA; 6.5 mM DTEBH4; BH2; B[117]
150 µLLysis; oxidation; deproteinization50 mM Tris-HCl; pH 7.5; 1 mM DTT (lysis); acidic iodine (10 g/L)B; N[115]
350 µl per pelletLysis; sonication; protein isolation50 mM potassium phosphate buffer; pH 7.0; 0.2 mM PMSF; fast desalting columnN[116]
NALysis; sonication; deproteinization; oxidationExtraction buffer (20 mM Tris-HCl, pH 7.4, 0.1 mM EDTA, 1 mM DTT, 10% glycerol, 0.1% Tween 20); 30% TCA; MnO2 (10 mg) with 0.2 M H3PO4B; N[114]
B, biopterin; 6-B, 6-biopterin; 7-B, 7-biopterin; BH4, 5,6,7,8, tetrahydrobiopterin; BH2, 7,8 dihydrobiopterin; DHN, dihydroneopterin; 6-CP, 6-carboxpterin; 6,7-DMP, 6,7-dimehtylpterin; DTT, dithiothreitol; 7,8 DX, 7,8-dihydroxanthopterin; 6-FP, 6-formylpterin; 6-HMP, 6-hydroxymethylpterin; 6-HLU, 6-hydroxylumazine; 7-HLU, 7-hydroxylumazine; ISO, isoxanthopterin; L, leucopterin; LU, lumazine; 6-MP, 6-methylpterin; M, monapterin; NA, not addressed; N, neopterin; 6-N, 6-neopterin; 7-N, 7-neopterin; PCA, pterin 6-carboxylic acid; P, pterin; PMSF, phenylmethanesulfonyl fluoride; PR, primapterin; S, sepiapterin; TCA, trichloroacetic acid; X, xanthopterin.
Table 5. Liquid chromatography techniques for the quantitative measurement of pterins in different human fluids.
MatrixTechniqueAnalytesSample PreparationInternal Standard ColumnMobile PhaseElutionDetection Ref.
Human CSFHPLCB; NDilutionNAUltraPure Torsic Acid4.6 g/L NH4HPO4; pH 3.5IsocraticFL; ex: 350 nm; em: 450 nm[38]
HPLCN; BH4; BH2; SDilution15N-BH4; 15N-BH2; 15N-NAAA-MS columnA: 0.1% formic acid/0.1% heptafluorobutyric acid in water; B: 0.1% formic acid in methanolGradientMS/MS; [positive ionization electrospray][108]
HPLCBH4; BH2; DHN; B; NDilutionLUAtlantis dC180.005 M sodium citrate/methanol (97:3; v/v)IsocraticPost-column oxidation; FL: ex: 350 nm; em: 450 nm[118]
HPLCBH4; BH2; NDilution, filtrationBH4; BH2; NODS (C18)50 mM sodium acetate; 5 mM citric acid; 48 µM EDTA; 160 µM DTEIsocraticFL; ex: 360 nm; em: 440 nm (oxidized pterins); coulometric (reduced pterins)[39]
UHPLCBH4; BH2; B; N; DHNDirect injectionBH2; B; N; DHNACQUITY UPLC HSS T3 0.05 M citrate buffer; pH 5.2 (pH 7.4 for BH4); methanol (97:3, v/v)IsocraticCoulometric, FL ex: 350 nm; em: 450 nm[40]
Human plasmaHPLCB; BH4DilutionNAHypersil C18A: 15 mM potassium phosphate buffer; pH 6.45; B: MethanolGradientFL; ex: 360 nm; em: 440 nm[107]
HPLCBH4DerivatizationBH4-benzoyl chloride-d5HILIC polar imidazole columnA: Acetonitrile/water (15%/85%; v/v) with 0.2% formic acid; B: Acetonitrile with 0.2% formic acidGradientMS/MS; [positive ionization electrospray][119]
HPLCB; NDilutionNWhatman 10 µm ODS; Partisil 10; µBondapak C185% or 20% methanol in waterIsocraticFL; ex: 350 nm; em: 410 nm[110]
Human serumHPLCB; NCation exchange resinBH4; BH2Excalibur ODSMethanol/water (15/85, v/v)IsocraticFL; ex: 370 nm; em: 418–700 nm[121]
HPLCPCA; X; N; M; ISO; P; 6-B; 7-B; 6-HMPCation exchangePCA; X; N; M; ISO; P; 6-B; 7-B; 6-HMPZorbax-Eclipse XDB C18 and Poroshell 1202 mM ammonium formiate; pH 7.1IsocraticFL; ex: 272 nm; em: 410 nm, 445 nm, 465 nm[122]
Dried blood spotsHPLCB; N; ISO; PNoneB; N; PPre column C8 Spherisorb; ODS-1 Spherisorb1.5mM potassium hydrogen phosphate buffer; pH 4.6/8% methanol (v/v)IsocraticFL; ex: 350 nm; em: 450 nm[123]
UPLCB; NDilution13C5-N; D3-BACQUITY UPLC HSS T3A: 0.2% formic acid in water; B: 0.2% formic acid in methanolGradientMS/MS; [positive ionization electrospray][124]
Human urineHPLCP; ISO; 6-B; 7-B; 6-N; 7-NDilutionBH4; P; ISO; 6,7-DMPZORBAX C18; LUNA amino; HILIC; AQUA C18Methanol/0.1% formic acid; acetonitrile/0.1% formic acid; water/0.1% formic acid/10 mM ammonium formiateIsocraticMS/MS; [negative ionization electrospray][125]
HPLC6-B; 6-HMP; N; P; ISO; XDilution6-B; 6-HMP; N; P; ISO; XPhenyl-hexyl columnA: 0.1% formic acid in H2O; B: 0.2% formic acid in acetonitrileGradient MS/MS; [positive ionization electrospray][126]
HPLCB; N; P; PCA; 6,7 DMP; ISO; X; 6-HMPDilutionB; N; P; PCA; 6,7 DMP; ISO; X; 6-HMPLiChrospher C8 60 RP; Aquasil C18; HILIC LunaA: 10 mM phosphate buffer, pH 7.0; B: Methanol (LiCrospher); A: 10 mM Tris-HCl, pH 6.8; B: Methanol (Aquasil); A: 100 mM ammonium acetate buffer pH 5.8; B: Acetonitrile (HILIC)Gradient (LiCrospher; HILIC); isocratic (Aquasil)FL; ex: 280 nm; em: 444 nm; UV: 215 nm and 254 nm[127]
HPLCP; X; 7,8-DX; ISO; 6-B; S; N; M; 6-CP; 6-HMP; 6,7-DMP; 6-MP, L; 6-HLU; 7-HLU; 6-FP; L DilutionP; X; 7,8-DX; ISO; 6-B; S; N; M; 6-CP; 6-HMP; 6,7-DMP; 6-MP; L; 6-HLU; 7-HLU; 6-FP; L LunaA: 0.025% (v/v) formic acid in 99% water/1% acetonitrile; B: MethanolGradientMS/MS; [positive ionization electrospray][128]
HPLCB, N, P, BH4, BH2 6-MPRP 18Water/methanol (97/3, v/v)GradientFL; ex: 350 nm; em: 410 nm[129]
HPLCN; B; P; ISOPost-column photo derivatizationBH4; BH2 Pre-column: XDB-C18; Zorbax Eclipse XDB-C18Citrate buffer; pH 5.5/acetonitrile (98/2, v/v)IsocraticFL; ex: 272 nm; em: 445 nm; photometric: 256 nm [113]
HPLCS XSpherisorb S5 ODS1250A: 24 mM K2HPO4, pH 5.0; B: Methanol/water (70/30; v/v)GradientFL; ex: 425 nm; em: 530 nm[103]
HPLCX; N; B; BH4None6-MPPartisil-10 SCX1 mM ammonium dihydrogen phosphate; pH 2.8/7% methanol/5% acetonitrileIsocraticFL; ex: 360 nm; em: 420 nm[130]
HPLCB; N; MDilutionB; M; N; PSpherisorb S5 ODSA: Methanol/water (3:97, v/v); B: Isopropanol/methanol/acetic acid (49:49:2, v/v/v); C: Isopropanol-methanol-water (1:1:8, v/v/v); D: 6.6 mM Na2HPO4/13.3 mM citric acid/0.06 mM Na2EDTA/1.4 mM octanesulphonic acid/10% methanol, pH 3.3; E: 6.6 mM Na2HPO4/13.3 mM citric acid/0.06 mM Na2EDTA/1.4 mM octanesulphonic acid/10% isopropanol, pH 3.3; F: 20 mM KH2PO4/0.85 mM octanesulphonic acid/0.1 mM Na2EDTA/1% methanol, pH 3.0 Gradient (A, B, C for oxidized pterins); Isocratic (E, F for reduced pterins)FL; ex: 350 nm; em: 450 nm (oxidized pterins); amperometric (reduced pterins)[131]
UHPLCBH4; BH2; N; DHNSPEBH4; BH2; N; DHNBEH Amide column50 mM ammonium acetate; pH 6.8; acetonitrile (15:85, v/v)Isocratic FL; ex: 353 nm; em: 438 nm; UV detection (PDA detector) at 253 nm[132]
Amniotic fluidHPLCB; NIon exchange resin6-MPPartisil-10 SCX1 mM ammonium dihydrogen phosphate; pH 2.8/7% methanol/5% acetonitrileIsocraticFL; ex: 360 nm; em: 420 nm[133]
Cell lysatesHPLCBH4; BH2; BNone15N-BH4; 15N-BH2; 15N-BPoroshell 120 SB-C18 columnA: 150 mM acetic acid, 12 mM HFBA; B: 12 mM HFBA, methanolGradientMS/MS; [positive ionization electrospray][117]
HPLCB; NDeproteinizationBSpherisorb C18 NDGradientFL; ex: 350 nm; em: 450 nm[115]
HPLCNGTPCH activity assayNInartsil ODS-310 mM sodium phosphate; pH 7.0/1 mM EDTAIsocraticFL; ex: 365 nm; em: 475 nm[116]
HPLCB; NNANAEconosphere C180.1 M sodium phosphate; pH 3.0/5% methanolIsocraticFL; ex: 350 nm; em: 450 nm[114]
B, biopterin; 6-B, 6-biopterin; 7-B, 7-biopterin; BH4, 5,6,7,8, tetrahydrobiopterin; BH2, 7,8 dihydrobiopterin; DHS, deoxysepiapterin; DHN, dihydroneopterin; 6-CP, 6-carboxpterin; 6,7-DMP, 6,7-dimethylpterin; 7,8 DX, 7,8-dihydroxanthopterin; 6-FP, 6-formylpterin; 6-FDP, 6-formyldihydropterin; 6-HMP, 6-hydroxymethylpterin; 6-HLU, 6-hydroxylumazine; 7-HLU, 7-hydroxylumazine; ISO, isoxanthopterin; L, leucopterin; LU, lumazine; 6-MP, 6-methylpterin; M, monapterin; ND, not described; N, neopterin; 6-N, 6-neopterin; 7-N, 7-neopterin; PCA, pterin 6-carboxylic acid; PR, primapterin; P, pterin; S, sepiapterin; X, xanthopterin.
Table 6. Pterin profiles in different body fluids in BH4 deficiencies.
MatrixAnalytesarGTPCHDadGTPCHDPTPSDDHPRDSPRDPCDD
Human urinebiopterinlowlow to normallownormal (to high)normallow to normal
neopterinlowlow to normalhighnormal (to high)normalnormal to high
xanthopterinNRNRNR(high)NRNR
primapterinNRNRNRnormalnormalhigh
sepiapterinNRNRNRNRhighNR
Human CSFbiopterinlowlowlownormal (to high)normal (to high)normal
BH4lowlow to normallowlow to normallowNR
neopterinlowlowhighnormalnormalnormal
BH2(low)NRNRnormal (to high)highNR
primapterin(normal)NRNRNRNRNR
sepiapterin(normal)NRNRNRhighNR
Dried blood spotbiopterinlowlow to normallownormal to highnormalNR
neopterinlowlow to normalhighnormal to highnormalNR
primapterinNRNRNRnormalnormalNR
ad/arGTPCHD, autosomal dominant/autosomal recessive GTP cyclohydrolase deficiency; DHPRD, dihydropteridine reductase deficiency; NR, not reported; PCDD, pterin-4 -carbinolamine dehydratase deficiency; PTPSD, 6-pyruvoyl tetrahydrobiopterin synthase deficiency; SRD, sepiapterin reductase deficiency; () few reported cases.

