Article

Oncogenic Role of ZFAS1 lncRNA in Head and Neck Squamous Cell Carcinomas

1
Department of Cancer Immunology, Chair of Medical Biotechnology, Poznan University of Medical Sciences, 8 Rokietnicka Street, 60-806 Poznan, Poland
2
Laboratory of Cancer Genetics, Greater Poland Cancer Centre, 15 Garbary Street, Room 5025, 61-866 Poznan, Poland
3
Postgraduate School of Molecular Medicine, Medical University of Warsaw, 61 Zwirki i Wigury Street, 02-091 Warszawa, Poland
4
Department of Diagnostics and Cancer Immunology, Greater Poland Cancer Centre, 15 Garbary Street, 61-866 Poznan, Poland
5
Department of Medical and Experimental Oncology, Heliodor Swiecicki Clinical Hospital, Poznan University of Medical Sciences, 16/18 Grunwaldzka Street, 60-786 Poznan, Poland
6
Department of Biology and Environmental Sciences, Poznan University of Medical Sciences, 8 Rokietnicka Street, 60-806 Poznan, Poland
*
Authors to whom correspondence should be addressed.
Cells 2019, 8(4), 366; https://doi.org/10.3390/cells8040366
Submission received: 19 February 2019 / Revised: 17 April 2019 / Accepted: 18 April 2019 / Published: 21 April 2019
(This article belongs to the Special Issue lncRNA and Cancer)

Abstract

:
Background: Head and neck squamous cell carcinoma (HNSCC) is a heterogeneous disease with high mortality. The identification of specific HNSCC biomarkers will increase treatment efficacy and limit the toxicity of current therapeutic strategies. Long non-coding RNAs (lncRNAs) are promising biomarkers. Accordingly, here we investigate the biological role of ZFAS1 and its potential as a biomarker in HNSCC. Methods: The expression level of ZFAS1 in HNSCC cell lines was analyzed using qRT-PCR. Based on the HNSCC TCGA data, the ZFAS1 expression profile, clinicopathological features, and expression of correlated genes were analyzed in patient tissue samples. The selected genes were classified according to their biological function using the PANTHER tool. The interaction between lncRNA:miRNA and miRNA:mRNA was tested using available online tools. All statistical analyses were accomplished using GraphPad Prism 5. Results: The expression of ZFAS1 was up-regulated in the metastatic FaDu cell line relative to the less aggressive SCC-25 and SCC-040 and dysplastic DOK cell lines. The TCGA data indicated an up-regulation of ZFAS1 in HNSCCs compared to normal tissue samples. The ZFAS1 levels typically differed depending on the cancer stage and T-stage. Patients with a lower expression of ZFAS1 presented a slightly longer disease-free survival and overall survival. The analysis of genes associated with ZFAS1, as well its targets, indicate that they are linked with crucial cellular processes. In the group of patients with low expression of ZFAS1, we detected the up-regulation of suppressors and down-regulation of genes associated with epithelial-to-mesenchymal transition (EMT) process, metastases, and cancer-initiating cells. Moreover, the negative correlation between ZFAS1 and its host gene, ZNFX1, was observed. The analysis of interactions indicated that ZFAS1 has a binding sequence for miR-150-5p. The expression of ZFAS1 and miR-150-5p is negatively correlated in HNSCC patients. miR-150-5p can regulate the 3′UTR of EIF4E mRNA. In the group of patients with high expression of ZFAS1 and low expression of miR-150-5p, we detected an up-regulation of EIF4E. Conclusions: In HNSCC, ZFAS1 displays oncogenic properties, regulates important processes associated with EMT, cancer-initiating cells, and metastases, and might affect patients’ clinical outcomes. ZFAS1 likely regulates the cell phenotype through miR-150-5p and its downstream targets. Following further validation, ZFAS1 might prove a new and valuable biomarker.

1. Introduction

Head and neck squamous cell carcinomas (HNSCCs) are found in over 90% of the epithelial-origin tumors localized in the oral cavity, pharyngeal, and larynx. The main risk factors are tobacco smoking, alcohol consumption, and human papillomavirus (HPV) infections. HNSCCs are characterized by high mortality due to their tendency to metastasize to local lymph nodes and high resistance to chemo-radiotherapy [1,2].
Some progress has been made in the HNSCC treatment. However, results remain unsatisfactory, and new strategies based on molecular personalization are being developed [3,4]. The important players here are biomarkers to assess a patient’s prognosis and for selection for adequate treatment.
Multiple studies have indicated that different types of shorter and longer non-coding RNAs are deregulated in HNSCC and associated with specific phenotypes of cancer cells and clinicopathological parameters [5,6,7,8]. Currently, long non-coding RNAs (lncRNAs) are the most intensively investigated molecules. lncRNAs are a class of functional, longer than 200 nucleotides, RNA molecules that are not translated into proteins, but function as regulators of transcription or regulators of the chromatin structure [7,8]. Moreover, some of the lncRNAs can be loaded into extracellular vesicles and transferred to other cells, where they can act as trans-regulators [9].
It is believed that lncRNAs have much potential in HNSCC diagnostics, prognosis, and targeted therapy [5,6,7,8].
Here we focused on the expression of ZNFX1 antisense RNA 1 - ZFAS1 lncRNA (other synonyms: C20orf199, HSUP1, HSUP2, NCRNA00275, ZNFX1-AS1), which was originally identified as a regulator of alveolar and epithelial cell differentiation in mammary development process [10]. The ZFAS1 gene is located on chromosome 20 (q13.13) and is transcribed from the antisense strand near the 5′-end of the protein-encoding gene Znfx1 and the hosts three C/D box snoRNAs (Snord12, -12b, and -12c) [10]. Various studies have identified ZFAS1 as a cancer oncogene in: glioma [11,12], gastric cancer [13,14,15,16,17], colorectal cancer [18,19,20,21], hepatocellular carcinoma [22], ovarian cancer [23,24], melanoma [25], non-small cell lung cancer [26], osteosarcoma [27], esophageal squamous cell carcinoma [28], and hematological malignancies [29,30]. However, suppressor roles for ZFAS1 lncRNA in breast cancer and hepatocellular carcinoma have also been reported [12,13,21]. ZFAS1 is up-regulated in cancers, excluding breast cancer, and regulates cellular phenotypes, EMT process, proliferation, migration, and invasion, and also affects apoptosis [10,11,12,13,14,15,16,17,18,19,20,21,22,23,24,25,26,27,28,29,30,31]. However, the exact role of ZFAS1 lncRNA remains unknown in some cancers, including the HNSCC.
Here we analyzed the expression level of ZFAS1 in HNSCC cell lines by qRT-PCR. Then, using available TCGA data, the role of ZFAS1 in the biology of HNSCC and its utility as a new, potential biomarker in clinical practice were examined.

2. Materials and Methods

2.1. HNSCC Cell Culture and Quantification of ZFAS1 Expression

The HNSCC cell lines: dysplastic oral keratinocyte (DOK), SCC-040 (oral cancer model), SCC-25 (tongue cancer model), and FaDu (hypopharyngeal cancer model) were used for the study. The DOK, SCC-040, and SCC-25 cell lines were maintained according to the instructions from the Culture Collections—Public Health England (Salisbury, UK) or DSMZ (Deutsche Sammlung von Mikroorganismen und Zellkulturen GmbH, Leibniz Institut, Braunschweig, Germany), respectively. The FaDu cell line was cultured as described previously [32]. All cell lines were cultured with penicillin-streptomycin antibiotic (Merck Millipore, Burlington, MA, USA), and mycoplasma detection tests were performed routinely using the VenorGeM Mycoplasma PCR Detection Kit (Minerva Biolabs, Berlin, Germany).
The spheres forming capacity ability was checked by soft agar assay using low melting temperature SeaPlaque Agarose (Lonza, Basel, Switzerland). The wells of the culture plates were coated with bottom agar (1%), next the single cells (5000 cells/mL) were suspended in 0.3% agarose with optimal culture media, and 1 mL of this mixture onto bottom agar was placed. Cells were incubated under standard conditions and were supplemented with fresh media every 3 days. After 2 weeks, the spheres were measured using a microscope with cellSens Entry software (Olympus, IX70 Fluorescence Microscope, Olympus, Tokyo, Japan).
Total RNA from the cell lines was isolated using a High Pure miRNA isolation kit (Roche, Basel, Switzerland), according to the isolation protocol for total RNA from tissue and cell line samples. Quality and quantity of RNA samples were analyzed using a NanoDrop spectrophotometer (Thermo Scientific, Waltham, MA, USA).
cDNA synthesis reactions were performed using 1 μg of RNA and EvoScript Universal cDNA Master (Roche) according to manufacturer′s instruction. ZFAS1 (F: 5′-AAGCCACGTGCAGACATCTA-3′ and R: 5′-CTACTTCCAACACCCGCATT-3′) [33] and reference B2M (F: 5′-TTCTGGCCTGGAGGCTATC-3′ and R: 5′-TCAGGAAATTTGACTTTCCATTC-3′) genes were quantified using LightCycler 480 SYBR Green I Master buffer (Roche) and LightCycler 96 (Roche) according to manufacturer’s instruction. All data were shown as 2−ΔCt values and normalized to the B2M. Gene quantification was carried out using three independent cDNA replicates for each of the cell lines.

2.2. TCGA Data

The TCGA expression data of lncRNA ZFAS1, expression of selected genes, and clinical data were downloaded from cBioPortal (Head and Neck Squamous Cell Carcinoma, TCGA, Provisional, 530 samples data set) [34], from the UALCAN databases (http://ualcan.path.uab.edu) [35], and from StarBase v3.0 (http://starbase.sysu.edu.cn) [36] for 520 cancers and 44 normal tissue samples. All data is available online, and access is unrestricted and does not require patients consent or other permissions. The use of the data does not violate the rights of any person or any institution.

2.3. Data Analysis

The expression levels of lncRNA ZFAS1 and mRNA ZNFX1 were analyzed depending on the clinicopathological parameters, such as: age (<61.5 vs. >61.5), gender (women vs. men), T-stage (T1 + T2 vs. T3 + T4), N-stage (N0 + N1 vs. N2 + N3), cancer grade (G1 + G2 vs. G3 + G4), cancer stage (I + II vs. III + IV), HPV p16 marker (negative vs. positive), perineural invasion (negative vs. positive), angiolymphatic invasion (negative vs. positive), and lymphoid neck dissection status (negative vs. positive) in all localizations of the HNSCC samples. Next, in a group of 520 patients, high and low expression subgroups of ZFAS1 or ZNFX1 were selected using the <25, 25–75 and >75 percentile as cutoff: (i) low (n = 130); (ii) medium (n = 260); and (iii) high (n = 130), respectively. Disease-free survival (DFS) and overall survival (OS) were assessed in these subgroups.

2.4. Gene Analysis

Genes positively and negatively correlated with ZFAS1 (Pearson correlation >+0.3 or <−0.3, respectively) were analyzed using the PANTHER Classification System, classifying them into specific biological processes and cellular pathways [37].
The panel of genes connected with the EMT process and migration, as well as influence on cancer-initiating cells, was created based on previous reports [38,39,40,41,42,43] and analyzed in the ZFAS1 low- and high-expressing groups of patients.

2.5. Targets Analysis

The analysis of interaction between lncRNA:miRNA and miRNA:mRNA was carried out using available online prediction tools: StarBase v3.0, TargetScanHuman 7.2 (http://www.targetscan.org/vert_72/) [44], miRDB (http://www.mirdb.org) [45], and TarBase v7.0 (http://diana.imis.athena-innovation.gr/DianaTools/index.php?r=tarbase/index) [46]. For the identification of the miR-150-5p effect on the predicted targets, the two groups of patients were created: (i) with high level of miR-150-5p and low ZFAS1 (n = 30) as well as (ii) with the low level of miR-150-5p and high ZFAS1 (n = 30); data obtained from StarBase v3.0. Next, the expression of selected genes was compared between these groups.

2.6. Statistical Analysis

All statistical analyses were performed using GraphPad Prism 5 (GraphPad, San Diego, CA, USA). The Shapiro-Wilk normality test, t-test, and Mann–Whitney U test were used for ZFAS1 and ZNFX1 level (depending on clinical parameters) and gene expressions (depending on ZFAS1 subgroups). The expression level of ZFAS1 and ZNFX1 (depending on the cancer location) was checked using one-way ANOVA obtained using Dunn’s multiple comparisons test. All qRT-PCR and TCGA data are presented as mean with SEM. For DSF and OS analyses, the Log-Rank (Mantel-Cox) and Gehan-Breslow-Wilcoxon tests were used, and Hazard Ratio (Mantel-Haenszel; HR) and 95% Confidence Interval (CI) of ratio were calculated. In all analyses, p < 0.05 was used to determine statistical significance.

2.7. Availability of Data and Materials

The datasets used and/or analyzed during the current study are available from the corresponding author on reasonable request. Raw data are available on the cBioPortal, UALCAN and StarBase v3.0 databases.

3. Results

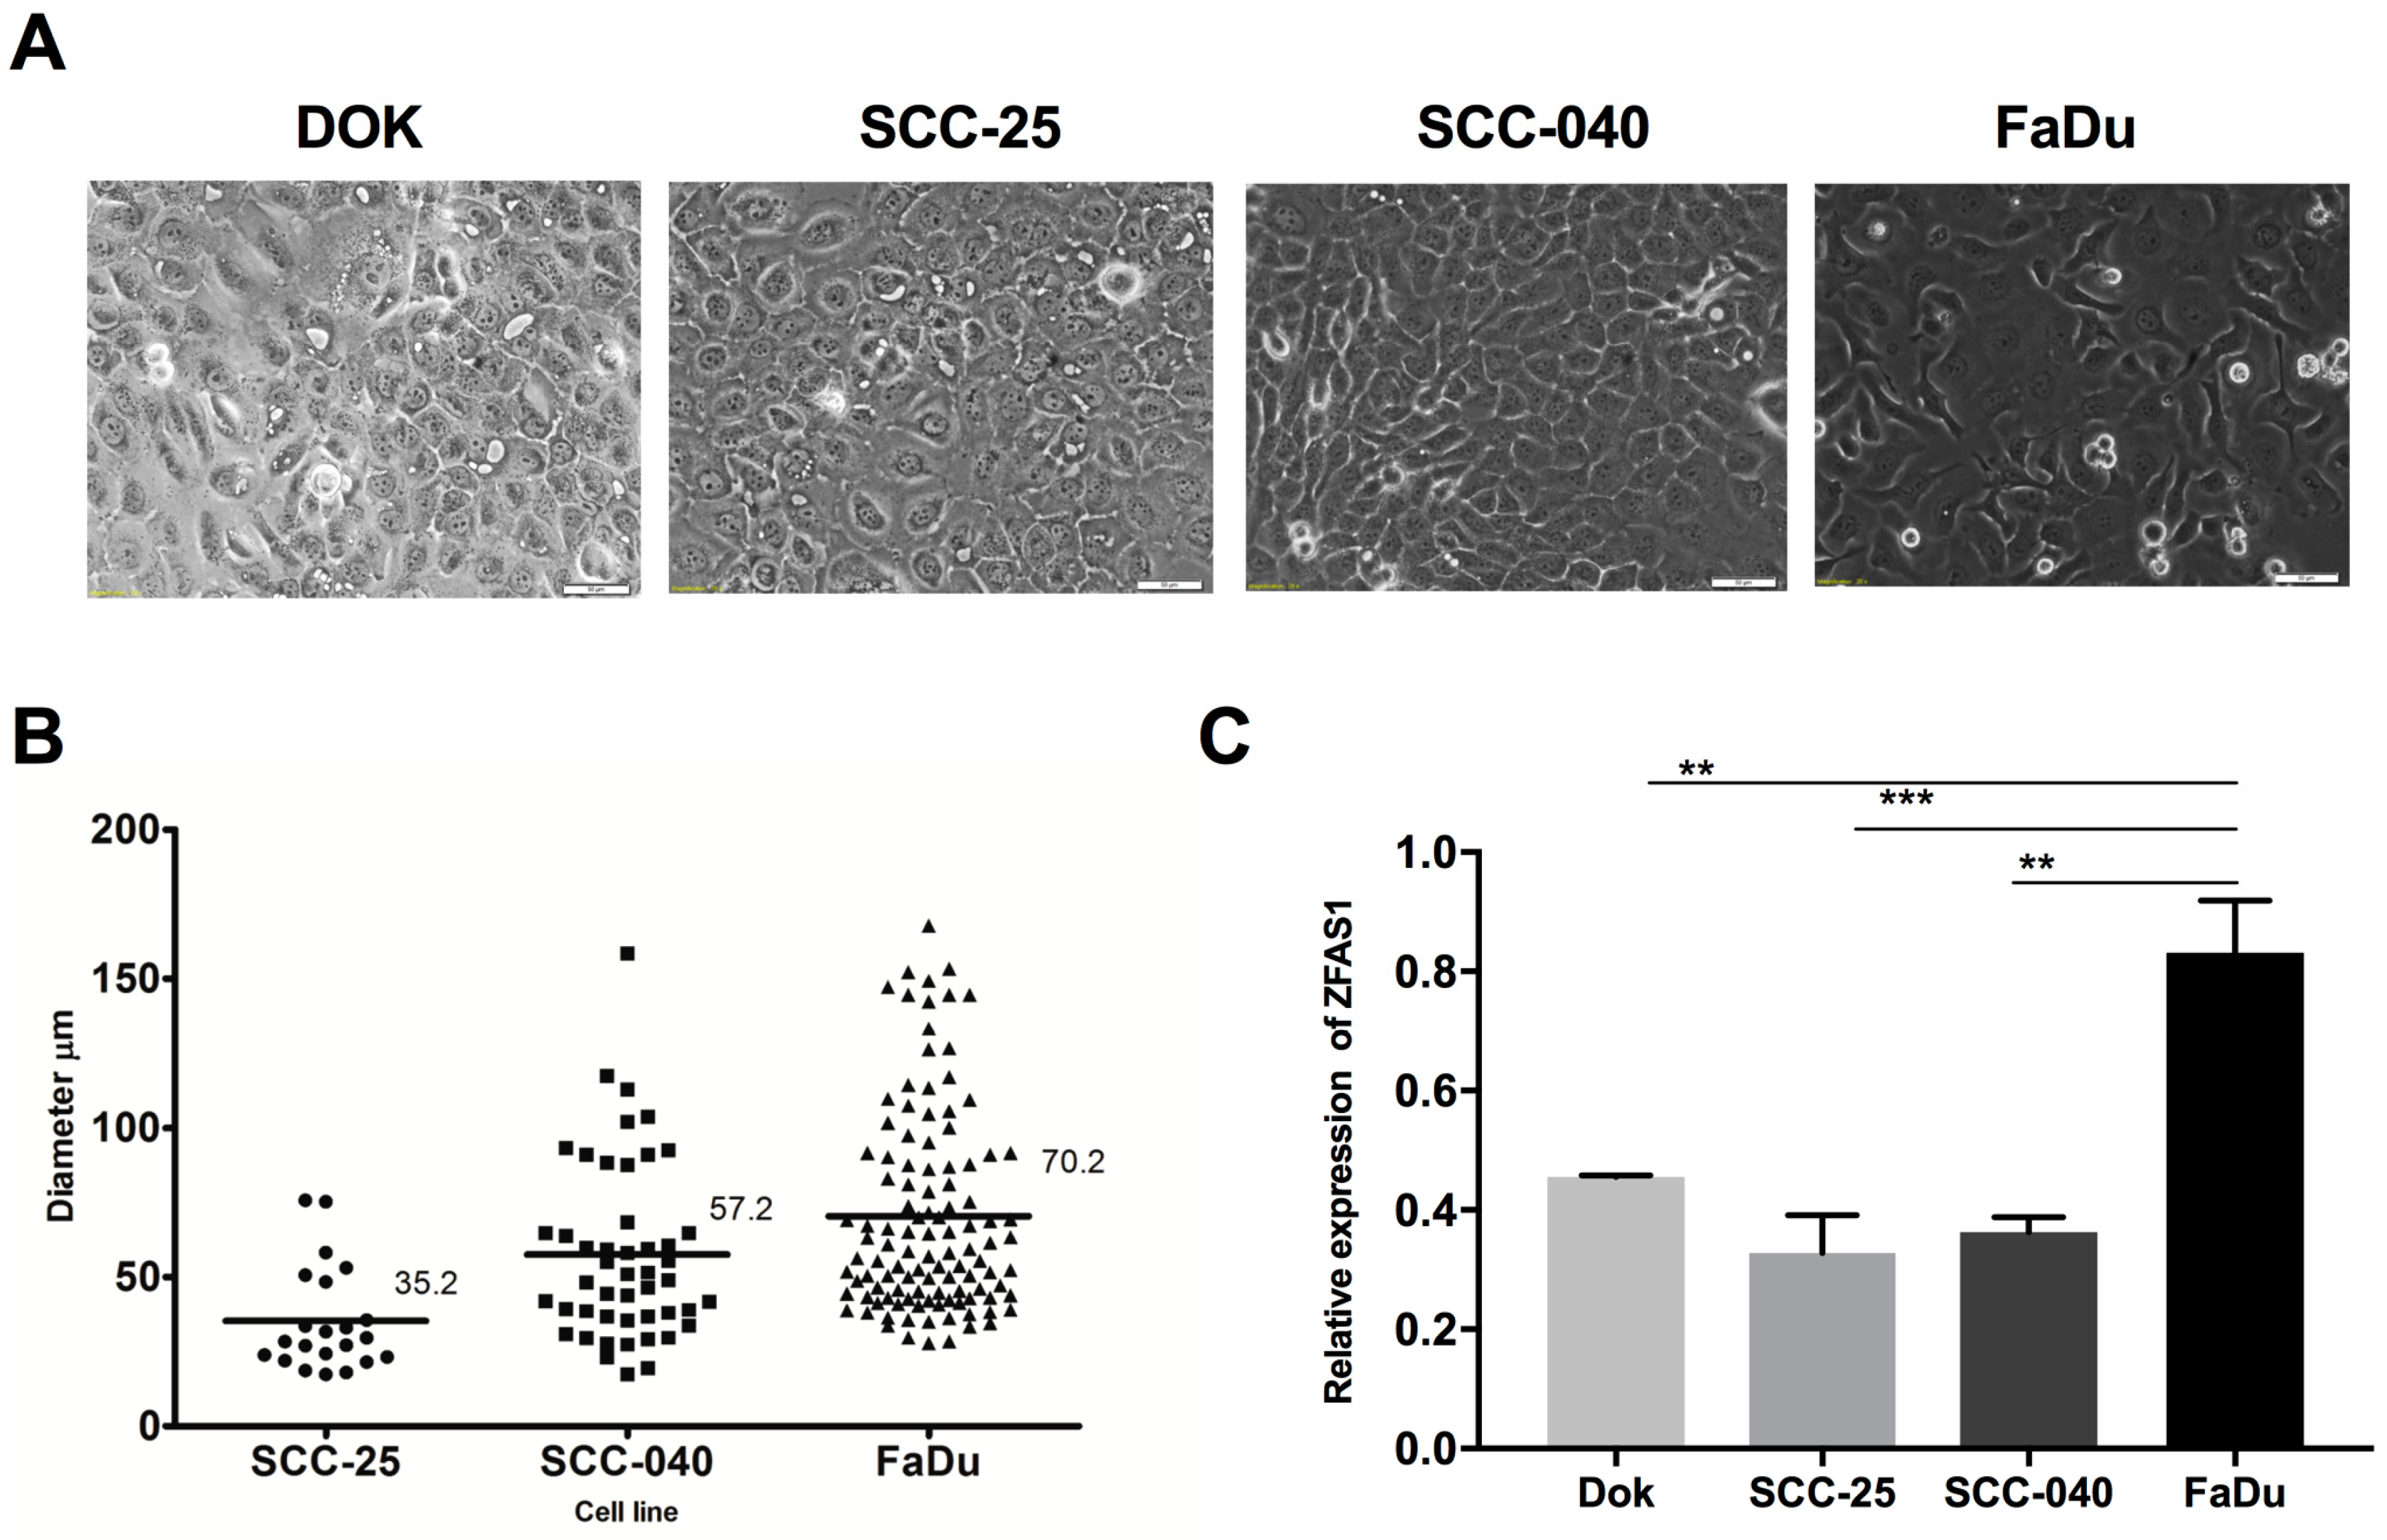
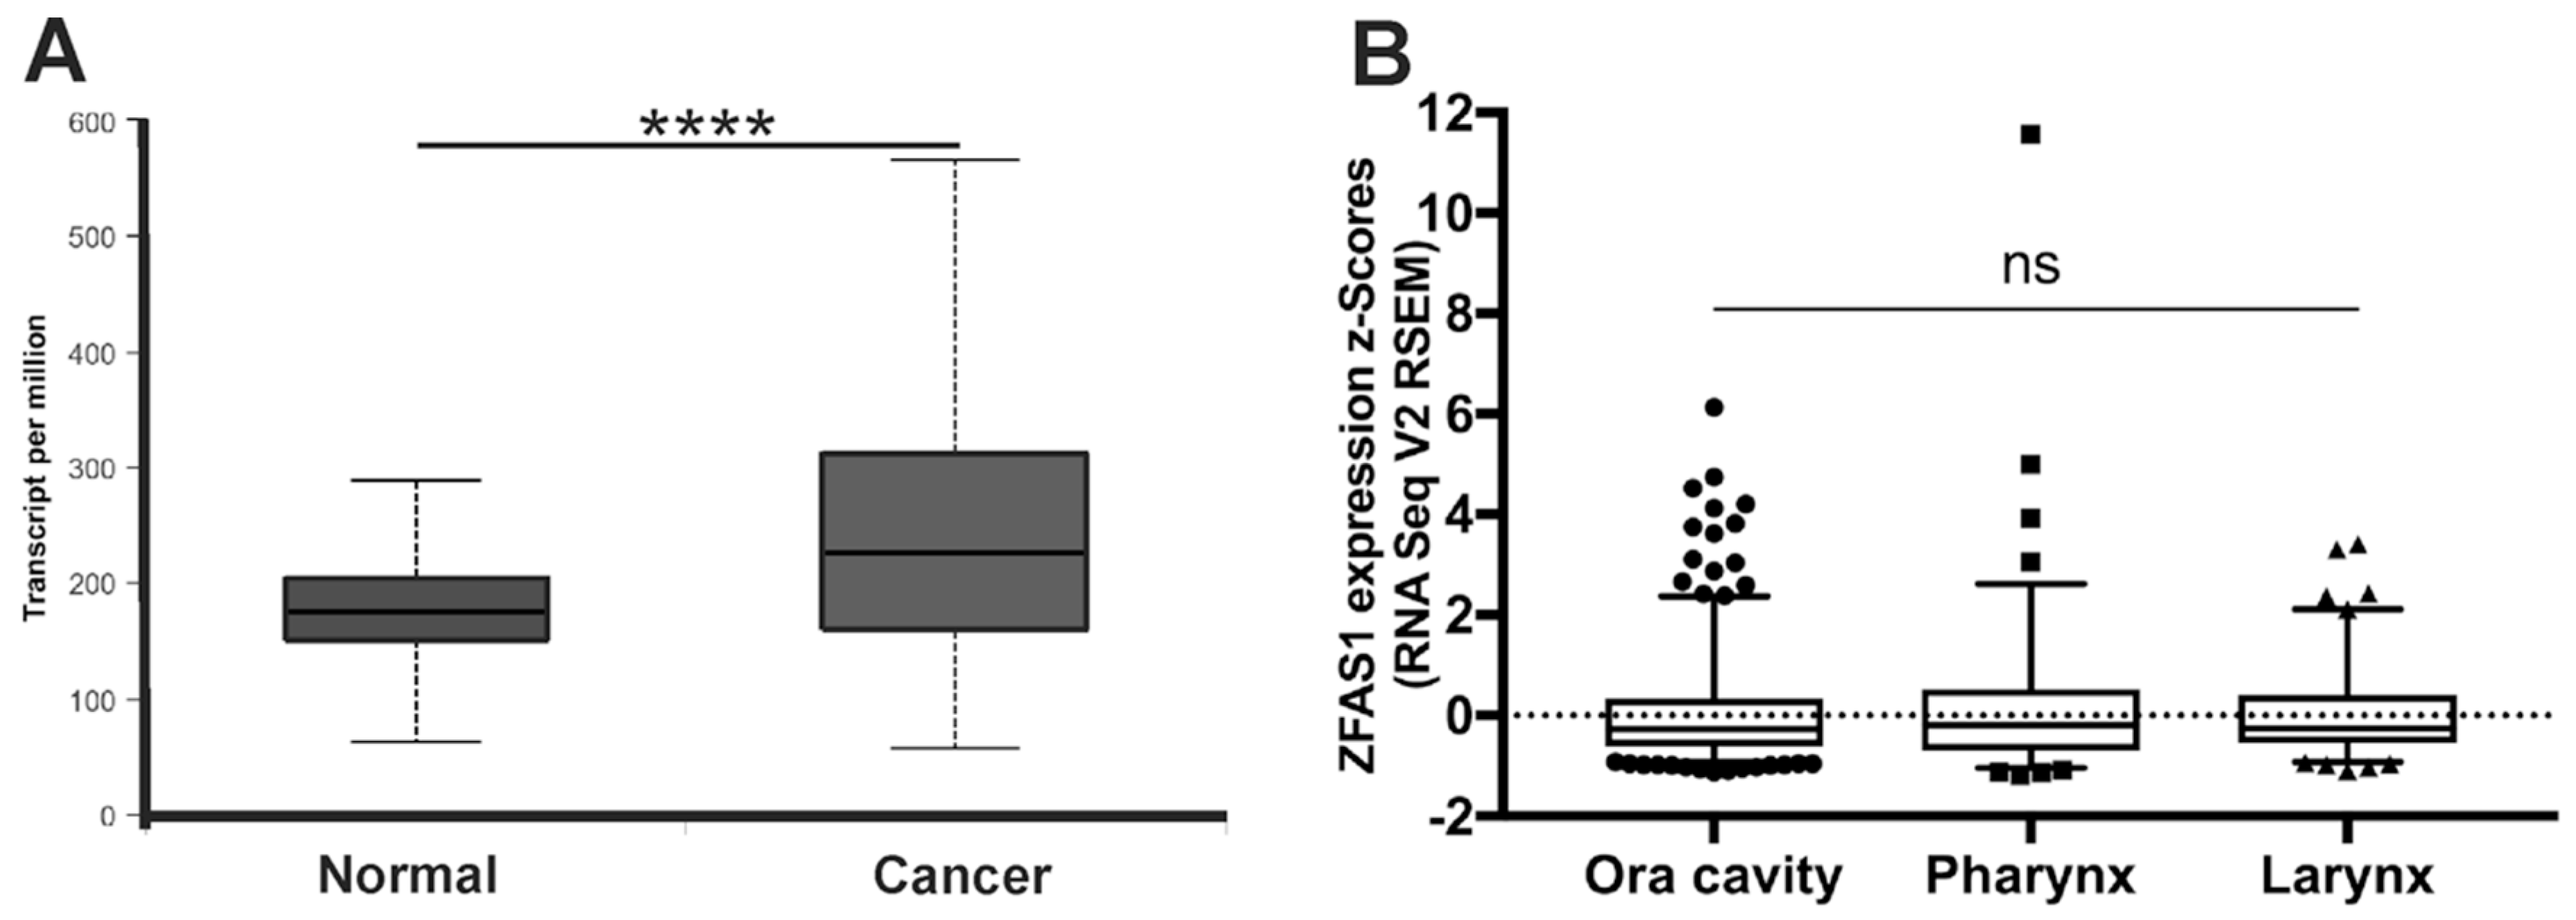
3.1. ZFAS1 is Up-Regulated in HNSCC Cell Lines and Cancer Samples of HNSCC Patients

The analyzed HNSCC cell lines were characterized by different morphology and tumorigenic potential. The FaDu cells were spindly, more fibroblast-like compared to DOK, SCC-25, and SCC-040, which are scale-like, cube-shaped, epithelial cells (Figure 1A). Moreover, the FaDu cells were more aggressive and had a higher sphere forming ability (number and size of spheres) compared to the SCC-25 and SCC-040 cell lines (mean sphere diameter: 70.2 μm vs. 35.2 μm vs. 57.2 μm, respectively) and to DOK cell line, which did not form spheres (Figure 1B).
Next, the expression level of ZFAS1 in SCC-25, SCC-040, and FaDu cell lines using qRT-PCR method were analyzed. The up-regulation of ZFAS1 in the case of FaDu compared to the DOK, SCC-25, and SCC-040 (0.831 ± 0.088 vs. 0.4554 ± 0.003 vs. 0.3283 ± 0.063 vs. 0.3628 ± 0.026, p = 0.0027, p = 0.0008, and p = 0.0012, respectively), and no differences between DOK, SCC-25, and SCC-040 lines were observed (p < 0.05) Figure 1C.
According to the database (cBioportal and UALCAN), the expression of ZFAS1 was significantly up-regulated in cancer samples of HNSCC patients compared to normal tissue (median expression of 226.109 vs. 175.467 transcripts per million; p = 2.24 × 10⁻¹⁴) (Figure 2A).
HNSCC patients were divided into three main localization groups: oral cavity (n = 314), pharynx (n = 90) and larynx (n = 116), according to the National Institute of Health (NIH) classification, and expression levels of ZFAS1 were analyzed. No differences between tumors from the oral cavity, pharynx, and larynx localizations were observed (p = 0.7093), Figure 2B.

3.2. ZFAS1 Levels Differ Depending on Clinicopathological Parameters

The expression levels of ZFAS1 were analyzed depending on the group division based on available clinicopathological parameters in all HNSCC samples.
The significant differences between expression levels of ZFAS1 were observed in patients with various cancer stage (p = 0.0091) and T-stage (p = 0.0169). Other analyzed parameters did not differ between the studied groups (Table 1).

3.3. Association of ZFAS1 Expression and DFS and OS in the Studied Patients

HNSCC samples were divided into low, medium, and high ZFAS1 expression groups using the <25, 25–75 and >75 percentile of ZFAS1 expression as a cutoff, respectively. We observed a slightly longer DFS of low ZFAS1 expression patients compared to the high expression group (p = 0.0598; HR = 0.6554; 95% CI = 0.4029–1.066). We also detected a slight longer OS in the low ZFAS1 expression group compared to the high group (p = 0.0356; HR = 0.6922; 95% CI = 0.4623–1.037) (Figure 3).

3.4. ZFAS1 is Involved in Important Cellular Processes

Next, genes positively and negatively correlated with ZFAS1 expression were analyzed. Four-hundred-forty-one genes were positively, and 112 genes were negatively correlated with the studied lncRNA (Pearson correlation >+0.3 or <−0.3, respectively). The classification analysis revealed that the genes positively correlated with ZFAS1 genes are associated with the regulation of multiple cellular processes and pathways, such as cell cycle, cell adhesion, signal transduction, death, response to stimulus, apoptosis signaling pathway, FAS signaling pathway, integrin signaling pathway, and mRNA splicing. The genes negatively correlated with ZFAS1 are associated with processes such as cell adhesion, signal transduction, cell differentiation, death, response to stimulus, angiogenesis, oxidative stress response, and various pathways (apoptosis, cadherin and integrin signaling pathways, EGFR, endothelial, FAS, FGF, insulin/IGF, TGF-beta, VEGF, interleukin, JAK/STAT, PDGF, PI3K, p53, p38, Ras, Toll receptor, and Wnt signaling pathways) (Table 2).

3.5. lncRNA ZFAS1 is Negatively Correlated with ZNFX1 mRNA in HNSCC

A previous report has indicated that lncRNA ZFAS1 shares the same transcription start sites with ZNFX1 (Zinc Finger NFX1-Type Containing 1) gene, and that expression of ZFAS1 and ZNFX1 are positively correlated [10]. Surprisingly, using the StarBase v3.0 database, the negative correlation between ZFAS1 and ZNFX1 in HNSCC patients was observed (r = −0.308, p = 1.75 × 10⁻¹²) (Figure 4A).
The expression of ZNFX1 was significantly up-regulated in cancer samples of HNSCC patients compared to normal tissue (median expression of 19.823 vs. 9.783 transcripts per million; p = 1.62 × 10⁻¹²) (Figure 4B,C).
Next, the expression levels of ZNFX1 were checked depending on cancer localization. No differences between tumors from the pharynx (−0.2584 ± 0.08905) and larynx (−0.2309 ± 0.07557) localizations were observed (p > 0.9999), but in the case of oral cavity significantly up-regulation of ZNFX1 compared to pharynx or larynx was observed (p < 0.0001), Figure 4D.
HNSCC patients were divided into low, medium, and high ZNFX1 expression groups and DSF as well as OS were analyzed. No differences between groups of patients in the case of DFS and OS were observed (p > 0.05) (Figure 4E). The expression levels of ZNFX1 were also analyzed depending on the group division based on available clinicopathological parameters in all HNSCC samples.
The significant differences between expression levels of ZNFX1 were observed in the case of gender (p = 0.0004), cancer stage (p < 0.0001) and T-stage (p = 0.0240), cancer grade (p = 0.0158), perineural invasion (p = 0.0022) or HPV status (p = 0.0086). Other analyzed parameters did not differ between the studied groups (Table 3).

3.6. Role of ZFAS1 in the EMT Process, Cancer-Initiating Cells Maintenance, and Metastasis Process in HNSCC

ZFAS1 is described as a modulator of the EMT process, cancer-initiating cell maintenance, and metastasis in many cancers [47], so its role in HNSCC was also checked.
Compared to the high-expressing group, the group of patients with low expression of ZFAS1 had significant down-regulation (p < 0.05) of genes connected with EMT, cancer-initiating cells and metastasis processes were observed for, POU5F1, SLC3A2, EPCAM, TAZ, JMJD6, ABCG2, ABCG5, HSPA5, S100A4, EIF4E, ANXA2, ILK, GSK3A, TRIM28, COL2A1, FN1, MMP9 and LEF1. Moreover, the up-regulation of CDH11, SMAD2, CXCR4, CDH1, DSP, COL4A1, TJP1, and CTNND1 genes, which prevent the EMT process, metastasis, and cancer-initiating cells maintenance, were observed in the group of patients with low expression of ZFAS1. However, in the group of patients with low expression of ZFAS1, we detected also an up-regulation CD44, MET, NOTCH1, MME, BMI1, CTNNB1, MMP3, CXCR2, SMAD3, MMP8, NUAK1, VIM, NFKB1, CCR7, MMP2, RPS6KB1, COL1A1, ETS1, DNMT3B, CD274, PTK2, and EGFR. All data are summarized in Table 4.

3.7. ZFAS1, As A Molecular Sponge, Regulates miR-150-5p and Influences the Cell Phenotype

Previous reports have indicated that ZFAS1 acts as a molecular sponge by targeting miRNAs, such as miR-9, miR-150, miR-484 or miR-200b/c, and reducing their activity in the cell [47]. Base on StarBase v3.0, the possible interaction between ZFAS1 and miRNAs was analyzed. In the case of miR-150-5p, an interaction between miRNA and ZFAS1 (ENSG00000177410) was observed: target site, chr20 47897429-47897448 [+]; seed site interaction, 7mer-m8. Moreover, between ZFAS1 and miR-150-5p, we detected a negative correlation (r = −0.116, p = 0.0098) in HNSCC patients (Figure 5A).
Next, the possible interaction between the analyzed genes and miR-150-5p was investigated using prediction tools: TargetScanHuman 7.2, miRDB, and TarBase v7.0. In the case of CPEB4, GAB1, EIF4E, ARHGEF10L, IL13RA1, KALRN, UQCR11, DSP, and MET, possible regulation between mRNAs and miRNA sequence was identified (Figure 5B). For the identification of whether miR-150-5p influenced the predicted targets, the two opposite groups of patients were created: (i) with a high level of miR-150-5p and low ZFAS1 (mean of expression: 10.4 ± 0.1726 and 3.563 ± 0.07182, respectively), as well as (ii) with low level of miR-150-5p and high ZFAS1 (mean of expression: 6.753 ± 0.1708 and 5.785 ± 0.1346, respectively) (Figure 5C), and the expression of selected genes was compared.
We observed an up-regulation of CPEB4 (0.6959 ± 0.1886 vs. −0.5981 ± 0.1144; p < 0.0001), GAB1 (0.1511 ± 0.2138 vs. −0.5011 ± 0.1193; p < 0.0001), ARHGEF10L (0.8128 ± 0.2354 vs. −0.8648 ± 0.1223; p < 0.0001), KALRN (0.9663 ± 0.257 vs −0.4563 ± 0.1316; p < 0.0001), DSP (0.7307 ± 0.245 vs. −0.568 ± 0.1231; p < 0.0001), IL13RA1 (0.5878 ± 0.1929 vs. −0.4504 ± 0.1467; p < 0.0001), and down-regulation of EIF4E (−0.59 ± 0.1357 vs. 0.4591 ± 0.334; p = 0.0009), UQCR11 (−0.4497 ± 0.07482 vs. 0.4494 ± 0.2681; p < 0.0001), and no differences of MET expression (0.0986 ± 0.1852 vs. 0.4189 ± 0.3695; p = 0.7447) in patients with high level of miR-150-5p and low ZFAS1 compared to the group with low level of miR-150-5p and high ZFAS1 (Figure 5D).

4. Discussion

The major finding of the study is a delineation of the biological role of lncRNA ZFAS1 and its potential utility as a biomarker in HNSCC. We report the up-regulation of ZFAS1 in HNSCC cell lines and cancer tissue samples derived from patients. Moreover, compared to SCC-25 and SCC-040 or DOK cell lines, higher levels of ZFAS1 are observed in the FaDu cell line, which is highly tumorigenic and possesses fibroblast-like features. Interestingly, the ZFAS1 expression level did not differ in various HNSCC localizations.
Similarly, the over-expression of ZFAS1 in tissue from other cancers was also described [11,12,15,16,17,18,19,20,21,22,23,24,25,26,27,28,29,30]. Accumulated data indicate a possible oncogenic role for ZFAS1 in cancer transformation. However, its suppressor role was also demonstrated in breast and hepatocellular carcinoma [13,14,31].
Higher expression of ZFAS1 was found in HNSCC patients with more advanced disease. Moreover, patients with a lower level of ZFAS1 displayed slight longer DFS and OS compared to the high-expressing group. Gao et al. presented a similar observation, where higher ZFAS1 expression was significantly correlated with advanced tumor stage and worse OS in glioma patients [11]. In the case of skin melanoma, higher ZFAS1 expression was associated with higher clinical stage, primary tumor thickness, and with the presence of lymph node metastases. Also, it served as a predictive marker of DFS and OS [25]. Shi et al. based on the retrospective analysis of 398 lymph node-negative esophageal squamous cell carcinoma patients, reported an association of higher ZFAS1 expression with less differentiated cancers [28].
The analysis of genes positively and negatively correlated with ZFAS1 in HNSCC indicated their association with some important cellular processes. Genes positively correlated with ZFAS1 were associated with cell cycle, cell adhesion, signal transduction, death, response to stimulus, apoptosis signaling pathway, FAS signaling pathway, integrin signaling pathway, and mRNA splicing. The genes negatively correlated with ZFAS1 were associated with processes such as: cell adhesion, signal transduction, cell differentiation, death, response to stimulus, angiogenesis, oxidative stress response, and multiple pathways (apoptosis, cadherin and integrin signaling pathways, EGFR, endothelial, FAS, FGF, insulin/IGF, TGF-beta, VEGF, interleukin, JAK/STAT, PDGF, PI3K, p53, p38, Ras, Toll receptor, and Wnt signaling).
Askarian-Amiri et al. described that the lncRNA ZFAS1 and ZNFX1 (Zinc Finger NFX1-Type Containing 1) genes share the same transcription start sites, and that expression of ZFAS1 and ZNFX1 are positively correlated [10]. Surprisingly, our analysis did not confirm the above observation in HNSCC, and ZNFX1 was negatively correlated with ZFAS1. However, ZNFX1 is up-regulated in cancer compared to normal samples and its expression depends on cancer localization. Our analysis also indicated, that expression of ZNFX1 depends on clinicopathological parameters and is up-regulated in the case of: female patients, lower cancer stage, T-stage and cancer grade, it is associated with cancer invasion to the space surrounding the nerves, and it is higher in HPV negative patients. Moreover, no difference between ZNFX1 level and patients’ survival (DFS neither OS) was observed. Unfortunately, there is lack of reports indicated the role of ZNFX1 in HNSCC or other cancers.
Previous studies have indicated the role of ZFAS1 in the regulation of EMT process, migration, and influence on cancer-initiating cells in different cancer types [11,12,14,15]. In our study, we also analyzed the panel of target genes studied in previous reports and associated with these processes [38,39,40,41,42,43]. We found genes up-regulated in the ZFAS1 low expression group of patients compared to the ZFAS1 high group. These displayed a suppressor function for EMT processes, metastases, and cancer initiating cells maintenance, and down-regulation of the genes supporting these processes. These data support the hypothesis that ZFAS1 is an oncogene and its high expression is associated with the more aggressive phenotype of HNSCC. It has been proposed that ZFAS1 is a key activator of the EMT process in glioma, colorectal cancer, and gastric cancer [12,15]. However, the authors analyzed only a limited number of markers associated with the EMT process. Our analysis was based on multiple marker genes, which sometimes display an opposite function to ZFAS1 in these processes. Examples include patients with high level of ZFAS1 with low expression of NOTCH1, one of the important elements of the pathway described in the context of EMT and cancer-initiating cells [38]. Gao et al. showed that ZFAS1 affects the NOTCH signaling pathway. Knockdown of ZFAS1 caused down-regulation of the HES-1 (HES family bHLH transcription factor 1) and NICD (Notch intracellular domain), which are NOTCH signal-related proteins, but the mechanism of NOTCH signaling regulation by ZFAS1 remains unknown [11]. However, in HNSCC, a high level of NOTCH1 was associated with better survival [48], which supports our findings, where low ZFAS1 expressing patients displayed higher NOTCH1 level and better survival.
Moreover, we observed a high expression level of EGFR and CD274 (PD-L1) in the group of ZFAS1 low-expressing patients. EGFR and PD-L1 are well-known targets for immunotherapy in HNSCC patients [4]. Accordingly, the patients with low expression of ZFAS1 might benefit from anti-EGFR (e.g., cetuximab) and anti-PDL1 (e.g., atezolizumab) therapy.
The direct regulation mechanism of mRNAs by lncRNA ZFAS1 remains unknown. However, some previous reports have indicated that ZFAS1 can act as a molecular sponge and reduce the abundance of miRNAs, such as miR-9, miR-150, miR-484 or miR-200b/c, and reduce their activity in the cell and have an indirect influence on mRNAs [47]. We analyzed this possible mechanism and indicated that, indeed, a sequence of ZFAS1 possesses the binding site for miR-150-5p. Moreover, the negative correlation between ZFAS1 and miR-150-5p was observed in HNSCC patients. Next, we checked if, in the group of genes associated with ZFAS1, any targets for miR-150-5p are present. We found nine potential mRNAs targets, CPEB4, GAB1, ARHGEF10L, KALRN, DSP, IL13RA1, EIF4E, UQCR11, and MET. Only UQCR11 and EIF4E were significantly down-regulated in the group of patients with high level of miR-150-5p and low ZFAS1, which supports our assumption of direct regulation by miR-150-5p. There is no association between the UQCR11 (ubiquinol-cytochrome c reductase, complex III sub-unit XI) gene and cancer. However, the second gene, eukaryotic translation initiation factor 4E (EIF4E), is activated in cancers [49] and is required for translation of some mRNAs involved in proliferation and survival [50], as well as in EMT process and cancer invasion [51,52]. The phosphorylation of EIF4E is very frequently observed in HNSCC [49]. Moreover, EIF4E is up-regulated in surgical margins of HNSCC patients with local recurrence and could serve as a prognostic biomarker [53]. DeFatta et al. indicated that the FaDu cell line displays a high EIF4E protein level and that this is similar to the level observed in patients. Knock-down of EIF4E results in suppression of the tumorigenic and angiogenic properties of the FaDu cell line manifested by loss of capacity to grow in soft agar, reduced expression of angiogenic factors (FGF-2 and VGF), and loss of tumor growth in nude mice [54]. The FaDu cell line has the highest ZFAS1 level among HNSCC cell lines, and our results suggest that ZFAS1 reduced the level of suppressor miR-150-5p and maintained a high level of EIF4E. It seems likely that the oncogenic EIF4E, in turn, up-regulates expression of some genes associated with EMT metastasis and could result in poor patient outcome (Figure 6). However, the above hypothesis needs to be further verified by in vitro and in vivo analysis of ZFAS1 function in HNSCC.

Author Contributions

Authors’ individual contributions: conceptualization T.K. and K.L.; methodology, T.K.; investigation, T.K., K.G., M.K.; data curation, T.K., K.G., M.K.; writing—original draft preparation, T.K.; writing—review and editing, T.K., A.T., R.B., J.M., A.M.; visualization, T.K., K.G., M.K.; supervision, A.M., K.L., J.M.; funding acquisition, K.L., J.M.; M.K. and K.G. have contributed equally to this work.

Funding

This work was supported by Greater Poland Cancer Centre - grant no.: 13/2016 (128) and supported by the National Science Centre, Poland, allocated on the basis of decision no.: 2016/21/B/NZ7/01773.

Acknowledgments

This work was supported by Greater Poland Cancer Centre – grant no.: 13/2016 (128) and supported by the National Science Centre, Poland, allocated on the basis of decision no.: 2016/21/B/NZ7/01773. Language correction was made by American Manuscript Editors company (https://americanmanuscripteditors.com).

Conflicts of Interest

The authors declare that there is no conflict of interest regarding the publication of this paper.

Abbreviations

HNSCChead and neck squamous cell carcinoma
lncRNAlong non-coding RNA
qRT-PCRquantitative reverse transcriptase PCR
TCGAThe Cancer Genome Atlas
EMTepithelial-to-mesenchymal transition
HPVhuman papillomavirus
PCRpolymerase chain reaction
B2Mbeta-2 microglobulin
DFSdisease free survival
OSoverall survival
HRHazard Ratio
CIConfidence Interval
SEMstandard error of the mean

References

  1. Cohen, N.; Fedewa, S.; Chen, A.Y. Epidemiology and Demographics of the Head and Neck Cancer Population. Oral Maxillofac. Surg. Clin. N. Am. 2018, 30, 381–395. [Google Scholar] [CrossRef] [PubMed]
  2. Jou, A.; Hess, J. Epidemiology and Molecular Biology of Head and Neck Cancer. Oncol. Res. Treat. 2017, 40, 328–332. [Google Scholar] [CrossRef] [PubMed]
  3. Kolenda, T.; Przybyła, W.; Kapałczyńska, M.; Teresiak, A.; Zajaczkowska, M.; Blizniak, R.; Lamperska, K.M. Tumor microenvironment—Unknown niche with powerful therapeutic potentials. Rep. Pract. Oncol. Radiother. 2018, 23, 143–153. [Google Scholar] [CrossRef] [PubMed]
  4. Lasinska, I.; Kolenda, T.; Teresiak, A.; Lamperska, K.M.; Galus, L.; Mackiewicz, J. Immunotherapy in Patients with Recurrent and Metastatic Squamous Cell Carcinoma of the Head and Neck. Anticancer Agents Med. Chem. 2018, in press. [Google Scholar] [CrossRef]
  5. Zhao, G.; Fu, Y.; Su, Z.; Wu, R. How long-non coding RNAs and MicroRNAs mediate the endogenous RNA network of Head and Neck Squamous Cell Carcinoma: A comprehensive analysis. Cell Physiol. Biochem. 2018, 50, 332–341. [Google Scholar] [CrossRef]
  6. Lamperska, K.; Kozlowski, P.; Kolenda, T.; Teresiak, A.; Blizniak, R.; Przybyła, W.; Masternak, M.M.; Golusinski, P.; Golusinski, W. Unpredictable changes of selected miRNA in expression profile of HNSCC. Cancer Biomark. 2016, 16, 55–64. [Google Scholar] [CrossRef] [PubMed]
  7. Kolenda, T.; Guglas, K.; Ryś, M.; Bogaczyńska, M.; Łasińska, I.; Mackiewicz, J. Biological role of long non-coding RNA in head and neck cancers. Rep. Pract. Oncol. Radiother. 2017, 22, 378–388. [Google Scholar] [CrossRef] [PubMed]
  8. Guglas, K.; Bogaczyńska, M.; Kolenda, T.; Ryś, M.; Teresiak, A.; Bliźniak, R.; Łasińska, I.; Mackiewicz, J.; Lamperska, K. lncRNA in HNSCC: Challenges and potential. Contemp. Oncol. (Pozn). 2017, 21, 259–266. [Google Scholar] [CrossRef]
  9. Fatima, F.; Nawaz, M. Vesiculated Long Non-Coding RNAs: Offshore Packages Deciphering Trans-Regulation between Cells, Cancer Progression and Resistance to Therapies. Non-Coding RNA 2017, 3, 10. [Google Scholar] [CrossRef]
  10. Askarian-Amiri, M.E.; Crawford, J.; French, J.D.; Smart, C.E.; Smith, M.A.; Clark, M.B.; Ru, K.; Mercer, T.R.; Thompson, E.R.; Lakhani, S.R.; et al. Snord-host rna ZFAS1 is a regulator of mammary development and a potential marker for breast cancer. RNA 2011, 17, 878–891. [Google Scholar] [CrossRef] [PubMed]
  11. Gao, K.; Ji, Z.; She, K.; Yang, Q.; Shao, L. Long non-coding RNA ZFAS1 is an unfavourable prognostic factor and promotes glioma cell progression by activation of the Notch signaling pathway. Biomed. Pharmacother. 2017, 87, 555–560. [Google Scholar] [CrossRef] [PubMed]
  12. Lv, Q.L.; Chen, S.H.; Zhang, X.; Sun, B.; Hu, L.; Qu, Q.; Huang, Y.T.; Wang, G.H.; Liu, Y.L.; Zhang, Y.Y.; et al. Upregulation of long noncoding RNA zinc finger antisense 1 enhances epithelial–mesenchymal transition in vitro and predicts poor prognosis in glioma. Tumour Biol. 2017, 39. [Google Scholar] [CrossRef] [Green Version]
  13. Lee, J.; Park, H.Y.; Kim, W.W.; Lee, S.J.; Jeong, J.H.; Kang, S.H.; Jung, J.H.; Chae, Y.S. Biological function of long noncoding RNA snaR in Her2-positive breast cancer cells. Tumour Biol. 2017, 39. [Google Scholar] [CrossRef] [PubMed]
  14. Fan, S.; Fan, C.; Liu, N.; Huang, K.; Fang, X.; Wang, K. Down regulation of the long non-coding RNA ZFAS1 is associated with cell proliferation, migration and invasion in breast cancer. Mol. Med. Rep. 2018, 17, 6405–6412. [Google Scholar]
  15. Zhou, H.; Wang, F.; Chen, H.; Tan, Q.; Qiu, S.; Chen, S.; Jing, W.; Yu, M.; Liang, C.; Ye, S.; et al. Increased expression of long-noncoding rna ZFAS1 is associated with epithelial–mesenchymal transition of gastric cancer. Aging (Albany NY). 2016, 8, 2023–2038. [Google Scholar]
  16. Nie, F.; Yu, X.; Huang, M.; Wang, Y.; Xie, M.; Ma, H.; Wang, Z.; De, W.; Sun, M. Long noncoding rna ZFAS1 promotes gastric cancer cells proliferation by epigenetically repressing klf2 and nkd2 expression. Oncotarget 2017, 8, 38227–38238. [Google Scholar] [CrossRef] [PubMed]
  17. Pan, L.; Liang, W.; Fu, M.; Huang, Z.H.; Li, X.; Zhang, W.; Zhang, P.; Qian, H.; Jiang, P.C.; Xu, W.R.; et al. Exosomes-mediated transfer of long noncoding rna ZFAS1 promotes gastric cancer progression. J. Cancer Res. Clin. Oncol. 2017, 143, 991–1004. [Google Scholar] [CrossRef]
  18. Thorenoor, N.; Faltejskova-Vychytilova, P.; Hombach, S.; Mlcochova, J.; Kretz, M.; Svoboda, M.; Slaby, O. Long non-coding rna ZFAS1 interacts with cdk1 and is involved in p53-dependent cell cycle control and apoptosis in colorectal cancer. Oncotarget 2016, 7, 622–637. [Google Scholar] [CrossRef]
  19. Wang, W.; Xing, C. Upregulation of long noncoding rna ZFAS1 predicts poor prognosis and prompts invasion and metastasis in colorectal cancer. Pathol. Res. Pract. 2016, 212, 690–695. [Google Scholar] [CrossRef]
  20. Xie, S.; Quanxing, G.; Wang, X.; Sun, X.; Kang, Y. Long non-coding RNA ZFAS1 sponges miR-484 to promote cell proliferation and invasion in colorectal cancer. Cell Cycle 2018, 17, 154–161. [Google Scholar] [CrossRef]
  21. Fang, C.; Zan, J.; Yue, B.; Liu, C.; He, C.; Yan, D. Long non-coding ribonucleic acid zinc finger antisense 1 promotes the progression of colonic cancer by modulating zeb1 expression. J. Gastroenterol. Hepatol. 2017, 32, 1204–1211. [Google Scholar] [CrossRef] [PubMed]
  22. Li, T.; Xie, J.; Shen, C.; Cheng, D.; Shi, Y.; Wu, Z.; Deng, X.; Chen, H.; Shen, B.; Peng, C.; et al. Amplification of long noncoding rna ZFAS1 promotes metastasis in Hepatocellular carcinoma. Cancer Res. 2015, 75, 3181–3191. [Google Scholar] [CrossRef]
  23. Xia, B.; Hou, Y.; Chen, H.; Yang, S.; Liu, T.; Lin, M.; Lou, G. Long non-coding rna ZFAS1 interacts with mir-150-5p to regulate sp1 expression and ovarian cancer cell malignancy. Oncotarget 2017, 8, 19534–19546. [Google Scholar] [PubMed]
  24. Liu, R.; Zeng, Y.; Zhou, C.F.; Wang, Y.; Li, X.; Liu, Z.Q.; Chen, X.P.; Zhang, W.; Zhou, H.H. Long noncoding rna expression signature to predict platinum-based chemotherapeutic sensitivity of ovarian cancer patients. Sci. Rep. 2017, 7, 18. [Google Scholar] [CrossRef]
  25. Wei, Y.H.; Fu, Y.; Luo, H.J.; Li, R.; Li, H.Y.; Zhang, Z.; Zhu, Y.H.; Gao, Y.; Liu, X.L. Higher expression of ZFAS1 is associated with poor prognosis in malignant melanoma and promotes cell proliferation and invasion. Int.J. Clin. Exp. Pathol. 2017, 10, 4640–4646. [Google Scholar]
  26. Tian, F.M.; Meng, F.Q.; Wang, X.B. Overexpression of long-noncoding rna ZFAS1 decreases survival in human NSCLC patients. Eur. Rev. Med. Pharmacol. Sci. 2016, 20, 5126–5131. [Google Scholar] [PubMed]
  27. Liu, G.; Wang, L.; Han, H.; Li, Y.; Lu, S.; Li, T.; Cheng, C. Lncrna ZFAS1 promotes growth and metastasis by regulating bmi1 and zeb2 in osteosarcoma. Am. J. Cancer Res. 2017, 7, 1450–1462. [Google Scholar]
  28. Shi, H.; Liu, Z.; Pei, D.; Jiang, Y.; Zhu, H.; Chen, B. Development and validation of nomogram based on lncrna ZFAS1 for predicting survival in lymph node-negative esophageal squamous cell carcinoma patients. Oncotarget 2017, 8, 59048–59057. [Google Scholar] [CrossRef]
  29. Guo, H.; Wu, L.; Zhao, P.; Feng, A. Overexpression of long non-coding rna zinc finger antisense 1 in acute myeloid leukemia cell lines influences cell growth and apoptosis. Exp. Ther. Med. 2017, 14, 647–651. [Google Scholar] [CrossRef] [PubMed]
  30. Baytak, E.; Gong, Q.; Akman, B.; Yuan, H.; Chan, W.C.; Kucuk, C. Whole transcriptome analysis reveals dysregulated oncogenic lncRNAs in natural killer/t-cell lymphoma and establishes mir155hg as a target of prdm1. Tumour Biol. 2017, 39. [Google Scholar] [CrossRef]
  31. Wang, T.; Ma, S.; Qi, X.; Tang, X.; Cui, D.; Wang, Z.; Chi, J.; Li, P.; Zhai, B. Long noncoding rna znfx1-as1 suppresses growth of Hepatocellular carcinoma cells by regulating the methylation of mir-9. OncoTargets Ther. 2016, 9, 5005–5014. [Google Scholar]
  32. Lamperska, K.; Kolenda, T.; Teresiak, A.; Kowalik, A.; Kruszyna-Mochalska, M.; Jackowiak, W.; Blizniak, R.; Przybyła, W.; Kapałczyńska, M.; Kozłowski, P. Different levels of let-7d expression modulate response of FaDu cells to irradiation and chemotherapeutics. PLoS ONE 2017, 12, e0180265. [Google Scholar] [CrossRef]
  33. Feng, L.L.; Shen, F.R.; Zhou, J.H.; Chen, Y.G. Expression of the lncRNA ZFAS1 in cervical cancer and its correlation with prognosis and chemosensitivity. Gene 2019, 696, 105–112. [Google Scholar] [CrossRef] [PubMed]
  34. Gao, J.; Aksoy, B.A.; Dogrusoz, U.; Dresdner, G.; Gross, B.; Sumer, S.O.; Sun, Y.; Jacobsen, A.; Sinha, R.; Larsson, E.; et al. Integrative Analysis of Complex Cancer Genomics and Clinical Profiles Using the cBioPortal. Sci. Signal. 2013, 6, pl1. [Google Scholar] [CrossRef]
  35. Chandrashekar, D.S.; Bashel, B.; Balasubramanya, S.A.H.; Creighton, C.J.; Ponce-Rodriguez, I.; Chakravarthi, B.V.S.K.; Varambally, S. UALCAN: A Portal for Facilitating Tumor Subgroup Gene Expression and Survival Analyses. Neoplasia 2017, 19, 649–658. [Google Scholar] [CrossRef]
  36. Li, J.H.; Liu, S.; Zhou, H.; Qu, L.H.; Yang, J.H. starBase v2.0: Decoding miRNA-ceRNA, miRNA-ncRNA and protein-RNA interaction networksfrom large-scale CLIP-Seq data. Nucleic Acids Res. 2014, 42, D92–D97. [Google Scholar] [CrossRef]
  37. Mi, H.; Muruganujan, A.; Casagrande, J.T.; Thomas, P.D. Large-scale gene function analysis with the PANTHER classification system. Nat. Protoc. 2013, 8, 1551–1566. [Google Scholar] [CrossRef] [PubMed]
  38. Xiao, M.; Liu, L.; Zhang, S.; Yang, X.; Wang, Y. Cancer stem cell biomarkers for head and neck squamous cell carcinoma: A bioinformatic analysis. Oncol. Rep. 2018, 40, 3843–3851. [Google Scholar] [CrossRef] [PubMed]
  39. Natarajan, J.; Chandrashekar, C.; Radhakrishnan, R. Critical biomarkers of epithelial-mesenchymal transition in the head and neck cancers. J. Cancer Res. Ther. 2014, 10, 512–518. [Google Scholar] [PubMed]
  40. Paczkowska, J.; Szyfter, K.; Giefing, M.; Wierzbicka, M. Genetic signature and profiling of head and neck cancer: Where do we stand? Curr. Opin. Otolaryngol. Head Neck Surg. 2017, 25, 154–158. [Google Scholar] [CrossRef]
  41. Rodrigo, J.P.; Martínez, P.; Allonca, E.; Alonso-Durán, L.; Suárez, C.; Astudillo, A.; García-Pedrero, J.M. Immunohistochemical markers of distant metastasis in laryngeal and hypopharyngeal squamous cell carcinomas. Clin. Exp. Metastasis 2014, 31, 317–325. [Google Scholar] [CrossRef] [PubMed]
  42. Fan, Z.; Li, M.; Chen, X.; Wang, J.; Liang, X.; Wang, H.; Wang, Z.; Cheng, B.; Xia, J. Prognostic Value of Cancer Stem Cell Markers in Head and Neck Squamous Cell Carcinoma: A Meta-analysis. Sci. Rep. 2017, 7, 43008. [Google Scholar] [CrossRef]
  43. Dahiya, K.; Dhankhar, R. Updated overview of current biomarkers in head and neck carcinoma. World J. Methodol. 2016, 6, 77–86. [Google Scholar] [CrossRef] [PubMed]
  44. Agarwal, V.; Bell, G.W.; Nam, JW.; Bartel, D.P. Predicting effective microRNA target sites in mammalian mRNAs. Life 2015, 4, e05005. [Google Scholar] [CrossRef]
  45. Wong, N.; Wang, X. miRDB: An online resource for microRNA target prediction and functional annotations. Nucleic Acids Res. 2014, 43, D146–D152. [Google Scholar] [CrossRef]
  46. Vlachos, I.S.; Paraskevopoulou, M.D.; Karagkouni, D.; Georgakilas, G.; Vergoulis, T.; Kanellos, I.; Anastasopoulos, I.-L.; Maniou, S.; Karathanou, K.; Fevgas, D.K.A.; et al. DIANA-TarBase v7.0: Indexing more than half a million experimentally supported miRNA:mRNA interactions. Nucleic Acids Res. 2014, 43, D153–D159. [Google Scholar] [CrossRef]
  47. Dong, D.; Mu, Z.; Zhao, C.; Sun, M. ZFAS1: A novel tumor-related long non-coding RNA. Cancer Cell Int. 2018, 18, 125. [Google Scholar] [CrossRef]
  48. Wirth, M.; Jira, D.; Ott, A.; Piontek, G.; Pickhard, A. High NOTCH1 mRNA Expression Is Associated with Better Survival in HNSCC. Int. J. Mol. Sci. 2018, 19, 830. [Google Scholar] [CrossRef] [PubMed]
  49. Fan, S.; Ramalingam, S.S.; Kauh, J.; Xu, Z.; Khuri, F.R.; Sun, S. Phosphorylated eukaryotic translation initiation factor 4 (eIF4E) is elevated in human cancer tissues. Cancer Biol. Ther. 2009, 8, 1463–1469. [Google Scholar] [CrossRef] [Green Version]
  50. Siddiqui, N.; Sonenberg, N. Signalling to eIF4E in cancer. Biochem. Soc. Trans. 2015, 43, 763–772. [Google Scholar] [CrossRef] [PubMed] [Green Version]
  51. Pettersson, F.; Del Rincon, S.V.; Emond, A.; Huor, B.; Ngan, E.; Ng, J.; Dobocan, M.C.; Siegel, P.M.; Miller, W.H., Jr. Genetic and pharmacologic inhibition of eIF4E reduces breast cancer cell migration, invasion, and metastasis. Cancer Res. 2015, 75, 1102–1112. [Google Scholar] [CrossRef]
  52. Robichaud, N.; del Rincon, S.V.; Huor, B.; Alain, T.; Petruccelli, L.A.; Hearnden, J.; Goncalves, C.; Grotegut, S.; Spruck, C.H.; Furic, L.; et al. Phosphorylation of eIF4E promotes EMT and metastasis via translational control of SNAIL and MMP-3. Oncogene 2014, 34, 2032–2042. [Google Scholar] [CrossRef] [PubMed] [Green Version]
  53. Singh, J.; Jayaraj, R.; Baxi, S.; Mileva, M.; Skinner, J.; Dhand, N.K.; Thomas, M. Immunohistochemical expression levels of p53 and eIF4E markers in histologically negative surgical margins, and their association with the clinical outcome of patients with head and neck squamous cell carcinoma. Mol. Clin. Oncol. 2015, 4, 166–172. [Google Scholar] [CrossRef] [PubMed] [Green Version]
  54. DeFatta, R.J.; Nathan, C.O.; De Benedetti, A. Antisense RNA to eIF4E suppresses oncogenic properties of a head and neck squamous cell carcinoma cell line. Laryngoscope 2000, 110, 928–933. [Google Scholar] [CrossRef] [PubMed]
Figure 1. (A) Microscopic pictures of dysplastic oral keratinocyte (DOK), SCC-25, SCC-040, and FaDu cell lines, magnification 20×; (B) the capacity of spheres forming and (C) expression level of ZFAS1 lncRNA presented as mean with SEM; one-way ANOVA; ** p < 0.01, *** p < 0.001.
Cells 08 00366 g001
Figure 2. The expression level of ZFAS1 in head and neck squamous cell carcinoma (HNSCC) patients. (A) Expression in normal (n = 44) and cancer (n = 520) tissues; (B) Expression depending on HNSCC localization (n = 520); Graphs from UALCAN database, modified; Un-paired T-test; the graphs show mean of value presented as transcripts per million; and box and whiskers with 5–95 percentile, one-way ANOVA obtained using Dunn’s multiple comparisons tests; ns—no significant, **** p < 0.0001.
Cells 08 00366 g002
Figure 3. Disease-free survival (DFS) and overall survival (OS) in HNSCC patients with low (n = 130) and high (n = 130) expression levels of ZFAS1; a—Log-rank (Mantel-Cox) test, b—Gehan-Breslow-Wilcoxon test; p < 0.05 considered as significant.
Cells 08 00366 g003
Figure 4. The expression level of ZNFX1 in HNSCC patients. (A) Correlation between ZNFX1 and ZFAS1 in HNSCC patients; Graph from StarBase v3.0 database, modified; (B) Expression in normal (n = 44) and cancer (n = 520) tissues; **** p < 0.0001; (C) Expression of ZNFX1 in cancer samples (n = 520); (D) Expression depending on HNSCC localization (n = 520); Graphs from UALCAN database, modified; Un-paired T-test; the graphs show mean of value presented as transcripts per million; and box and whiskers with 5–95 percentile, one-way ANOVA obtained using Dunn’s multiple comparisons tests; ns—no significant, *** p < 0.001; (E) DFS and OS in HNSCC patients with low (n = 130) and high (n = 130) expression levels of ZNFX1; a—Log-rank (Mantel-Cox) test, b—Gehan-Breslow-Wilcoxon test; p < 0.05 considered as significant.
Cells 08 00366 g004
Figure 5. ZFAS1 regulation of miR-150-5p and its targets. (A) Possible interaction between lncRNA ZFAS1 and miR-150-5p sequences and co-expression of ZFAS1 and miR-150-5p in HNSCC patients; from StarBase v3.0 database. (B) Predicted miR-150-5p targets and position of regulation in their mRNA sequences. (C) The division to the groups of HNSCC patients: (i) with high level of miR-150-5p (n = 30) and low ZFAS1, and opposite (ii) with a low level of miR-150-5p and high ZFAS1 (n = 30); from StarBase v3.0 database. (D) The expression level of the predicted miR-150-5p targets in groups of patients (n = 60) with different expression levels of ZFAS1 and miR-150-5p; expression level presented as mean with SEM; un-paired T-test; ns – no significant, *** p < 0.001, **** p < 0.0001.
Cells 08 00366 g005
Figure 6. The proposed mechanism of the oncogenic role of lncRNA ZFAS1 in HNSCC. ZFAS1 acts as a molecular sponge and down-regulates abundance of miR-150-5p. The low level of suppressor miR-150-5p causes up-regulation of oncogenic targets such as EIF4E, which in turn up-regulates expression of genes connected with EMT, metastasis and poor patient outcome.
Cells 08 00366 g006
Table 1. The expression levels of ZFAS1 are dependent on clinicopathological parameters in all localizations of head and neck squamous cell carcinoma (HNSCC). T-test; p < 0.05 considered as significant.
ParameterGroupMean ± SEMP-val
Age<61.50.05596 ± 0.07434 N = 280
>61.50.09350 ± 0.06536 N = 2400.2296
GenderFemale−0.1504 ± 0.05728 N = 137
Male0.1511 ± 0.06425 N = 3840.0923
AlcoholPositive0.09964 ± 0.06692 N = 348
Negative−0.002307 ± 0.07054 N = 1620.8429
SmokingNo/Ex0.002190 ± 0.05292 N = 334
Yes0.1925 ± 0.1063 N = 1770.1634
Cancer StageI + II−0.1802 ± 0.07576 N = 98
III + IV0.1760 ± 0.06747 N = 3480.0091
T StageT1 + T2−0.002843 ± 0.09133 N = 185
T3 + T40.1698 ± 0.06775 N = 2740.0169
N StageN0 + N10.01680 ± 0.06265 N = 327
N2 + N30.09821 ± 0.08352 N = 1720.5544
GradeG1 + G20.01891 ± 0.05334 N = 367
G3 + G40.2433 ± 0.1274 N = 1320.0891
Perineural InvasionPositive0.09063 ± 0.07960 N = 168
Negative0.1079 ± 0.09359 N = 1950.8824
Lymph Node Neck DissectionPositive0.1145 ± 0.05814 N = 421
Negative−0.1111 ± 0.08960 N = 970.0667
Angiolymphatic InvasionPositive0.1644 ± 0.1395 N = 124
Negative0.03061 ± 0.05976 N = 2250.5053
HPV p16 statusNegative−0.1243 ± 0.1195 N = 72
Positive0.3604 ± 0.3343 N = 390.1090
Table 2. Classification of the genes positively and negatively correlated with ZFAS1 expression (Pearson correlation >+0.3 or <−0.3, respectively) in HNSCC patients into specific biological processes and cellular pathways based on the PANTHER database.
Positively Correlated with ZFAS1
ProcessGenes
Cell cycle (GO:0007049/P00013)MAD2L2, C10orf2, MND1, ANAPC11, S100A13, NAP1L1, POLL, RPA3, EIF3F
Cell adhesion (GO:0007155)ITGAE
Signal transduction (GO:0007165)RWDD3, ARL3, CNPY2, RPS3, RAE1, C14orf153, ARL16, SSR2, IFI27L1
Death (GO:0016265)NME2P1, RPS3, ANP32B, NME2, NAP1L1, C14orf153, IFI27L1, NME1
Response to stimulus (GO:0050896)RWDD3, C6orf154, PARK7, CNPY2, RPS3, C12orf44, C9orf119, C14orf153, SSR2, IFI27L1, POLR2I
Apoptosis signaling pathway (P00006)ATF4, DIABLO
FAS signaling pathway (P00020)CYC1
Integrin signaling pathway (P00034)ITGAE
mRNA splicing (P00058)SNRPB2, SNRPA
Negatively Correlated with ZFAS1
ProcessGenes
Cell adhesion (GO:0007155)CELSR2, ADAP2
Signal transduction (GO:0007165)BMP2K, MAPK3, ARHGAP32, TOM1L2, SASH1, RAB10, TOM1, CTNND1, SNRK, RHBDF2, PKP1, RASAL1, CASP10, PPP1R9B, ADAP2, DOCK9, GAB1, KALRN, PDPK1, MAST4, HTT
Cell differentiation (GO:0030154)PPARD, CYFIP1, PPP1R9B, TMOD3
Death (GO:0016265)CASP10
Response to stimulus (GO:0050896)BMP2K, MAPK3, ARHGAP32, SASH1, RAB10, IL13RA1, CTNND1, SNRK, RHBDF2, PPARD, PKP1, CYFIP1, RASAL1, IL4R, CASP10, SLC30A4, PPP1R9B, MAPK3, GAB1, KALRN, PDPK1, MAST4
Angiogenesis (P00005)MAPK3, JAK1
Apoptosis signaling pathway (P00006)IGF2R, CASP10, MAPK3
Cadherin signaling pathway (P00012)CTNND1, CELSR2
EGF receptor signaling pathway (P00018)RASAL1, MAPK3, GAB1
Endothelial signaling pathway (P00019)FURIN, MAPK3
FAS signaling pathway (P00020)CASP10
FGF signaling pathway (P00021)RASAL1, MAPK3
Insulin/IGF pathway-mitogen activated protein kinase kinase/MAP kinase cascade (P00032)IGF2R, MAPK3, PDPK1
Integrin signalling pathway (P00034)/TGF-beta signaling pathway (P00052)/VEGF signaling pathway (P00056)MAPK3
Interleukin signaling pathway (P00036)IL13RA1, IL4R, MAPK3, PDPK1
JAK/STAT signaling pathway (P00038)JAK1
Oxidative stress response (P00046)DUSP18
PDGF signaling pathway (P00047)RASAL1, JAK1, MAPK3, GAB1, PDPK1
PI3 kinase pathway (P00048)/p53 pathway feedback loops 2 (P04398)PDPK1
Ras Pathway (P04393)MAPK3, PDPK1
Toll receptor signaling pathway (P00054)MYD88, MAPK3
Wnt signaling pathway (P00057)CELSR2, PPARD
p38 MAPK pathway (P05918)MAPK3, TAB2
p53 pathway (P00059)KAT2B, PDPK1
Table 3. The expression levels of ZNFX1 are dependent on clinicopathological parameters in all localizations of HNSCC. T-test; p < 0.05 considered as significant.
ParameterGroupMean ± SEMP-val
Age<61.50.06453 ± 0.06357 N = 280
>61.50.1444 ± 0.07727 N = 2400.7490
GenderFemale0.3651 ± 0.1037 N = 137
Male0.009726 ± 0.05510 N = 3840.0004
AlcoholPositive0.07041 ± 0.05853 N = 348
Negative0.1828 ± 0.09533 N = 1620.4850
SmokingNo/Ex0.2099 ± 0.06822 N = 334
Yes−0.1030 ± 0.06162 N = 1770.0614
Cancer StageI + II0.5139 ± 0.1312 N = 98
III + IV0.03312 ± 0.05857 N = 348<0.0001
T StageT1 + T20.2607 ± 0.08801 N = 185
T3 + T40.04948 ± 0.06795 N = 2740.0240
N StageN0 + N10.1589 ± 0.06431 N = 327
N2 + N3−0.03349 ± 0.07555 N = 1720.0898
GradeG1 + G20.1542 ± 0.05590 N = 367
G3 + G40.03624 ± 0.1150 N = 1320.0158
Perineural InvasionPositive0.3096 ± 0.09042 N = 168
Negative−0.03063 ± 0.07312 N = 1950.0022
Lymph Node Neck DissectionPositive0.08454 ± 0.05560 N = 421
Negative0.1518 ± 0.1051 N = 970.2833
Angiolymphatic InvasionPositive−0.0378 ± 0.08767 N = 124
Negative0.2003 ± 0.07913 N = 2250.0791
HPV p16 statusNegative0.2192 ± 0.1358 N = 72
Positive−0.3231 ± 0.1469 N = 390.0086
Table 4. Differentially expressed genes connected with the EMT process, the metastasis process, and cancer-initiating cell maintenance in the group of patients with low and high expression of ZFAS1; p < 0.05 considered as significant.
GeneZFAS1 LowZFAS1 HighP-val
Mean ± SEMMean ± SEM
POU5F1−0.1129 ± 0.073640.2302 ± 0.13690.1369
CD440.3144 ± 0.1627−0.2309 ± 0.095150.007
MET0.2658 ± 0.2658−0.2342 ± 0.081130.0002
NOTCH10.3202 ± 0.119−0.1167 ± 0.1057<0.0001
MME0.04295 ± 0.09562−0.05979 ± 0.032380.013
BMI10.05728 ± 0.0754−0.1872 ± 0.091010.0119
CDH110.2674 ± 0.0987−0.2047 ± 0.06785<0.0001
CTNNB1−0.2204 ± 0.06578−0.5712 ± 0.08014<0.0001
SMAD2−0.04951 ± 0.1148−0.5928 ± 0.11160.0005
CXCR40.02447 ± 0.062660.05141 ± 0.11260.007
MMP30.03104 ± 0.07116−0.1548 ± 0.060010.0179
CXCR20.052 ± 0.07529−0.3646 ± 0.03099<0.0001
SMAD30.05268 ± 0.08117−0.149 ± 0.12020.001
MMP90.11 ± 0.07690.1212 ± 0.12970.0182
MMP80.1216 ± 0.1174−0.07822 ± 0.02920.0278
NUAK10.122 ± 0.07912−0.0688 ± 0.094960.0003
LEF10.1263 ± 0.064210.1775 ± 0.12330.0453
VIM0.1266 ± 0.07970.04328 ± 0.11930.0069
NFKB10.1475 ± 0.08634−0.5829 ± 0.0967<0.0001
CDH10.1571 ± 0.1007−0.4887 ± 0.07985<0.0001
CCR70.1597 ± 0.08847−0.08974 ± 0.1232<0.0001
DSP0.1695 ± 0.09073−0.5766 ± 0.05892<0.0001
MMP20.1806 ± 0.0956−0.1522 ± 0.08578<0.0001
RPS6KB10.2459 ± 0.0791−0.2194 ± 0.1326<0.0001
COL1A10.2989 ± 0.1166−0.04641 ± 0.1686<0.0001
ETS10.3457 ± 0.1039−0.4395 ± 0.06999<0.0001
DNMT3B0.3723 ± 0.1346−0.06854 ± 0.069410.0397
COL4A10.4047 ± 0.1015−0.3437 ± 0.06195<0.0001
TJP10.4241 ± 0.08394−0.8134 ± 0.05945<0.0001
CTNND10.4876 ± 0.08717−0.6306 ± 0.07966<0.0001
CD2740.4998 ± 0.2477−0.1627 ± 0.1442<0.0001
PTK20.9937 ± 0.11340.7089 ± 0.14790.0146
EGFR1.746 ± 0.4340.09098 ± 0.1739<0.0001
SLC3A2−0.2395 ± 0.084640.2994 ± 0.08896<0.0001
EPCAM−0.03831 ± 0.071230.4533 ± 0.13580.0023
TAZ−0.2428 ± 0.065410.9798 ± 0.135<0.0001
JMJD6−0.2956 ± 0.059520.7102 ± 0.127<0.0001
ABCG2−0.02039 ± 0.035980.04807 ± 0.1264<0.0001
ABCG5−0.05742 ± 0.093030.4499 ± 0.1921<0.0001
HSPA5−0.02533 ± 0.086210.3028 ± 0.10660.0248
S100A4−0.1642 ± 0.071360.6315 ± 0.18020.0002
EIF4E−0.4339 ± 0.07892−0.03224 ± 0.10980.0053
ANXA2−0.3988 ± 0.065290.4008 ± 0.119<0.0001
ILK−0.2853 ± 0.066270.3292 ± 0.13280.0007
GSK3A−0.2842 ± 0.097020.06703 ± 0.11890.0187
TRIM28−0.2113 ± 0.099740.7619 ± 0.1348<0.0001
COL2A1−0.1365 ± 0.081250.4195 ± 0.21560.002
FN1−0.005116 ± 0.05450.04132 ± 0.1179<0.0001

