A Novel 3D Scaffold for Cell Growth to Assess Electroporation Efficacy

 ,
,  ,
, 

 , , ,
, , ,  and
and 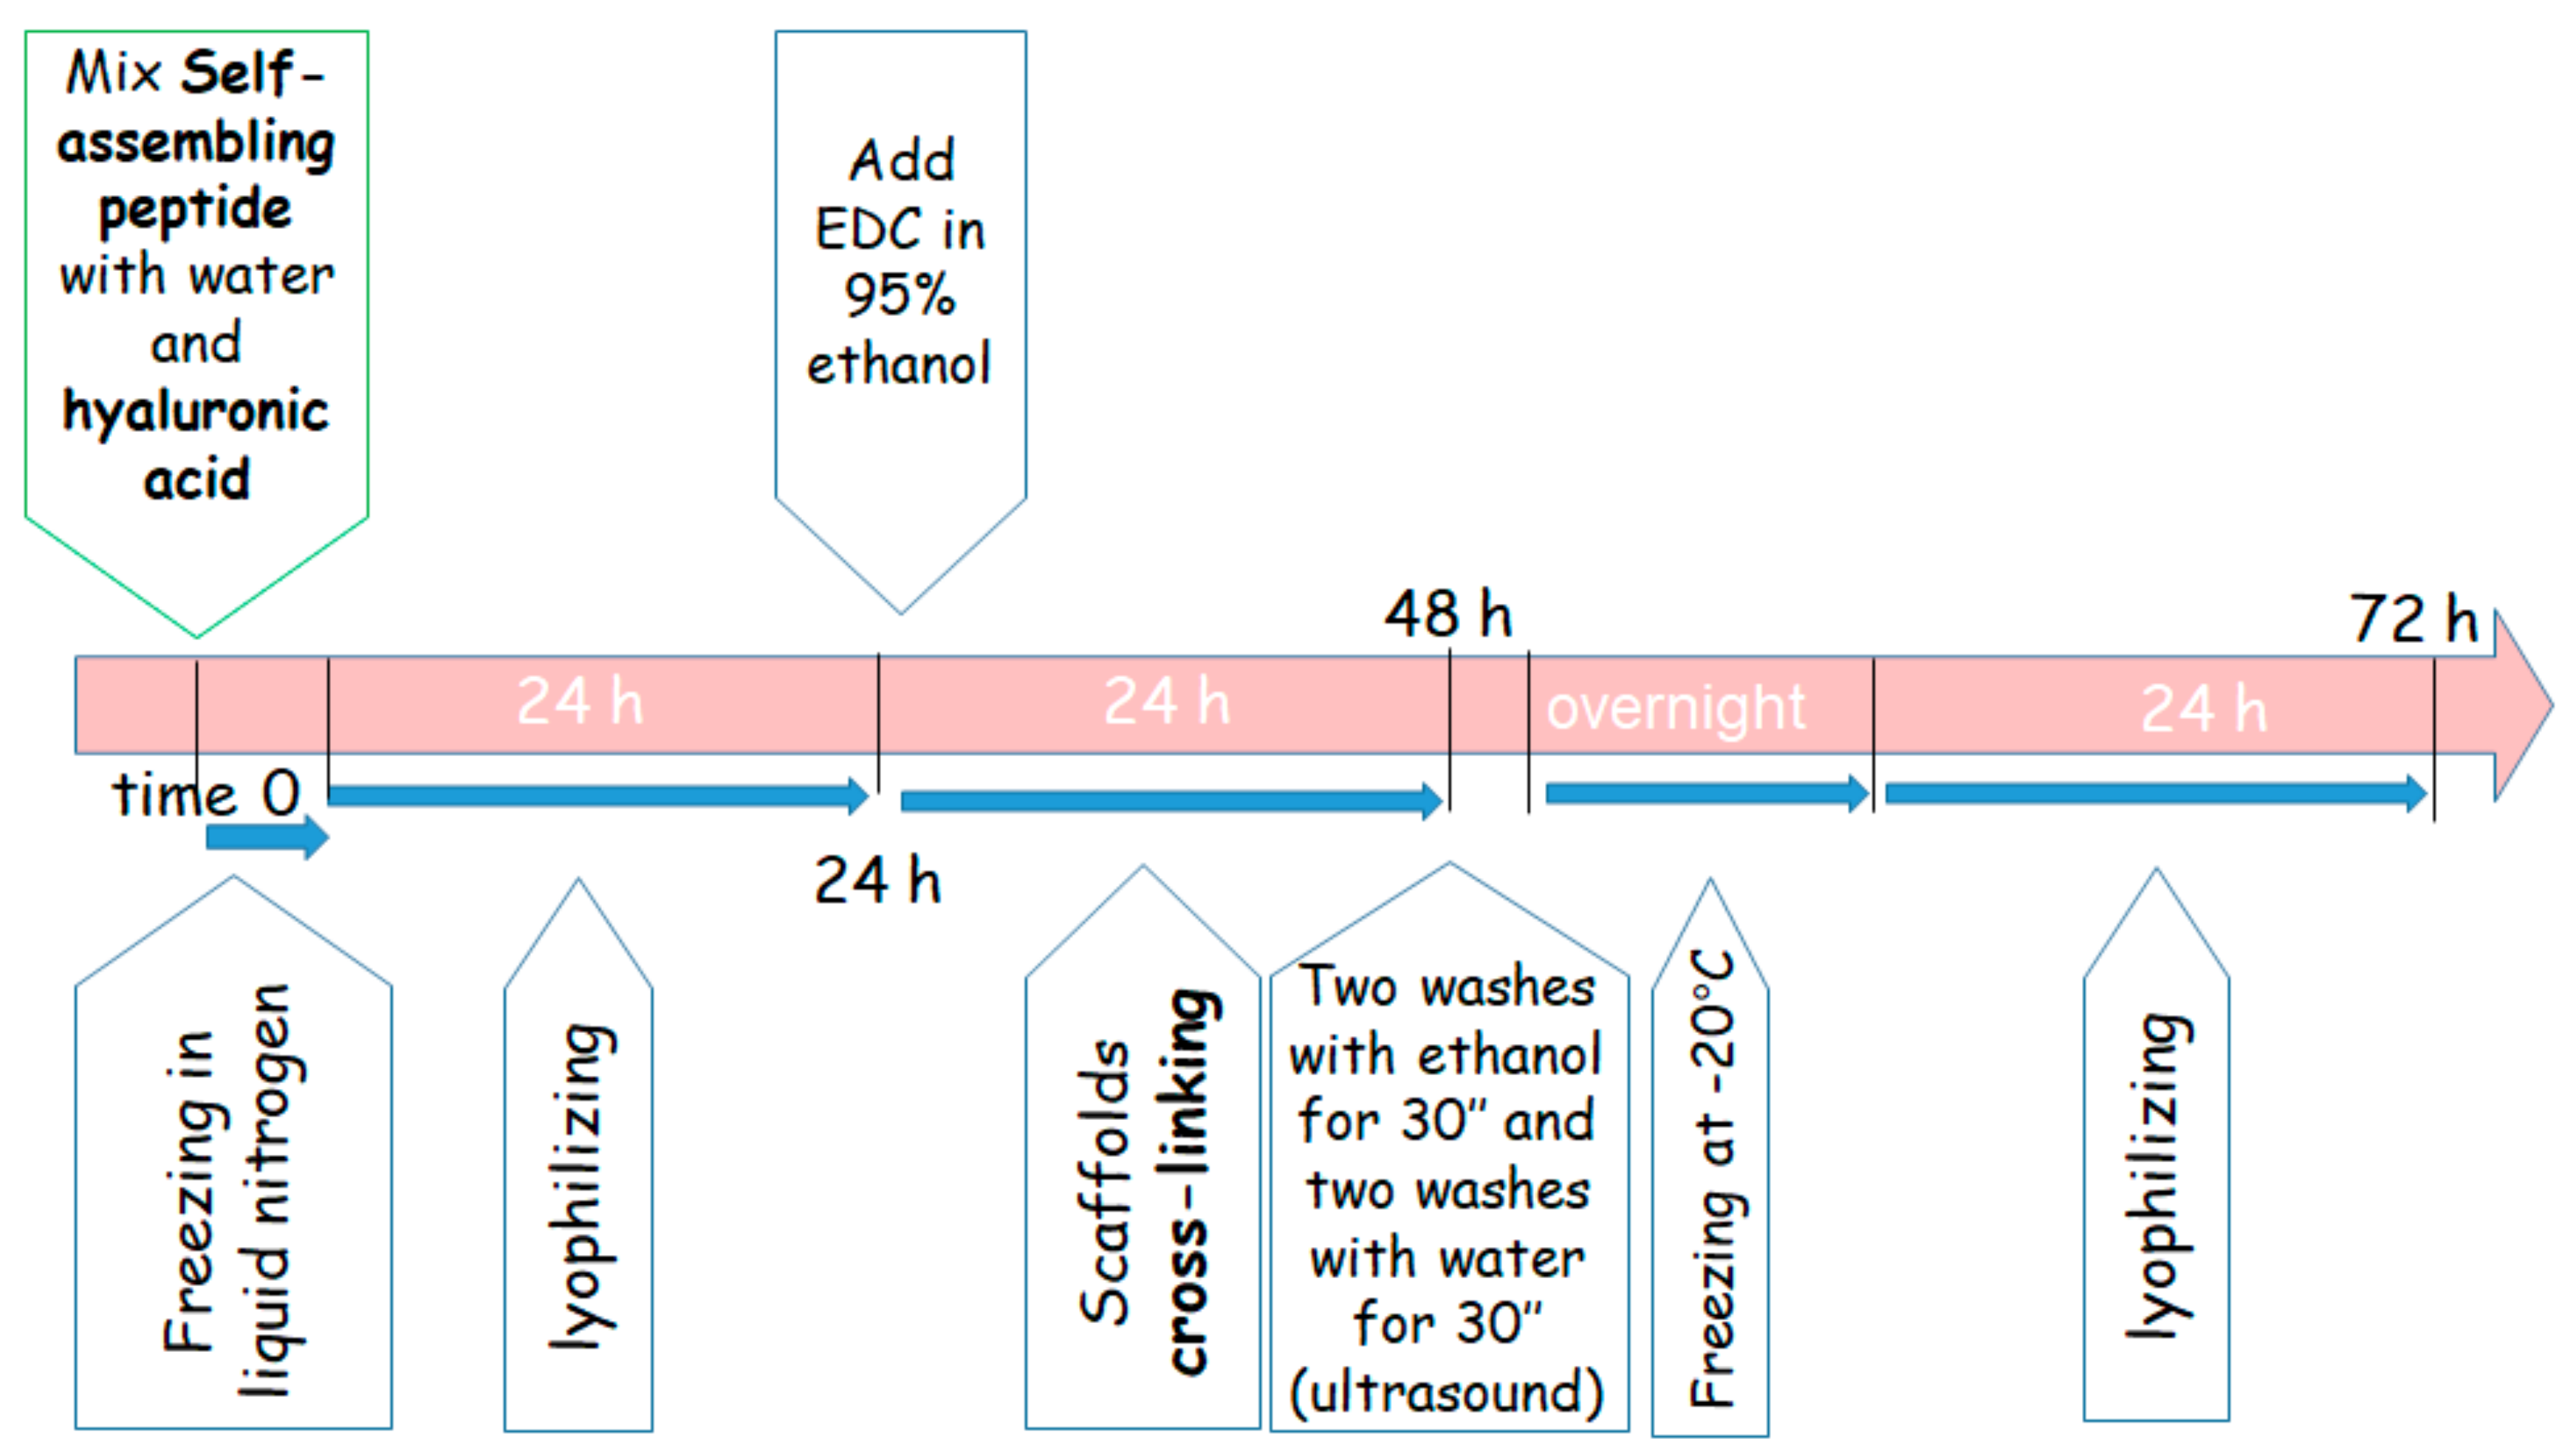
Abstract
1. Introduction
2. Materials and Methods
2.1. Materials for Scaffold Preparation
2.2. Synthesis of a SAP Functionalized with Laminin Adhesion Sequence
2.3. Preparation of the 3D Scaffold
2.4. Cell Culture in the 3D Scaffold
2.5. Culture Analysis
2.5.1. Viability
2.5.2. Fluorescent Staining
2.6. Morphological Analysis
2.6.1. SEM Analysis
2.6.2. Inclusion for Histological Evaluation
2.6.3. Staining
2.6.4. Imaging of Sliced Samples
2.7. Electroporation
2.7.1. 2D Cell Culture vs. 3D Cell Culture Electroporation
2.7.2. Pulse Protocol
2.7.3. 3D Cell Culture Electroporation
2.7.4. Evaluation of Electroporation
3. Results
3.1. 3D Scaffold Morphology
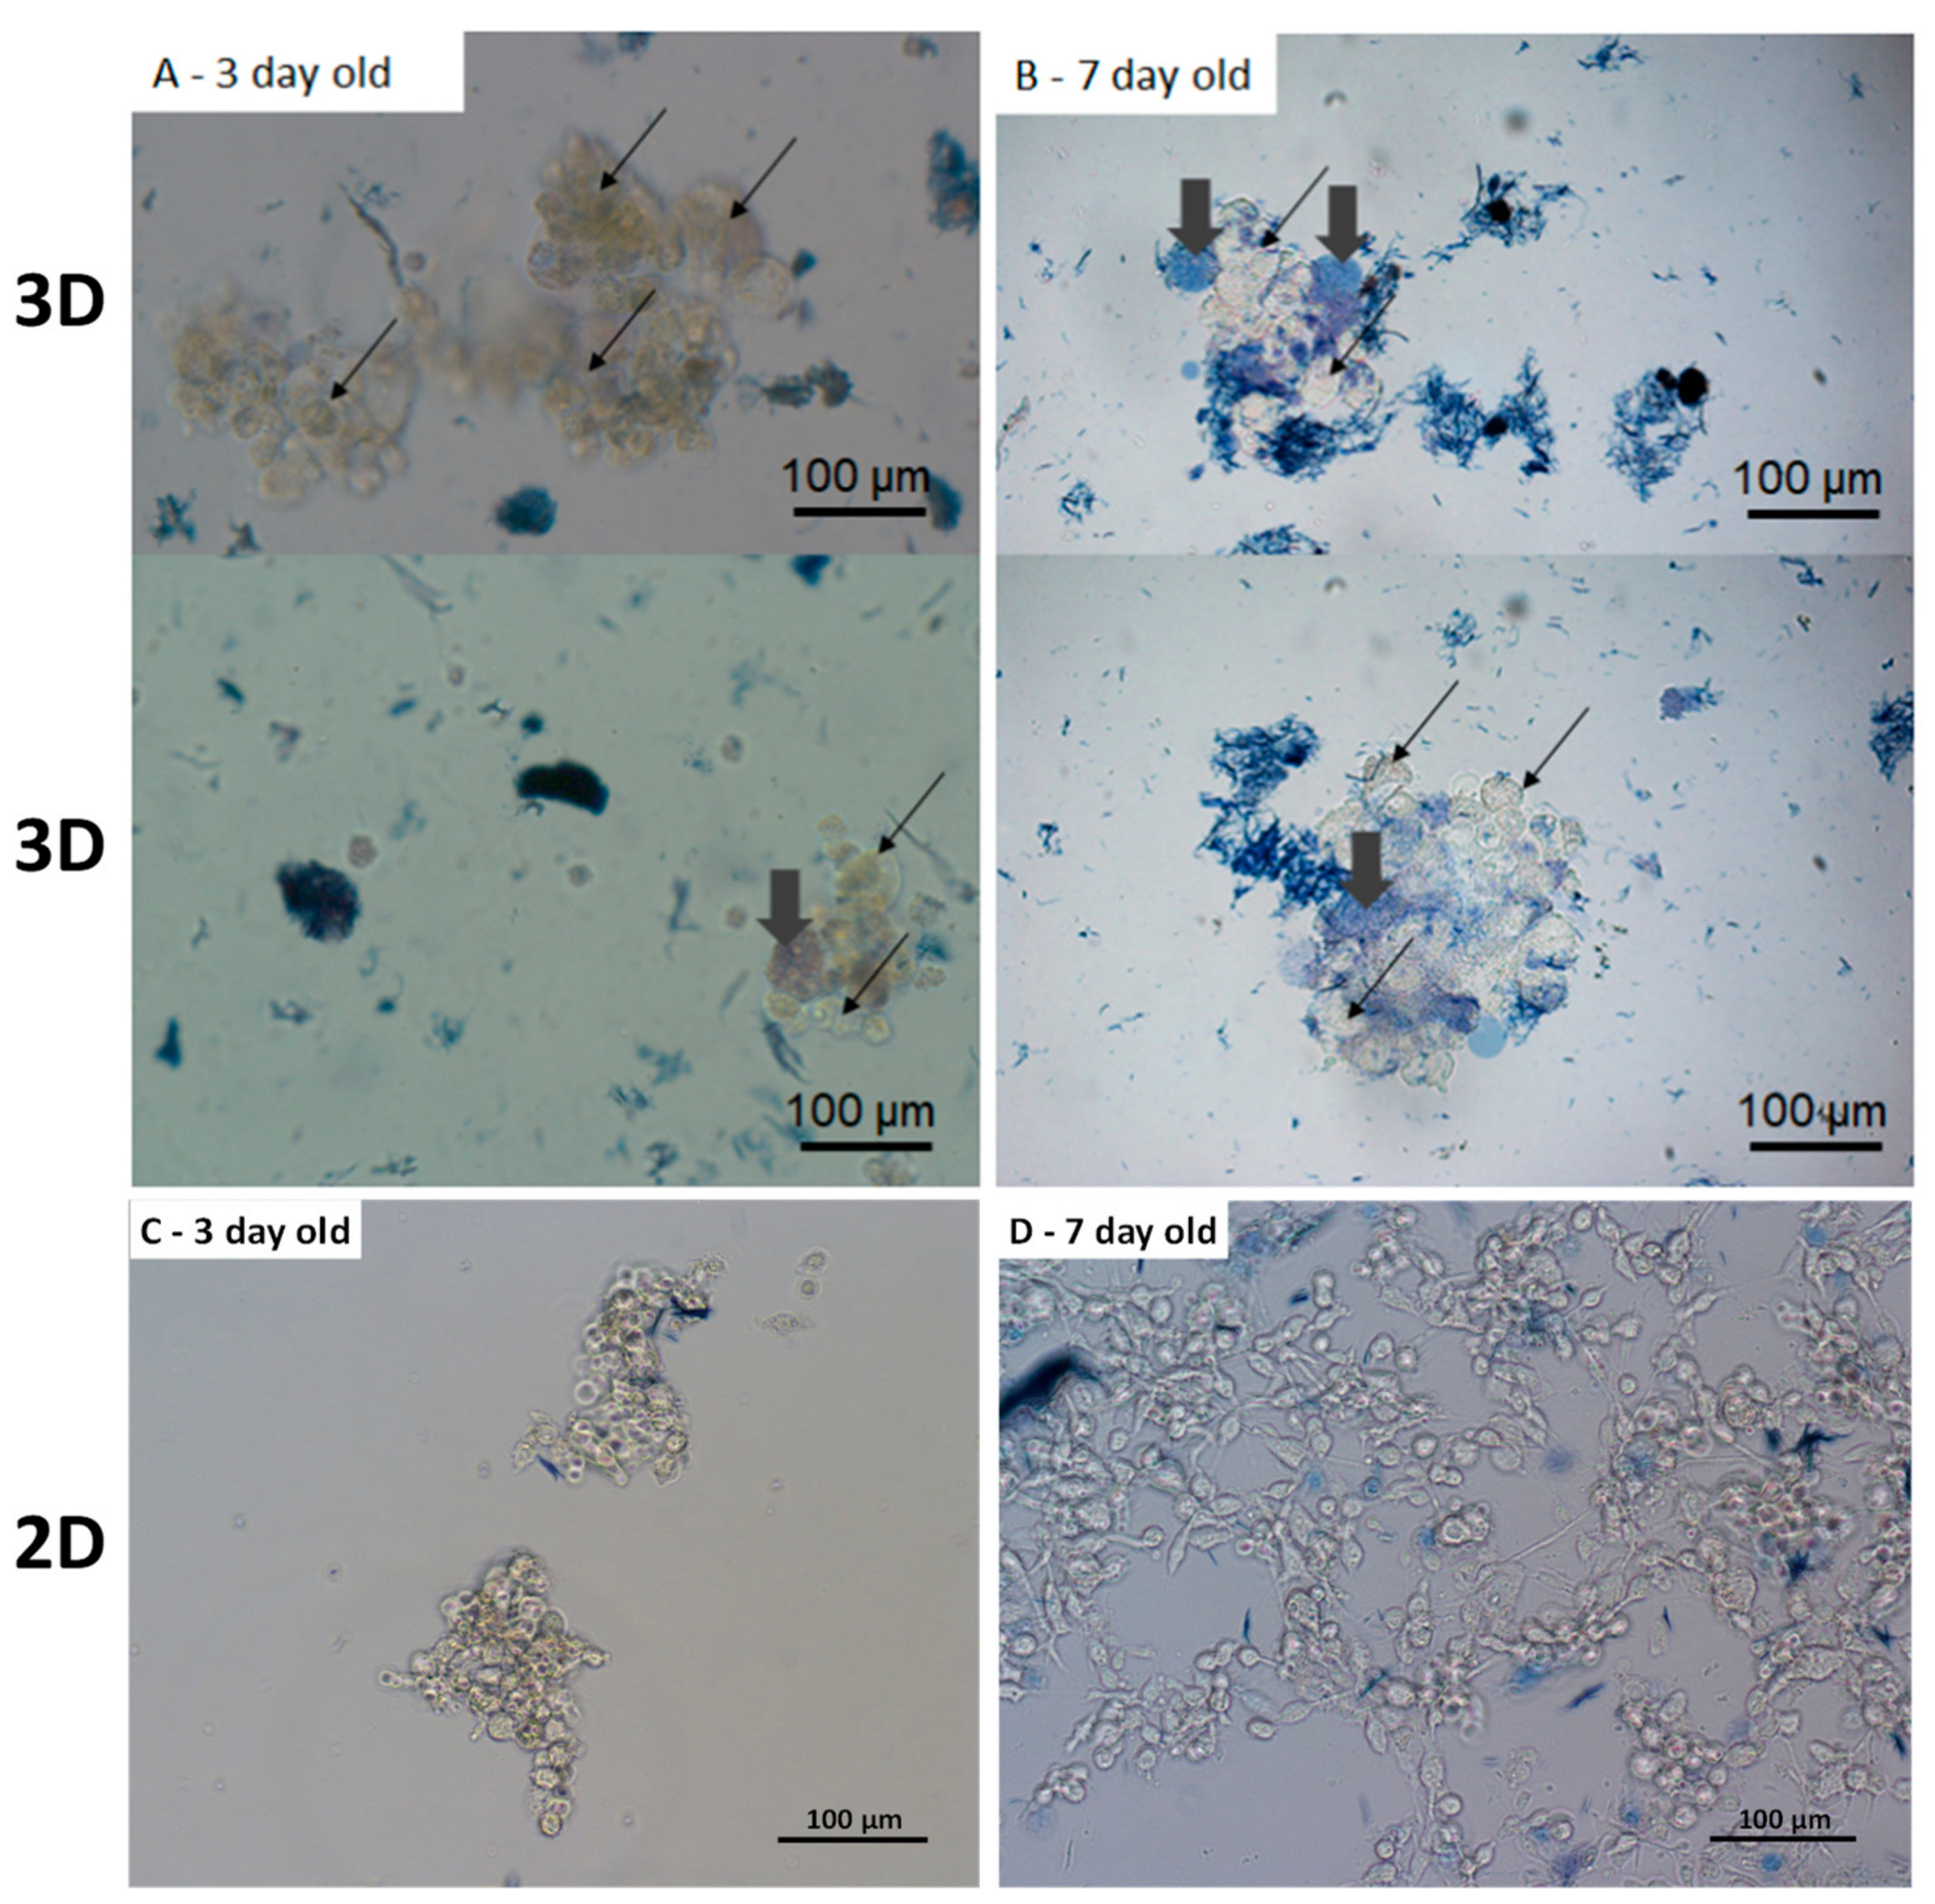
3.2. Cellular Viability and 3D Organization
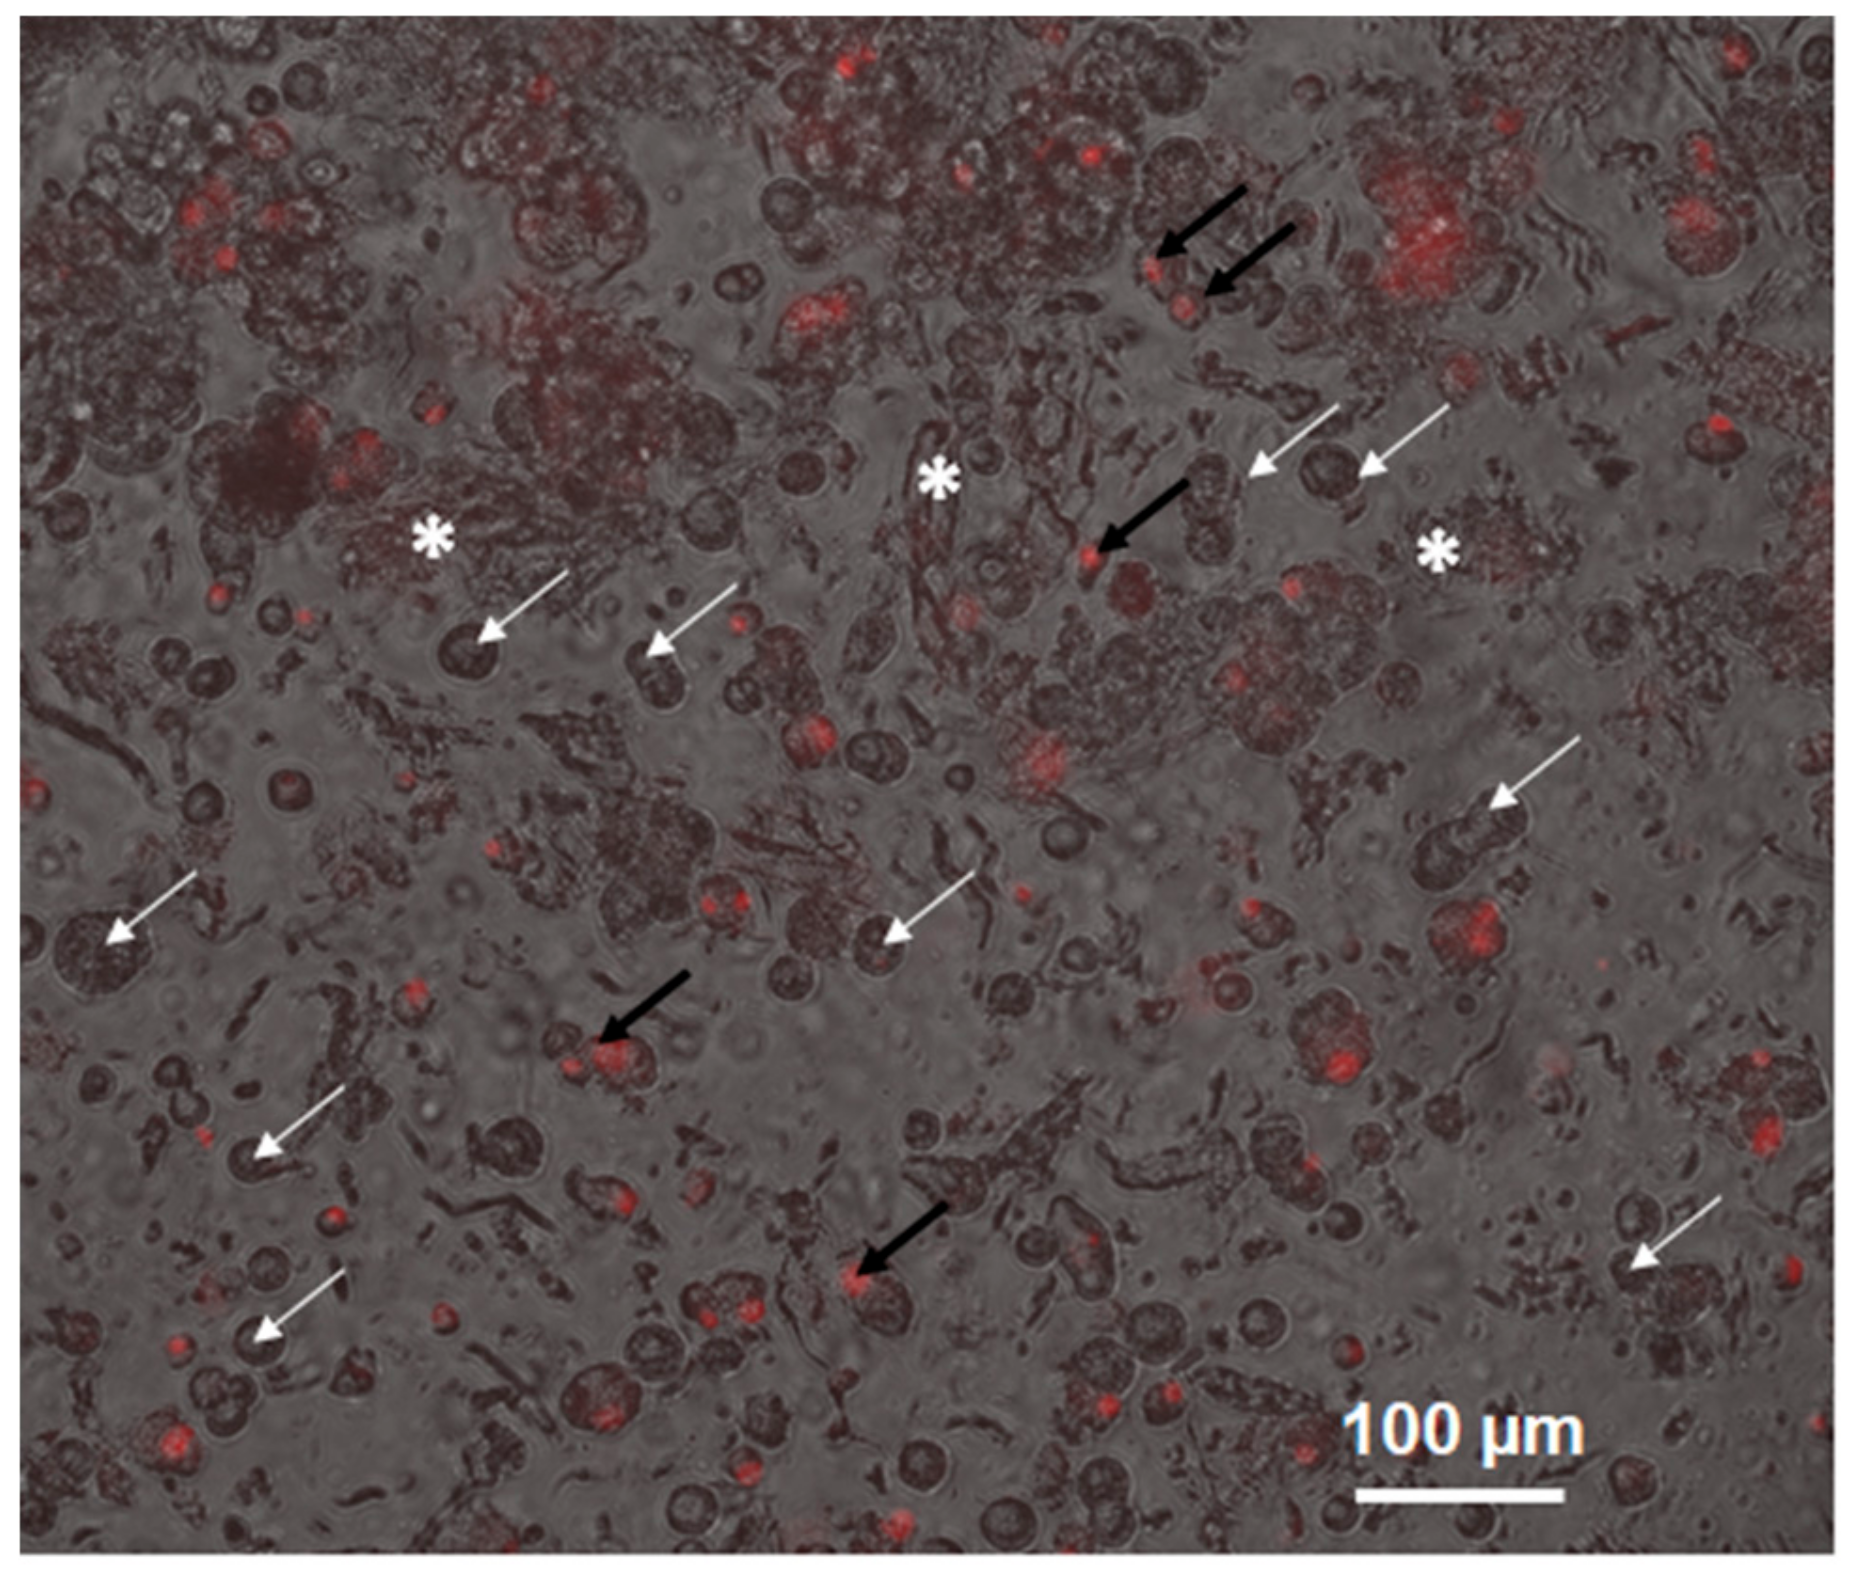
3.3. De Novo Cellular Synthesis of Extracellular Matrix
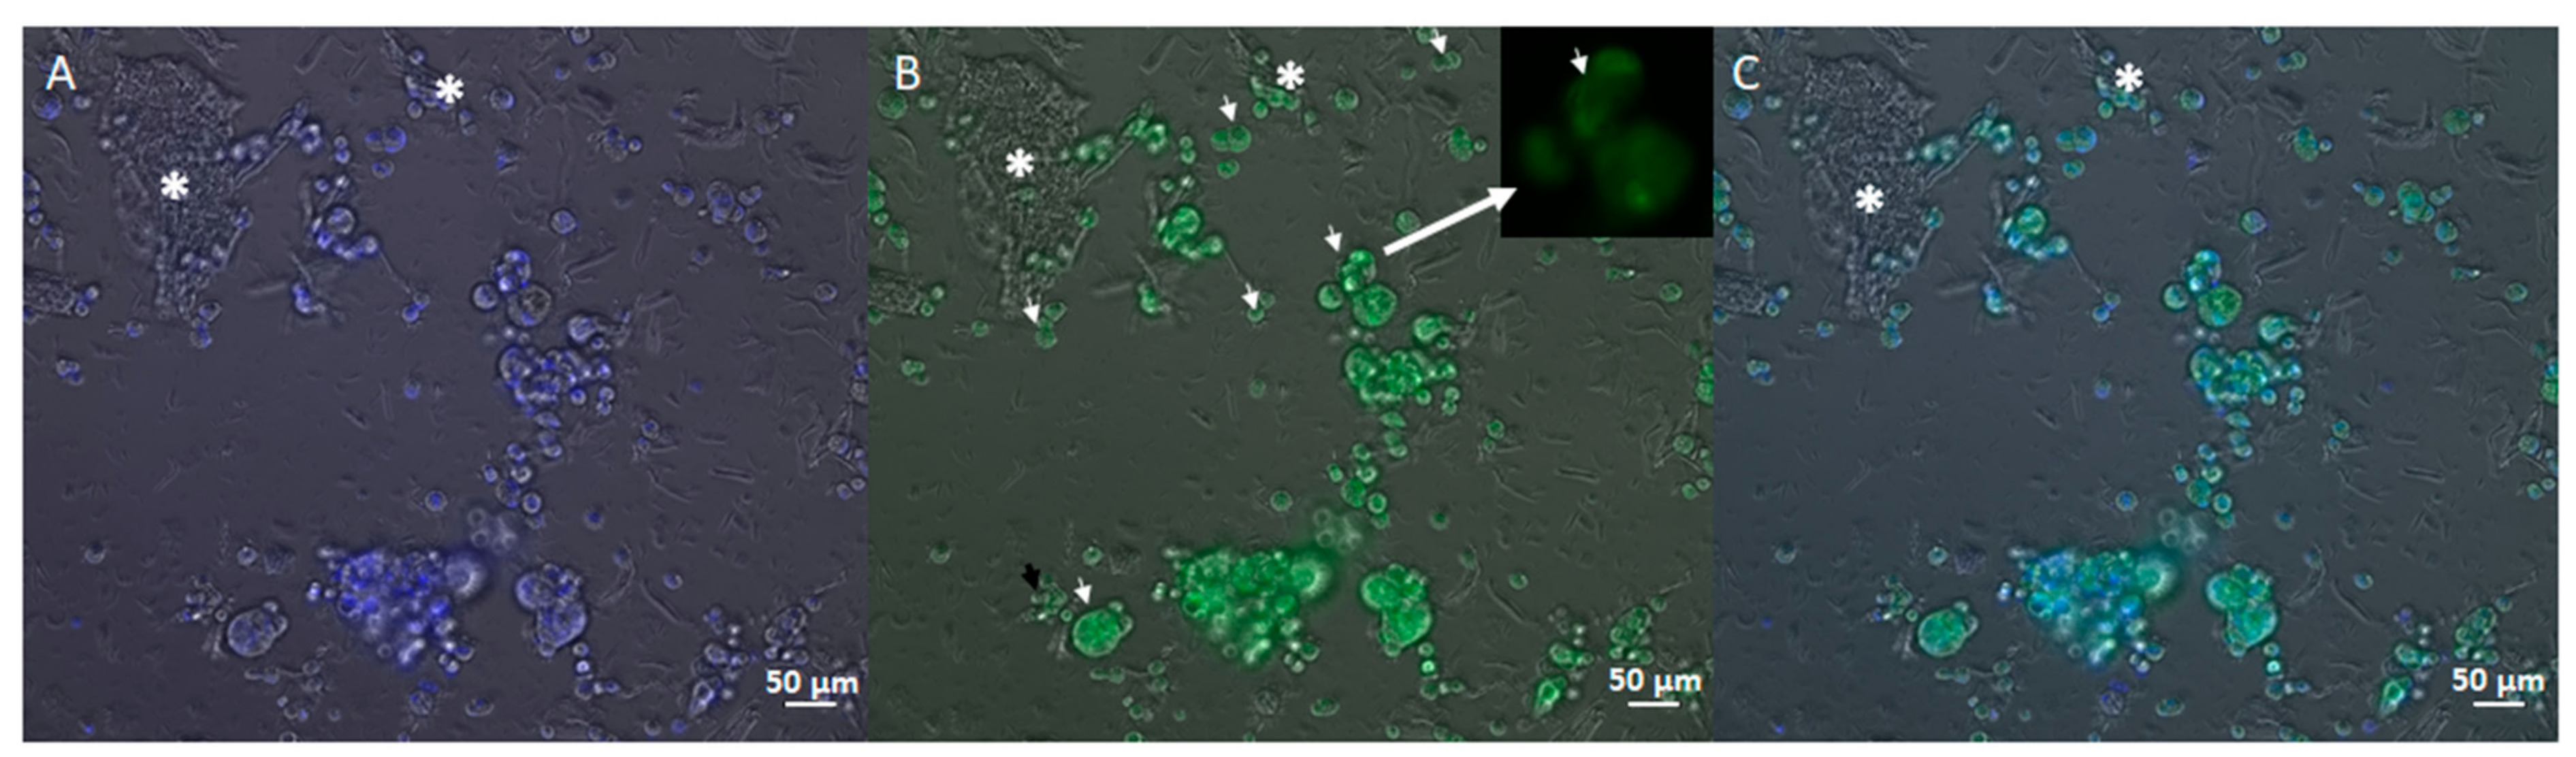
3.4. Application of the New Scaffold: Results of the Electroporation of MDA-MB231 Cell Culture
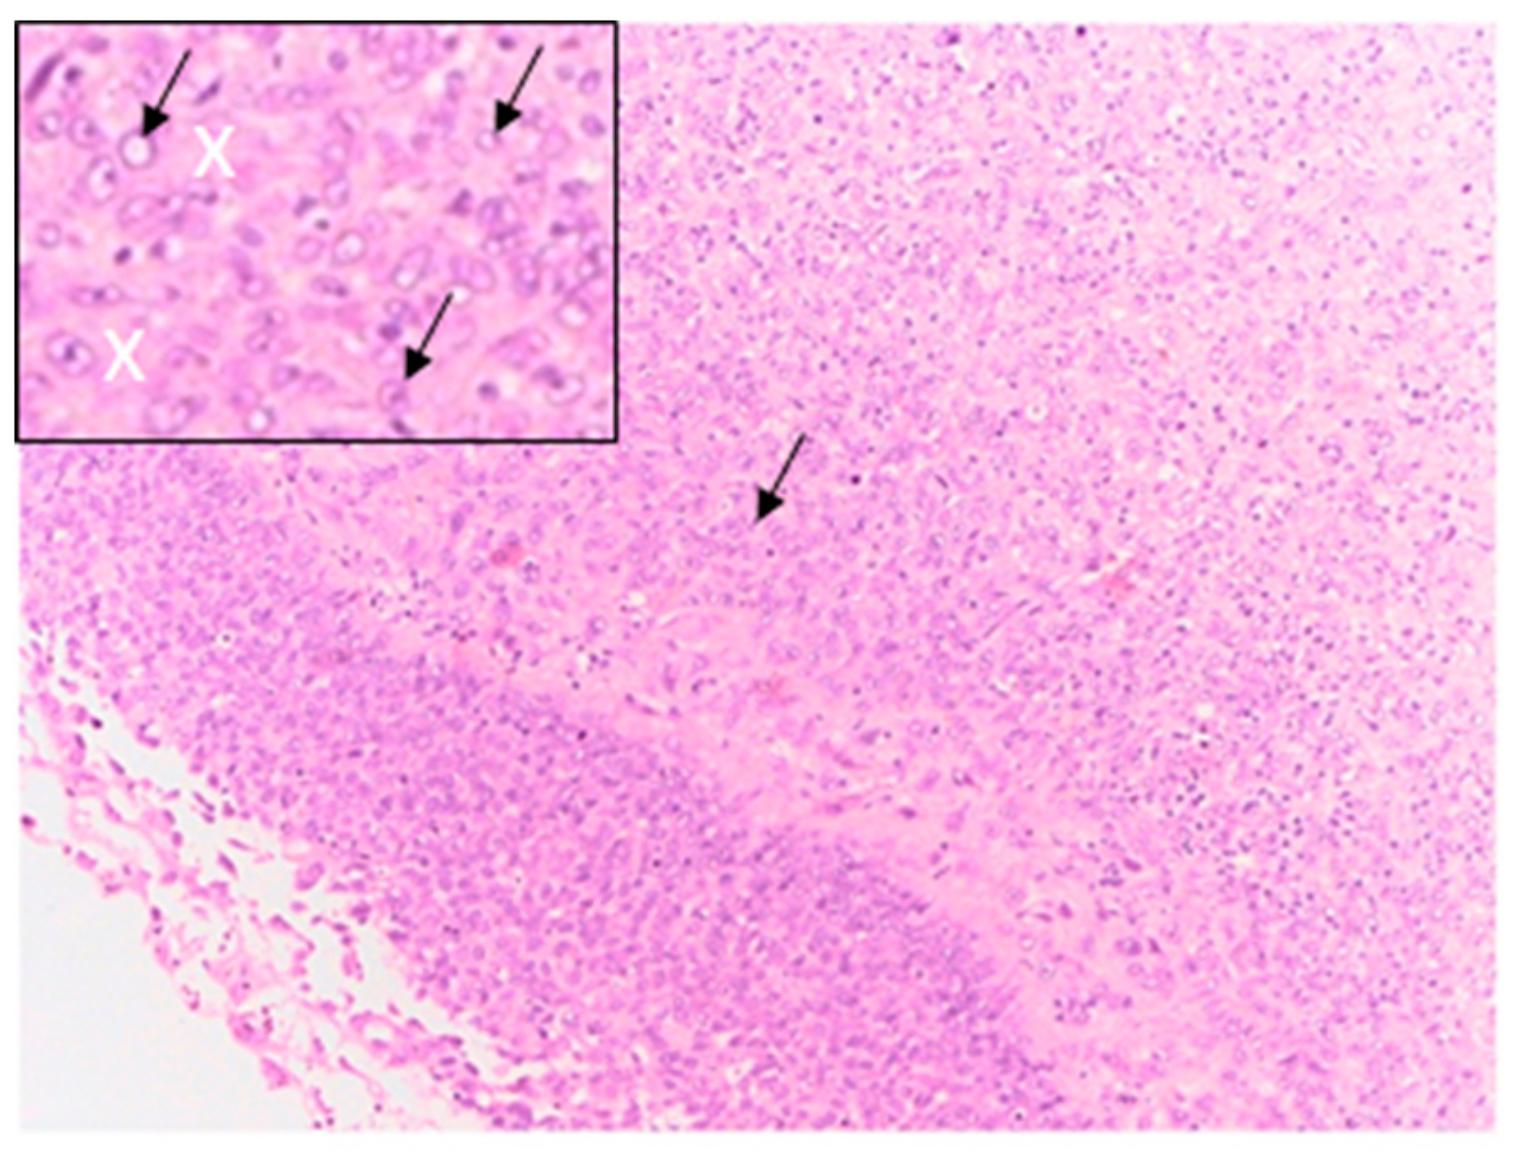
3.5. Comparison of the 3D Culture Histology with Tumor Histology
4. Discussion
5. Conclusions
Author Contributions
Funding
Acknowledgments
Conflicts of Interest
References
- Mir, L.M.; Gehl, J.; Sersa, G.; Collins, C.G.; Garbay, J.-R.; Billard, V.; Geertsen, P.F.; Rudolf, Z.; O’Sullivan, G.C.; Marty, M. Standard operating procedures of the electrochemotherapy: Instructions for the use of bleomycin or cisplatin administered either systemically or locally and electric pulses delivered by the CliniporatorTM by means of invasive or non-invasive electrodes. EJC Suppl. 2006, 4, 14–25. [Google Scholar] [CrossRef]
- Mir, L.M. Therapeutic perspectives of in vivo cell electropermeabilization. Bioelectrochemistry 2001, 53, 1–10. [Google Scholar] [CrossRef]
- Edhemovic, I.; Gadzijev, E.M.; Brecelj, E.; Miklavcic, D.; Kos, B.; Zupanic, A.; Mali, B.; Jarm, T.; Pavliha, D.; Marcan, M.; et al. Electrochemotherapy: A new technological approach in treatment of metastases in the liver. Technol. Cancer Res. Treat. 2011, 10, 475–485. [Google Scholar] [CrossRef] [PubMed]
- Sersa, G.; Miklavcic, D.; Cemazar, M.; Rudolf, Z.; Pucihar, G.; Snoj, M. Electrochemotherapy in treatment of tumours. Eur. J. Surg. Oncol. (EJSO) 2008, 34, 232–240. [Google Scholar] [CrossRef] [PubMed]
- Mir, L.M.; Glass, L.F.; Sersa, G.; Teissié, J.; Domenge, C.; Miklavcic, D.; Jaroszeski, M.J.; Orlowski, S.; Reintgen, D.S.; Rudolf, Z.; et al. Effective treatment of cutaneous and subcutaneous malignant tumours by electrochemotherapy. Br. J. Cancer 1998, 77, 2336–2342. [Google Scholar] [CrossRef]
- Sersa, G.; Cemazar, M.; Miklavcic, D. Antitumor effectiveness of electrochemotherapy with cis-diamminedichloroplatinum(II) in mice. Cancer Res. 1995, 55, 3450–3455. [Google Scholar]
- Marty, M.; Sersa, G.; Garbay, J.R.; Gehl, J.; Collins, C.G.; Snoj, M.; Billard, V.; Geertsen, P.F.; Larkin, J.O.; Miklavcic, D.; et al. Electrochemotherapy – An easy, highly effective and safe treatment of cutaneous and subcutaneous metastases: Results of ESOPE (European Standard Operating Procedures of Electrochemotherapy) study. Eur. J. Cancer Suppl. 2006, 4, 3–13. [Google Scholar] [CrossRef]
- Hoejholt, K.L.; Mužić, T.; Jensen, S.D.; Dalgaard, L.T.; Bilgin, M.; Nylandsted, J.; Heimburg, T.; Frandsen, S.K.; Gehl, J. Calcium electroporation and electrochemotherapy for cancer treatment: Importance of cell membrane composition investigated by lipidomics, calorimetry and in vitro efficacy. Sci. Rep. 2019, 9, 4758. [Google Scholar] [CrossRef]
- Cemazar, M.; Sersa, G.; Frey, W.; Miklavcic, D.; Teissié, J. Recommendations and requirements for reporting on applications of electric pulse delivery for electroporation of biological samples. Bioelectrochemistry 2018, 122, 69–76. [Google Scholar] [CrossRef]
- Pavlin, M.; Kandušer, M.; Reberšek, M.; Pucihar, G.; Hart, F.X.; Magjarević, R.; Miklavčič, D. Effect of Cell Electroporation on the Conductivity of a Cell Suspension. Biophys. J. 2005, 88, 4378–4390. [Google Scholar] [CrossRef]
- Pavlin, M.; Leben, V.; Miklavčič, D. Electroporation in dense cell suspension—Theoretical and experimental analysis of ion diffusion and cell permeabilization. Biochim. Et Biophys. Acta (Bba) Gen. Subj. 2007, 1770, 12–23. [Google Scholar] [CrossRef] [PubMed]
- Miklavčič, D.; Puc, M. Electroporation. In Wiley Encyclopedia of Biomedical Engineering; Akay, M., Ed.; John Wiley & Sons, Inc.: Hoboken, NJ, USA, 2006; ISBN 0-471-74036-5. [Google Scholar]
- Pakhomov, A. Advanced Electroporation Techniques in Biology and Medicine; CRC Press: Boca Raton FL, USA, 2010; ISBN 978-1-4398-1906-7. [Google Scholar]
- Miklavčič, D. Handbook of Electroporation; Springer International Publishing: Berlin, Germany, 2016; ISBN 978-3-319-26779-1. [Google Scholar]
- Hagemann, J.; Jacobi, C.; Hahn, M.; Schmid, V.; Welz, C.; Schwenk-Zieger, S.; Stauber, R.; Baumeister, P.; Becker, S. Spheroid-based 3D Cell Cultures Enable Personalized Therapy Testing and Drug Discovery in Head and Neck Cancer. Anticancer Res. 2017, 37, 2201–2210. [Google Scholar] [CrossRef] [PubMed]
- Lee, J.M.; Mhawech-Fauceglia, P.; Lee, N.; Parsanian, L.C.; Lin, Y.G.; Gayther, S.A.; Lawrenson, K. A three-dimensional microenvironment alters protein expression and chemosensitivity of epithelial ovarian cancer cells in vitro. Lab. Invest. 2013, 93, 528–542. [Google Scholar] [PubMed]
- Gibot, L.; Wasungu, L.; Teissié, J.; Rols, M.-P. Antitumor drug delivery in multicellular spheroids by electropermeabilization. J. Control. Release 2013, 167, 138–147. [Google Scholar] [CrossRef] [PubMed]
- Gibot, L.; Madi, M.; Vézinet, R.; Rols, M.P. Mixed Spheroids as a Relevant 3D Biological Tool to Understand Therapeutic Window of Electrochemotherapy. In 1st World Congress on Electroporation and Pulsed Electric Fields in Biology, Medicine and Food & Environmental Technologies; Jarm, T., Kramar, P., Eds.; Springer Singapore: Singapore, 2016; Volume 53, pp. 200–203. ISBN 978-981-287-816-8. [Google Scholar]
- Arena, C.B.; Szot, C.S.; Garcia, P.A.; Rylander, M.N.; Davalos, R.V. A Three-Dimensional In Vitro Tumor Platform for Modeling Therapeutic Irreversible Electroporation. Biophys. J. 2012, 103, 2033–2042. [Google Scholar] [CrossRef]
- Lam, J.; Truong, N.F.; Segura, T. Design of cell–matrix interactions in hyaluronic acid hydrogel scaffolds. Acta Biomater. 2014, 10, 1571–1580. [Google Scholar] [CrossRef]
- Hunt, N.C.; Shelton, R.M.; Grover, L. An alginate hydrogel matrix for the localised delivery of a fibroblast/keratinocyte co-culture. Biotechnol. J. 2009, 4, 730–737. [Google Scholar] [CrossRef]
- Wasungu, L.; Escoffre, J.-M.; Valette, A.; Teissie, J.; Rols, M.-P. A 3D in vitro spheroid model as a way to study the mechanisms of electroporation. Int. J. Pharm. 2009, 379, 278–284. [Google Scholar] [CrossRef]
- Znidar, K.; Bosnjak, M.; Cemazar, M.; Heller, L.C. Cytosolic DNA Sensor Upregulation Accompanies DNA Electrotransfer in B16.F10 Melanoma Cells. Mol. Ther. Nucleic Acids 2016, 5, e322. [Google Scholar] [CrossRef]
- Bulysheva, A.A.; Heller, R. 3D Culture Models to Assess Tissue Responses to Electroporation. In Handbook of Electroporation; Miklavcic, D., Ed.; Springer International Publishing: Berlin, Germany, 2017; pp. 1–14. ISBN 978-3-319-26779-1. [Google Scholar]
- Imamura, Y.; Mukohara, T.; Shimono, Y.; Funakoshi, Y.; Chayahara, N.; Toyoda, M.; Kiyota, N.; Takao, S.; Kono, S.; Nakatsura, T.; et al. Comparison of 2D- and 3D-culture models as drug-testing platforms in breast cancer. Oncol. Rep. 2015, 33, 1837–1843. [Google Scholar] [CrossRef]
- Znidar, K.; Bosnjak, M.; Jesenko, T.; Heller, L.C.; Cemazar, M. Upregulation of DNA Sensors in B16.F10 Melanoma Spheroid Cells After Electrotransfer of pDNA. Technol. Cancer Res. Treat. 2018, 17. [Google Scholar] [CrossRef] [PubMed]
- Ivey, J.W.; Latouche, E.L.; Sano, M.B.; Rossmeisl, J.H.; Davalos, R.V.; Verbridge, S.S. Targeted cellular ablation based on the morphology of malignant cells. Sci. Rep. 2015, 5. [Google Scholar] [CrossRef] [PubMed]
- Mahmoudzadeh, A.; Mohammadpour, H. Tumor cell culture on collagen–chitosan scaffolds as three-dimensional tumor model: A suitable model for tumor studies. J. Food Drug Anal. 2016, 24, 620–626. [Google Scholar] [CrossRef] [PubMed]
- Campbell, J.J.; Husmann, A.; Hume, R.D.; Watson, C.J.; Cameron, R.E. Development of three-dimensional collagen scaffolds with controlled architecture for cell migration studies using breast cancer cell lines. Biomaterials 2017, 114, 34–43. [Google Scholar] [CrossRef] [PubMed]
- Tosi, A.L.; Campana, L.G.; Dughiero, F.; Forzan, M.; Rastrelli, M.; Sieni, E.; Rossi, C.R. Microscopic histological characteristics of soft tissue sarcomas: Analysis of tissue features and electrical resistance. Med. Biol. Eng. Comput. 2017, 55, 1097–1108. [Google Scholar] [CrossRef] [PubMed]
- World Health Organization; International Agency for Research on Cancer. WHO Classification of Tumours of Soft Tissue and Bone, 4th ed.; Fletcher, C.D.M., Ed.; World Health Organization classification of tumours; IARC Press: Lyon, France, 2013; ISBN 978-92-832-2434-1. [Google Scholar]
- Zamuner, A.; Cavo, M.; Scaglione, S.; Messina, G.; Russo, T.; Gloria, A.; Marletta, G.; Dettin, M. Design of Decorated Self-Assembling Peptide Hydrogels as Architecture for Mesenchymal Stem Cells. Materials 2016, 9, 727. [Google Scholar] [CrossRef] [PubMed]
- Patel, R.; Santhosh, M.; Dash, J.K.; Karpoormath, R.; Jha, A.; Kwak, J.; Patel, M.; Kim, J.H. Ile-Lys-Val-ala-Val (IKVAV) peptide for neuronal tissue engineering. Polym. Adv. Technol. 2019, 30, 4–12. [Google Scholar] [CrossRef]
- Brun, P.; Zamuner, A.; Peretti, A.; Conti, J.; Messina, G.M.L.; Marletta, G.; Dettin, M. 3D Synthetic Peptide-based Architectures for the Engineering of the Enteric Nervous System. Sci. Rep. 2019, 9, 5583. [Google Scholar] [CrossRef]
- Pavlin, M.; Miklavčič, D. Theoretical and experimental analysis of conductivity, ion diffusion and molecular transport during cell electroporation — Relation between short-lived and long-lived pores. Bioelectrochemistry 2008, 74, 38–46. [Google Scholar] [CrossRef]
- Ivora, A.; Al-Sakere, B.; Rubinsky, B.; Mir, L.M. In vivo electrical conductivity measurements during and after tumor electroporation: Conductivity changes reflect the treatment outcome. Phys. Med. Biol. 2009, 54, 5949. [Google Scholar] [CrossRef]
- Ivorra, A.; Villemejane, J.; Mir, L.M. Electrical modeling of the influence of medium conductivity on electroporation. Phys. Chem. 2010, 12, 10055–10064. [Google Scholar] [CrossRef] [PubMed]
- Čorović, S.; Županič, A.; Kranjc, S.; Al Sakere, B.; Leroy-Willig, A.; Mir, L.M.; Miklavčič, D. The influence of skeletal muscle anisotropy on electroporation: In vivo study and numerical modeling. Med. Biol. Eng. Comput. 2010, 58, 637–648. [Google Scholar]
- Miklavcic, D.; Corovic, S.; Pucihar, G.; Pavselj, N. Importance of tumour coverage by sufficiently high local electric field for effective electrochemotherapy. EJC Suppl. 2006, 4, 45–51. [Google Scholar] [CrossRef]
- Denzi, A.; Strigari, L.; Di Filippo, F.; Botti, C.; Di Filippo, S.; Perracchio, L.; Ronchetti, M.; Cadossi, R.; Liberti, M. Modeling the positioning of single needle electrodes for the treatment of breast cancer in a clinical case. Biomed. Eng. Online 2015, 14, S1. [Google Scholar] [CrossRef]
- Pucihar, G.; Kotnik, T.; Teissié, J.; Miklavčič, D. Electropermeabilization of dense cell suspensions. Eur. Biophys. J. 2007, 36, 173–185. [Google Scholar] [CrossRef]
- Zhang, S. Emerging biological materials through molecular self-assembly. Biotechnol. Adv. 2002, 20, 321–339. [Google Scholar] [CrossRef]
- Luo, Z.; Wang, S.; Zhang, S. Fabrication of self-assembling d-form peptide nanofiber scaffold d-EAK16 for rapid hemostasis. Biomaterials 2011, 32, 2013–2020. [Google Scholar] [CrossRef]
- Lu, S.; Wang, H.; Sheng, Y.; Liu, M.; Chen, P. Molecular binding of self-assembling peptide EAK16-II with anticancer agent EPT and its implication in cancer cell inhibition. J. Control. Release 2012, 160, 33–40. [Google Scholar] [CrossRef]
- Grant, G.A. (Ed.) Synthetic Peptides: A User’s Guide, 2nd ed.; Advances in Molecular Biology; Oxford University Press: Oxford, UK; New York, NY, USA, 2002; ISBN 978-0-19-513261-8. [Google Scholar]
- Hou, L.; Gao, C.; Chen, L.; Hu, G.; Xie, S. Essential role of autophagy in fucoxanthin-induced cytotoxicity to human epithelial cervical cancer HeLa cells. Acta Pharmacol. Sin. 2013, 34, 1403–1410. [Google Scholar] [CrossRef]
- Chen, P.-F.; Singhal, S.; Bushyhead, D.; Broder-Fingert, S.; Wolfe, J. Colchicine-induced degeneration of the micronucleus during conjugation in Tetrahymena. Biol. Open 2014, 3, 353–361. [Google Scholar] [CrossRef]
- Pietkiewicz, S.; Schmidt, J.H.; Lavrik, I.N. Quantification of apoptosis and necroptosis at the single cell level by a combination of Imaging Flow Cytometry with classical Annexin V/propidium iodide staining. J. Immunol. Methods 2015, 423, 99–103. [Google Scholar] [CrossRef] [PubMed]
- Sawai, H.; Domae, N. Discrimination between primary necrosis and apoptosis by necrostatin-1 in Annexin V-positive/propidium iodide-negative cells. Biochem. Biophys. Res. Commun. 2011, 411, 569–573. [Google Scholar] [CrossRef] [PubMed]
- Crowley, L.C.; Scott, A.P.; Marfell, B.J.; Boughaba, J.A.; Chojnowski, G.; Waterhouse, N.J. Measuring Cell Death by Propidium Iodide Uptake and Flow Cytometry. Cold Spring Harb. Protoc. 2016, 2016. [Google Scholar] [CrossRef] [PubMed]
- Mpoke, S.S.; Wolfe, J. Differential Staining of Apoptotic Nuclei in Living Cells: Application to Macronuclear Elimination in Tetrahymena. J. Histochem. Cytochem. 1997, 45, 675–683. [Google Scholar] [CrossRef]
- Salim, L.; Mohan, S.; Othman, R.; Abdelwahab, S.; Kamalidehghan, B.; Sheikh, B.; Ibrahim, M. Thymoquinone Induces Mitochondria-Mediated Apoptosis in Acute Lymphoblastic Leukaemia in Vitro. Molecules 2013, 18, 11219–11240. [Google Scholar] [CrossRef]
- Wu, X. Dual AO/EB Staining to Detect Apoptosis in Osteosarcoma Cells Compared with Flow Cytometry. Med. Sci. Monit. Basic Res. 2015, 21, 15–20. [Google Scholar] [CrossRef]
- Syed, S.B.; Arya, H.; Fu, I.-H.; Yeh, T.-K.; Periyasamy, L.; Hsieh, H.-P.; Coumar, M.S. Targeting P-glycoprotein: Investigation of piperine analogs for overcoming drug resistance in cancer. Sci. Rep. 2017, 7. [Google Scholar] [CrossRef]
- Öğünç, Y.; Demirel, M.; Yakar, A.; İncesu, Z. Vincristine and ε-viniferine-loaded PLGA-b-PEG nanoparticles: Pharmaceutical characteristics, cellular uptake and cytotoxicity. J. Microencapsul. 2017, 34, 38–46. [Google Scholar] [CrossRef]
- ImageJ. Available online: http://imagej.nih.gov/ij/ (accessed on 3 October 2014).
- Mateos Pérez, J.M.; Pascau, J. Image Processing with ImageJ: Discover the Incredible Possibilities of ImageJ, from Basic Image Processing to Macro and Plugin Development; Packt Open Source; Packt Publ.: Birmingham, UK, 2013; ISBN 978-1-78328-395-8. [Google Scholar]
- Brun, P.; Dettin, M.; Campana, L.G.; Dughiero, F.; Sgarbossa, P.; Bernardello, C.; Tosi, A.L.; Zamuner, A.; Sieni, E. Cell-seeded 3D scaffolds as in vitro models for electroporation. Bioelectrochemistry 2019, 125, 15–24. [Google Scholar] [CrossRef]
- Ongaro, A.; Campana, L.G.; De Mattei, M.; Di Barba, P.; Dughiero, F.; Forzan, M.; Mognaschi, M.E.; Pellati, A.; Rossi, C.R.; Bernardello, C.; et al. Effect of Electrode Distance in Grid Electrode: Numerical Models and In Vitro Tests. Technol. Cancer Res. Treat. 2018, 17, 153303381876449. [Google Scholar] [CrossRef]
- Ongaro, A.; Pellati, A.; Caruso, A.; Battista, M.; De Terlizzi, F.; De Mattei, M.; Fini, M. Identification of in vitro electropermeabilization equivalent pulse protocols. Technol. Cancer Res. Treat. 2011, 10, 465–473. [Google Scholar] [CrossRef] [PubMed]
- Ongaro, A.; Campana, L.G.; De Mattei, M.; Dughiero, F.; Forzan, M.; Pellati, A.; Rossi, C.R.; Sieni, E. Evaluation of the Electroporation Efficiency of a Grid Electrode for Electrochemotherapy: From Numerical Model to In Vitro Tests. Technol. Cancer Res. Treat. 2016, 15, 296–307. [Google Scholar] [CrossRef] [PubMed]
- Batista Napotnik, T.; Miklavčič, D. In vitro electroporation detection methods—An overview. Bioelectrochemistry 2018, 120, 166–182. [Google Scholar] [CrossRef] [PubMed]
- Denisov, E.V.; Skryabin, N.A.; Gerashchenko, T.S.; Tashireva, L.A.; Wilhelm, J.; Buldakov, M.A.; Sleptcov, A.A.; Lebedev, I.N.; Vtorushin, S.V.; Zavyalova, M.V.; et al. Clinically relevant morphological structures in breast cancer represent transcriptionally distinct tumor cell populations with varied degrees of epithelial-mesenchymal transition and CD44+CD24− stemness. Oncotarget 2017, 8, 61163. [Google Scholar] [CrossRef]
- Dai, X.; Cheng, H.; Bai, Z.; Li, J. Breast Cancer Cell Line Classification and Its Relevance with Breast Tumor Subtyping. J. Cancer 2017, 8, 3131–3141. [Google Scholar] [CrossRef]
- Goldblum, J.R.; Lamps, L.W.; McKenney, J.K.; Myers, J.L.; Ackerman, L.V.; Rosai, J. (Eds.) Rosai and Ackerman’s Surgical Pathology, 11th ed.; Elsevier: Philadelphia, PA, USA, 2018; ISBN 978-0-323-26339-9. [Google Scholar]
- Altaf, F.J.; Mokhtar, G.A.; Emam, E.; Bokhary, R.Y.; Mahfouz, N.B.; Al Amoudi, S.; AL-Gaithy, Z.K. Metaplastic carcinoma of the breast: An immunohistochemical study. Diagn. Pathol. 2014, 9, 139. [Google Scholar] [CrossRef]
- McKinnon, E.; Xiao, P. Metaplastic Carcinoma of the Breast. Arch. Pathol. Lab. Med. 2015, 139, 819–822. [Google Scholar] [CrossRef]
- Kenny, P.A.; Lee, G.Y.; Myers, C.A.; Neve, R.M.; Semeiks, J.R.; Spellman, P.T.; Lorenz, K.; Lee, E.H.; Barcellos-Hoff, M.H.; Petersen, O.W.; et al. The morphologies of breast cancer cell lines in three-dimensional assays correlate with their profiles of gene expression. Mol. Oncol. 2007, 1, 84–96. [Google Scholar] [CrossRef]
- Hamad, A.M.; Ahmed, H.G. Association of Connective Tissue Fibers with Estrogen Expression in Breast Lesions among Sudanese Females. Int. Clin. Pathol. J. 2016, 2. [Google Scholar] [CrossRef]
- Insua-Rodríguez, J.; Oskarsson, T. The extracellular matrix in breast cancer. Adv. Drug Deliv. Rev. 2016, 97, 41–55. [Google Scholar] [CrossRef]
- Goddard, E.T.; Hill, R.C.; Barrett, A.; Betts, C.; Guo, Q.; Maller, O.; Borges, V.F.; Hansen, K.C.; Schedin, P. Quantitative extracellular matrix proteomics to study mammary and liver tissue microenvironments. Int. J. Biochem. Cell Biol. 2016, 81, 223–232. [Google Scholar] [CrossRef] [PubMed]
- Campana, L.G.; Edhemovic, I.; Soden, D.; Perrone, A.M.; Scarpa, M.; Campanacci, L.; Cemazar, M.; Valpione, S.; Miklavčič, D.; Mocellin, S.; et al. Electrochemotherapy–Emerging applications technical advances, new indications, combined approaches, and multi-institutional collaboration. Eur. J. Surg. Oncol. 2019, 45, 92–102. [Google Scholar] [CrossRef] [PubMed]
- Campana, L.G.; Marconato, R.; Valpione, S.; Galuppo, S.; Alaibac, M.; Rossi, C.R.; Mocellin, S. Basal cell carcinoma: 10-year experience with electrochemotherapy. J. Transl. Med. 2017, 15, 122. [Google Scholar] [CrossRef] [PubMed]
- Curatolo, P.; Quaglino, P.; Marenco, F.; Mancini, M.; Nardò, T.; Mortera, C.; Rotunno, R.; Calvieri, S.; Bernengo, M. Electrochemotherapy in the Treatment of Kaposi Sarcoma Cutaneous Lesions: A Two-Center Prospective Phase II Trial. Ann. Surg. Oncol. 2012, 19, 192–198. [Google Scholar] [CrossRef]
- Campana, L.G.; Bianchi, G.; Mocellin, S.; Valpione, S.; Campanacci, L.; Brunello, A.; Donati, D.; Sieni, E.; Rossi, C.R. Electrochemotherapy Treatment of Locally Advanced and Metastatic Soft Tissue Sarcomas: Results of a Non-Comparative Phase II Study. World J. Surg. 2014, 38, 813–822. [Google Scholar] [CrossRef]


© 2019 by the authors. Licensee MDPI, Basel, Switzerland. This article is an open access article distributed under the terms and conditions of the Creative Commons Attribution (CC BY) license (http://creativecommons.org/licenses/by/4.0/).
Share and Cite
Dettin, M.; Sieni, E.; Zamuner, A.; Marino, R.; Sgarbossa, P.; Lucibello, M.; Tosi, A.L.; Keller, F.; Campana, L.G.; Signori, E. A Novel 3D Scaffold for Cell Growth to Assess Electroporation Efficacy. Cells 2019, 8, 1470. https://doi.org/10.3390/cells8111470
Dettin M, Sieni E, Zamuner A, Marino R, Sgarbossa P, Lucibello M, Tosi AL, Keller F, Campana LG, Signori E. A Novel 3D Scaffold for Cell Growth to Assess Electroporation Efficacy. Cells. 2019; 8(11):1470. https://doi.org/10.3390/cells8111470
Chicago/Turabian StyleDettin, Monica, Elisabetta Sieni, Annj Zamuner, Ramona Marino, Paolo Sgarbossa, Maria Lucibello, Anna Lisa Tosi, Flavio Keller, Luca Giovanni Campana, and Emanuela Signori. 2019. "A Novel 3D Scaffold for Cell Growth to Assess Electroporation Efficacy" Cells 8, no. 11: 1470. https://doi.org/10.3390/cells8111470
APA StyleDettin, M., Sieni, E., Zamuner, A., Marino, R., Sgarbossa, P., Lucibello, M., Tosi, A. L., Keller, F., Campana, L. G., & Signori, E. (2019). A Novel 3D Scaffold for Cell Growth to Assess Electroporation Efficacy. Cells, 8(11), 1470. https://doi.org/10.3390/cells8111470