Article

Akt1 and Akt2 Isoforms Play Distinct Roles in Regulating the Development of Inflammation and Fibrosis Associated with Alcoholic Liver Disease

1
Lipid Research Laboratory, VA Medical Center, Washington, DC 98100, USA
2
Department of Biochemistry and Molecular Medicine, The George Washington University Medical Center, Washington, DC 20037, USA
3
Department of Biology, The Catholic University of America, Washington, DC 20064, USA
4
Laboratory of Hepatic Diseases; Catedras-CONACYT and National Institute of Genomic Medicine (INMEGEN), CDMX 64460, Mexico
*
Author to whom correspondence should be addressed.
Cells 2019, 8(11), 1337; https://doi.org/10.3390/cells8111337
Submission received: 2 September 2019 / Revised: 11 October 2019 / Accepted: 21 October 2019 / Published: 29 October 2019

Abstract

:
Akt kinase isoforms (Akt1, Akt2, and Akt3) have generally been thought to play overlapping roles in phosphoinositide 3-kinase (PI3K)-mediated-signaling. However, recent studies have suggested that they display isoform-specific roles in muscle and fat. To determine whether such isoform-specificity is observed with respect to alcoholic liver disease (ALD) progression, we examined the role of Akt1, Akt2, and Akt3 in hepatic inflammation, and pro-fibrogenic proliferation and migration using Kupffer cells, hepatic stellate cells (HSC), and hepatocytes in an ethanol and lipopolysaccharide (LPS)-induced two-hit model in vitro and in vivo. We determined that siRNA-directed silencing of Akt2, but not Akt1, significantly suppressed cell inflammatory markers in HSC and Kupffer cells. Although both Akt1 and Akt2 inhibited cell proliferation in HSC, only Akt2 inhibited cell migration. Both Akt1 and Akt2, but not Akt3, inhibited fibrogenesis in hepatocytes and HSC. In addition, our in vivo results show that administration of chronic ethanol, binge ethanol and LPS (EBL) in wild-type C57BL/6 mice activated all three Akt isoforms with concomitant increases in activated forms of phosphoinositide dependent kinase-1 (PDK1), mammalian target-of-rapamycin complex 2 (mTORC2), and PI3K, resulting in upregulation in expression of inflammatory, proliferative, and fibrogenic genes. Moreover, pharmacological blocking of Akt2, but not Akt1, inhibited EBL-induced inflammation while blocking of both Akt1 and Akt2 inhibited pro-fibrogenic marker expression and progression of fibrosis. Our findings indicate that Akt isoforms play unique roles in inflammation, cell proliferation, migration, and fibrogenesis during EBL-induced liver injury. Thus, close attention must be paid when targeting all Akt isoforms as a therapeutic intervention.

1. Introduction

Chronic alcohol abuse resulting in alcoholic liver disease (ALD) is one of the leading causes of morbidity and mortality worldwide [1]. Long-term excessive alcohol consumption can cause alcoholic steatohepatitis, which is accompanied by steatosis, hepatocyte necrosis, and inflammation [2] that further promotes a wound healing response and the deposition of extracellular matrix (ECM) resulting in fibrosis and eventually cirrhosis. Despite the many advances made in understanding the molecular mechanisms involved in the development of the disease, liver transplantation remains the only treatment for end-stage liver disease [3]. Therefore, there is an urgent need to find novel actionable targets that contribute to the development of inflammation and fibrosis during ALD.
The activities of the different liver cells types including hepatocytes, Kupffer cells, and hepatic stellate cells (HSC) contribute to the progression of ALD. Epidemiological studies further suggest that ethanol alone is not enough to cause advanced ALD and other insults such as lipopolysaccharide (LPS) are necessary for the disease to progress from steatohepatitis to fibrosis and ultimately cirrhosis [4,5]. It is known that LPS is often elevated in alcoholic patients as well as in various animal models of alcoholic liver injury [5,6]. Thus, the well-accepted model of chronic ethanol and LPS-induced fibrosis in mouse liver is referred to as a “two hit” model of ALD [7,8]. In this model, ethanol acts as the first hit and gets oxidized to its toxic metabolite, acetaldehyde in hepatocytes [9], while ethanol-induced leaky gut leads to increased LPS that acts as the second hit to activate nuclear factor kappa B (NFκB) signaling in Kupffer cells and the production of the proinflammatory cytokines [10,11,12]. Together, this leads to the activation of HSC resulting in a pro-fibrogenic cascade promoting fibrosis [13,14,15,16,17,18,19,20].
Akt, also known as protein kinase B, is a serine/threonine protein kinase that plays a central role in all aspects of the development of ALD process, including promoting cell proliferation, migration, and transcription while impairing apoptosis. The Akt family of kinases consists of three distinct isoforms named Akt1, Akt2, and Akt3. Separate genes encode these isoforms. They share a high degree of amino acid homology and are presumably activated by similar signaling pathways in a PI3K- dependent manner [21]. The production of phosphatidylinositol (3,4,5)-triphosphate (PIP3) by PI3K in the plasma membrane leads to Akt activation via phosphorylation by phosphoinositide-dependent kinase-1 (PDK1) on distinct residues on Akt1 (T308, T450), Akt2 (T309), and Akt3 (T305) [22]. The three kinases are also activated by phosphorylation on residues serine S473 for Akt1, S474 for Akt2, and S472 for Akt3 by mammalian target of rapamycin complex 2 (mTORC2) [23,24,25,26].
The Akt kinases have been the subject of extensive investigation and it is generally assumed that they play redundant and overlapping roles. However, a handful of studies suggest the kinases have distinct functions. For example, mice lacking Akt1 display enhanced apoptosis and growth retardation [27], whereas Akt2 knockdown mice display a diabetic phenotype with insulin resistance [28]. In contrast, the role of the brain-enriched isoform, Akt3, remains unclear. Akt1 and Akt2 have also been shown to play opposite roles in regulating migration and invasion in breast cancer [29] while they both inhibit prostate cancer cell migration and invasion [30,31]. At present, very little is known about Akt functions in the liver and with respect to alcoholic liver injury. Thus, the present study was designed to identify the isoform-specific roles of Akt in inflammation and fibrogenesis in ethanol and LPS-induced liver injury.

2. Materials and Methods

Animals and Diet: Eight-week-old, wild-type female (females are more susceptible to alcohol-induced liver damage than males) C57BL/6 mice (~25 g body weight) from Charles River, Wilmington, MA were housed in pairs in plastic cages, in a temperature-controlled room at 25 °C with 12 h light–dark cycle. All animals were fed a pelleted commercial diet (Purina Rodent Chow, #500, TMI Nutrition, St. Louis, MO, USA) during the first week of acclimation. Experiments were performed according to the approved institutional animal care and use committee protocol. Mice were randomly divided into 7 groups of 4 rats each, and were pair-fed Lieber DeCarli control or ethanol liquid diets (36% total fat calories) with high-ω3 fatty acids (14.1% of calories as ω3 fatty acids) fish oil for 4 weeks. The diets are isocaloric and their formulations are according to the modified method of Lieber and DeCarli [32] with the recommended normal nutrients, vitamins, and minerals according to the AIN-93 diet. Thus, 36% of the total energy of ethanol diet is from fat, 20% from protein, 36% from ethanol, and the rest from carbohydrate. The corresponding isocaloric control diet has isoenergetic amounts of dextrin-maltose in place of ethanol. Ethanol concentrations in the liquid diet were gradually increased starting at 1% on day 1, reaching 5% over a seven-day period to allow the animals to adapt. The mice fed with ethanol diets were also administered a single dose of 5 g/kg body weight of ethanol by gavage in the absence or presence of LPS (2 mg/kg body weight, i.p.) 6 h prior to euthanizing the animal. This two-hits model of ethanol binge and LPS (EBL)-induced liver injury was adapted from the two-hit ethanol/LPS model described by Hoek et al. [8] and ethanol/binge model by Bertola et al. [7]. The selective Akt1 inhibitor, A674563 (Selleckchem, Houston, TX, USA) (20 mg/kg i.p) was dissolved in 5% dextrose, the Akt2 inhibitor, CCT128930 (Selleckchem) (50 mg/kg i.p) was dissolved in 10% DMSO, 5% Tween 20, and 85% saline. They were administered as daily doses for 1 week prior to LPS administration [33,34,35,36]. Efficiency of Akt1 and Akt2 inhibition in a EBL in vivo mouse model is shown in supplementary Figure S2.
Cell Culture. Primary human HSC were isolated as described by collagenase and protease digestion and fractionation on an Optiprep (Sigma, Saint Louis, MO, USA) gradient from human liver biopsies of patients with morbid obesity by an approved protocol (IRB 070701). Activated HSC were grown to confluence in Dulbecco’s modified Eagle’s medium (Gibco; Invitrogen, Grand Island, NY, USA), supplemented with 10% (v/v) fetal bovine serum (FBS), 1% (v/v) amino acids (Cellgro, Herndon, VA, USA), and 1% (v/v) penicillin/streptomycin (Gibco; Invitrogen). HSC were treated with 200 μM of acetaldehyde and/or 1 μg/mL of LPS for 3 h and maintained at 37 °C in a 5% CO2 humidifier incubator. Human Kupffer Cells that express CYP2E1 were obtained from Life Technologies, Grand Island, NY (# HUKCCS, USA). VL17A hepatocytes were provided by Dr. Dahn L Clemens from the Liver Study Unit, VA Medical Center (Omaha, Nebraska, USA). VL17A cells (HepG2 cells that constitutively express both cytochrome P450 2E1 (CYP2E1) and alcohol dehydrogenase (ADH) were generated as described [37]. Kupffer Cells and VL17A hepatocytes were grown to confluence in Dulbecco’s modified Eagle’s medium F12, from ATCC (Manassas, VA, USA) supplemented with 10% (v/v) fetal bovine serum (FBS), 1% (v/v) amino acids (Cellgro, Herndon, VA, USA), and 1% (v/v) penicillin/streptomycin. (Gibco; Invitrogen). VL17A hepatocytes were also supplemented with 5 mg/L insulin-transferrin-sodium selenite (ITS, Roche, Branchburg, NJ, USA) and dexamethasone 10−7 M (Sigma). Geneticin and Zeocin (400 mg/l; Life Technologies, Grand Island, NY, USA) were added to the culture media as selective antibiotics. Kupffer cells and VL17A hepatocytes were exposed to 100 mM ethanol for 72 h [11,12,38]. Cells were also treated with 100 μg/mL of LPS [39] for 3 h, in the absence or presence of acetaldehyde or ethanol. Cultures were maintained in fetal bovine serum-containing medium until 16 h before start of the experiments. They were washed with phosphate buffered saline (PBS) and the medium was replaced with serum-free medium containing 0.1% fetal bovine serum. Cells were treated and maintained at 37 °C in a 5% CO2 humidifier incubator.
Akt1 and Akt2 siRNA Transfection: The individual Akts were selectively silenced in HSC, Kupffer cells, and VL17A cell cultures by transfecting with 50 nM of the respective siGENOME SMART pool human Akt1 or Akt2 and siControl: Non-targeting siRNA pool (GE Healthcare life and science, Pittsburg, PA, M-003000, M-003001, and D-001206, respectively) using DharmaFECT1 transfection reagent (Thermo Scientific, T-2001-03) according to the manufacturer’s instructions. After verifying knock-down of each Akt isoform by using Western Blot (transfection efficiency >90%), the respective specific Akt-isoform silenced HSC were exposed to clinically relevant concentrations of acetaldehyde (200 µM) for 24 h [40], whereas silenced Kupffer cells and VL17A hepatocytes were exposed to 100 mM ethanol for 72 h [11,12,38]. Sealed parafilm was used to minimize evaporation of the volatile acetaldehyde and ethanol. Cells were also treated with 100 μg/mL of LPS [39] for 3 h, in the absence or presence of acetaldehyde or ethanol. Efficiency of Akt1, Akt2, and Akt3 transfection is shown in supplementary Figure S2.
AST and ALT Measurement: Plasma alanine aminotransferase (ALT) and aspartate aminotransferase (AST) were measured using commercial kits according to the manufacturer’s instructions (Teco Diagnostics, Anaheim, CA, USA).
Total, Nuclear, and Cytosolic Protein Extraction: Total protein was extracted from liver or cultured cells by homogenization in lysis buffer containing 1 mol/L Tris (pH 8), 5 mol/L NaCl, 0.5 mol/L EDTA, 0.5 mol/L NaF, 100 mmol/L sodium pyrophosphate, 100 mmol/L Na3VO4 and, 200 mmol/L phenylmethylsulfonyl fluoride. Nuclear and cytosolic fractions were isolated using a commercial kit (Thermo Scientific, Rockford, IL, USA).
SDS-PAGE and Western Blot Analysis: Protein concentrations were determined using the bicinchoninic acid assay (Pierce Chemical Rockford, IL. USA). For Western Blots, antibodies against p-PI3K, p-PDK1, p-mTOR, NFκB-p65, IκB, and PDGFβR were purchased from Cell Signaling (Danvers, MA, USA); antibodies against Akt1, Akt2, Akt3, p-IκB, αSMA, fibronectin, and lamin B1 were obtained from Abcam (Cambridge, MA, USA); and antibodies against collagen1α2 and β-actin were purchased from Santa Cruz Biotechnologies (Santa Cruz, CA, USA) and Aldrich-Sigma, respectively. Proteins were detected with a NEN Life Science Products Renaissance enhanced chemiluminescence system (PerkinElmer, Waltham, MA, USA) according to the manufacturer’s recommendations.
RNA Extraction and Quantitative RT-PCR: RNA from liver tissue or cultured cells was extracted using TriZol reagent (Life Technologies, Carlsbad, CA, USA). cDNA templates were synthesized and quantitative RT-PCR was performed as previously described [41]. 40S ribosomal protein Gapdh was used as the standard gene. Ratios of the target gene and Gapdh gene expression levels were calculated by subtracting the threshold cycle number (Ct) of the target gene from the Ct of 40S ribosomal protein Gapdh and raising to the power of the negative of this difference. Target gene expression is expressed relative to 40S ribosomal protein Gapdh gene expression.
Hydroxyproline Assay: Hydroxyproline content in liver tissue was measured colorimetrically using a commercial kit (Sigma).
MTT Proliferation Assay: HSC proliferation was assessed using the 3-(4,5-dimethylthiazol-2-yl)-2,5-diphenyl tetrazolium bromide (MTT) assay. Cells were plated in 96-well tissue culture plates at a concentration of 3000 cells/well. After 24 h of quiescence, the cells were cultured for 24 h or 48 h with media containing 0.1% fetal bovine serum. At the end of the treatment, 20 μL MTT solution (5 mg/mL in PBS) was added to each well and incubated for an additional 2 h at 37 °C. The colored formazan product was then dissolved in 150 μL of MTT solvent (4 mmol/L HCl and 0.1% Nonidet P-40 in isopropanol) and detected in a plate reader at 570 nm absorbance.
Migration Assay: Cell migration was measured in a scratch-wound assay. The human HSC were grown to confluence and were then serum-deprived for 24 h. After the medium was removed, a scratch wound was inflicted in a straight line with a pipette tip. The plates were then rinsed with PBS and incubated with Dulbecco’s modified Eagle’s medium supplemented with acetaldehyde and/or LPS. Wound closure was visualized and photographed after 24 h using a light microscope. Images were analyzed using Adobe Photoshop CS (Adobe Systems Inc., San Jose, CA, USA). The gap distances between the gap of migrating HSC were measured.
Statistical Analysis: All experiments were performed in triplicate and data are expressed as mean ± SE. Statistical differences between experimental groups were analyzed by the Student’s t-test and p ≤ 0.05 was considered significant.

3. Results

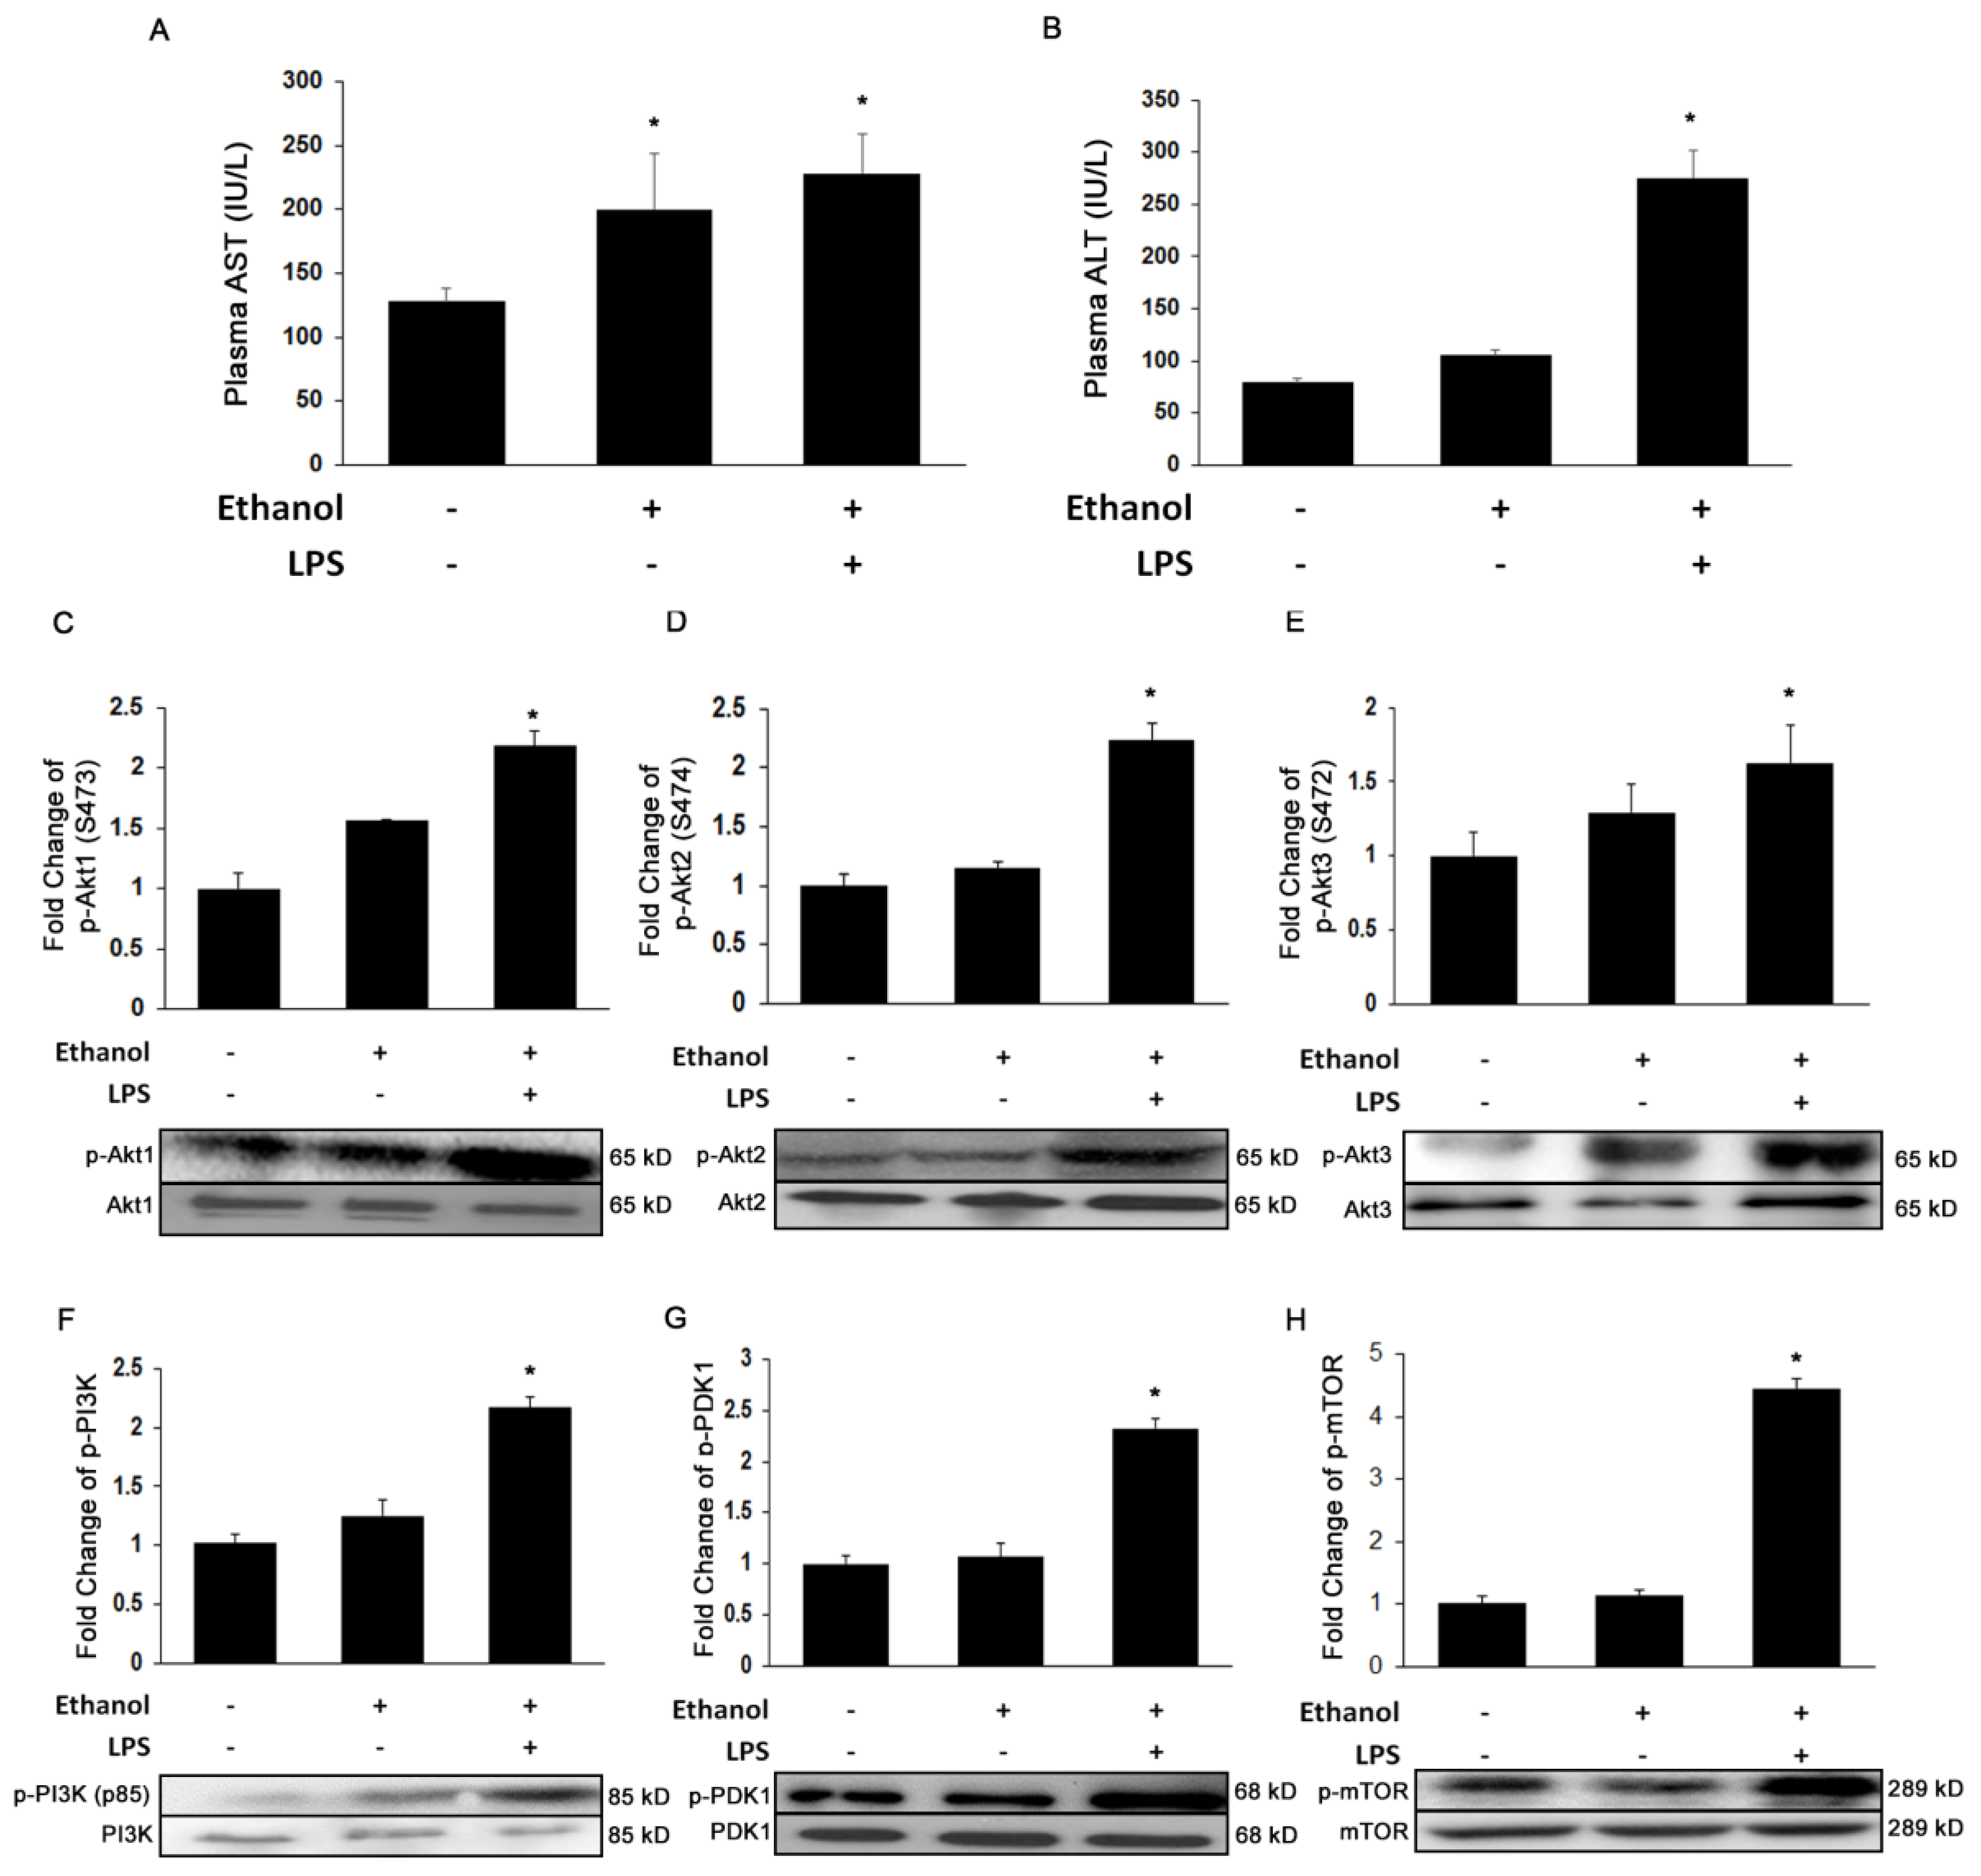
3.1. Ethanol and LPS Induce Liver Injury and Activate Akt Signaling Pathways

To determine whether ethanol and LPS effectively induce significant liver injury, we measured the injury markers, AST and ALT. As shown in Figure 1A, ethanol alone or with LPS significantly increased plasma AST levels by 1.6-fold and 1.8-fold (p ≤ 0.05), respectively. Similarly, plasma ALT levels were also markedly increased by 1.2-fold by ethanol alone, and to an even higher extent with added LPS (3.4-fold, p ≤ 0.05) (Figure 1B). To further investigate if ethanol and LPS-induced liver injury results in Akt activation, we evaluated protein phosphorylation of the three Akt isoforms and the phosphorylation status of the kinases that activate Akt. Ethanol alone or in combination with LPS significantly increased the expression of all three Akt isoforms by ~2-fold (Figure 1C,E) accompanied by corresponding increases in the phosphorylation of PI3K, PDK1, and mTOR by 2-, 2.5-, and 4-fold (p ≤ 0.05), respectively (Figure 1F,H).

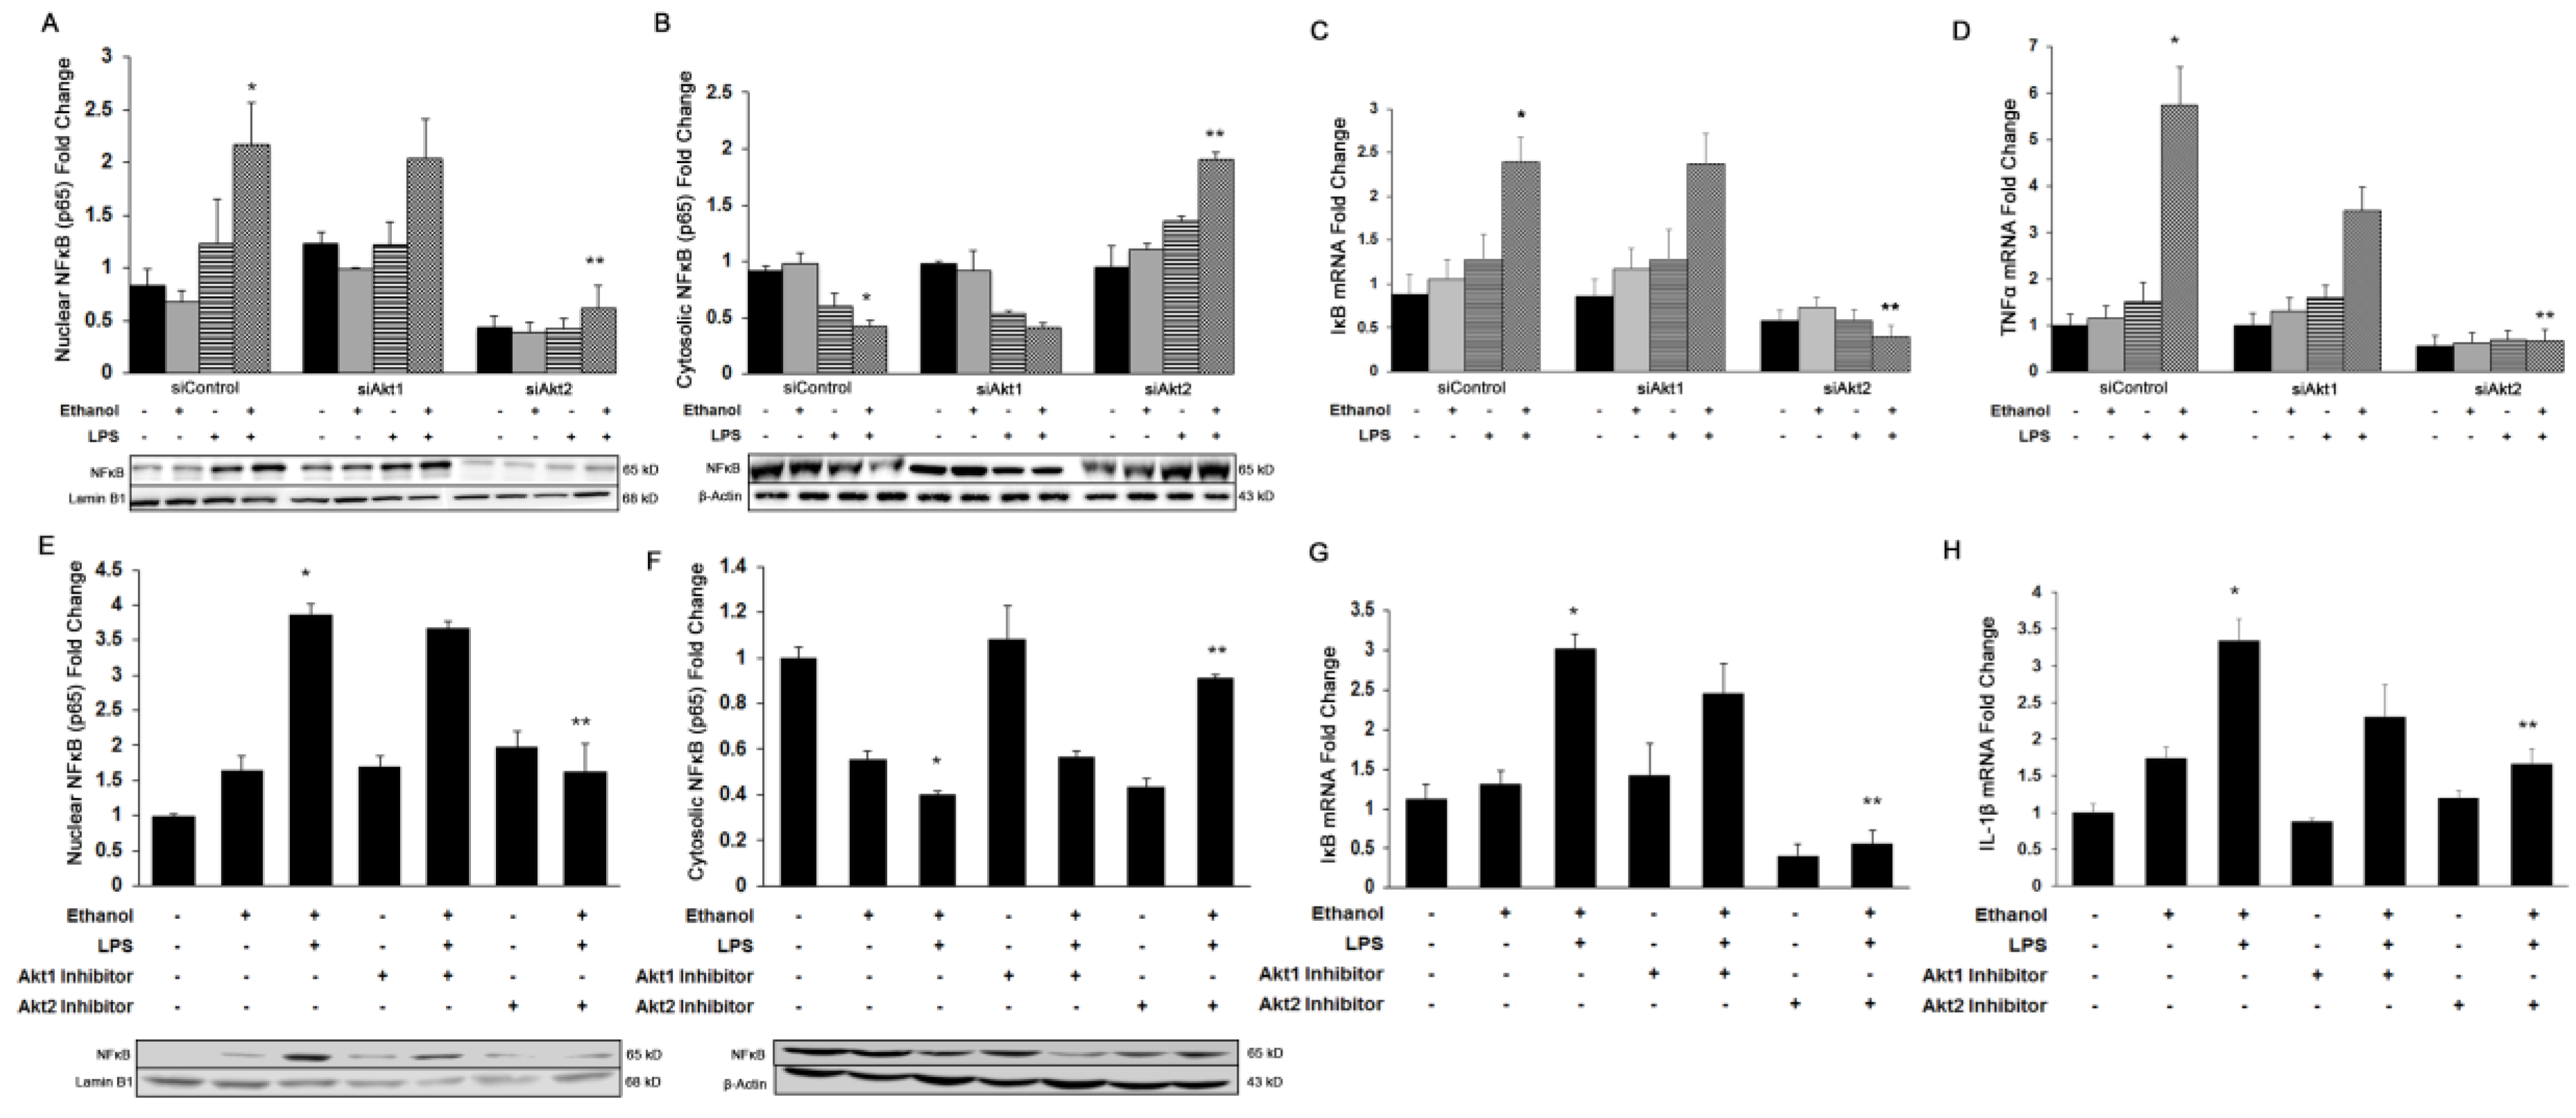
3.2. Akt2, But Not Akt1, Is Involved in Ethanol and LPS-Induced Nuclear Translocation of NFκB-p65 and Induction of Pro-Inflammatory Cytokines In Vitro and In Vivo

It is well known that ethanol and LPS-mediated activation of Akt signaling plays a crucial role in the onset of inflammation [42]. To identify the Akt isoform-specific role in the induction of an inflammatory response during liver injury, we used both in vivo inhibition and in vitro silencing of Akt1 and Akt2 isoforms in Kupffer cells. Because silencing of Akt3 did not alter ethanol and LPS- mediated liver damage, we did not include these data in this study. In cultured Kupffer cells, added ethanol and LPS increased the nuclear translocation of NFκB-p65 by 2.4-fold (p ≤ 0.05) (Figure 2A) with a reciprocal 50% decrease in cytosolic NFκB-p65 (p ≤ 0.05) (Figure 2B). These changes were associated with a significant increase in the gene expression of IκB by 2.4-fold (p ≤ 0.05) (Figure 2C), and resulted in the up-regulation of TNFα mRNA levels by 5.5-fold (p ≤ 0.05) (Figure 2D). Importantly, silencing of only the Akt2 isoform significantly decreased the expression of Iκb gene expression, and significantly inhibited NFκB-p65 activation by 80%, resulting in the down-regulation of TNFα mRNA by 90% (p ≤ 0.05). Similarly, in the in vivo mouse model of ethanol and LPS-induced liver injury, ethanol alone or in combination with LPS significantly increased nuclear translocation of NFκB-p65 by 2-fold and 3-fold (p ≤ 0.05), respectively (Figure 2D). Also, as seen in vitro, treatment with only the Akt2 inhibitor decreased nuclear translocation of NFκB-p65 by 50% (p ≤ 0.05) (Figure 2D). Ethanol alone or with LPS also significantly up-regulated gene expression of the pro-inflammatory cytokine, IL-1β by 1.7-fold (p ≤ 0.05) and 3.3-fold (p ≤ 0.05). Only mice treated with the Akt2 inhibitor showed a marked down-regulation of IL-1β mRNA by 50% (p ≤ 0.05) in mice additionally treated with ethanol and LPS (Figure 2E). These results indicate that only Akt2 plays a critical role in regulating the inflammatory process during ALD.

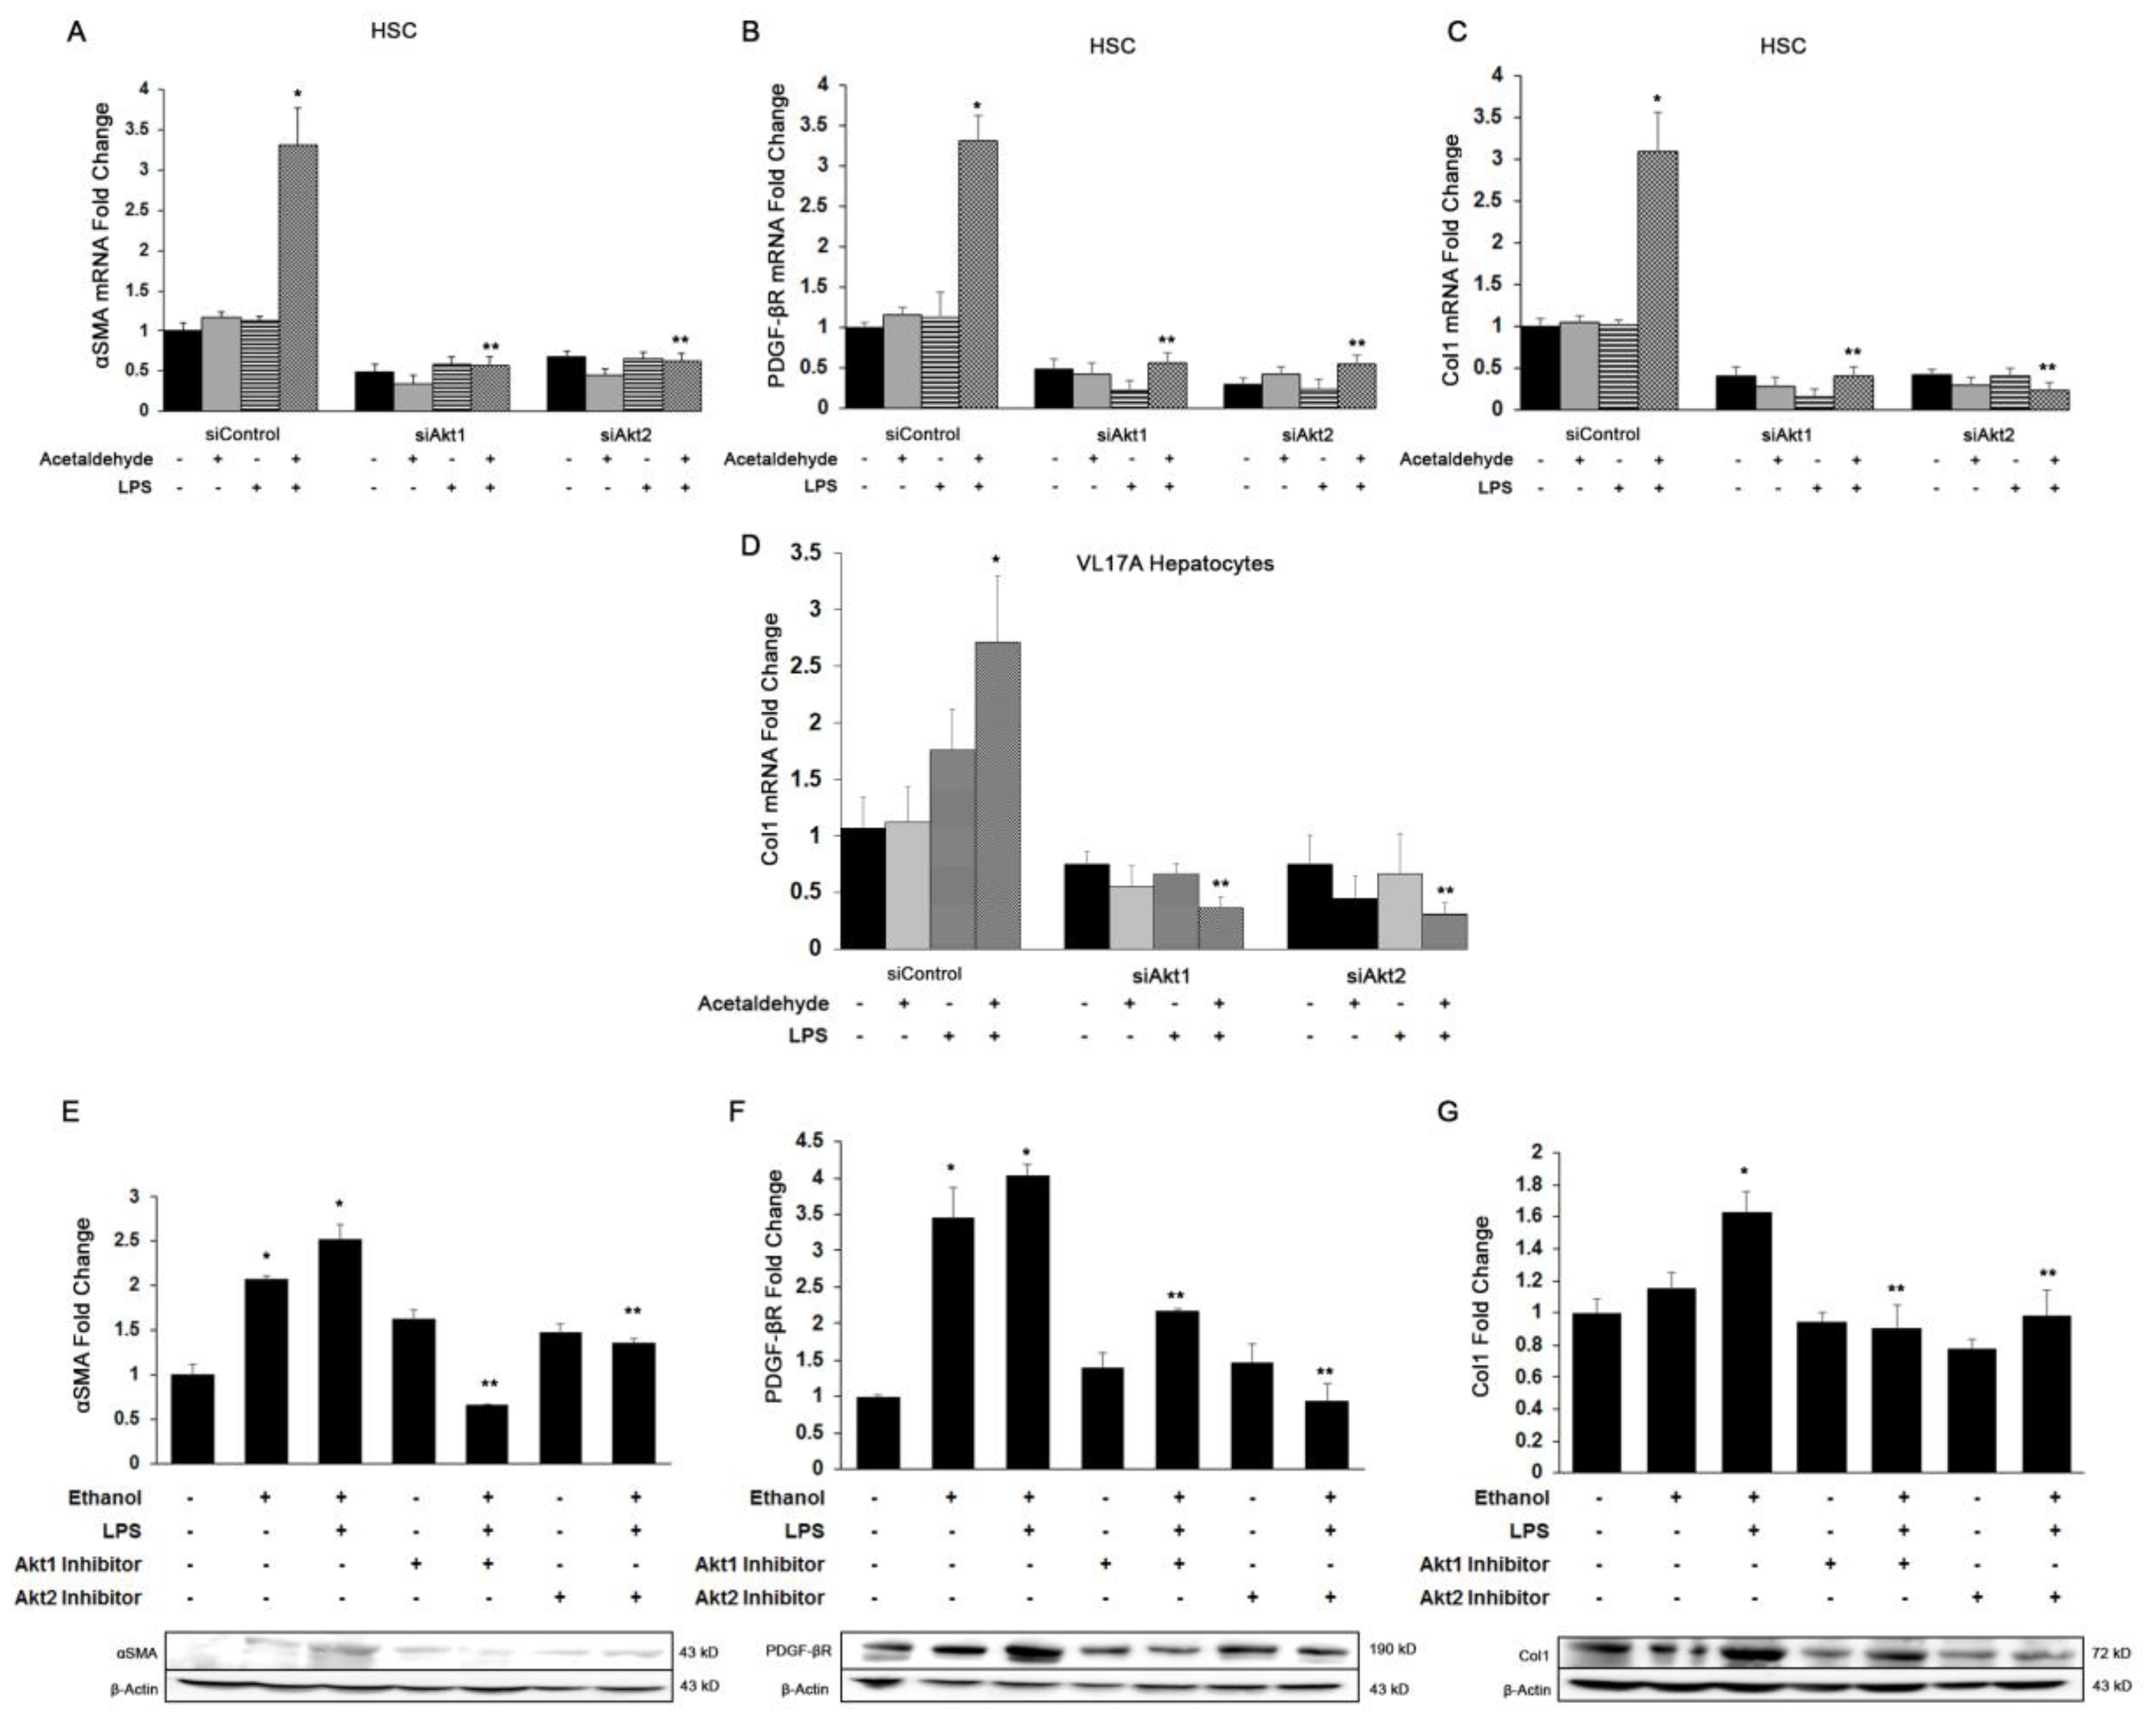
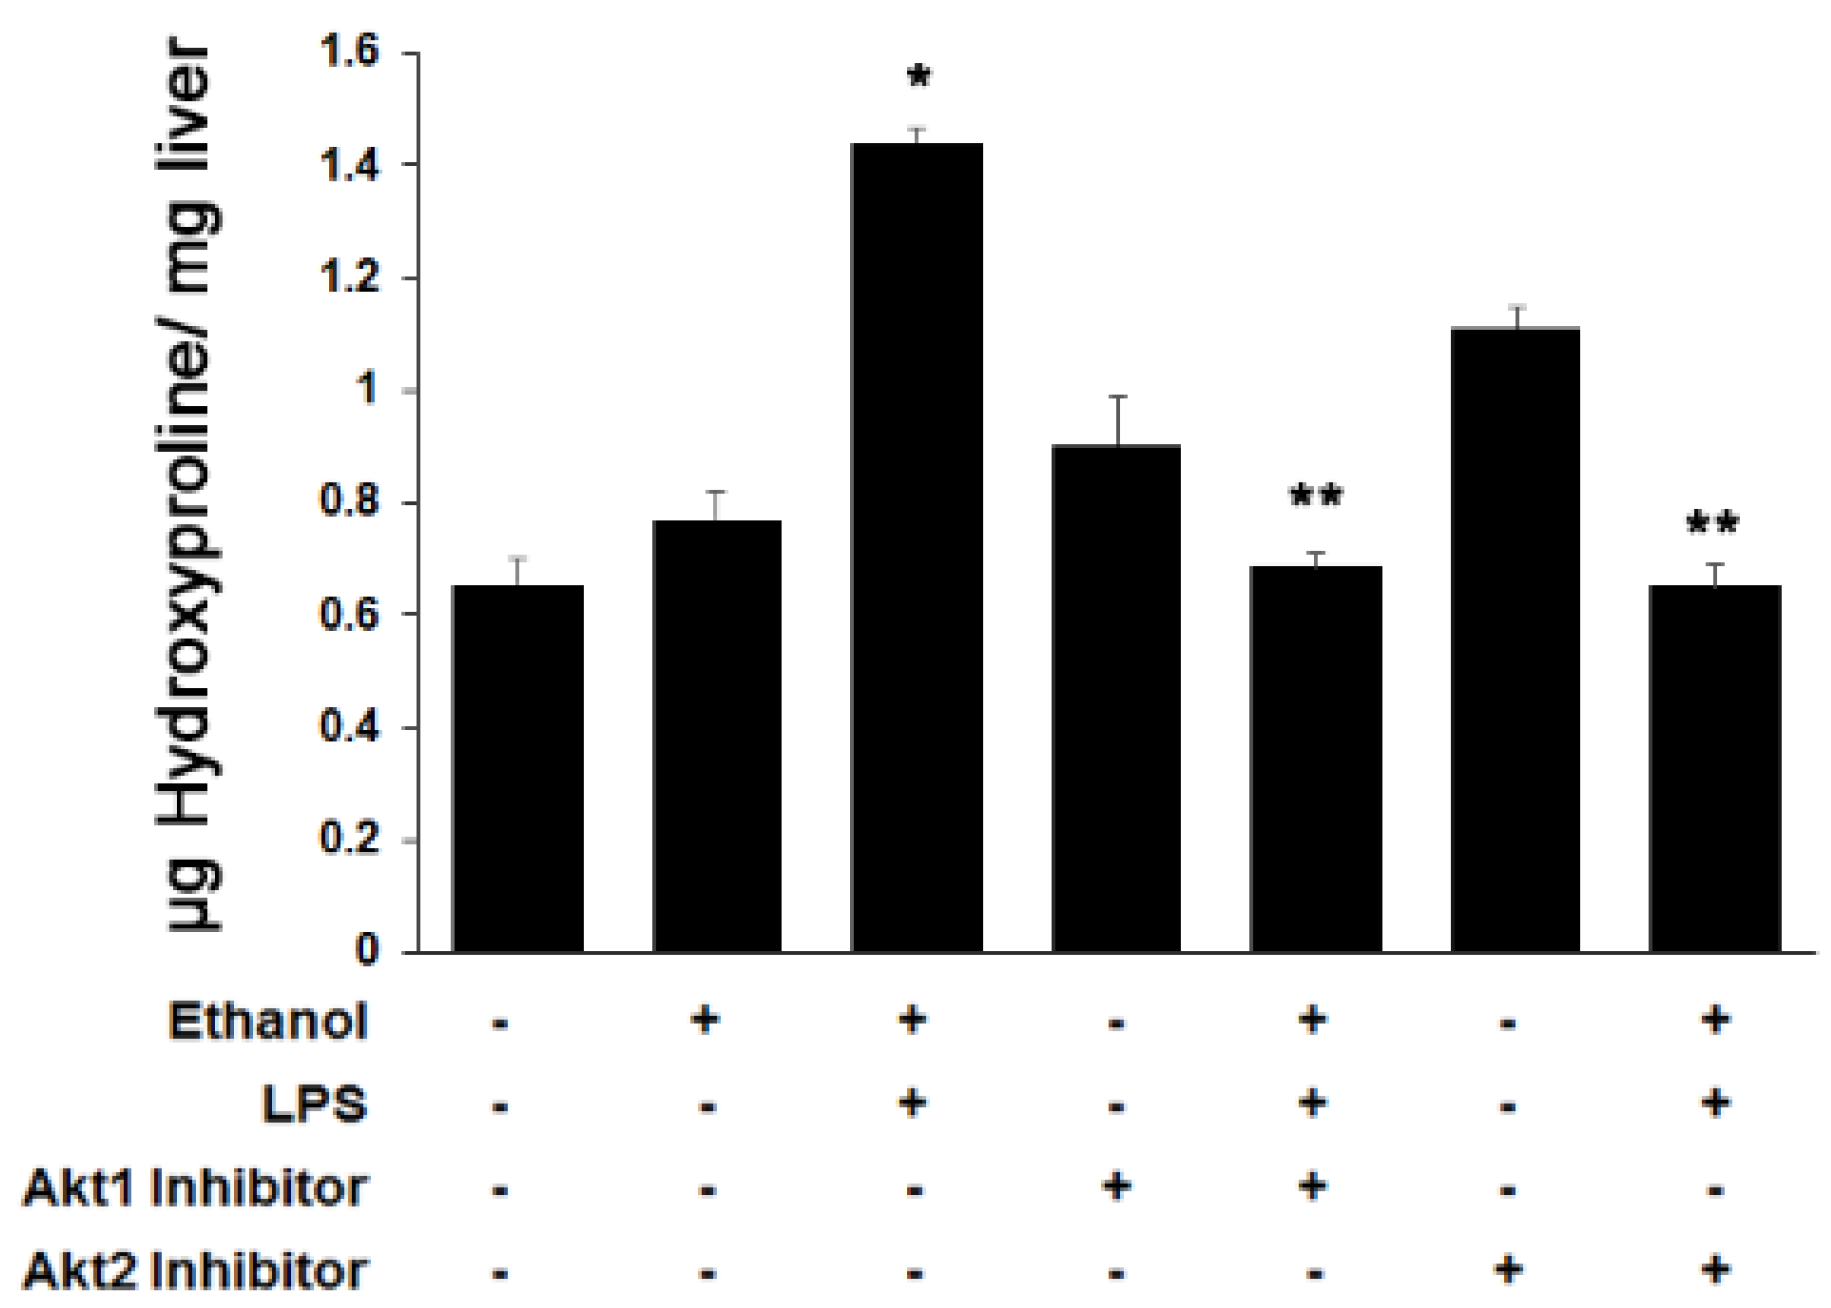
3.3. Both Akt1 and Akt2 Are Involved in Ethanol and LPS Induced Fibrosis

Acetaldehyde generated from ethanol oxidation along with the secretion of several growth factors and pro-inflammatory cytokines by Kupffer cells can lead to fibrosis via trans-differentiation of HSC into myofibroblasts [43]. Therefore, we determined the effect of Akt isoform-specific silencing on ethanol and LPS-mediated fibrogenesis. Because HSC display negligible alcohol dehydrogenase activity, we added physiologically relevant concentrations of acetaldehyde (the immediate metabolic product of ethanol oxidation) to the HSC cultures. As shown in Figure 3A–C, acetaldehyde and LPS up-regulated the expression of smooth muscle actin (αSma), platelet-derived growth factor receptor (Pdgfβr), and collagen1 (Col1α1) mRNA by 2.5-, 3-, and 4-fold, respectively, in HSC cultures. Knockdown of either Akt1 or Akt2 significantly inhibited the acetaldehyde and LPS-mediated effect on expression of αSMA by 50% and 80%, respectively, PDGFβR by 90%, and Col1α1 by 90% and 95%, respectively. Since hepatocytes also contribute to collagen production in early fibrosis, we measured Col1α1 mRNA in VL17A hepatocytes. Similarly, ethanol and LPS induced expression of Col1α1 mRNA in VL17A hepatocytes by 3.4-fold, and knockdown of Akt1 or Akt2 significantly inhibited the ethanol and LPS effect by about 80% (Figure 3D). Consistent with the in vitro findings, ethanol alone or in combination with LPS in mice significantly induced the protein expression of the pro-fibrogenic markers by 2- to 4-fold (p ≤ 0.05) (Figure 3E–G). Treatment with either the Akt1 or Akt2 inhibitor led to a significant decrease in the expression of αSMA by 74% or 46% (p ≤ 0.05), PDGFβR by 46% or 76% (p ≤ 0.05), and Col1 by 45% or 40% (p ≤ 0.05), respectively. Furthermore, as shown in Figure 4, hydroxyproline, another marker of fibrosis, was increased 1.3-fold (p ≤ 0.05) in animals treated with ethanol alone or up to 2.3-fold (p ≤ 0.05) with added LPS (p ≤ 0.05). Treatment with either the Akt1 or Akt2 inhibitor completely blocked this effect. Akt1 or Akt2 inhibitors prevented the ethanol and LPS-induced effect, thus reducing the extent of fibrosis. Together, these results indicate that both Akt1 and Akt2 are involved in ethanol and LPS-mediated hepatic fibrosis.

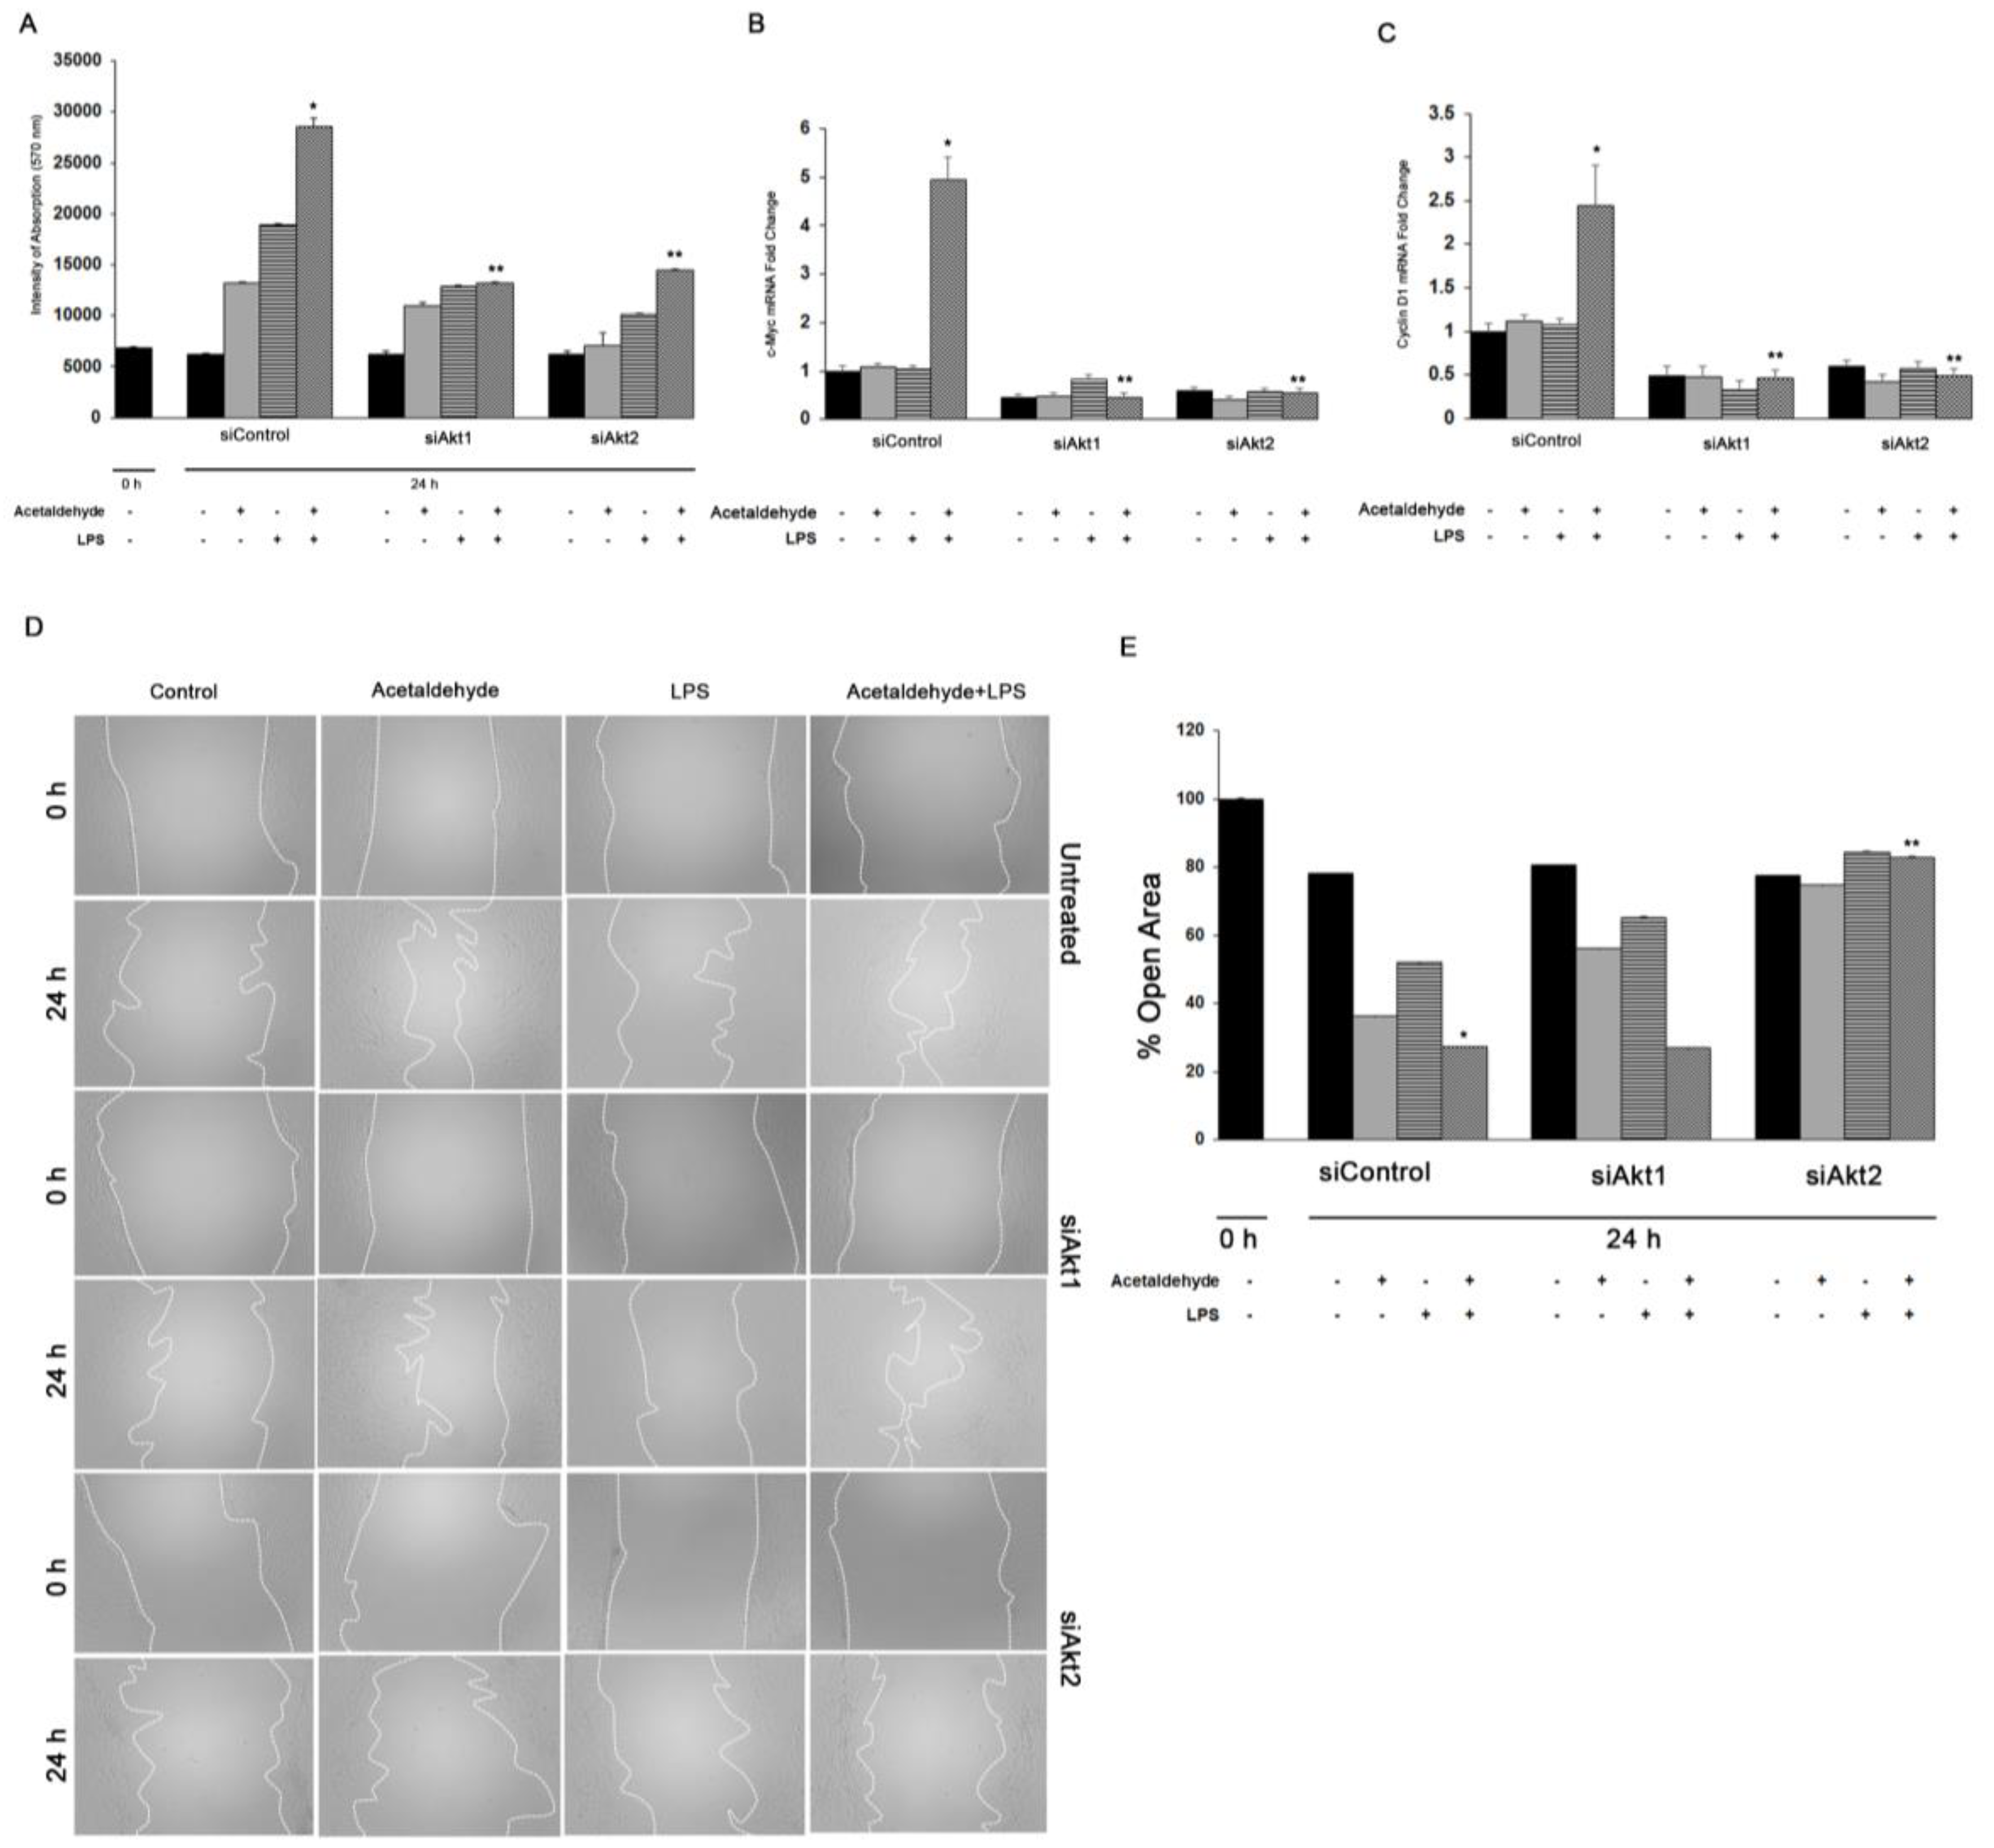
3.4. Akt1 and Akt2 Are Involved in HSC Proliferation, but Only Akt2 Regulates Migration

We have previously shown that the expression of PDGFβR and the activation of Akt signaling lead to HSC proliferation [44]. Therefore, we examined the effect of Akt1 or Akt2 silencing on acetaldehyde and LPS-mediated HSC proliferation. As shown in Figure 5A, acetaldehyde and LPS alone induced a 2-fold or 2.5-fold increase, respectively, in HSC proliferation. The combination of acetaldehyde and LPS induced an even greater increase in HSC proliferation by up to 3.5-fold. Knockdown of either Akt1 or Akt2 inhibited proliferation by ~55% (Figure 5A). Additionally, the combination of acetaldehyde and LPS significantly up-regulated expression of the cell cycle regulating genes, cMyc and cyclin D1, by 5-fold and 2.5-fold, respectively. Akt1 or Akt2 silencing markedly downregulated the mRNA levels of cMyc and Cyclin D1 by ~90% (Figure 5B,C).
As shown in Figure 5D,E, acetaldehyde and LPS also induced HSC migration resulting in wound closure after 24 h by 63% and 48% respectively, compared to control with closure of only 22%. Acetaldehyde and LPS treatment led to a further increase in migration with 73% of the wound closed at 24 h. Silencing of Akt1 did not alter HSC migration when compared to cells treated with the scrambled siRNA. In contrast, there was a significant decrease in HSC migration in cells silenced for Akt2, to only 17% of that observed in cells treated with both acetaldehyde and LPS. Together, these results reflect the functional specificity between of Akt1 and Akt2 in mediating HSC proliferation and migration.

4. Discussion

To our knowledge, this is the first study to examine the specific roles of the Akt isoforms in regulating chronic alcohol-mediated pathogenesis of ALD. While both Akt1 and Akt2 isoforms were found to regulate fibrogenesis and proliferation in hepatocytes and HSC, only Akt2 differentially regulated inflammation and migration. Interestingly, Akt3 was not found to play a specific role in these cellular processes.
Although the three Akt isoforms share a high degree of structural homology (81% amino acid identity with Akt2 and 83% with Akt3) [21], accumulating evidence suggests that Akt1 and Akt2 are ubiquitously expressed [45], whereas, Akt3 is enriched in the brain and testes and that each isoform is differentially implicated in the pathogenesis of various diseases [46,47,48,49].
Our results showed that Akt3 knockout does not alter ethanol and LPS-induced inflammation or fibrosis. However, ethanol and LPS do induce the expression of Akt3 in the liver, suggesting that this isoform may play a redundant or presently unidentified role in the two-hit model of alcohol-induced hepatic inflammation and fibrosis [48,49].
During alcoholic liver injury, LPS stimulates Kupffer cells, via Toll-like receptor 4 binding and activation of the Akt/NFκB signaling pathway leading to the generation of pro-inflammatory cytokines [13,14]. More recently, the specific involvement of Akt1 and Akt2 in eliciting an inflammatory response in various tissues and diseases has been reported. For example, Di Lorenzo et al. have demonstrated that Akt1 is critical for acute inflammation and histamine-mediated vascular leakage [50]. On the other hand, Arranz et al. found that Akt2, but not Akt1, ablation protected against dextran sulfate sodium-induced inflammatory bowel disease in mice [51]. Similarly, only Akt2 deficiency attenuated bleomycin-induced pulmonary inflammation [52]. Our results show that ethanol and LPS-induced activation of IκB, NFκB translocation to the nucleus, and the consequent production of the pro-inflammatory cytokines: TNFα, IL1β, in Kupffer cell cultures, and in the EBL mouse model. Deletion of only Akt2 protected against ethanol and LPS-induced inflammatory response, suggesting that only this isoform plays a critical role in the development of liver inflammation associated with ALD.
Ethanol and LPS and/or acetaldehyde and LPS also upregulated the fibrogenic markers, PDGFβR and αSMA, and collagen. Blocking of both Akt1 and Akt2 reversed the effect, both in culture and in the EBL mouse model, suggesting that both isoforms play an active role in fibrogenesis. This is consistent with results from Bibaki et al., which demonstrated that miR-29a, miR-185, and their targets Akt1 and Akt2, were involved in the development of idiopathic pulmonary fibrosis and lung cancer [53]. However, Lan et al. showed that only Akt2 was involved in renal fibrosis [54]. In contrast, Ock et al. showed that neither cardiac fibrosis nor apoptosis was detected in Akt1−/−/Akt2 knockout hearts [55]. Thus, the participation of Akt1 and/or Akt2 in the pathogenesis of fibrosis likely varies among cell types and pathogenic states.
Proliferation and migration of HSC during hepatic injury is essential for wound healing and fibrosis of the liver [44,56]. Our results also revealed that acetaldehyde and LPS administration caused a significant increase in proliferation and migration of HSC. Silencing of Akt1 and Akt2 decreased acetaldehyde and LPS-mediated proliferation and decreased mRNA and protein expression of cell cycle regulating genes. However, only knockdown of Akt2 inhibited HSC migration. In contrast, Virtakoivu et al. showed that both Akt1 and Akt2 negatively regulated prostate cancer migration and invasion [30]. Thus, it is evident that Akt isoforms exhibit functional redundancy as expected, but also have non-redundant physiological activities that vary among tissue types.
Taken together, these data indicate that Akt family members differentially regulate specific functions during ALD, in vivo and in vitro. These results imply that differential expression, activation, or localization of the isoforms may play dominant roles in determining isoform-specific functions. However, differences in enzyme activity and/or substrate specificity may also contribute to the differential effects of Akt isoforms on regulating a wide range of cellular processes, including inflammation, fibrosis cell proliferation, and migration. It is important to note that the basis of isoform-specific signaling is likely to vary depending on the type of cell or tissue. Indeed, recent studies suggest that the substrates targeted by different AKT isoforms can vary depending on cellular and tissue context [57].
While the clinical ramifications of acute and chronic ethanol exposure are well known, the current explanations of cellular mechanisms leading to tissue damage and alcohol-related gene expression patterns lag. Our present study suggests that each Akt isoform plays a unique role in the development of inflammation, cell proliferation, migration, and fibrogenesis during alcoholic liver injury. Our study reveals a better understanding of the basic pathophysiology of the signaling pathways associated with ALD progression and may lead to designing selective new therapies against actionable targets to treat alcoholic patients.

Supplementary Materials

The following are available online at https://www.mdpi.com/2073-4409/8/11/1337/s1, Figure S1: Efficiency of Akt1 and Akt2 transfection, Figure S2: Efficiency of Akt1 and Akt2 inhibition in a EBL in vivo mouse model.

Author Contributions

K.R.G. conceptualized the study, designed and preformed experiments, analyzed data, wrote the manuscript; R.S. designed and preformed experiments, analyzed data, revised the manuscript; J.A.-R. performed experiments; Y.C. performed experiments; J.I. performed experiments; P.L.T. revised and edited the manuscript and provided significant scientific insight and guidance.

Funding

This work is supported by the NIH Grant K01 AA025140-01 (Karina Reyes-Gordillo). This material is the result of work supported with resources and the use of facilities at the Washington DC Veterans Affairs Medical Center.

Conflicts of Interest

The authors declare no conflict of interest.

References

  1. Gao, B.; Bataller, R. Alcoholic liver disease: Pathogenesis and new therapeutic targets. Gastroenterology 2011, 141, 1572–1585. [Google Scholar] [CrossRef] [PubMed]
  2. Orman, E.S.; Odena, G.; Bataller, R. Alcoholic liver disease: Pathogenesis, management, and novel targets for therapy. J. Gastroenterol. Hepatol. 2013, 28 (Suppl. 1), 77–84. [Google Scholar] [CrossRef] [Green Version]
  3. Cohen-Naftaly, M.; Friedman, S.L. Current status of novel antifibrotic therapies in patients with chronic liver disease. Ther. Adv. Gastroenterol. 2011, 4, 391–417. [Google Scholar] [CrossRef] [PubMed]
  4. Cohen, J.I.; Nagy, L.E. Pathogenesis of alcoholic liver disease: Interactions between parenchymal and non-parenchymal cells. J. Dig. Dis. 2011, 12, 3–9. [Google Scholar] [CrossRef] [PubMed]
  5. Schaffert, C.S.; Duryee, M.J.; Hunter, C.D.; Hamilton, B.C., 3rd; DeVeney, A.L.; Huerter, M.M.; Klassen, L.W.; Thiele, G.M. Alcohol metabolites and lipopolysaccharide: Roles in the development and/or progression of alcoholic liver disease. World J. Gastroenterol. 2009, 15, 1209–1218. [Google Scholar] [CrossRef] [PubMed]
  6. Tamai, H.; Horie, Y.; Kato, S.; Yokoyama, H.; Ishii, H. Long-term ethanol feeding enhances susceptibility of the liver to orally administered lipopolysaccharides in rats. Alcohol. Clin. Exp. Res. 2002, 26, 75S–80S. [Google Scholar] [CrossRef]
  7. Bertola, A.; Mathews, S.; Ki, S.H.; Wang, H.; Gao, B. Mouse model of chronic and binge ethanol feeding (the NIAAA model). Nat. Protoc. 2013, 8, 627–637. [Google Scholar] [CrossRef] [Green Version]
  8. Hoek, J.B. Endotoxin and alcoholic liver disease: Tolerance and susceptibility. Hepatology 1999, 29, 1602–1604. [Google Scholar] [CrossRef]
  9. Ceni, E.; Mello, T.; Galli, A. Pathogenesis of alcoholic liver disease: Role of oxidative metabolism. World J. Gastroenterol. 2014, 20, 17756–17772. [Google Scholar] [CrossRef]
  10. Shen, Z.; Ajmo, J.M.; Rogers, C.Q.; Liang, X.; Le, L.; Murr, M.M.; Peng, Y.; You, M. Role of SIRT1 in regulation of LPS- or two ethanol metabolites-induced TNF-alpha production in cultured macrophage cell lines. Am. J. Physiol. Gastrointest. Liver Physiol. 2009, 296, G1047–G1053. [Google Scholar] [CrossRef]
  11. Nakamura, Y.; Yokoyama, H.; Higuchi, S.; Hara, S.; Kato, S.; Ishii, H. Acetaldehyde accumulation suppresses Kupffer cell release of TNF-Alpha and modifies acute hepatic inflammation in rats. J. Gastroenterol. 2004, 39, 140–147. [Google Scholar] [CrossRef] [PubMed]
  12. Nakamura, Y.; Yokoyama, H.; Okamura, Y.; Ohgo, H.; Fukuda, M.; Horie, Y.; Kato, S.; Ishii, H. Evidence for ethanol oxidation by Kupffer cells. Alcohol. Clin. Exp. Res. 1999, 23, 92S–95S. [Google Scholar] [CrossRef] [PubMed]
  13. Cubero, F.J.; Nieto, N. Kupffer cells and alcoholic liver disease. Rev. Esp. De Enferm. Dig. Organo De La Soc. Esp. De Patol. Dig. 2006, 98, 460–472. [Google Scholar] [CrossRef] [PubMed] [Green Version]
  14. Wheeler, M.D. Endotoxin and Kupffer cell activation in alcoholic liver disease. Alcohol Res. Health J. Natl. Inst. Alcohol Abus. Alcohol. 2003, 27, 300–306. [Google Scholar]
  15. Esterbauer, H.; Schaur, R.J.; Zollner, H. Chemistry and biochemistry of 4- hydroxynonenal, malonaldehyde and related aldehydes. Free Radic. Biol. Med. 1991, 11, 81–128. [Google Scholar] [CrossRef]
  16. Hellerbrand, C.; Stefanovic, B.; Giordano, F.; Burchardt, E.R.; Brenner, D.A. The role of TGFbeta1 in initiating hepatic stellate cell activation in vivo. J. Hepatol. 1999, 30, 77–87. [Google Scholar] [CrossRef]
  17. Ma, K.L.; Ruan, X.Z.; Powis, S.H.; Chen, Y.; Moorhead, J.F.; Varghese, Z. Inflammatory stress exacerbates lipid accumulation in hepatic cells and fatty livers of apolipoprotein E knockout mice. Hepatology 2008, 48, 770–781. [Google Scholar] [CrossRef]
  18. Shafiei, M.S.; Shetty, S.; Scherer, P.E.; Rockey, D.C. Adiponectin regulation of stellate cell activation via PPARgamma-dependent and -independent mechanisms. Am. J. Pathol. 2011, 178, 2690–2699. [Google Scholar] [CrossRef]
  19. Mann, J.; Chu, D.C.; Maxwell, A.; Oakley, F.; Zhu, N.L.; Tsukamoto, H.; Mann, D.A. MeCP2 controls an epigenetic pathway that promotes myofibroblast transdifferentiation and fibrosis. Gastroenterology 2010, 138, 705–714. [Google Scholar] [CrossRef]
  20. Tsukamoto, H.; Zhu, N.L.; Asahina, K.; Mann, D.A.; Mann, J. Epigenetic cell fate regulation of hepatic stellate cells. Hepatol. Res. Off. J. Jpn. Soc. Hepatol. 2011, 41, 675–682. [Google Scholar] [CrossRef]
  21. Dillon, R.L.; White, D.E.; Muller, W.J. The phosphatidyl inositol 3-kinase signaling network: Implications for human breast cancer. Oncogene 2007, 26, 1338–1345. [Google Scholar] [CrossRef] [PubMed]
  22. Yang, J.; Cron, P.; Good, V.M.; Thompson, V.; Hemmings, B.A.; Barford, D. Crystal structure of an activated Akt/protein kinase B ternary complex with GSK3-peptide and AMP-PNP. Nat. Struct. Biol. 2002, 9, 940–944. [Google Scholar] [CrossRef] [PubMed]
  23. Nag, A.; Das, S.; Yu, M.B.; Deyle, K.M.; Millward, S.W.; Heath, J.R. A chemical epitope-targeting strategy for protein capture agents: The serine 474 epitope of the kinase Akt2. Angew. Chem. 2013, 52, 13975–13979. [Google Scholar] [CrossRef] [PubMed]
  24. Riaz, A.; Zeller, K.S.; Johansson, S. Receptor-specific mechanisms regulate phosphorylation of AKT at Ser473: Role of RICTOR in beta1 integrin-mediated cell survival. PLoS ONE 2012, 7, e32081. [Google Scholar] [CrossRef] [PubMed]
  25. Liao, Y.; Hung, M.C. Physiological regulation of Akt activity and stability. Am. J. Transl. Res. 2010, 2, 19–42. [Google Scholar]
  26. Mukherjee, A.; Larson, E.A.; Klein, R.F.; Rotwein, P. Distinct actions of akt1 on skeletal architecture and function. PLoS ONE 2014, 9, e93040. [Google Scholar] [CrossRef]
  27. Peng, X.D.; Xu, P.Z.; Chen, M.L.; Hahn-Windgassen, A.; Skeen, J.; Jacobs, J.; Sundararajan, D.; Chen, W.S.; Crawford, S.E.; Coleman, K.G.; et al. Dwarfism, impaired skin development, skeletal muscle atrophy, delayed bone development, and impeded adipogenesis in mice lacking Akt1 and Akt2. Genes Dev. 2003, 17, 1352–1365. [Google Scholar] [CrossRef] [Green Version]
  28. Hay, N. Akt isoforms and glucose homeostasis the leptin connection. Trends Endocrinol. Metab. TEM 2011, 22, 66–73. [Google Scholar] [CrossRef]
  29. Riggio, M.; Perrone, M.C.; Polo, M.L.; Rodriguez, M.J.; May, M.; Abba, M.; Lanari, C.; Novaro, V. AKT1 and AKT2 isoforms play distinct roles during breast cancer progression through the regulation of specific downstream proteins. Sci. Rep. 2017, 7, 44244. [Google Scholar] [CrossRef]
  30. Virtakoivu, R.; Pellinen, T.; Rantala, J.K.; Perala, M.; Ivaska, J. Distinct roles of AKT isoforms in regulating beta1-integrin activity, migration, and invasion in prostate cancer. Mol. Biol. Cell 2012, 23, 3357–3369. [Google Scholar] [CrossRef]
  31. Cariaga-Martinez, A.E.; Lopez-Ruiz, P.; Nombela-Blanco, M.P.; Motino, O.; Gonzalez- Corpas, A.; Rodriguez-Ubreva, J.; Lobo, M.V.; Cortes, M.A.; Colas, B. Distinct and specific roles of AKT1 and AKT2 in androgen-sensitive and androgen-independent prostate cancer cells. Cell. Signal. 2013, 25, 1586–1597. [Google Scholar] [CrossRef]
  32. Lieber, C.S.; DeCarli, L.M. The feeding of alcohol in liquid diets: Two decades of applications and 1982 update. Alcohol. Clin. Exp. Res. 1982, 6, 523–531. [Google Scholar] [CrossRef] [PubMed]
  33. Roberts, M.S.; Woods, A.J.; Dale, T.C.; Van Der Sluijs, P.; Norman, J.C. Protein kinase B/Akt acts via glycogen synthase kinase 3 to regulate recycling of alpha v beta 3 and alpha 5 beta 1 integrins. Mol. Cell. Biol. 2004, 24, 1505–1515. [Google Scholar] [CrossRef] [PubMed]
  34. Luo, Y.; Shoemaker, A.R.; Liu, X.; Woods, K.W.; Thomas, S.A.; de Jong, R.; Han, E.K.; Li, T.; Stoll, V.S.; Powlas, J.A.; et al. Potent and selective inhibitors of Akt kinases slow the progress of tumors in vivo. Mol. Cancer Ther. 2005, 4, 977–986. [Google Scholar] [CrossRef] [PubMed]
  35. Yap, T.A.; Walton, M.I.; Hunter, L.J.; Valenti, M.; de Haven Brandon, A.; Eve, P.D.; Ruddle, R.; Heaton, S.P.; Henley, A.; Pickard, L.; et al. Preclinical pharmacology, antitumor activity, and development of pharmacodynamic markers for the novel, potent AKT inhibitor CCT128930. Mol. Cancer Ther. 2011, 10, 360–371. [Google Scholar] [CrossRef]
  36. Zhu, Q.S.; Ren, W.; Korchin, B.; Lahat, G.; Dicker, A.; Lu, Y.; Mills, G.; Pollock, R.E.; Lev, D. Soft tissue sarcoma cells are highly sensitive to AKT blockade: A role for p53- independent up-regulation of GADD45 alpha. Cancer Res. 2008, 68, 2895–2903. [Google Scholar] [CrossRef]
  37. Donohue, T.M.; Osna, N.A.; Clemens, D.L. Recombinant Hep G2 cells that express alcohol dehydrogenase and cytochrome P450 2E1 as a model of ethanol-elicited cytotoxicity. Int. J. Biochem. Cell Biol. 2006, 38, 92–101. [Google Scholar] [CrossRef]
  38. Swaminathan, K.; Clemens, D.L.; Dey, A. Inhibition of CYP2E1 leads to decreased malondialdehyde-acetaldehyde adduct formation in VL-17A cells under chronic alcohol exposure. Life Sci. 2013, 92, 325–336. [Google Scholar] [CrossRef]
  39. Olinga, P.; Merema, M.T.; de Jager, M.H.; Derks, F.; Melgert, B.N.; Moshage, H.; Slooff, M.J.; Meijer, D.K.; Poelstra, K.; Groothuis, G.M. Rat liver slices as a tool to study LPS-induced inflammatory response in the liver. J. Hepatol. 2001, 35, 187–194. [Google Scholar] [CrossRef]
  40. Jones, A.W. Measuring and reporting the concentration of acetaldehyde in human breath. Alcohol Alcohol. 1995, 30, 271–285. [Google Scholar]
  41. Gong, M.; Garige, M.; Hirsch, K. Liver Galbeta1,4GlcNAc alpha2,6-sialyltransferase is down-regulated in human alcoholics: Possible cause for the appearance of asialoconjugates. Metabolism 2007, 56, 1241–1247. [Google Scholar] [CrossRef] [PubMed]
  42. Cianciulli, A.; Calvello, R.; Porro, C.; Trotta, T.; Salvatore, R.; Panaro, M.A. PI3k/Akt signalling pathway plays a crucial role in the anti-inflammatory effects of curcumin in LPS-activated microglia. Int. Immunopharmacol. 2016, 36, 282–290. [Google Scholar] [CrossRef] [PubMed]
  43. Greenwel, P.; Dominguez-Rosales, J.A.; Mavi, G.; Rivas-Estilla, A.M.; Rojkind, M. Hydrogen peroxide: A link between acetaldehyde-elicited alpha1(I) collagen gene up- regulation and oxidative stress in mouse hepatic stellate cells. Hepatology 2000, 31, 109–116. [Google Scholar] [CrossRef] [PubMed]
  44. Arias, I.M.; Alter, H.J.; Boyer, J.L.; Cohen, D.E.; Fausto, N.; Shafritz, D.A.; Wolkoff, A.W. (Eds.) Hepatic Stellate Cells. In The Liver: Biology and Pathobiology, 5th ed.; Wiley-Blackwell: Oxford, UK, 2009. [Google Scholar]
  45. Staveley, B.E.; Ruel, L.; Jin, J.; Stambolic, V.; Mastronardi, F.G.; Heitzler, P.; Woodgett, J.R.; Manoukian, A.S. Genetic analysis of protein kinase B (AKT) in Drosophila. Curr. Biol. CB 1998, 8, 599–602. [Google Scholar] [CrossRef]
  46. Grabinski, N.; Bartkowiak, K.; Grupp, K.; Brandt, B.; Pantel, K.; Jucker, M. Distinct functional roles of Akt isoforms for proliferation, survival, migration and EGF-mediated signalling in lung cancer derived disseminated tumor cells. Cell. Signal. 2011, 23, 1952–1960. [Google Scholar] [CrossRef] [PubMed]
  47. Gonzalez, E.; McGraw, T.E. The Akt kinases: Isoform specificity in metabolism and cancer. Cell Cycle 2009, 8, 2502–2508. [Google Scholar] [CrossRef] [PubMed]
  48. Yang, Z.Z.; Tschopp, O.; Hemmings-Mieszczak, M.; Feng, J.; Brodbeck, D.; Perentes, E.; Hemmings, B.A. Protein kinase B alpha/Akt1 regulates placental development and fetal growth. J. Biol. Chem. 2003, 278, 32124–32131. [Google Scholar] [CrossRef]
  49. Lu, M.; Wan, M.; Leavens, K.F.; Chu, Q.; Monks, B.R.; Fernandez, S.; Ahima, R.S.; Ueki, K.; Kahn, C.R.; Birnbaum, M.J. Insulin regulates liver metabolism in vivo in the absence of hepatic Akt and Foxo1. Nat. Med. 2012, 18, 388–395. [Google Scholar] [CrossRef]
  50. Di Lorenzo, A.; Fernandez-Hernando, C.; Cirino, G.; Sessa, W.C. Akt1 is critical for acute inflammation and histamine-mediated vascular leakage. Proc. Natl. Acad. Sci. USA 2009, 106, 14552–14557. [Google Scholar] [CrossRef] [Green Version]
  51. Arranz, A.; Doxaki, C.; Vergadi, E.; Martinez de la Torre, Y.; Vaporidi, K.; Lagoudaki, E.D.; Ieronymaki, E.; Androulidaki, A.; Venihaki, M.; Margioris, A.N.; et al. Akt1 and Akt2 protein kinases differentially contribute to macrophage polarization. Proc. Natl. Acad. Sci. USA 2012, 109, 9517–9522. [Google Scholar] [CrossRef] [Green Version]
  52. Nie, Y.; Sun, L.; Wu, Y.; Yang, Y.; Wang, J.; He, H.; Hu, Y.; Chang, Y.; Liang, Q.; Zhu, J.; et al. AKT2 Regulates Pulmonary Inflammation and Fibrosis via Modulating Macrophage Activation. J. Immunol. 2017, 198, 4470–4480. [Google Scholar] [CrossRef] [PubMed] [Green Version]
  53. Bibaki, E.; Tsitoura, E.; Vasarmidi, E.; Margaritopoulos, G.; Trachalaki, A.; Koutoulaki, C.; Georgopoulou, T.; Spandidos, D.A.; Tzanakis, N.; Antoniou, K.M. miR-185 and miR-29a are similarly expressed in the bronchoalveolar lavage cells in IPF and lung cancer but common targets DNMT1 and COL1A1 show disease specific patterns. Mol. Med. Rep. 2018, 17, 7105–7112. [Google Scholar] [CrossRef] [PubMed] [Green Version]
  54. Lan, A.; Zhang, J.; Xiao, Z.; Peng, X.; Qi, Y.; Du, J. Akt2 is involved in loss of epithelial cells and renal fibrosis following unilateral ureteral obstruction. PLoS ONE 2014, 9, e105451. [Google Scholar] [CrossRef] [PubMed]
  55. Ock, S.; Lee, W.S.; Kim, H.M.; Park, K.S.; Kim, Y.K.; Kook, H.; Park, W.J.; Lee, T.J.; Abel, E.D.; Kim, J. Connexin43 and zonula occludens-1 are targets of Akt in cardiomyocytes that correlate with cardiac contractile dysfunction in Akt deficient hearts. Biochim. Et Biophys. Acta. Mol. Basis Dis. 2018, 1864, 1183–1191. [Google Scholar] [CrossRef] [PubMed]
  56. Reyes-Gordillo, K.; Shah, R.; Popratiloff, A.; Fu, S.; Hindle, A.; Brody, F.; Rojkind, M. Thymosin-beta4 (Tbeta4) blunts PDGF-dependent phosphorylation and binding of AKT to actin in hepatic stellate cells. Am. J. Pathol. 2011, 178, 2100–2108. [Google Scholar] [CrossRef] [PubMed]
  57. Easton, R.M.; Cho, H.; Roovers, K.; Shineman, D.W.; Mizrahi, M.; Forman, M.S.; Lee, V.M.; Szabolcs, M.; de Jong, R.; Oltersdorf, T.; et al. Role for Akt3/protein kinase Bgamma in attainment of normal brain size. Mol. Cell. Biol. 2005, 25, 1869–1878. [Google Scholar] [CrossRef]
Figure 1. Ethanol and lipopolysaccharide (LPS) induces liver injury and activates Akt signaling pathway. Biochemical analysis of plasma (A) aminotransferase (AST) and (B) alanine aminotransferase (ALT); and Western Blot analysis of (C) p-Akt1, (D) p-Akt2, (E) p-Akt3, (F) p-PI3K, (G) p-PDK1, and (H) p-mTOR. Protein was extracted from whole livers of controls and mice treated with ethanol binge (EB) and ethanol binge and LPS (EBL) (n = 6). All values are means of quadruplicate experiments ± SE after correcting for the expression of β-actin. * p ≤ 0.05 as compared to control.
Cells 08 01337 g001
Figure 2. Role of Akt isoforms on ethanol and LPS-induced nuclear translocation of NFκB-p65 and induction of pro-inflammatory cytokines in vitro and in vivo. Nuclear or cytosolic protein and total RNA was extracted from human Kupffer cells transfected with siAkt1 or siAkt2 and treated with ethanol, LPS, or both for Western blot analysis of (A) nuclear NFκB-p65, (B) cytosolic NFκB-p65, and qPCR analysis of (C) IκB, and (D) Tnfα. Nuclear or cytosolic protein and total RNA was extracted from mouse liver tissue treated with Akt1 or Akt2 inhibitors and treated with EB and EBL (n = 6) for Western blot analysis of (E) nuclear NFκB-p65, (F) cytosolic NFκB-p65, and qPCR analysis of (G) IκB and (H) Il1β. All values are means of triplicate experiments ± SE after correcting for the expression of Lamin B (nuclear), β-actin (cytosolic), or glyceraldehyde-3-phosphate dehydrogenase (Gapdh) (qPCR). * p ≤ 0.05 as compared to control, ** p ≤ 0.05 as compared to ethanol Ethanol, LPS, or both, and/or LPS or EBL.
Cells 08 01337 g002
Figure 3. Role of Akt1 and Akt2 in ethanol and LPS-induced fibrogenesis. Total RNA was extracted from human hepatic stellate cells (HSC) or VL17A hepatocytes transfected with siAkt1 or siAkt2 and treated with acetaldehyde/ethanol, LPS, or both for quantitative PCR analysis of (A) αSma, (B) Pdgfβ receptor, (C) Col1α1, and (D) Col1α1 from VL17A cells. Total protein was extracted from whole liver tissue from mice of various groups (n = 6) to determine the protein expression of (E) αSMA, (F) PDGFβ Receptor, (G) Col1 by Western blot analysis. All values are means of triplicate experiments ± SE after correcting for the expression of glyceraldehyde-3-phosphate dehydrogenase (Gapdh) (mRNA) or β-actin (protein). * p < 0.05 as compared to control; ** p < 0.05 as compared to acetaldehyde + LPS or EBL.
Cells 08 01337 g003
Figure 4. Role of Akt1 and Akt2 in ethanol and LPS-induced fibrosis. Liver tissue from various groups was used to determine hydroxyproline content (indicative of collagen fibers) to determine the extent of fibrosis. * p < 0.05 as compared to control, **p < 0.05 as compared to EBL.
Cells 08 01337 g004
Figure 5. Role of Akt1 and Akt2 in HSC proliferation and migration. (A) Cell proliferation was performed by MTT assay of human HSC transfected with siAkt1 or siAkt2 and treated for 3 h with acetaldehyde, LPS, or both. Quantitative qPCR analysis of (B) c-Myc and (C) Cyclin D1 was performed with total RNA obtained from human HSCs. All values are means of triplicate experiments ± SE after correcting for the expression of S18. (D) Cell migration was determined after wounding a confluent culture and measuring the gap area at the time points indicated in the figure. Panel E shows percent of open area. Values are means of triplicate experiments ± S.E. * p < 0.05 as compared to control, ** p < 0.05 as compared to acetaldehyde and LPS.
Cells 08 01337 g005

