
In Situ Monitoring of Morphology Changes and Oxygenation State of Human Erythrocytes During Surfactant-Induced Hemolysis

 , , , and
Abstract
1. Introduction
2. Materials and Methods
2.1. Materials
2.2. Isolation of Erythrocytes
2.3. Measurements of Hemolysis in Real-Time
2.3.1. Absorbance at 700 nm (A700)
2.3.2. Soret’s Peak Height
2.3.3. Soret’s Peak Wavelength
2.4. Light Microscopy (LM)
3. Results and Discussion
3.1. Saponin
3.2. SDS
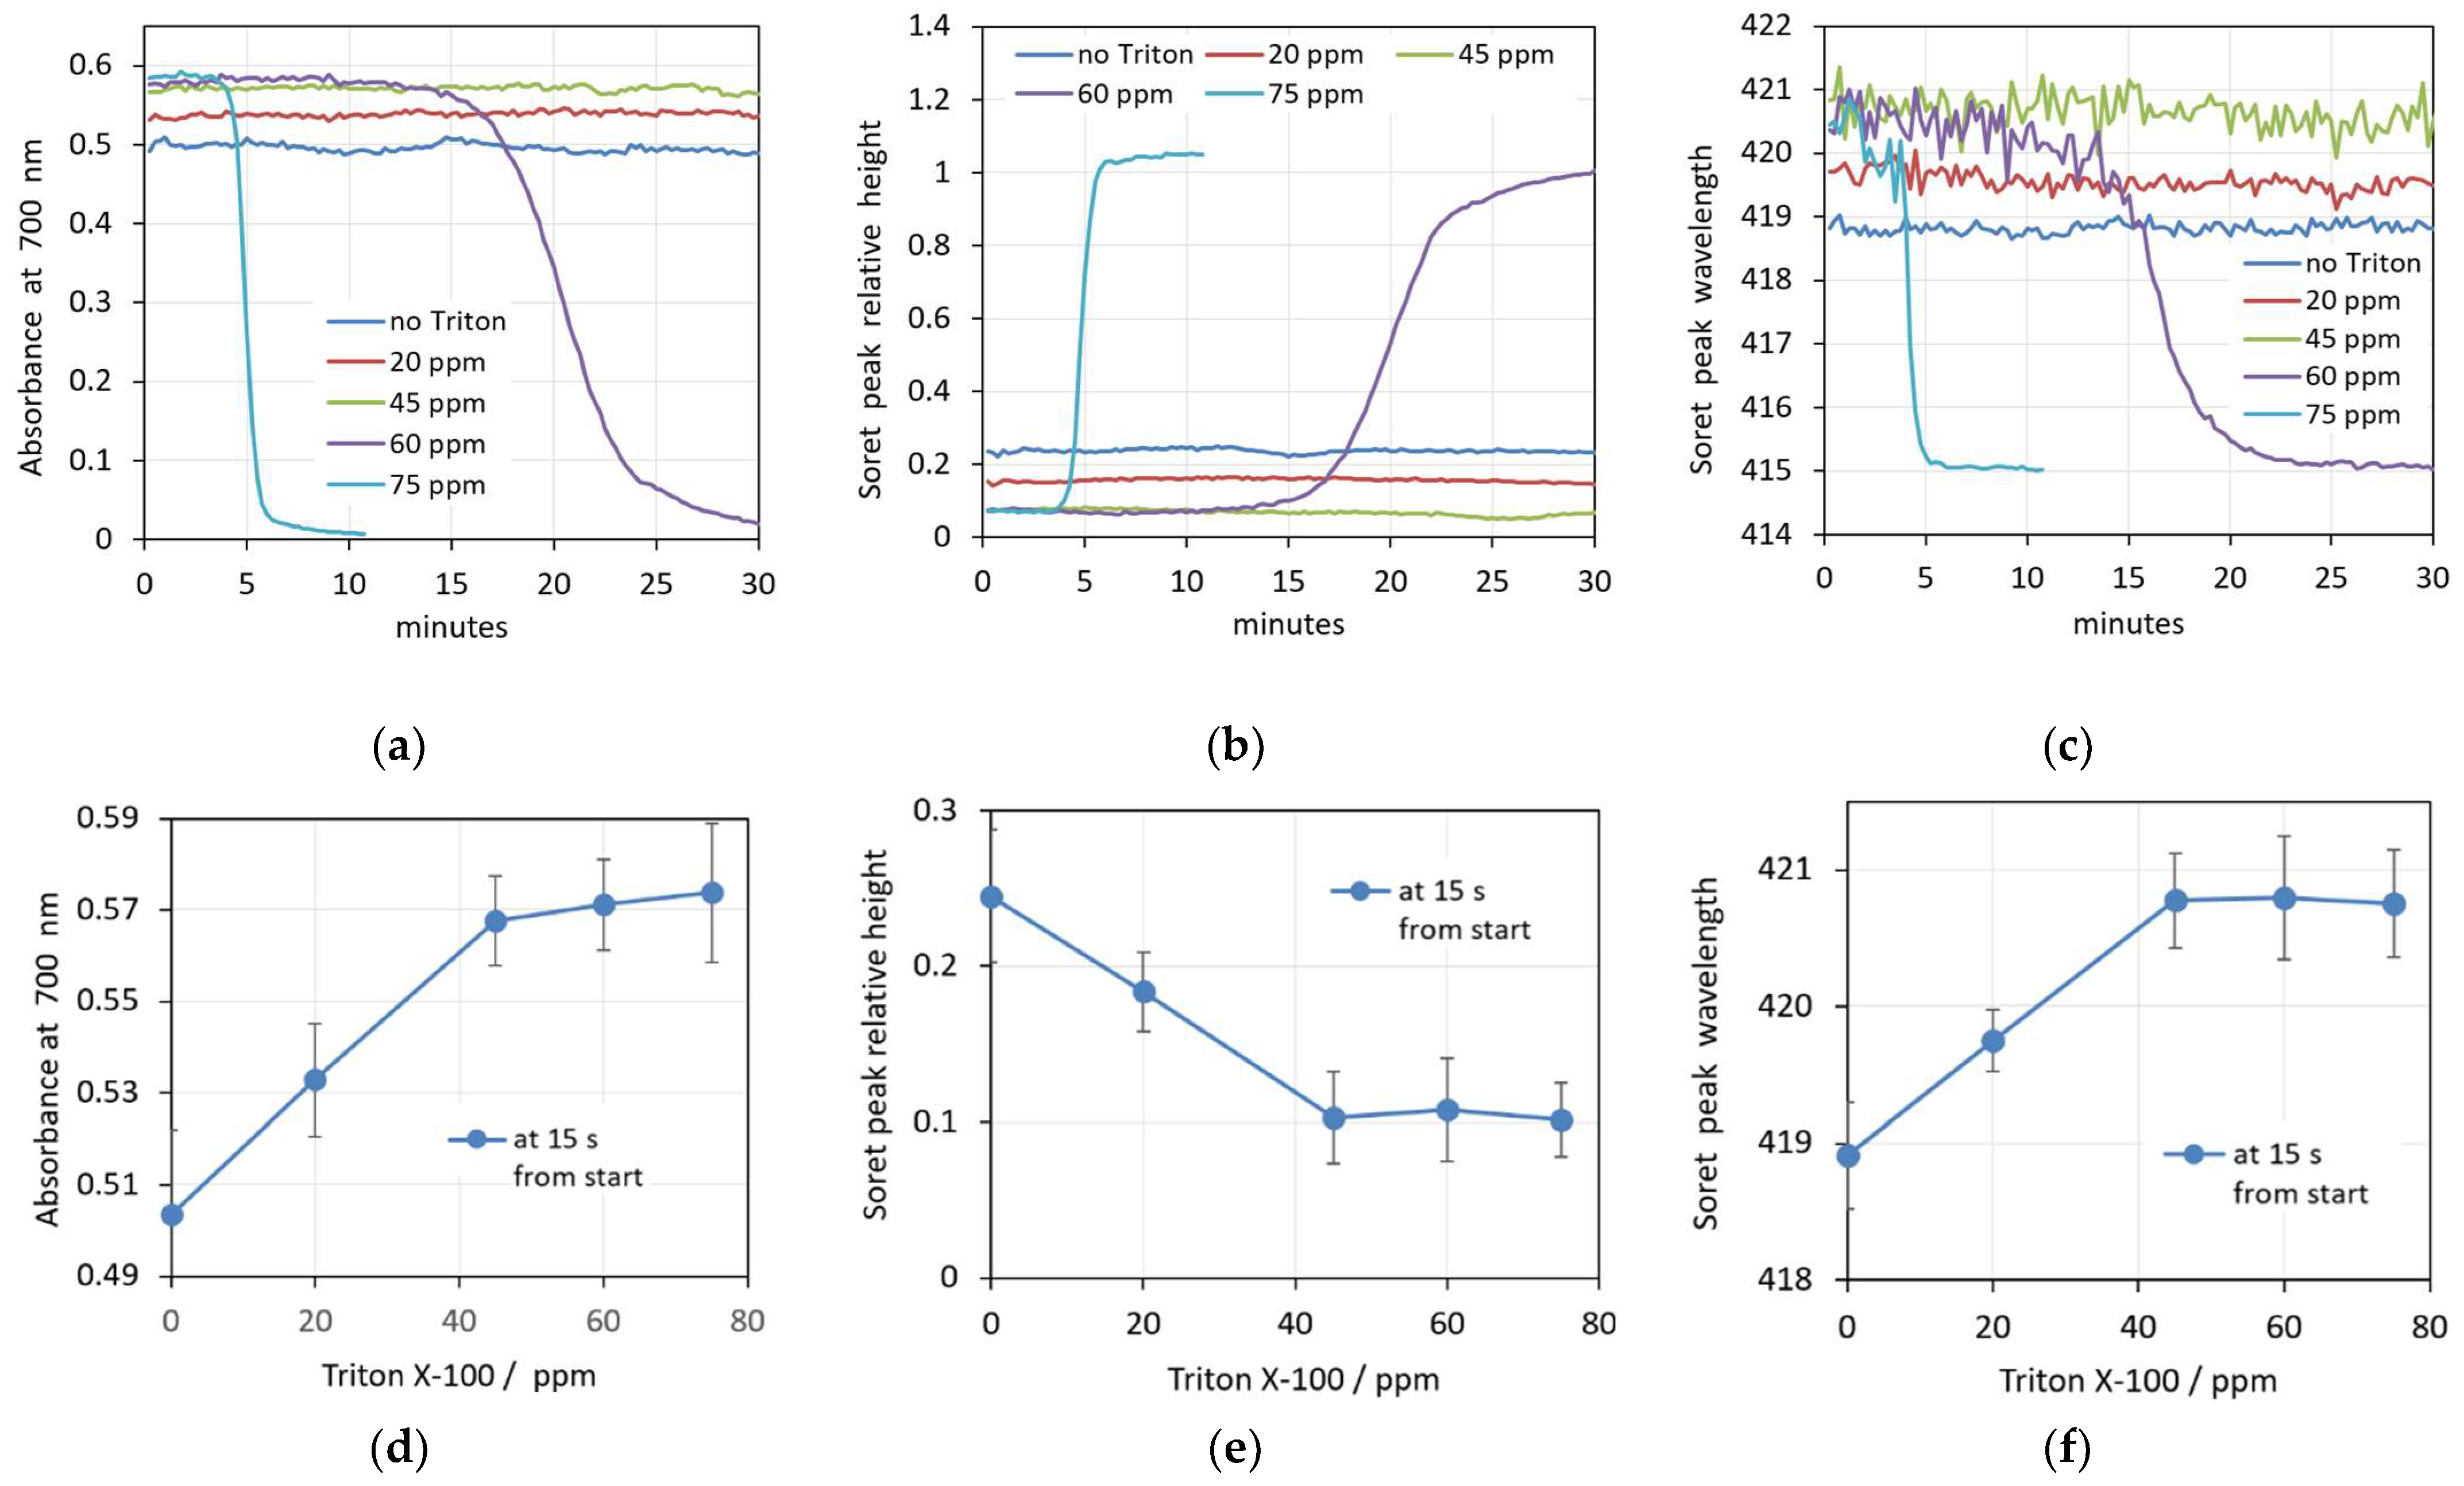
3.3. Triton X-100
4. Conclusions
Author Contributions
Funding
Institutional Review Board Statement
Informed Consent Statement
Data Availability Statement
Conflicts of Interest
References
- Rizvi, A.; Macedo, P.; Babawale, L.; Tighe, H.C.; Hughes, J.M.B.; Jackson, J.E.; Shovlin, C.L. Hemoglobin Is a Vital Determinant of Arterial Oxygen Content in Hypoxemic Patients with Pulmonary Arteriovenous Malformations. Ann. Am. Thorac. Soc. 2017, 14, 903–911. [Google Scholar] [PubMed]
- Doltchinkova, V.; Kitanova, M.; Nikolov, R.; Stoyanova-Ivanova, A.; Petkov, O.; Dikova, Y.; Vitkova, V. Erythrocyte Membrane Biophysical Changes Mediated by Pooled Immunoglobulin G and Hematin: Electrokinetic and Lipid Peroxidation Studies. Membranes 2023, 13, 281. [Google Scholar] [CrossRef] [PubMed]
- Ivanov, I.T.; Paarvanova, B.K. Role of Plasma Membrane at Dielectric Relaxations and Intermembrane Interaction in Human Erythrocytes. Membranes 2023, 13, 658. [Google Scholar] [CrossRef] [PubMed]
- Tan, S.; Wu, T.; Zhang, D.; Zhang, Z. Cell or cell membrane-based drug delivery systems. Theranostics 2015, 5, 863–881. [Google Scholar]
- Zhang, X.; Lin, Y.; Xin, J.; Zhang, Y.; Yang, K.; Luo, Y.; Wang, B. Red blood cells in biology and translational medicine: Natural vehicle inspires new biomedical applications. Theranostics 2024, 14, 220–248. [Google Scholar]
- Golczak, A.; Prukala, D.; Sikorska, E.; Gierszewski, M.; Cherkas, V.; Kwiatek, D.; Kubiak, A.; Varma, N.; Pedzinski, T.; Murphree, S.; et al. Tetramethylalloxazines as efficient singlet oxygen photosensitizers and potential redox-sensitive agents. Sci. Rep. 2023, 13, 13426. [Google Scholar]
- Villa, C.H.; Cines, D.B.; Siegel, D.L.; Muzykantov, V. Erythrocytes as Carriers for Drug Delivery in Blood Transfusion and Beyond. Transfus. Med. Rev. 2017, 31, 26–35. [Google Scholar]
- Wadhwa, R.; Aggarwal, T.; Thapliyal, N.; Kumar, A.; Priya Yadav, P.; Kumari, V.; Reddy, B.S.C.; Chandra, P.; Maurya, P.K. Red blood cells as an efficient in vitro model for evaluating the efficacy of metallic nanoparticles. 3 Biotech 2019, 9, 279. [Google Scholar]
- Diez-Silva, M.; Dao, M.; Han, J.; Lim, C.T.; Suresh, S. Shape and Biomechanical Characteristics of Human Red Blood Cells in Health and Disease. MRS Bull. 2010, 35, 382–388. [Google Scholar]
- Rasia, M.; Bollini, A. Red blood cell shape as a function of medium’s ionic strength and pH. Biochim. Biophys. Acta 1998, 1372, 198–204. [Google Scholar]
- Gedde, M.M.; Yang, E.; Huestis, W.H. Shape response of human erythrocytes to altered cell pH. Blood 1995, 86, 1595–1599. [Google Scholar] [PubMed]
- Lim, H.W.G.; Wortis, M.; Mukhopadhyay, R. Stomatocyte-discocyte-echinocyte sequence of the human red blood cell: Evidence for the bilayer-couple hypothesis from membrane mechanics. Proc. Natl. Acad. Sci. USA 2002, 99, 16766–16769. [Google Scholar]
- Park, Y.; Best, C.A.; Badizadegan, K.; Dasari, R.R.; Feld, M.S.; Kuriabova, T.; Henle, M.L.; Levine, A.J.; Popescu, G. Measurement of red blood cell mechanics during morphological changes. Proc. Natl. Acad. Sci. USA 2010, 107, 6731–6736. [Google Scholar] [PubMed]
- Vallelian, F.; Buehler, P.W.; Schaer, D.J. Hemolysis, free hemoglobin toxicity, and scavenger protein therapeutics. Blood 2022, 140, 1837–1844. [Google Scholar]
- Denninghoff, K.R.; Chipman, R.A.; Hillman, L.W. Blood oxyhemoglobin saturation measurements by blue-green spectral shift. J. Biomed. Opt. 2007, 12, 034020. [Google Scholar]
- Faber, D.J.; Aalders, M.C.; Mik, E.G.; Hooper, B.A.; van Gemert, M.J.; van Leeuwen, T.G. Oxygen saturation-dependent absorption and scattering of blood. Phys. Rev. Lett. 2004, 93, 028102. [Google Scholar]
- Winterbourn, C.C. Oxidative reactions of hemoglobin. Methods Enzymol. 1990, 186, 265–272. [Google Scholar]
- Karabaliev, M.; Tacheva, B.; Paarvanova, B.; Georgieva, R. Change in Osmotic Pressure Influences the Absorption Spectrum of Hemoglobin inside Red Blood Cells. Cells 2024, 13, 589. [Google Scholar] [CrossRef]
- Paarvanova, B.; Tacheva, B.; Savova, G.; Karabaliev, M.; Georgieva, R. Hemolysis by Saponin Is Accelerated at Hypertonic Conditions. Molecules 2023, 28, 7096. [Google Scholar] [CrossRef]
- Tacheva, B.; Paarvanova, B.; Bozhikov, S.; Ivanov, I.; Karabaliev, M. Kinetics of Hemolysis Induced by Thioridazine. In Proccedings of the International Conference of Computational Methods in Sciences and Engineering, Rhodes, Greece, 1–5 May 2019. [Google Scholar]
- Manaargadoo-Catin, M.; Ali-Cherif, A.; Pougnas, J.L.; Perrin, C. Hemolysis by surfactants—A review. Adv. Colloid. Interface Sci. 2016, 228, 1–16. [Google Scholar]
- Isomaa, B.; Hagerstrand, H.; Paatero, G. Shape transformations induced by amphiphiles in erythrocytes. Biochim. Biophys. Acta 1987, 899, 93–103. [Google Scholar] [PubMed]
- Chernitsky, E.; Senkovich, O. Mechanisms of anionic detergent-induced hemolysis. Gen. Physiol. Biophys. 1998, 17, 265–270. [Google Scholar] [PubMed]
- Shalel, S.; Streichman, S.; Marmur, A. The mechanism of hemolysis by surfactants: Effect of solution composition. J. Colloid Interface Sci. 2002, 252, 66–76. [Google Scholar] [PubMed]
- Helenius, A.; Simons, K. Solubilization of membranes by detergents. Biochim. Biophys. Acta 1975, 415, 29–79. [Google Scholar]
- Isomaa, B.; Engblom, A.C.; Hagerstrand, H. On the time-dependence of amphiphile-induced haemolysis. Toxicology 1988, 48, 285–291. [Google Scholar]
- Lichtenberg, D. Characterization of the solubilization of lipid bilayers by surfactants. Biochim. Biophys. Acta 1985, 821, 470–478. [Google Scholar]
- Lichtenberg, D.; Ahyayauch, H.; Goñi, F.M. The mechanism of detergent solubilization of lipid bilayers. Biophys. J. 2013, 105, 289–299. [Google Scholar]
- Lete, M.G.; Monasterio, B.G.; Collado, M.I.; Medina, M.; Sot, J.; Alonso, A.; Goni, F.M. Fast and slow biomembrane solubilizing detergents: Insights into their mechanism of action. Colloids Surf. B Biointerfaces 2019, 183, 110430. [Google Scholar]
- Tragner, D.; Csordas, A. Biphasic interaction of Triton detergents with the erythrocyte membrane. Biochem. J. 1987, 244, 605–609. [Google Scholar]
- Karabaliev, M.; Paarvanova, B.; Bozhikov, S.; Ginin, R.; Atanassova, S.; Tacheva, B. Numerical analysis of absorption spectrum peak wavelength. In Proccedings of the International Conference of Computational Methods in Sciences and Engineering, Crete, Greece, 29 April–3 May 2020. [Google Scholar]
- Chen, C.; Li, R.; Li, D.; Shen, F.; Xiao, G.; Zhou, J. Extraction and purification of saponins from Sapindus mukorossi. New J. Chem. 2021, 45, 952–960. [Google Scholar]
- Bailly, C.; Vergoten, G. Glycyrrhizin: An alternative drug for the treatment of COVID-19 infection and the associated respiratory syndrome? Pharmacol. Ther. 2020, 214, 107618. [Google Scholar] [PubMed]
- Sharma, P.; Tyagi, A.; Bhansali, P.; Pareek, S.; Singh, V.; Ilyas, A.; Mishra, R.; Poddar, N.K. Saponins: Extraction, bio-medicinal properties and way forward to anti-viral representatives. Food Chem. Toxicol. 2021, 150, 112075. [Google Scholar] [PubMed]
- Morcia, C.; Piazza, I.; Ghizzoni, R.; Delbono, S.; Felici, B.; Baima, S.; Scossa, F.; Biazzi, E.; Tava, A.; Terzi, V.; et al. In Search of Antifungals from the Plant World: The Potential of Saponins and Brassica Species against Verticillium dahliae Kleb. Horticulturae 2022, 8, 729. [Google Scholar] [CrossRef]
- Saglik, İ.; Tuncay, Ö.G.; Özhak, B. Investigation of the antimicrobial effects of Sapindus mukorossi on endodontic pathogens. J. Exp. Clin. Med. 2020, 37, 111–118. [Google Scholar]
- Liu, M.; Chen, Y.L.; Kuo, Y.H.; Lu, M.K.; Liao, C.C. Aqueous extract of Sapindus mukorossi induced cell death of A549 cells and exhibited antitumor property in vivo. Sci. Rep. 2018, 8, 4831. [Google Scholar]
- Moghimipour, E.; Kooshapour, H.; Rezaee, S.; Khalili, S.; Handali, S. In vitro cholestrol binding affinity of total saponin extracted from Glycyrrhiza glabra. Asian J. Pharm. Clin. Res. 2014, 7, 170–173. [Google Scholar]
- Killeen, G.F.; Madigan, C.A.; Connolly, C.R.; Walsh, G.A.; Clark, C.; Hynes, M.J.; Timmins, B.F.; James, P.; Headon, D.R.; Power, R.F. Antimicrobial Saponins of Yucca schidigera and the Implications of Their in Vitro Properties for Their in Vivo Impact. J. Agric. Food Chem. 1998, 46, 3178–3186. [Google Scholar]
- Zhou, Z.; Zuber, S.; Cantergiani, F.; Butot, S.; Li, D.; Stroheker, T.; Devlieghere, F.; Lima, A.; Piantini, U.; Uyttendaele, M. Inactivation of viruses and bacteria on strawberries using a levulinic acid plus sodium dodecyl sulfate based sanitizer, taking sensorial and chemical food safety aspects into account. Int. J. Food Microbiol. 2017, 257, 176–182. [Google Scholar]
- Heerklotz, H. Interactions of surfactants with lipid membranes. Q. Rev. Biophys. 2008, 41, 205–264. [Google Scholar]
- Bielawski, J. Two types of haemolytic activity of detergents. Biochim. Biophys. Acta 1990, 1035, 214–217. [Google Scholar]
- Liang, J.J.; Wei, J.C.; Lee, Y.L.; Hsu, S.H.; Lin, J.J.; Lin, Y.L. Surfactant-modified nanoclay exhibits an antiviral activity with high potency and broad spectrum. J. Virol. 2014, 88, 4218–4228. [Google Scholar] [CrossRef] [PubMed]
- Tan, S.W.; Gooran, N.; Lim, H.M.; Yoon, B.K.; Jackman, J.A. Tethered Bilayer Lipid Membrane Platform for Screening Triton X-100 Detergent Replacements by Electrochemical Impedance Spectroscopy. Nanomaterials 2023, 13, 874. [Google Scholar] [CrossRef] [PubMed]
- Fan, X.; Zhao, X.; Su, W.; Tang, X. Triton X-100-Modified Adenosine Triphosphate-Responsive siRNA Delivery Agent for Antitumor Therapy. Mol. Pharm. 2020, 17, 3696–3708. [Google Scholar] [CrossRef] [PubMed]
- Solomonov, A.V.; Marfin, Y.S.; Rumyantsev, E.V.; Ragozin, E.; Zahavi, T.S.; Gellerman, G.; Tesler, A.B.; Muench, F.; Kumagai, A.; Miyawaki, A. Self-assembled micellar clusters based on Triton-X-family surfactants for enhanced solubilization, encapsulation, proteins permeability control, and anticancer drug delivery. Mater. Sci. Eng. C Mater. Biol. Appl. 2019, 99, 794–804. [Google Scholar] [CrossRef]
- Koley, D.; Bard, A.J. Triton X-100 concentration effects on membrane permeability of a single HeLa cell by scanning electrochemical microscopy (SECM). Proc. Natl. Acad. Sci. USA 2010, 107, 16783–16787. [Google Scholar] [CrossRef]
- Holtzclaw, J.D.; Jiang, M.; Yasin, Z.; Joiner, C.H.; Franco, R.S. Rehydration of high-density sickle erythrocytes in vitro. Blood 2002, 100, 3017–3025. [Google Scholar] [CrossRef]
- Gifford, S.C.; Derganc, J.; Shevkoplyas, S.S.; Yoshida, T.; Bitensky, M.W. A detailed study of time-dependent changes in human red blood cells: From reticulocyte maturation to erythrocyte senescence. Br. J. Haematol. 2006, 135, 395–404. [Google Scholar] [CrossRef]
- Antonelou, M.H.; Kriebardis, A.G.; Papassideri, I.S. Aging and death signalling in mature red cells: From basic science to transfusion practice. Blood Transfus. 2010, 8 (Suppl. S3), S39–S47. [Google Scholar]
- Bosman, G.J.; Lasonder, E.; Groenen-Dopp, Y.A.; Willekens, F.L.; Werre, J.M.; Novotny, V.M. Comparative proteomics of erythrocyte aging in vivo and in vitro. J. Proteom. 2010, 73, 396–402. [Google Scholar] [CrossRef]
- Linderkamp, O.; Meiselman, H.J. Geometric, osmotic, and membrane mechanical properties of density-separated human red cells. Blood 1982, 59, 1121–1127. [Google Scholar] [CrossRef]
- Waugh, R.E.; Narla, M.; Jackson, C.W.; Mueller, T.J.; Suzuki, T.; Dale, G.L. Rheologic properties of senescent erythrocytes: Loss of surface area and volume with red blood cell age. Blood 1992, 79, 1351–1358. [Google Scholar] [PubMed]
- Bizjak, D.A.; Brinkmann, C.; Bloch, W.; Grau, M. Increase in Red Blood Cell-Nitric Oxide Synthase Dependent Nitric Oxide Production during Red Blood Cell Aging in Health and Disease: A Study on Age Dependent Changes of Rheologic and Enzymatic Properties in Red Blood Cells. PLoS ONE 2015, 10, e0125206. [Google Scholar] [CrossRef]
- Boas, F.E.; Forman, L.; Beutler, E. Phosphatidylserine exposure and red cell viability in red cell aging and in hemolytic anemia. Proc. Natl. Acad. Sci. USA 1998, 95, 3077–3081. [Google Scholar] [PubMed]
- Franco, R.S.; Puchulu-Campanella, M.E.; Barber, L.A.; Palascak, M.B.; Joiner, C.H.; Low, P.S.; Cohen, R.M. Changes in the properties of normal human red blood cells during in vivo aging. Am. J. Hematol. 2013, 88, 44–51. [Google Scholar] [PubMed]
- Huang, Y.X.; Wu, Z.J.; Mehrishi, J.; Huang, B.T.; Chen, X.Y.; Zheng, X.J.; Liu, W.J.; Luo, M. Human red blood cell aging: Correlative changes in surface charge and cell properties. J. Cell Mol. Med. 2011, 15, 2634–2642. [Google Scholar]
- Oikonomidou, P.R.; Rivella, S. What can we learn from ineffective erythropoiesis in thalassemia? Blood Rev. 2018, 32, 130–143. [Google Scholar]
- Sparrow, R.L. Red blood cell components: Time to revisit the sources of variability. Blood Transfus. 2017, 15, 116–125. [Google Scholar]


Disclaimer/Publisher’s Note: The statements, opinions and data contained in all publications are solely those of the individual author(s) and contributor(s) and not of MDPI and/or the editor(s). MDPI and/or the editor(s) disclaim responsibility for any injury to people or property resulting from any ideas, methods, instructions or products referred to in the content. |
© 2025 by the authors. Licensee MDPI, Basel, Switzerland. This article is an open access article distributed under the terms and conditions of the Creative Commons Attribution (CC BY) license (https://creativecommons.org/licenses/by/4.0/).
Share and Cite
Karabaliev, M.; Paarvanova, B.; Savova, G.; Tacheva, B.; Georgieva, R. In Situ Monitoring of Morphology Changes and Oxygenation State of Human Erythrocytes During Surfactant-Induced Hemolysis. Cells 2025, 14, 469. https://doi.org/10.3390/cells14070469
Karabaliev M, Paarvanova B, Savova G, Tacheva B, Georgieva R. In Situ Monitoring of Morphology Changes and Oxygenation State of Human Erythrocytes During Surfactant-Induced Hemolysis. Cells. 2025; 14(7):469. https://doi.org/10.3390/cells14070469
Chicago/Turabian StyleKarabaliev, Miroslav, Boyana Paarvanova, Gergana Savova, Bilyana Tacheva, and Radostina Georgieva. 2025. "In Situ Monitoring of Morphology Changes and Oxygenation State of Human Erythrocytes During Surfactant-Induced Hemolysis" Cells 14, no. 7: 469. https://doi.org/10.3390/cells14070469
APA StyleKarabaliev, M., Paarvanova, B., Savova, G., Tacheva, B., & Georgieva, R. (2025). In Situ Monitoring of Morphology Changes and Oxygenation State of Human Erythrocytes During Surfactant-Induced Hemolysis. Cells, 14(7), 469. https://doi.org/10.3390/cells14070469