Article

Single-Cell mRNA Analysis for the Identification of Molecular Pathways of IRF1 in HER2+ Breast Cancer

by
Laura Vilardo
1,†,
Paride Pelucchi
1,†,
Antonia Brindisi
1,†,
Edoardo Abeni
1,
Eleonora Piscitelli
1,
Ettore Mosca
1,
Giovanni Bertalot
2,
Mira Palizban
3,
Theodoros Karnavas
4,
Angelos D. Gritzapis
5,
Ioannis Misitzis
6,
Martin Götte
3,
Ileana Zucchi
1,7,* and
Rolland Reinbold
1,7,*
1
Institute of Biomedical Technologies, National Research Council, 20054 Milano, Italy
2
Unita’ Operativa Multizonale di Anatomia Patologica, APSS and Centre for Medical Sciences—CISMed, University of Trento, 38122 Trento, Italy
3
Department of Gynecology and Obstetrics, University Hospital Muenster, D11, 48149 Muenster, Germany
4
Department of Biology, Touro University, New York, NY 10023, USA
5
Cancer Immunology and Immunotherapy Center, Agios Savas Cancer Hospital, 11522 Athens, Greece
6
Athens Medical Center, Psychiko Clinic, 11525 Athens, Greece
7
Associazione Fondazione Renato Dulbecco, 20138 Milano, Italy
*
Authors to whom correspondence should be addressed.
These authors contributed equally to this work.
Cells 2025, 14(16), 1246; https://doi.org/10.3390/cells14161246
Submission received: 15 April 2025 / Revised: 23 July 2025 / Accepted: 23 July 2025 / Published: 13 August 2025

Abstract

Clonally established tumor cell lines often do not recapitulate the behavior of cells in tumors. The sequencing of a whole tumor tissue may not uncover transcriptome profiles induced by the interactions of all different cell types within a tumor. Interferons for instance have a vast number of binding sites in their target genes. Access to the DNA binding sites is determined by the epigenomic state of each different cell type within a tumor mass. To understand how genes such as interferons appear to have both tumor-promoting and tumor-inhibiting functions, single-cell transcript analysis was performed in the breast cancer tissue of HER2+ (epidermal growth factor receptor 2) patients. We identified that potential antagonistic oncogenic activities of cells can be due to diverse expression patterns of genes with pleiotropic functions. Molecular pathways both known and novel were identified and were similar with those previously identified for patients with rheumatoid arthritis. Our study demonstrates the efficacy in using single-cell transcript analysis to gain insight into genes with apparent contradictory or paradoxical roles in oncogenesis.

1. Introduction

We previously demonstrated that TMEM230, a transmembrane protein, is a master regulator of the endoplasmic reticulum (ER), controlling various functions, including the initial steps of glycosylation in glycoprotein and proteoglycan formation, as well as their intracellular trafficking and secretion [1]. TMEM230-regulated glycoproteins and proteoglycans, as we have previously shown for RNASET2 and syndecans, regulate cell-to-cell and cell-to-extracellular matrix interactions and cell “defense” programs, respectively. These interactions were necessary for the evolutionary development of the immune system’s response to infection and cellular damage, and of tissue and extracellular matrix remodeling in wound healing and cancer [2]. As a transmembrane protein of the ER, TMEM230 is also essential in the intracellular trafficking and secretion of glycosylated factors in endosomes, phagosomes, lysosomes, and exosomes. TMEM230, syndecans, and RNASET2 were previously identified in molecular pathways associated with interferons (IFNs) [3]. IFNs are cytokine-signaling factors, initially recognized as being synthesized in response to infections but now known to have roles in autoimmunity and in paradoxically promoting and inhibiting cancer [3,4,5,6,7,8,9,10,11]. The expression of IFNs is regulated by transcription interferon regulatory factors (IRFs), such as IRF1. Like IFNs, RNASET2, syndecans, and TMEM230 appear to have both pro- and anti-cancer activities, depending on their levels of expression in different cells of the tumor mass [3]. Interpretations as to why pleiotropic-acting genes may have cancer -promoting and -inhibiting activities have previously suggested this to be due to a large number of mutations, alternative splicing isoforms, or binding sites in target genes [8,12,13,14,15,16,17,18]. In this study, we identified expression patterns of IRF1, TMEM230, RNASET2, and syndecan 2 (SDC2) in different cell types of breast cancer patients using single-cell mRNA transcript analyses. We propose that uncovering their associated pathways in different cell types within the same tumor of a patient may provide insight into how pleiotropic-acting genes contribute both tumor-inhibiting and -promoting functions.

2. Materials and Methods

2.1. Dominant Acting IRF1+I4 Isoform Lentiviral Construct Generation

IRF-1+I4 isoform was cloned under a CMV promoter with the expression cassette for the green fluorescent reporter gene (copGFP) by cloning a PCR product into the pCDH-CMV-MCS-EF1-copGFP vector (System Bioscience, Embarcadero Way, Palo Alto, CA, USA). Additionally, the IRF1 WT transcript in frame with the GFP gene and the GFP gene alone (used as controls) were also cloned into the lentiviral constructs and transduced like IRF1+I4 into primary fibroblast cells of breasts from normal patients who had undergone mammoplasty reduction (Supplementary Materials). IRF1+I4 was amplified by primers designed in IRF1 gene intron 4, Fw 5′-AGGGAGGGTAGAAGGAGGTCA-3′, and exon 6 Rev 5′-TGCTGAGTCCATCAGAGAAGGTAT-3′.

2.2. Lentiviral Transduction

For lentiviral transduction, 1 × 10⁵ cells/well were seeded in 24-well tissue culture plates and infected the following day with lentiviruses. All infections were performed for 16 h in the presence of 8 µg/mL polybrene transfection reagent (Sigma-Aldrich, St. Louis, MO, USA). High-titer lentiviruses were generated by transient co-transfection of 293 T cells with a three-plasmid combination as follows: one p145 containing 6 × 10⁶ 293 T cells was co-transfected using Lipofectamine™ 2000 (Invitrogen™ Thermo Fisher Scientific, Waltham, MA, USA) according to the manufacturer’s protocol, with 33.25 µg lentiviral vector, 25 µg psPAX2, and 8.25 µg pMD2.G. Supernatants were collected every 24 h between 36 and 72 h after transfection, pulled together, concentrated via ultracentrifugation, and frozen at −80 °C.

2.3. Fluorescent Activated Flow Cytometry of GFP Expressing Cells

Fibroblast cells from breast tissue from normal patients that were transduced with IRF1+I4 displayed a decrease in cell number in tissue culture conditions compared to control GFP transduced cells, or control cells expressing wildtype IRF1 as determined by fluorescent activated cell cytometry analysis (Supplementary Materials). Human fibroblast (ranging from 1 × 10⁴ to 3 × 10⁴ cells in 100 μL PBS Buffer) were used for flow cytometric analysis with FACS CantoTM II (BD Biosciences, Franklin Lakes, NJ, USA).

2.4. Primary Cell Culture Conditions

Human fibroblasts samples were obtained from normal breast from mammoplastic reduction procedures as previously described 4]. Cells were cultured in 0.1% gelatin-coated plates (Sigma Aldrich, St. Louis, MO, USA) in Ham’s F12/ DMEM-GlutaMAX (1:1) (DMEM, Euroclone, ECB7501L; Pero, Milan, Italy) containing 10% SR, (Invitrogen, Thermo Fisher Scientific, Waltham, MA, USA) 5% FBS, 1× (FBS, F7524; Sigma, St. Louis, MO, USA), NEAA-MEM (Sigma Aldrich, St. Louis, MO, USA), 1 μg/mL insulin (Sigma-Aldrich, St. Louis, MO, USA), 0.25 μg/mL hydrocortisone (Sigma-Aldrich, St. Louis, MO, USA), 10 ng/mL EGF (Sigma-Aldrich, St. Louis, MO, USA), and 4 ng/mL bFGF (Sigma-Aldrich, St. Louis, MO, USA) in a humidified atmosphere containing 5% CO2 at 37 °C.

2.5. Patient Collection of Breast Fibroblast Cells

Primary fibroblast cells of breast were isolated from heathy patients who have undergone mammoplasty reduction Human mammary cells were isolated from tissues obtained from informed, healthy patients (less than 24 years old), collected with the approval of the Clinical Ethics Committee of the Ministry of Health of Athens, Greece (CEC no. 01072016).

2.6. UV Treatment and Evaluation of Apoptotic Cells with Duramycin

Duramycin assay (D-1002—Molecular Targeting Technologies, Inc. West Chester, PA, USA). A Cy5 dye is attached to amino groups of duramycin. The conjugate contains 1 Cy5 dye molecule per duramycin molecule. Duramycin binds phosphatidylethanolamine (PE) at a 1:1 ratio with high affinity (Kd of 4–6 nM) and exclusive specificity. Cells were plated at the concentration of 10,000 cells/cm2 in 24 well-plates (Greiner Bio-One, Frickenhausen, Germany) and grown for 24 h. Day after cells were treated with 50 J/m2 UVC using UVP HL-2000 HybriLinker incubator and fresh medium was replaced. Untreated cells were used as negative control. After 24 h treatment, treated and untreated cells were washed in 1 × PBS buffer (Sigma-Aldrich, St. Louis, MO, USA) and detached by 0.25% trypsin-0.53 mM EDTA (Invitrogen™ Thermo Fisher Scientific, Waltham, MA, USA) for 3 min at 37 °C. After neutralization with complete medium cells were centrifuged 0.3 RCF for 5 min and washed once with 1 × Hank’s balanced salt solution (HBSS buffer, Sigma-Aldrich, St. Louis, MO, USA) before staining. Supernatant was taken off and cells were re-suspended in 2% FBS-1 × HBSS in 100 µL volume. Untreated and UV-C treated cells were stained in suspension with Duramycin-Cy5 (2 µg/mL) at 37 °C for 20 min, and cell suspension was mixed thoroughly by repeated inversions. After incubation, the reaction was blocked by washing cells twice with 1 mL of 2% FBS-1 × HBSS at 0.2 RCF for 5 min. Cells were resuspended in 200 µL 1 × HBSS and analyzed by flow cytometry (CantoTM II, BD Biosciences, Franklin Lakes, NJ, USA). Detection for Duramycin-Cy5 is through APC. Vertical axis is Side Scatter (SSC).

2.7. HER2+ Breast Cancer and Normal Breast Transcriptomic Analysis at the Single Cell Level

2.7.1. Single-Cell RNA Sequencing Data Analysis and Integration of scRNA-Seq Published Datasets

scRNA-seq data from publicly available datasets of adult human breast tissue were downloaded (URL accessed on 30 January 2024) from two separate Chromium 10 × Genomics based studies (Gene Expression Omnibus (GEO) repository: https://www.ncbi.nlm.nih.gov/geo/query/acc.cgi?acc=GSE195665 (accessed 20 July 2025) and data subset GSE235326 for adult healthy breast, and https://www.ncbi.nlm.nih.gov/geo/query/acc.cgi?acc=GSE176078 (accessed 20 July 2025) for human breast cancer patients. Five normal breast samples and 5 HER2+ breast cancer patient samples were selected for this analysis from samples collected from MD Anderson (MDA), UC Irvine (UCI) or Baylor College of Medicine (BCM), USA (see Supplementary Materials summarizing the patient cohort information). HER2+ breast cancer samples were chosen from Caucasian females with no radio or chemo-therapy treatment. In addition to the clinical metadata, adult normal and cancer breast samples were selected based on the procedure by which the tissue source was collected and on the same tissue dissociation protocol and the same single-cell RNA-seq technology (Chromium 10 × Genomics) used. The raw data were imported and processed using the default parameters of the CellRanger pipeline (v.3.1.0, 10 × Genomics), R programming language (v4.4), and Seurat package (v5.1.0). The integrative analysis of the different samples together was performed to allow the data to be combined, and the different cell populations present in the normal and tumor breast tissue to be compared. Osteoarthritis (OA) and rheumatoid arthritis (RA) synovial tissue were obtained by integrating 3 OA https://www.ncbi.nlm.nih.gov/geo/query/acc.cgi?acc=GSE152805 (accessed 20 July 2025) and 4 RA https://www.ncbi.nlm.nih.gov/geo/query/acc.cgi?acc=GSE200815 (accessed 20 July 2025) datasets as previously described [1].

2.7.2. Data Normalization, Integration and Clustering

Normalization and log-transformation of each dataset was with Seurat v3.0.0 and Method36 in R (v3.5.0) as described in our previous study of RNASET2, syndecans and TMEM230 for patients with rheumatoid arthritis [4]. Dimensionality reduction and clustering were performed using default parameters. Integration anchors were calculated with Find Integration Anchors. Datasets were integrated using Integrate Data (Seurat V.5.2.0). Downstream analysis was performed on the integrated assay, scaled using Scale Data (Seurat V5.2.0) and reduced in dimensionality using PCA and UMAP (Run PCA, RunUMAP). Clusters were identified using the Louvain algorithm Find Neighbors. Find Clusters (Seurat V5.2.0) at a resolution of 0.5 following construction of a shared nearest neighbor graph [19,20].

2.7.3. Visualization

UMAP projections were formed to see cells by sample, cluster identity, and disease condition using DimPlot. Cluster identities were manually annotated based on known markers and renamed using RenameIdents. Violin plots and additional feature plots (VlnPlot, FeaturePlot, Seurat V5.2.0) were created to visualize gene expression patterns across clusters.

2.7.4. Differential Expression and Cell Type Composition

Differential expression analysis within individual clusters was by using Seurat Find Markers function and the Wilcoxauc method (pRESTO package v5.3.0) for disease and normal samples. Markers were selected by minimum expression percentage and adjusted p-value thresholds. Bar plots were generated to display relative proportions, number of cells per sample and number of cells per cluster (ggplot2).

2.7.5. Gene Set Enrichment Analysis (GSEA)

Gene Set Enrichment Analysis was performed on ranked gene lists (by AUC) for each cluster using the fgsea package. Gene sets were obtained from the MSigDB database via msigdbr, spanning collections H, C1–C8. Enrichment scores and leading-edge genes were calculated and classified as upregulated or downregulated based on AUC thresholds.

3. Results

3.1. Comparative IRF1 mRNA Expression in RA and OA Cell Clusters of Synovial Tissue from Patients and Identification of Stress and Cell Defense Response Genes and Pathways

We previously demonstrated that TMEM230 and RNASET2 were downregulated in CXCL12 expressing synovial fibroblast cells of rheumatoid arthritis (RA) compared to osteoarthritis (OA) patients [1]. CXCL12 positive cells contribute to tissue remodeling in RA by TMEM230 dependent trafficking and secretion of membrane bound vesicles containing RNASET2 and syndecans. In the present study we further investigated whether other pathways were downregulated with TMEM230 modulation in CXCL12 expressing synovial fibroblast cells of RA patients (Table 1). Pathways in response to reactive oxygen species, endoplasmic reticulum unfolded proteins, xenobiotic metabolism, ultraviolet (UV) radiation, and hypoxia were identified, supporting that TMEM230 has diverse roles in stress and defense response and that TMEM230 may contribute to several human pathological conditions (Table 1). As we previously identified that many of these pathways in gliomas of patients were associated with aberrant expression of TMEM230 and RNASET2, in our current study we investigated whether these pathways would also be identified in fibroblast clusters of HER2+ breast cancer patients.
We and other groups have previously identified that the interferon induced transmembrane protein 3 (IFITM3) and the interferon (IFN) pathways are co-regulated with the tumor protein TP53 pathway components, such as p21 (CDKN1A) [12]. The identification of TP53 pathway in CXCL12 fibroblast cells in RA (Table 1) supported our previous results showing that interferons (IFNs) modulate glycosylation and trafficking of major histocompatibility complex (MHC) antigens in RA [2].
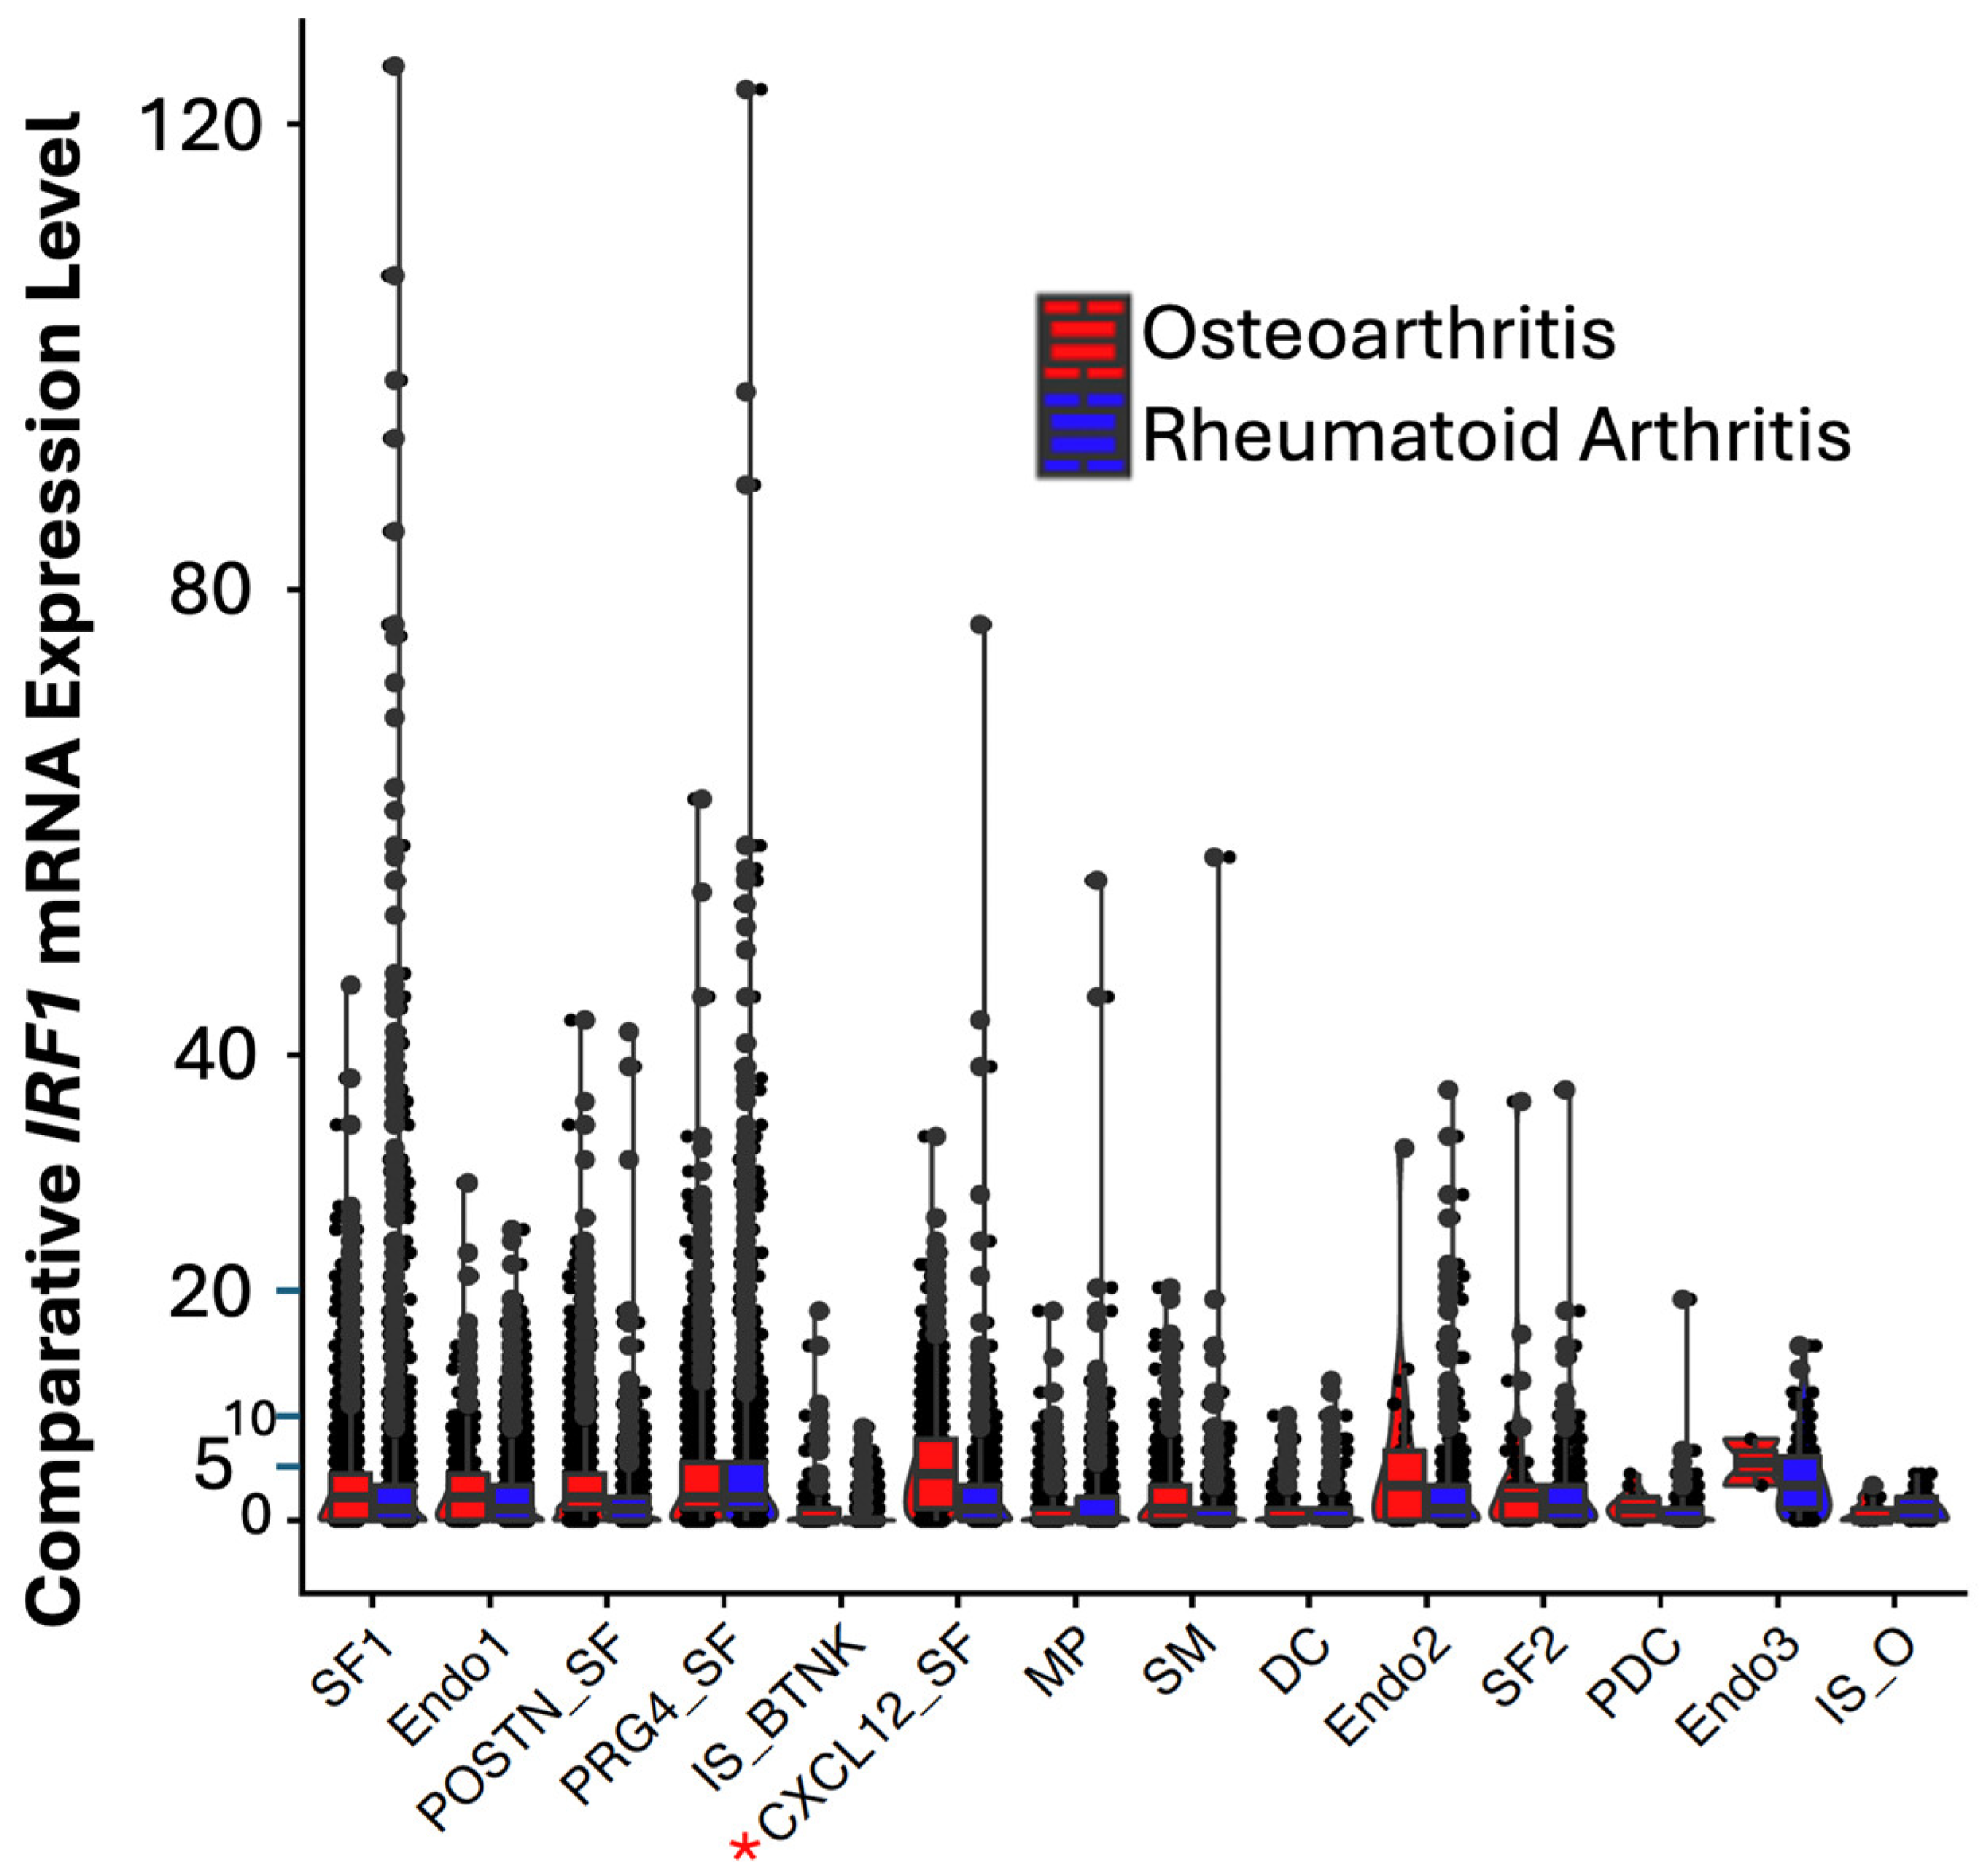
By screening for differentially expressed IRFs, IRF1, a trans activator of TP53 was identified differentially expressed in RA in respect to OA patients (Supplementary Table S1 and Figure 1). While the fibroblast cell clusters (SF_1, CXCL12_SF, and PRG4_SF) displayed an extreme range of expression of IRF1 in uniform manifold approximation and projection (UMAP) analysis, (blue (high) and grey (low), Supplementary Figure S1) in outlier cells (Figure 1), IRF1 was most downregulated (approximately 4 times, p-value ≤ 0.05) in CXCL12 fibroblasts (indicated by a red asterisk).
To support the hypothesis that IRF1 may have a role in fibroblast cells from human breast tumors, in vitro cell assays were performed in patient-derived fibroblast cells by constitutive interference of the wild type IRF1 gene activity.

3.2. Generation of Lentiviral Construct Expressing IRF1 Intron 4 Retaining (IRF1+I4) Isoform and Cell Culture Assays of Fibroblast Cells from Patients with No History of Tumor

Deletions or rearrangements of the IRF-1 tumor suppressor gene and exon skipping of the IRF-1 full-length wild type (IRF-1 WT) transcript have been described in patients with myelodysplastic syndromes (MDS) and leukemia [21,22,23,24,25,26,27,28,29,30,31]. An isoform of IRF1 was identified, designated IRF1+Intron4 (IRF1+I4, GenBank KC209828.1 and Supplementary Figure S2) having dominant negative activity on the wild-type IRF1 protein. As the UV induced cell damage response pathway (https://www.gsea-msigdb.org/gsea/msigdb/cards/HALLMARK_UV_RESPONSE_UP) (accessed 20 July 2025) was identified in CXCL12 cells (Table 1) to be regulated by TP53 and IFNs, expression and tissue culture assays were performed using breast fibroblast cells isolated from patients with no history of cancer. In these cells, normal IRF1 activity was inhibited by constitutive expression of the IRF1+I4 isoform using a lentiviral system. As expected, inactivation of IRF1 promoted downregulation of TP53 expression (Supplementary Figure S3). In agreement, as IRF1 transactivates TP53 and the primary target of the TP53 is p21, a cyclin dependent kinase (CDK) inhibitor, the expression of p21 was investigated and it was also found downregulated (Supplementary Table S3). Both genes induce cell cycle arrest, thereby allowing DNA repair mechanisms to be activated or alternatively, they promote programmed cell death (apoptosis) if DNA repair cannot be accomplished [32,33].
The roles of TP53 and IRF1 are therefore complex and appear contradictory as we have previously demonstrated that p21 can promote cell cycle arrest of cancer stem cells (CSCs) [34]. Induction of a cell quiescent state is thought to allow CSCs to survive the DNA damaging effects of anti-cancer drugs [12,22]. However, p21 inhibition of cyclin dependent kinase 2 (CDK2) expression can also promote apoptosis of CSCs. In agreement with the observation that p21 inhibits CDK2, CDK2 was found inversely expressed in respect to p21 in IRF1+I4 transduced cells (Supplementary Table S3) [35]. The upregulation of CDK2 suggests that IRF1 has a role in apoptosis in human breast fibroblast cells. However, upregulation of CDK2 is associated with both inhibiting and promoting apoptosis.
We therefore examined the expression level of BIRC5 (survivin) in IRF1+I4 transduced cells. BIRC5 is a member of the inhibitor of apoptosis family of genes. Like RNASET2, BIRC5 is reported to be expressed in a TP53/p21 cell cycle dependent manner and to repress caspase activation and therefore apoptosis [36,37]. In agreement that BIRC5 is expressed highly in most human tumors and completely absent in terminally differentiated cells, BIRC5 was found upregulated in IRF1+I4 transduced breast derived fibroblast, suggesting that loss of IRF1 activity inhibits apoptosis (Supplementary Figure S3). As the expression data does not provide evidence for a conclusive role of IRF1 in breast cancer, to determine whether downregulation of IRF1 was unambiguously associated with change in cell number and apoptosis, IRF1+I4 transduced fibroblast cells from patients with no tumor history were investigated in cell culture assays.
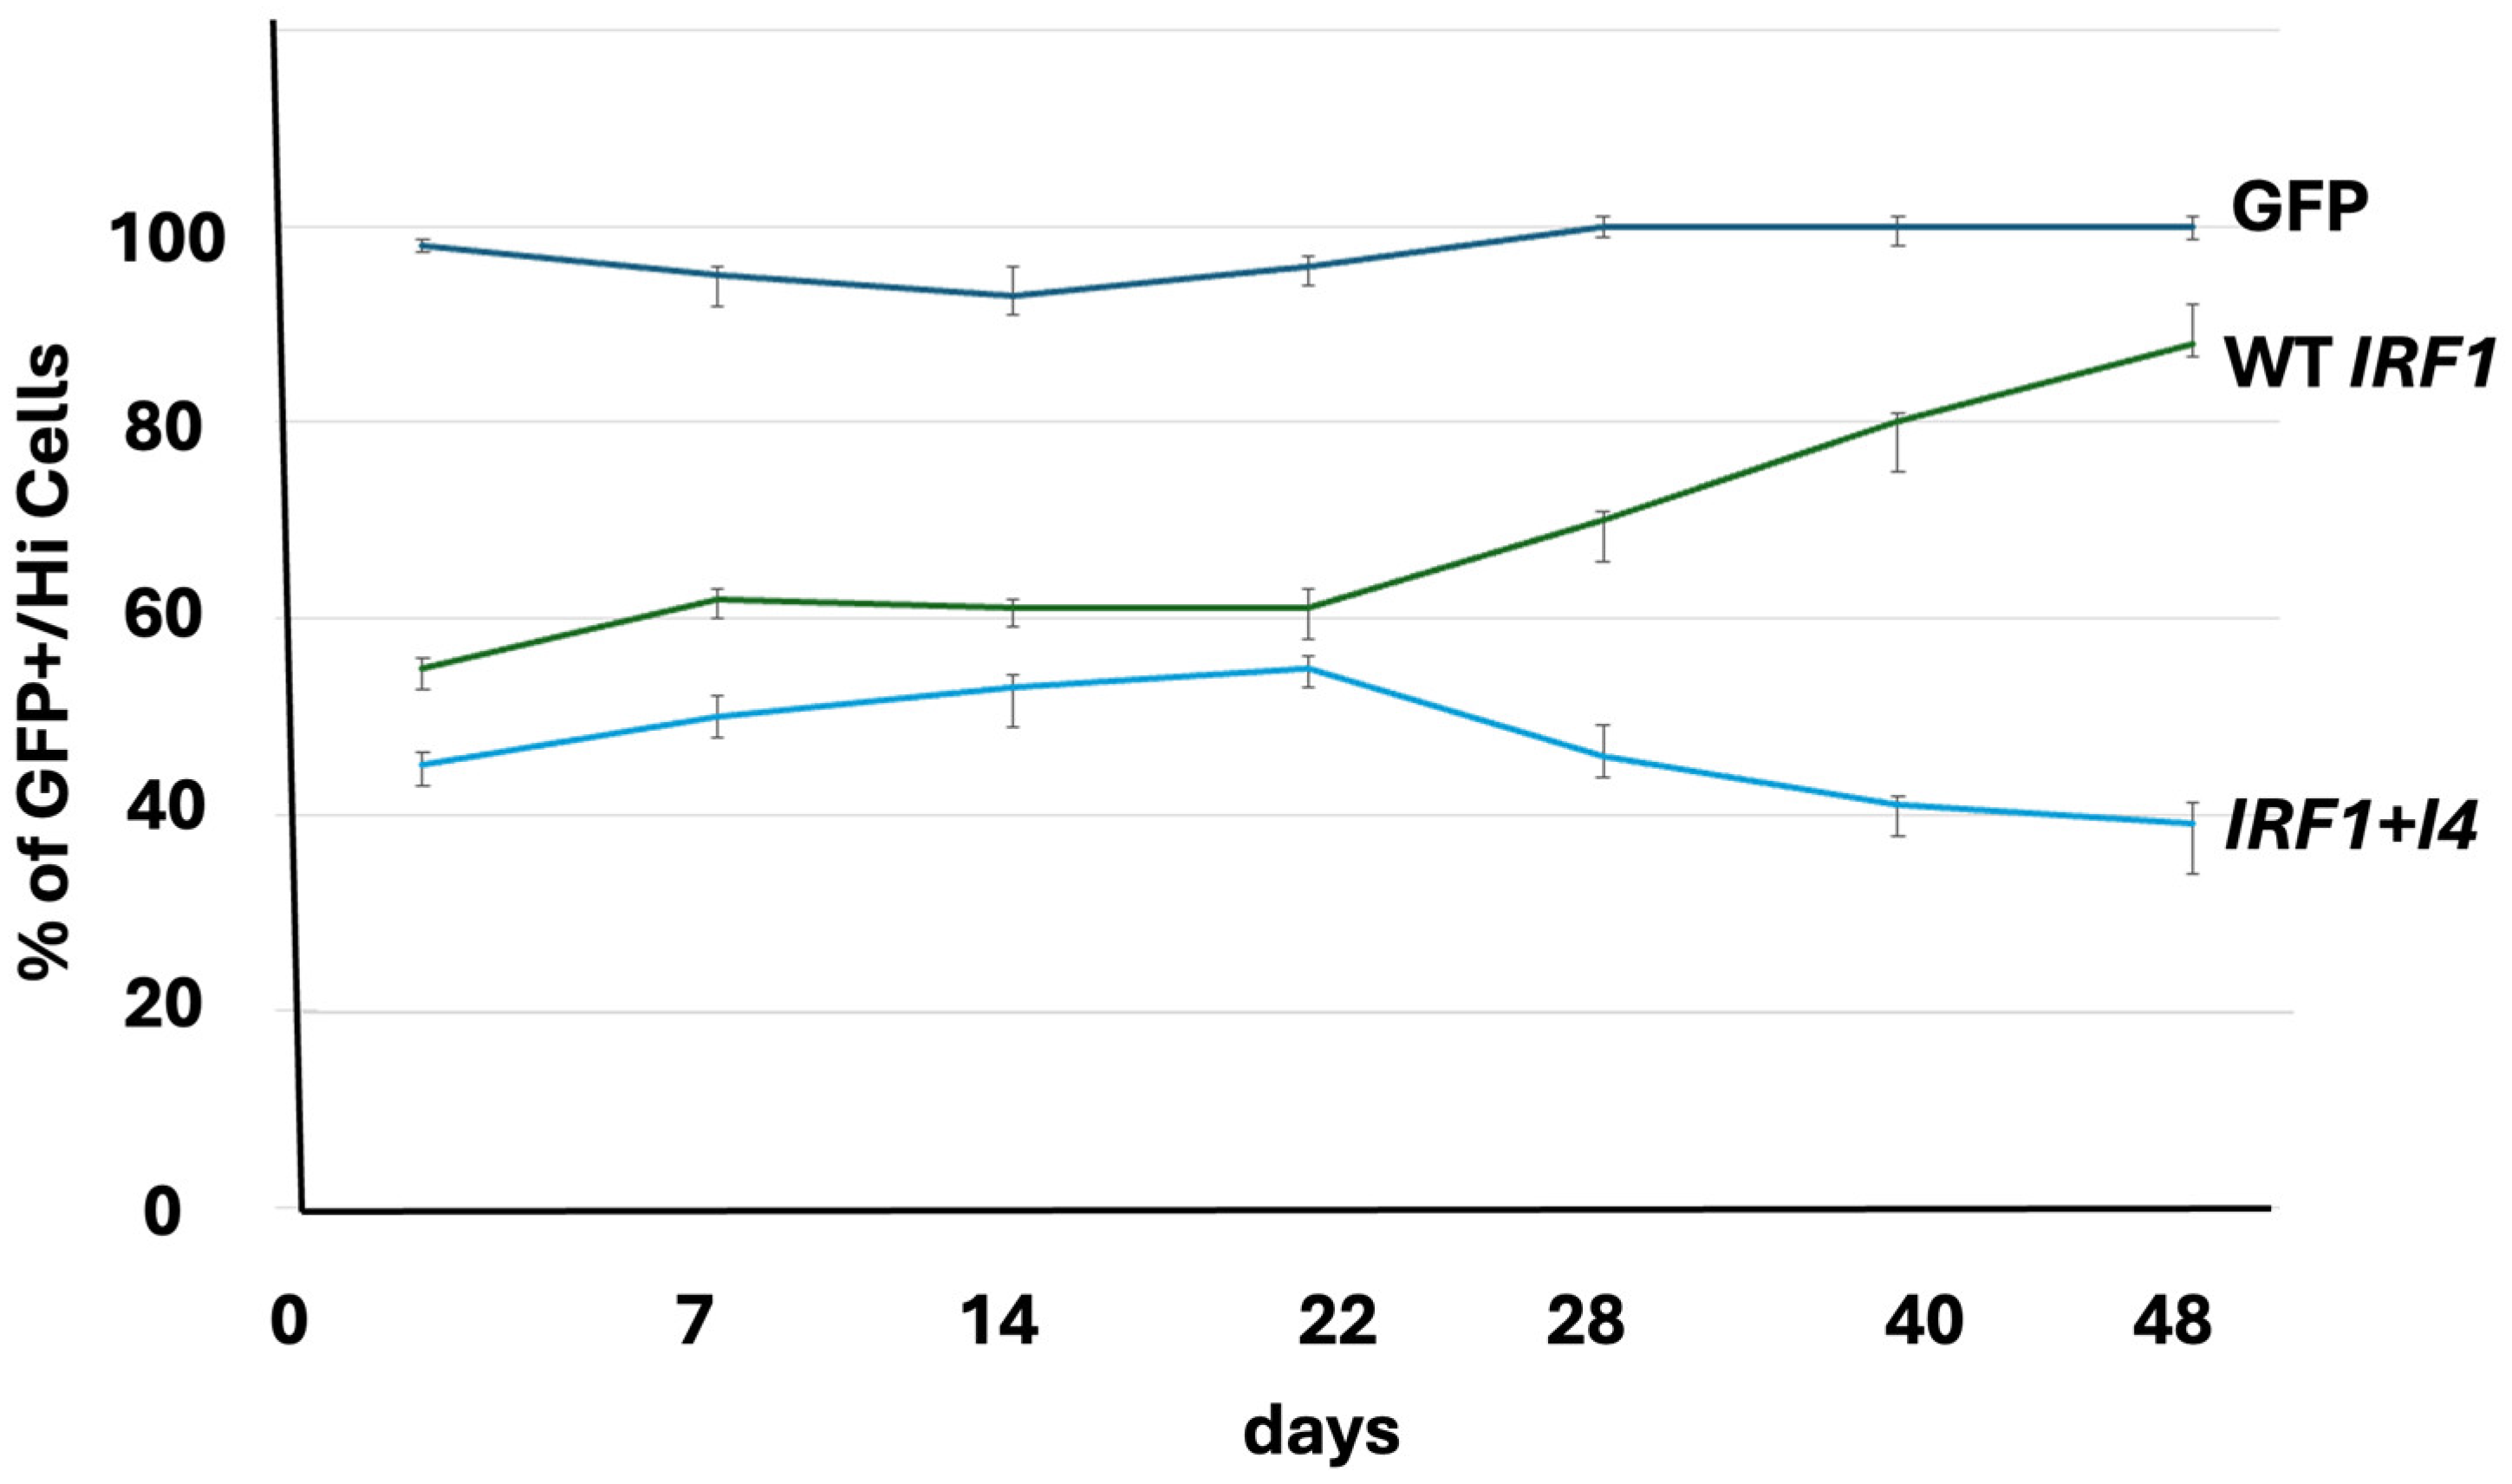
The cell culture assays showed decrease in cell number in cells expressing IRF1+I4 compared to control (Figure 2 and Figure S4).
To ascertain the activity of IRF1 in apoptosis, IRF1+4I transduced fibroblast cells derived from patients without tumors were then treated with UV radiation to induce cell stress. Apoptotic and necrotic cells were quantified using fluorescent activated flow cytometry with duramycin that binds phosphatidylethanolamine present in the cell membrane. Differences in intensity of the fluorophore associated with duramycin identified which cells were undergoing apoptosis or necrosis. Breast fibroblast cells transduced with IRF1+I4, when cultured after treatment with UV radiation, were observed to have increased apoptotic activity (p < 0.05) compared to control GFP cells (Supplementary Figure S5). In a representative analysis, 1.6% of control cells expressing wildtype IRF1 were associated with duramycin expression (population P3) compared to 3.8% of IRF1+I4 cells.
In conclusion, our data showed that IRF1 expression was downregulated in fibroblast cells of human HER2+ breast tumors (Figure 1) and that loss of IRF1 expression with transduction of IRF1+I4 was associated with decrease of TP53 and p21, increase of CDK2 and BIRC5 expressions, and increased apoptosis (Supplementary Figures S3 and S5).
Paradoxically, while the expression analysis showed inhibition of apoptosis, the in vitro cell culture assays showed increase of apoptosis with loss of IRF1 in breast fibroblast cells (Figure 2).
Our previous studies supported that in addition to IRF1, TMEM230, RNASET2, and SDC2 have tumor promoting and inhibiting functions. To explain this, we therefor hypothesized that the oncogenic activity of genes with pleiotropic functions is determined by which cell types these genes are expressed in. Additionally, different levels of expression may promote or inhibit oncogenic activity. Therefore, to exactly determine the tole of genes with pleiotropic functions it is necessary to assay all cell types in a tumor mass. The technology of single cell sequencing provides a powerful tool to correlate the expression level of a gene with different molecular pathways in diverse cell types in human tumor [19,20].
For instance, the IFNγ pathway regulated by IRF1 is reported to have pleiotropic functions in tumors by suppressing and inducing apoptosis [38,39,40,41,42]. We propose that this apparent contradiction can be due to previous research having mostly been performed using clonal cell lines of a specific cell type which do not recapitulate the interactions of all the different cell types in a tumor tissue in which IFNs are expressed. Our single cell transcript analysis of synovial tissue of RA patient for instance showed definitively that different types of fibroblast cells have significantly different levels of expression of IRF1 and therefore some fibroblast cells may promote or inhibit apoptosis (Figure 1).

3.3. IRF1 Expression in Human HER+ Breast Tumor Tissue by Single Cell Transcriptomic Analysis

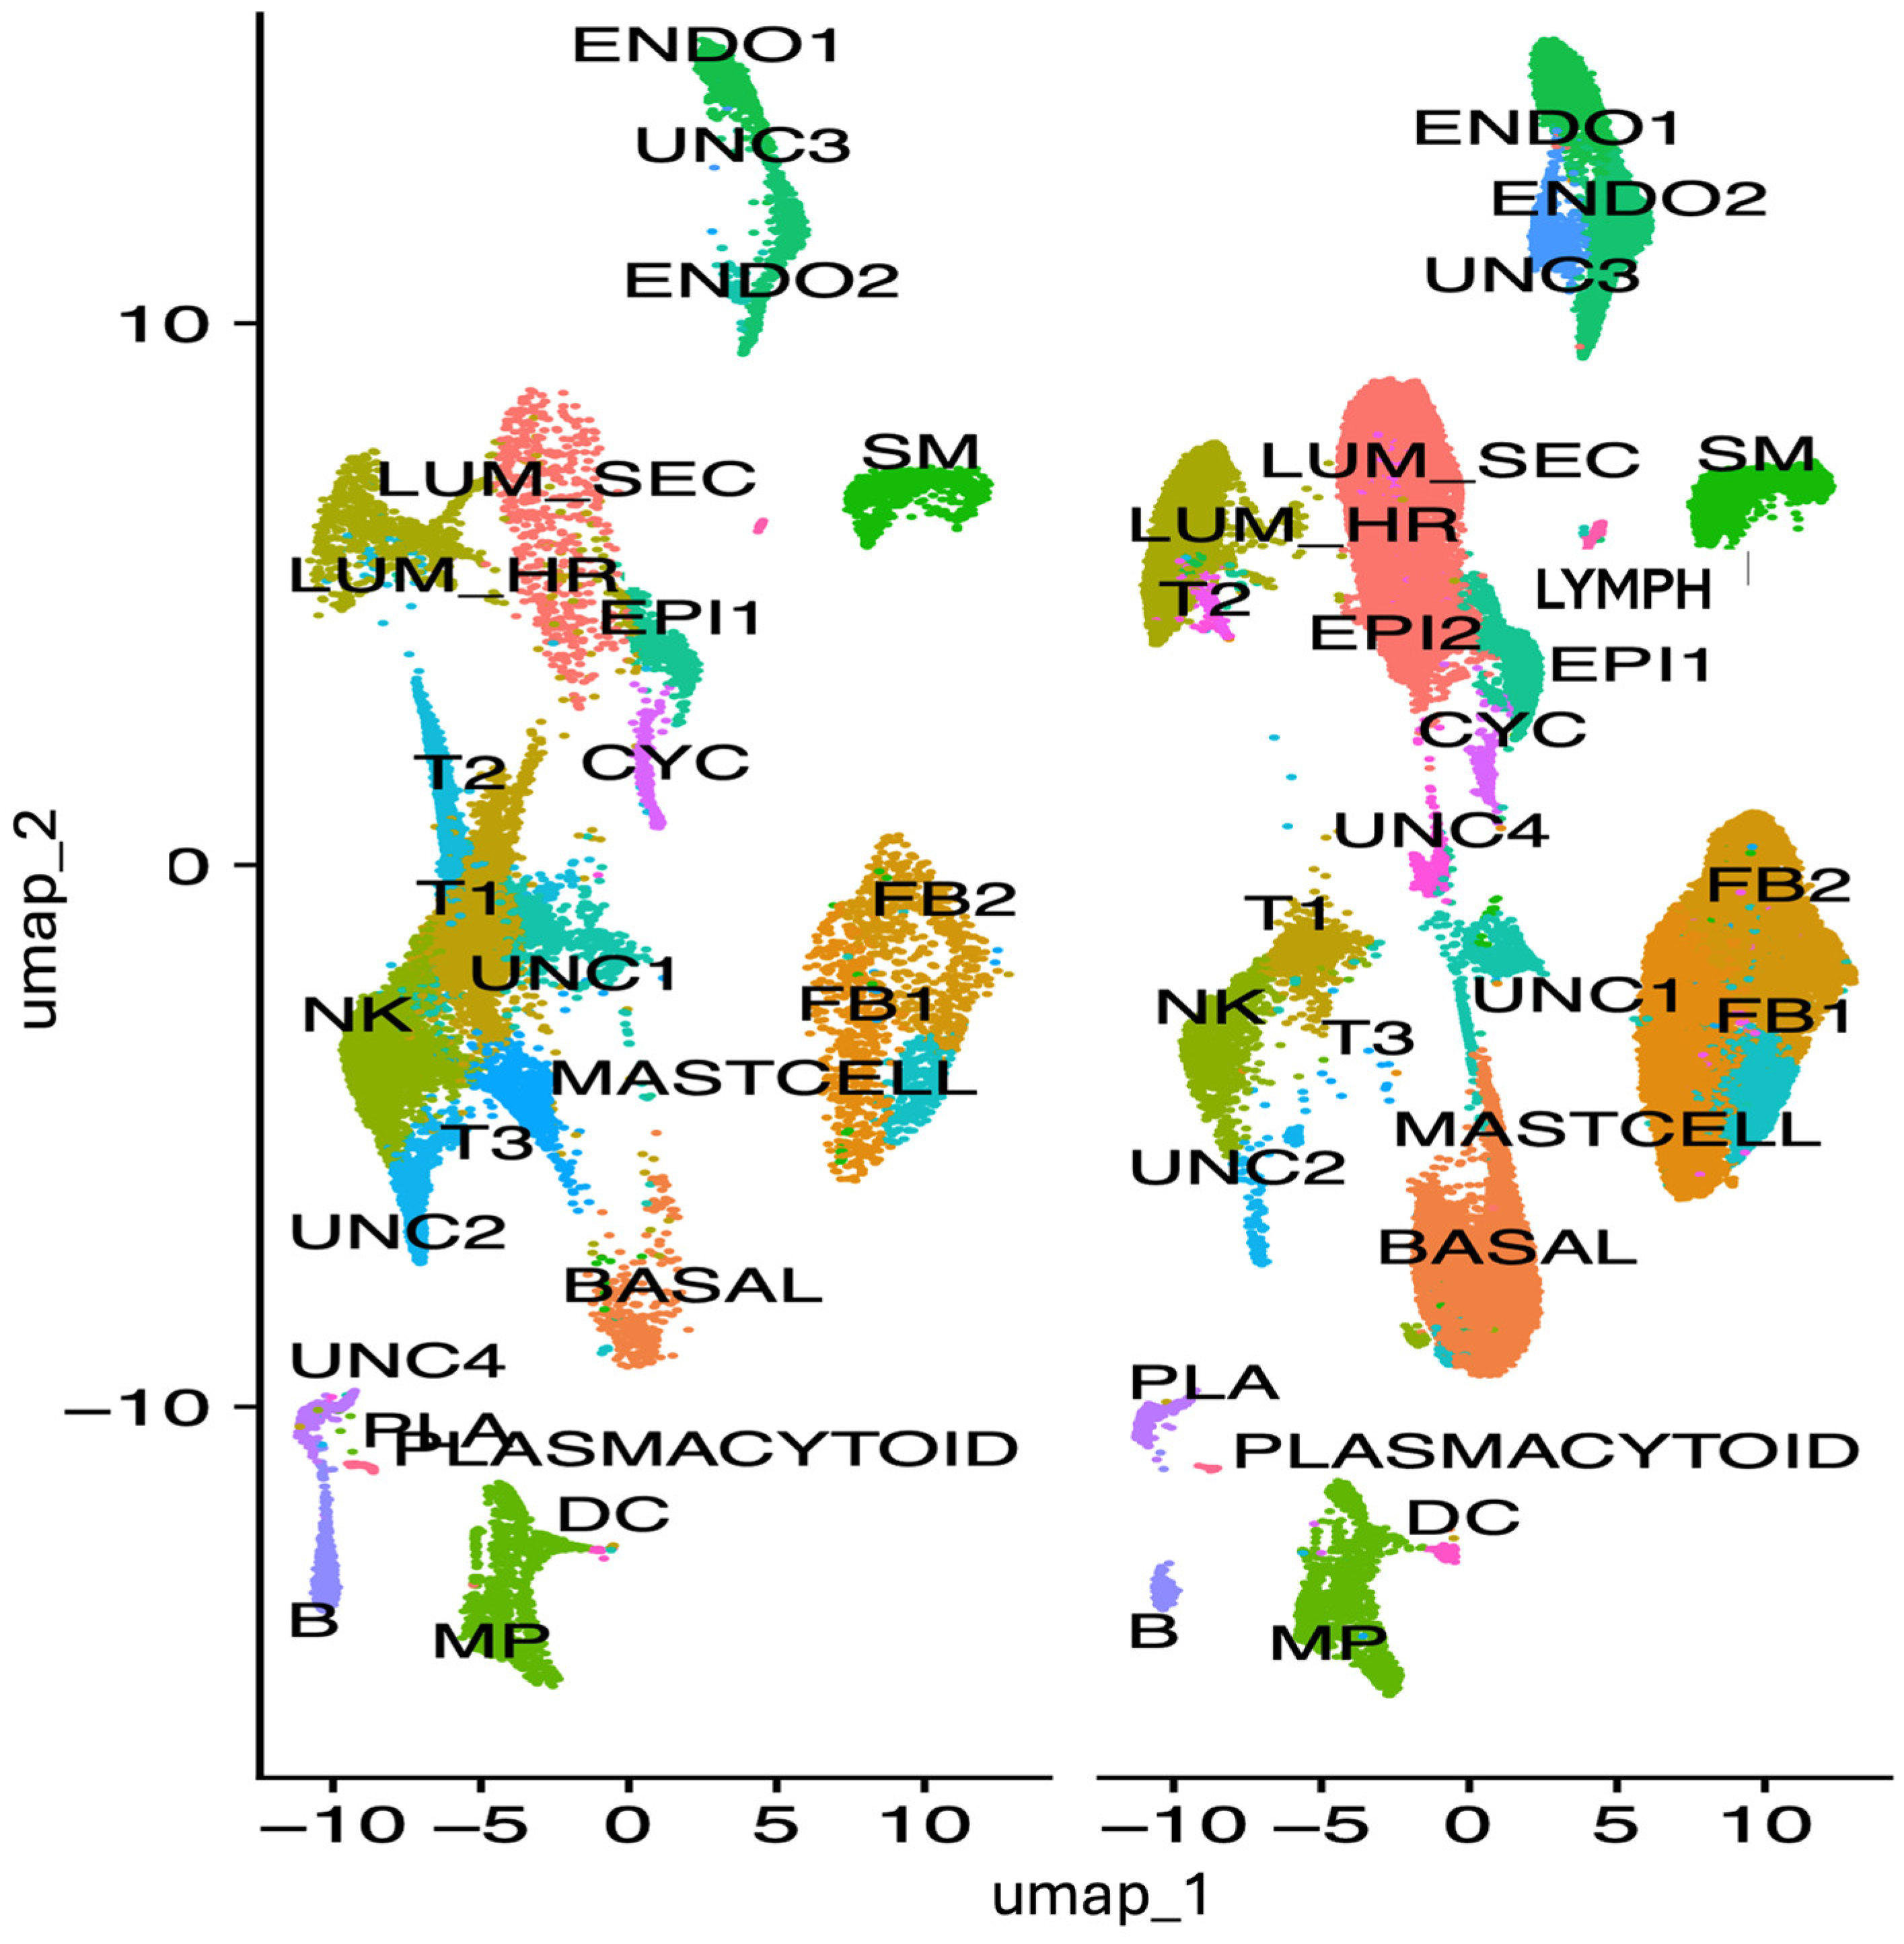
To ascertain which cell types may be associated with expression and modulation of IRF1 expression in breast tumor, IRF1 expression was analyzed by single cell RNA sequencing in all cell types derived from HER2+ (ERBB2) tumor and non-malignant breast tissues from patients, used as control (Figure 3).
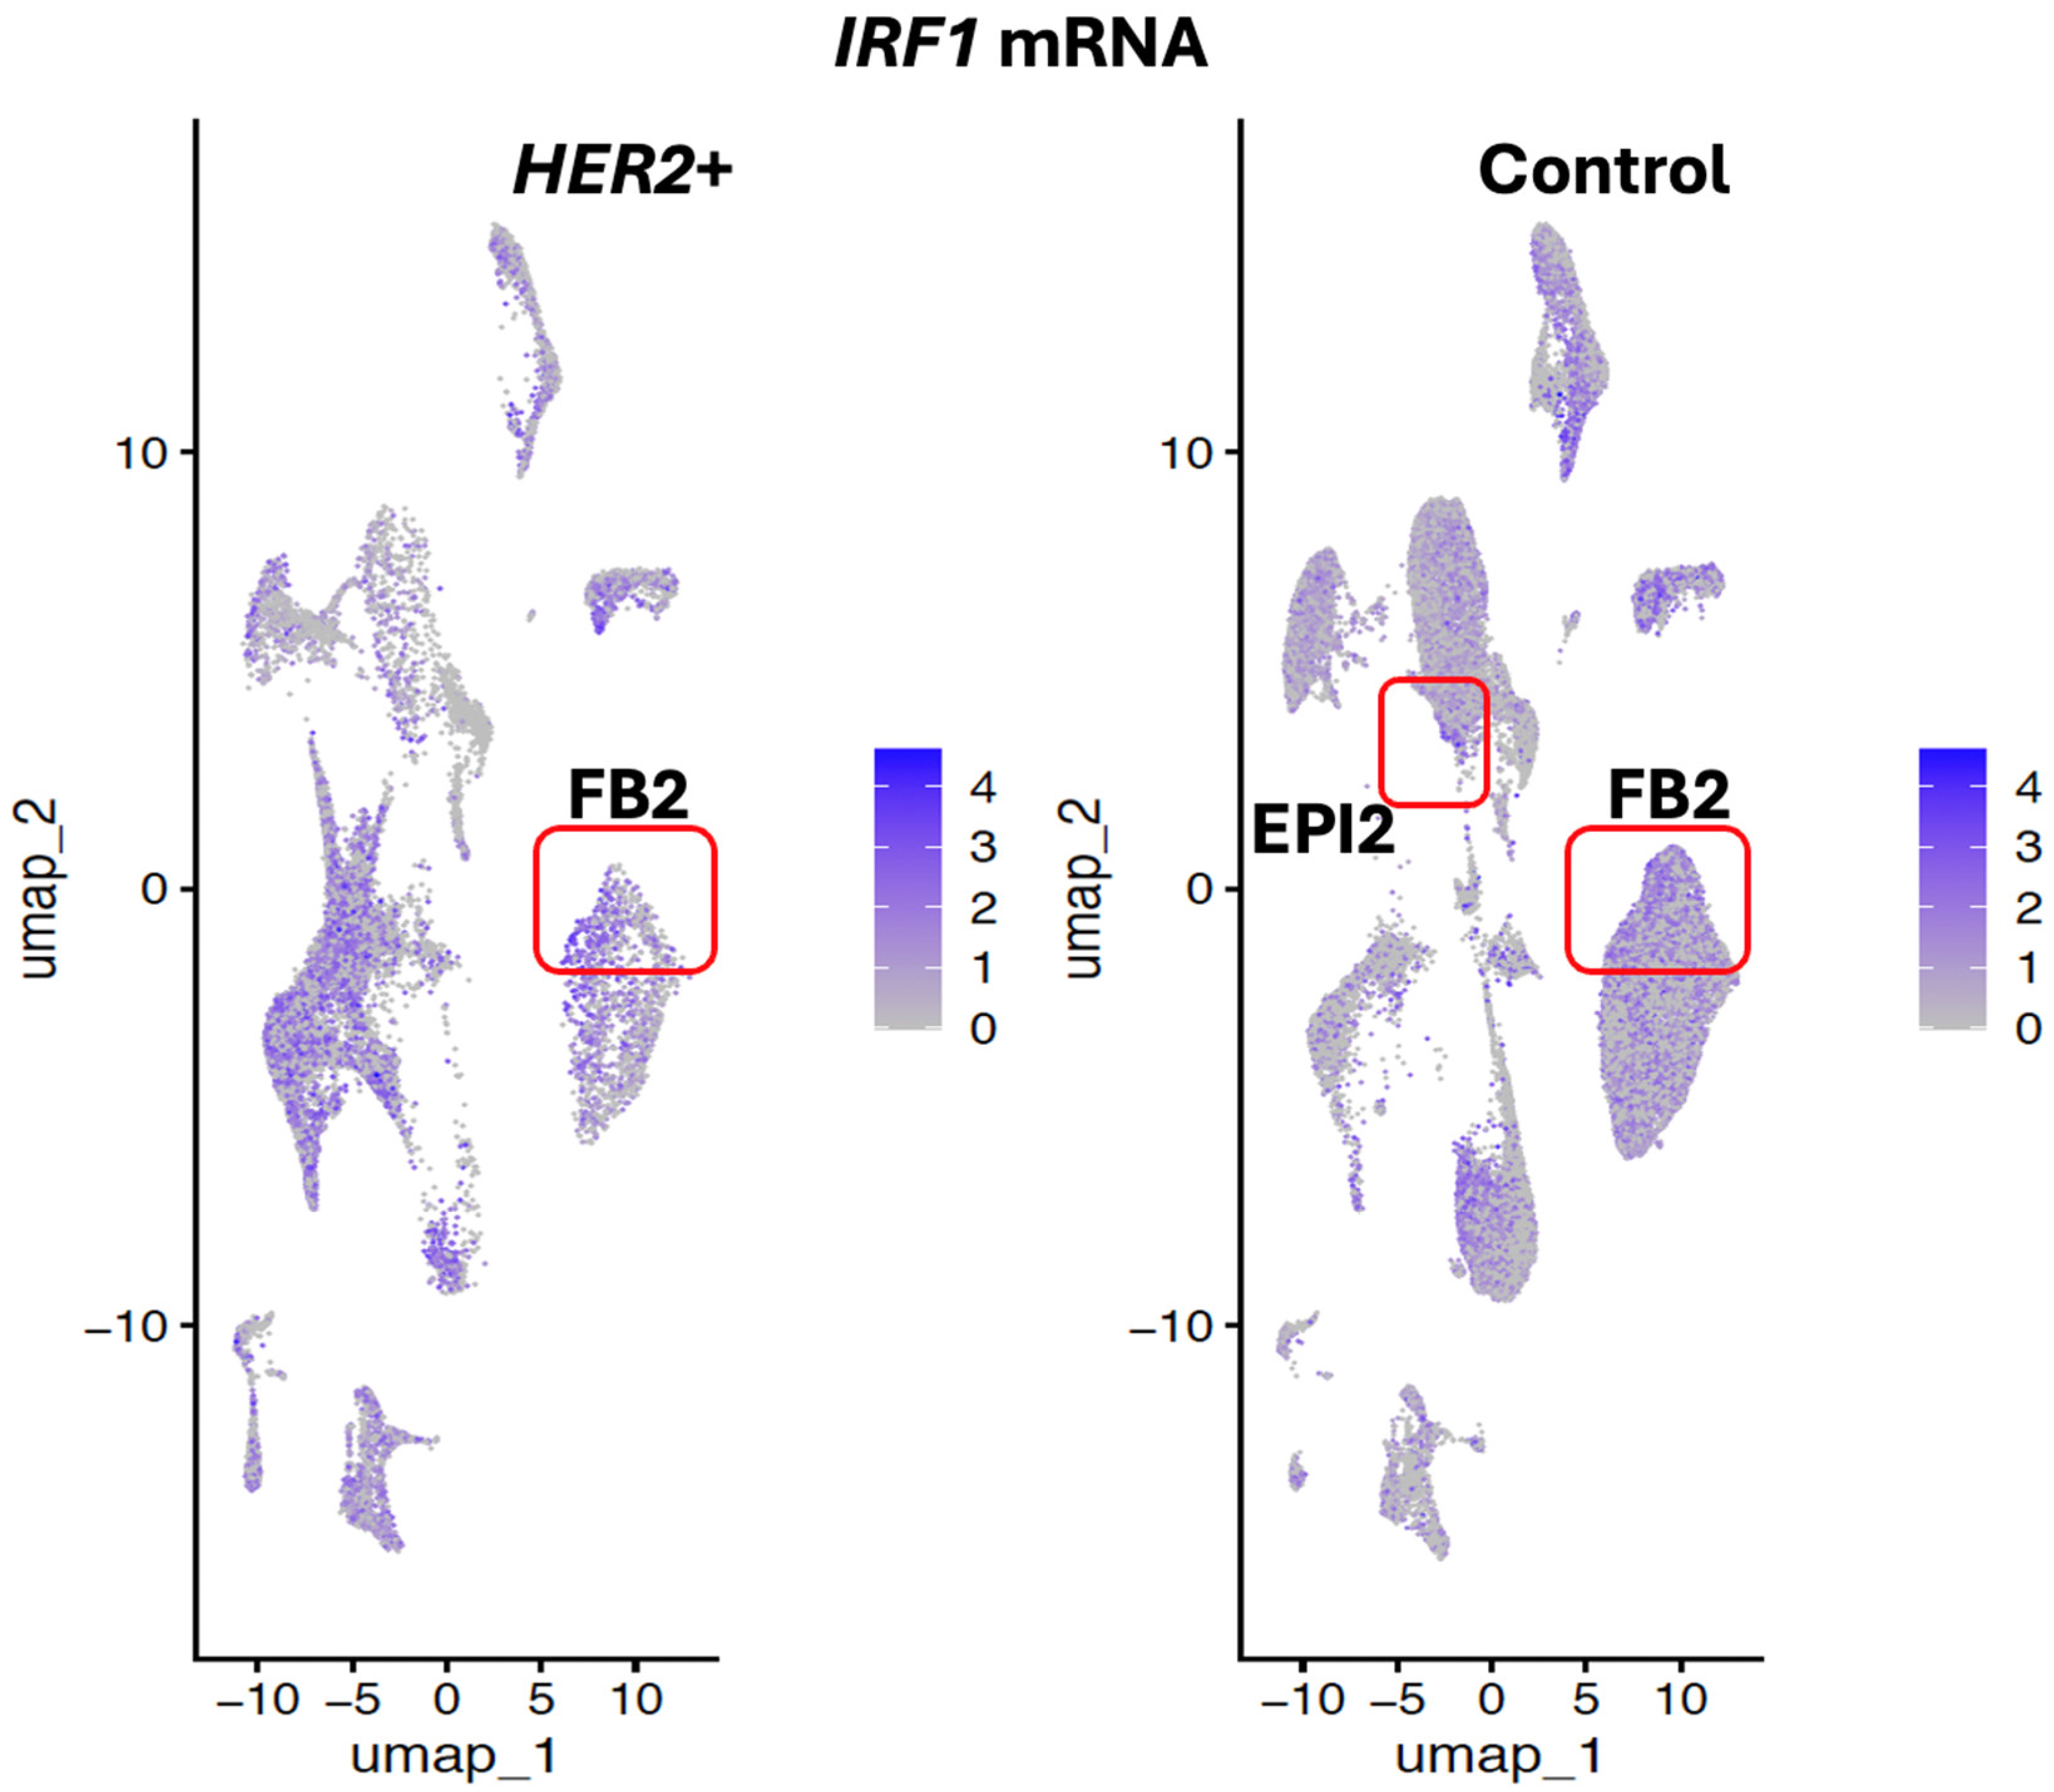
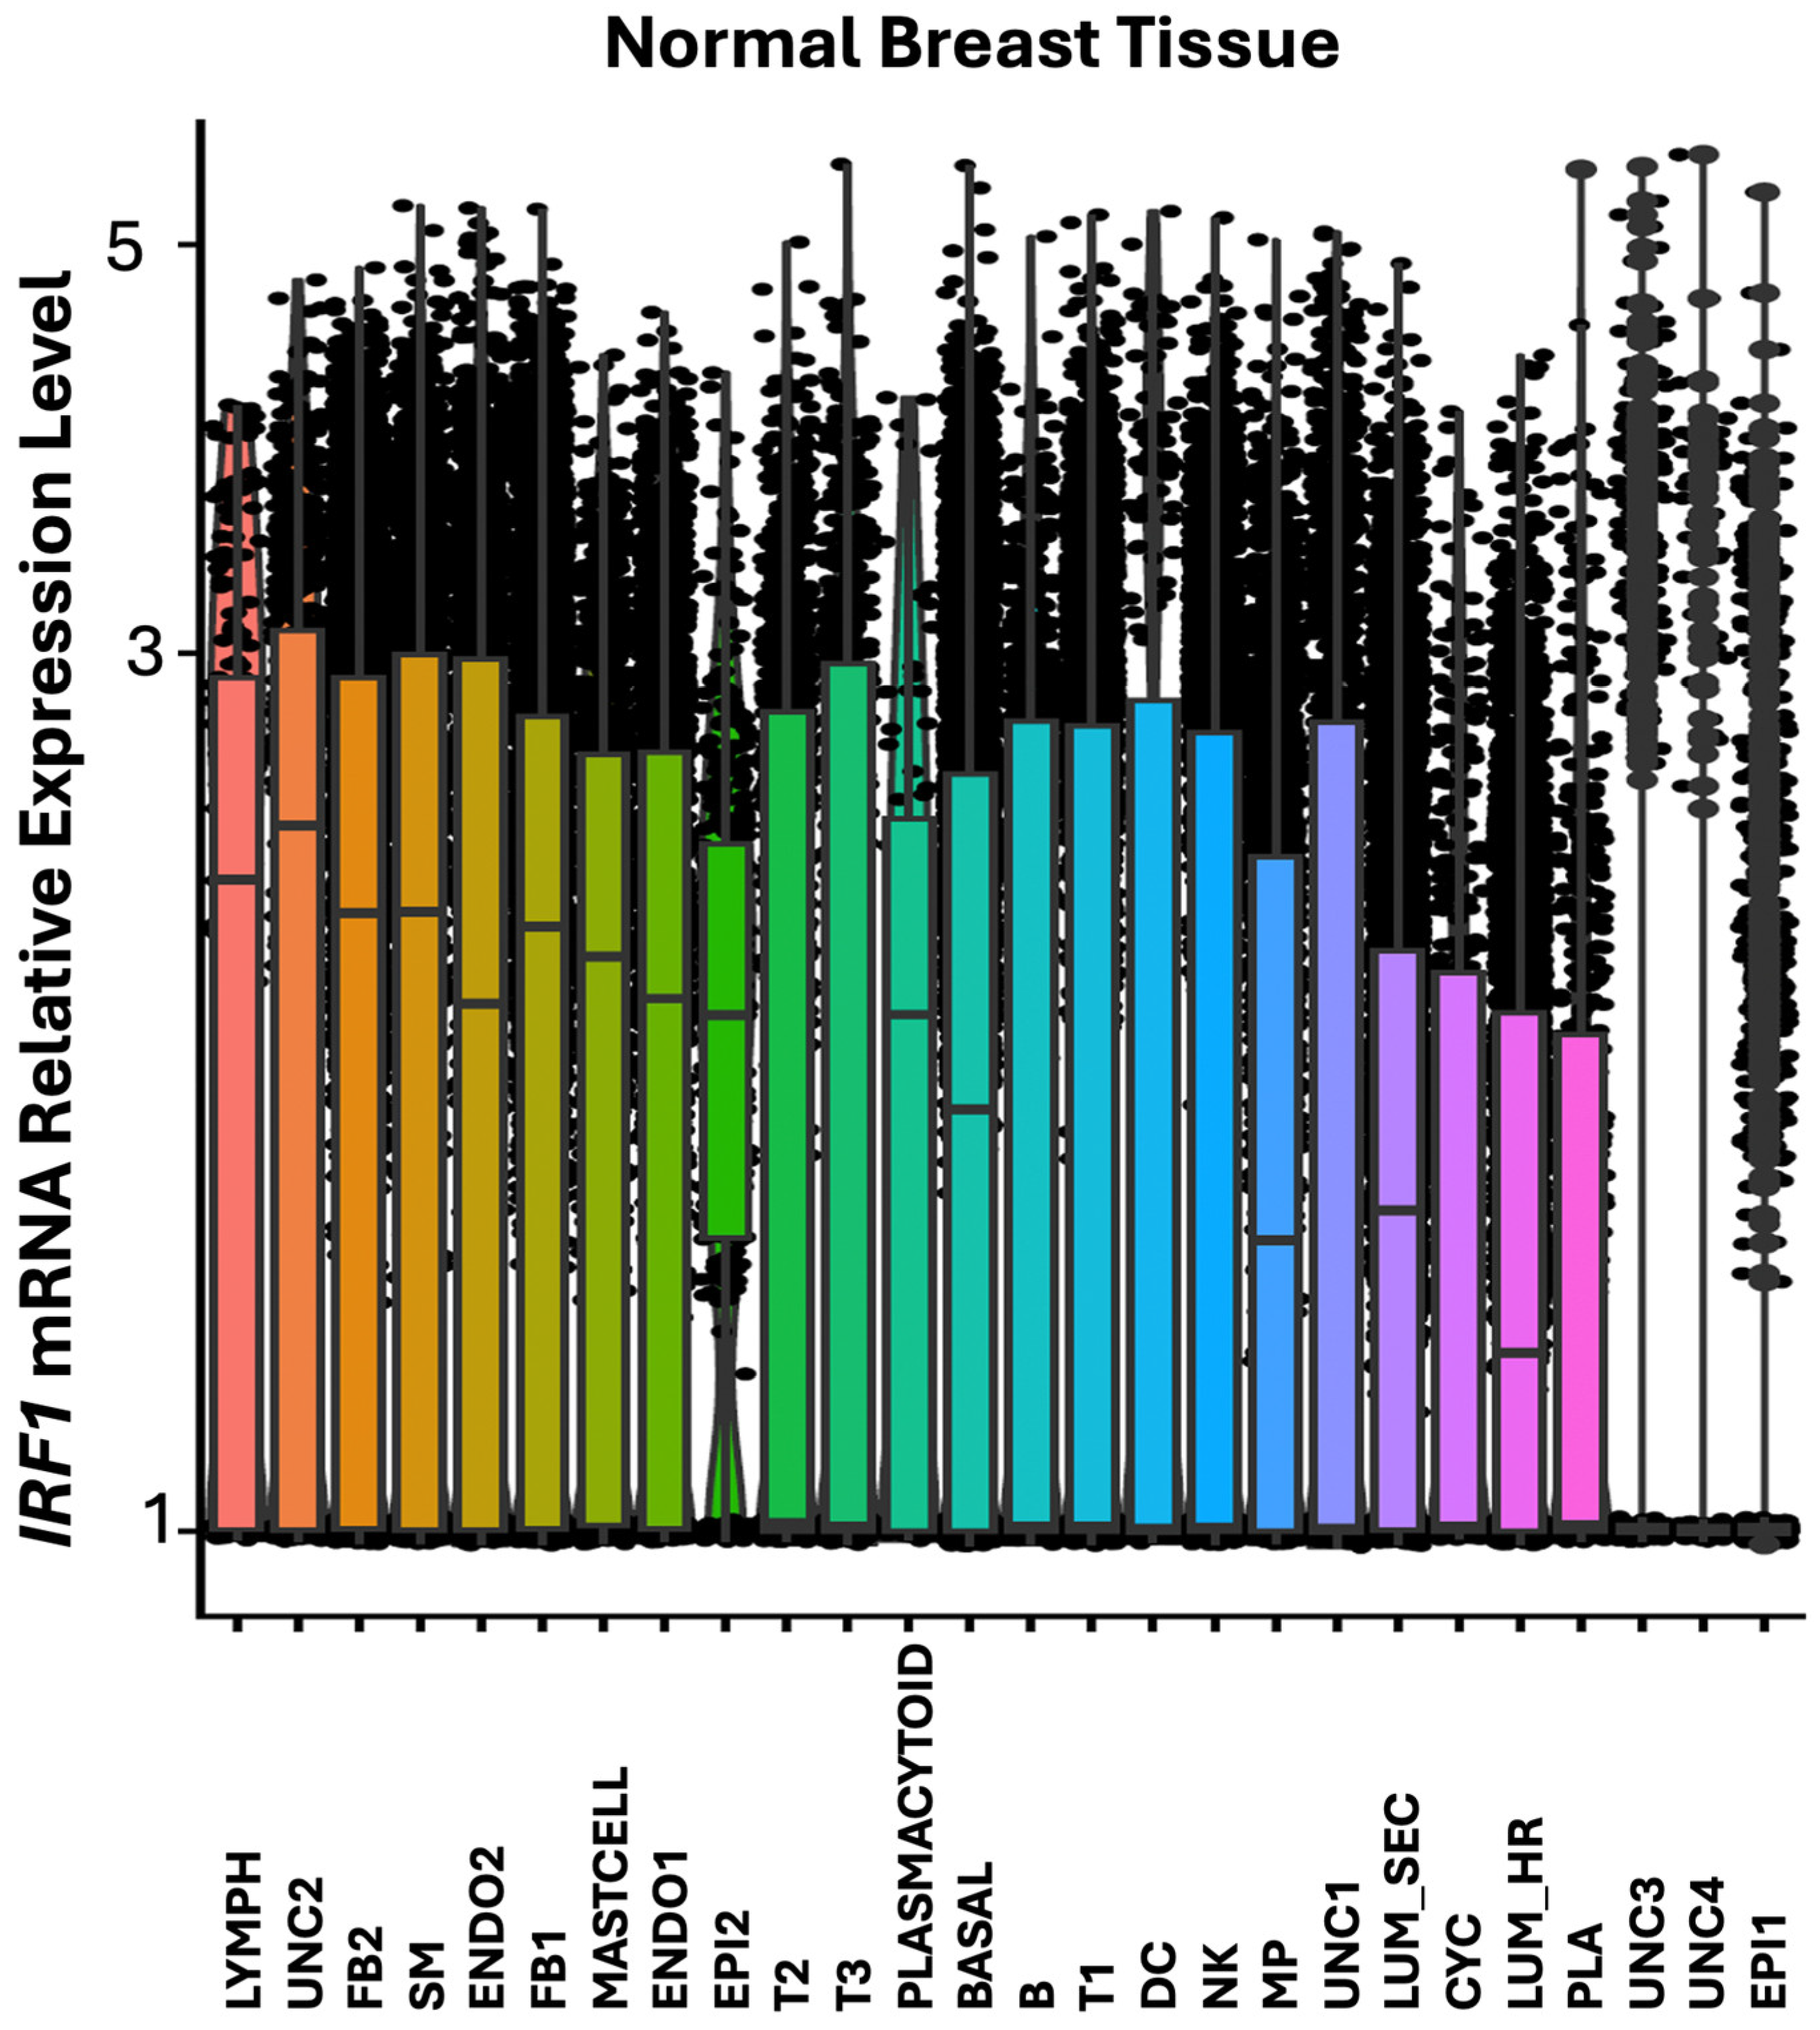
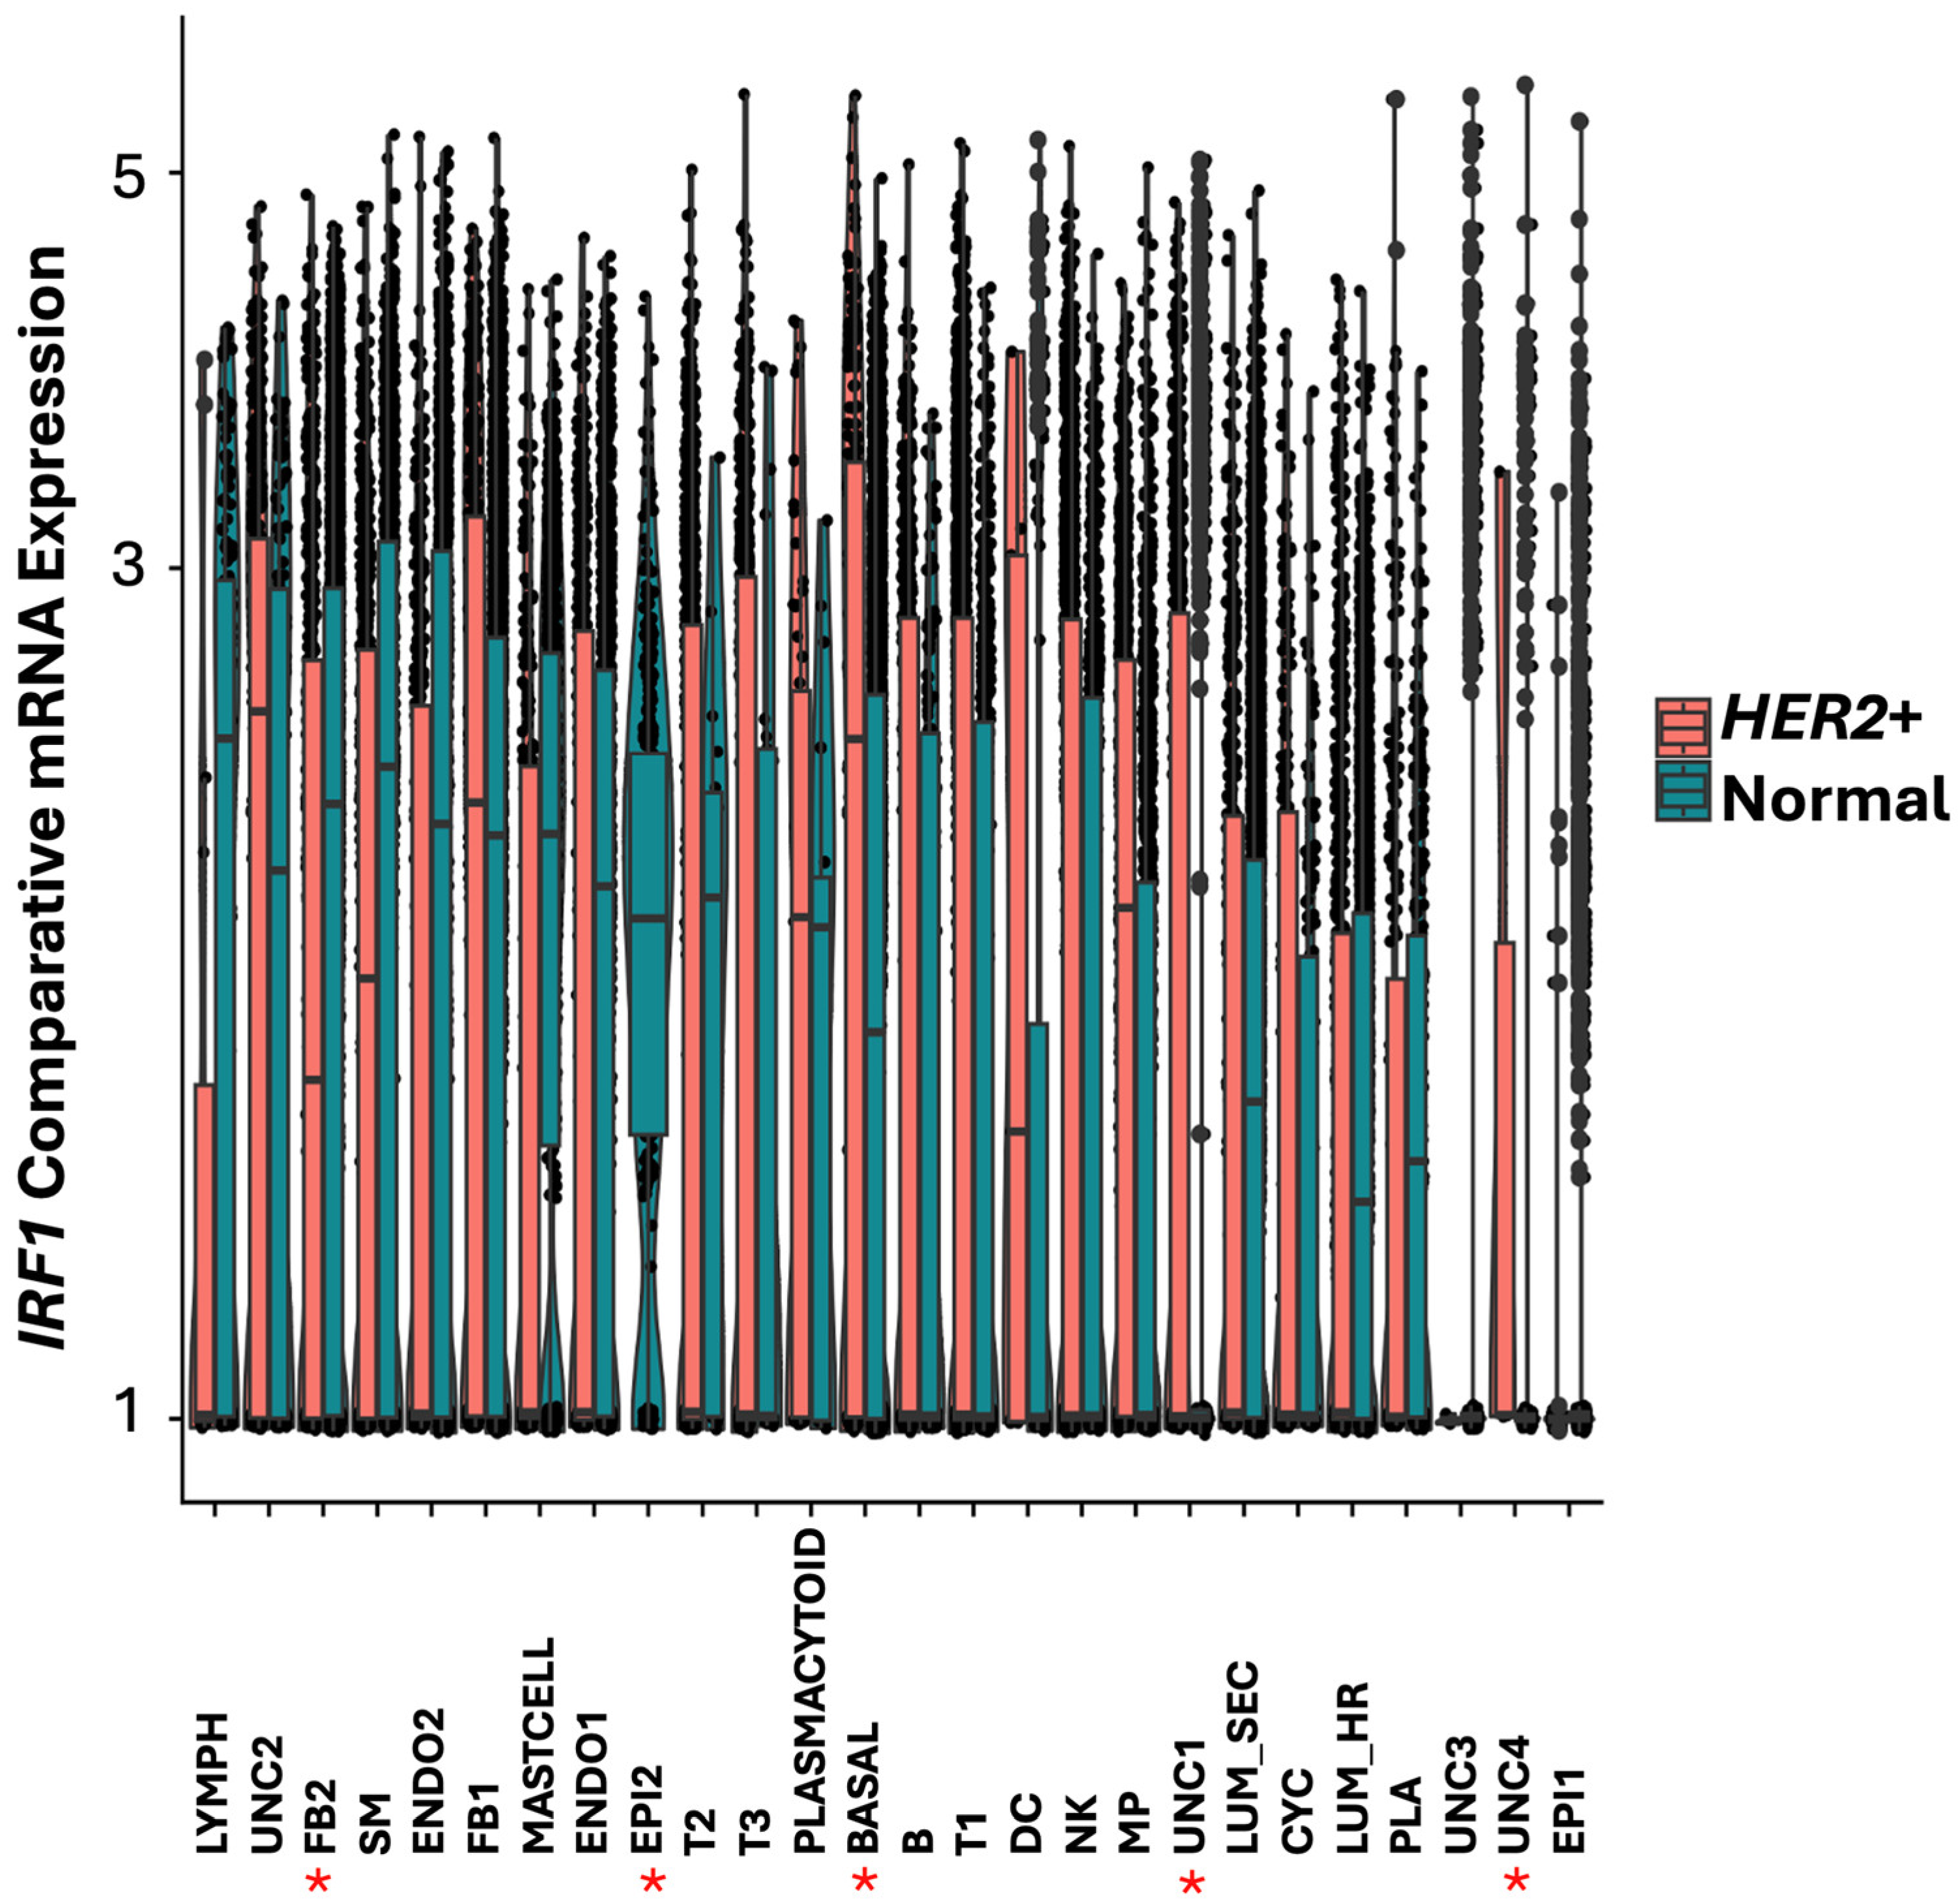
In normal breast tissue, IRF1 was found more expressed in lymphoid cells (Lymph), in the UNC2 uncharacterized cell cluster, in different types of fibroblasts (FB2, FB1), and in the smooth muscle (SM) cells (Figure 4 and Figure 5). IRF1 was downregulated in HER2+ tumor FB2 fibroblast and smooth muscle cells and not detected in a cluster of relatively rare epithelial cells indicated as EPI2 (Figure 6). In contrast, IRF1 was found upregulated in basal and in the uncharacterized cell cluster UNC2 and expressed only in the uncharacterized cell clusters UNC1 and UNC4 of the HER2+ tumors (Figure 6).
These expression patterns supported our hypothesis and suggested that the potential antagonistic oncogenic activities of IRF1 may be due to IRF1 having different levels of expression in different cell types of the same tumor.
In our previous study IRF1 was identified as co-regulated with or regulated by TMEM230 in fibroblast cells of RA patients [1,2]. As TMEM230 is necessary for glycosylation and secretion of proteoglycans and glycoproteins with roles in cell stress and defense response, we analyzed expression of RNASET2 and syndecans (SDCs) in HER2+ tumors.

3.4. Expression Profile and Cluster Localization of the TMEM230 Glycosylated SDC2 and RNASET2 Genes in HER2+ Tumors

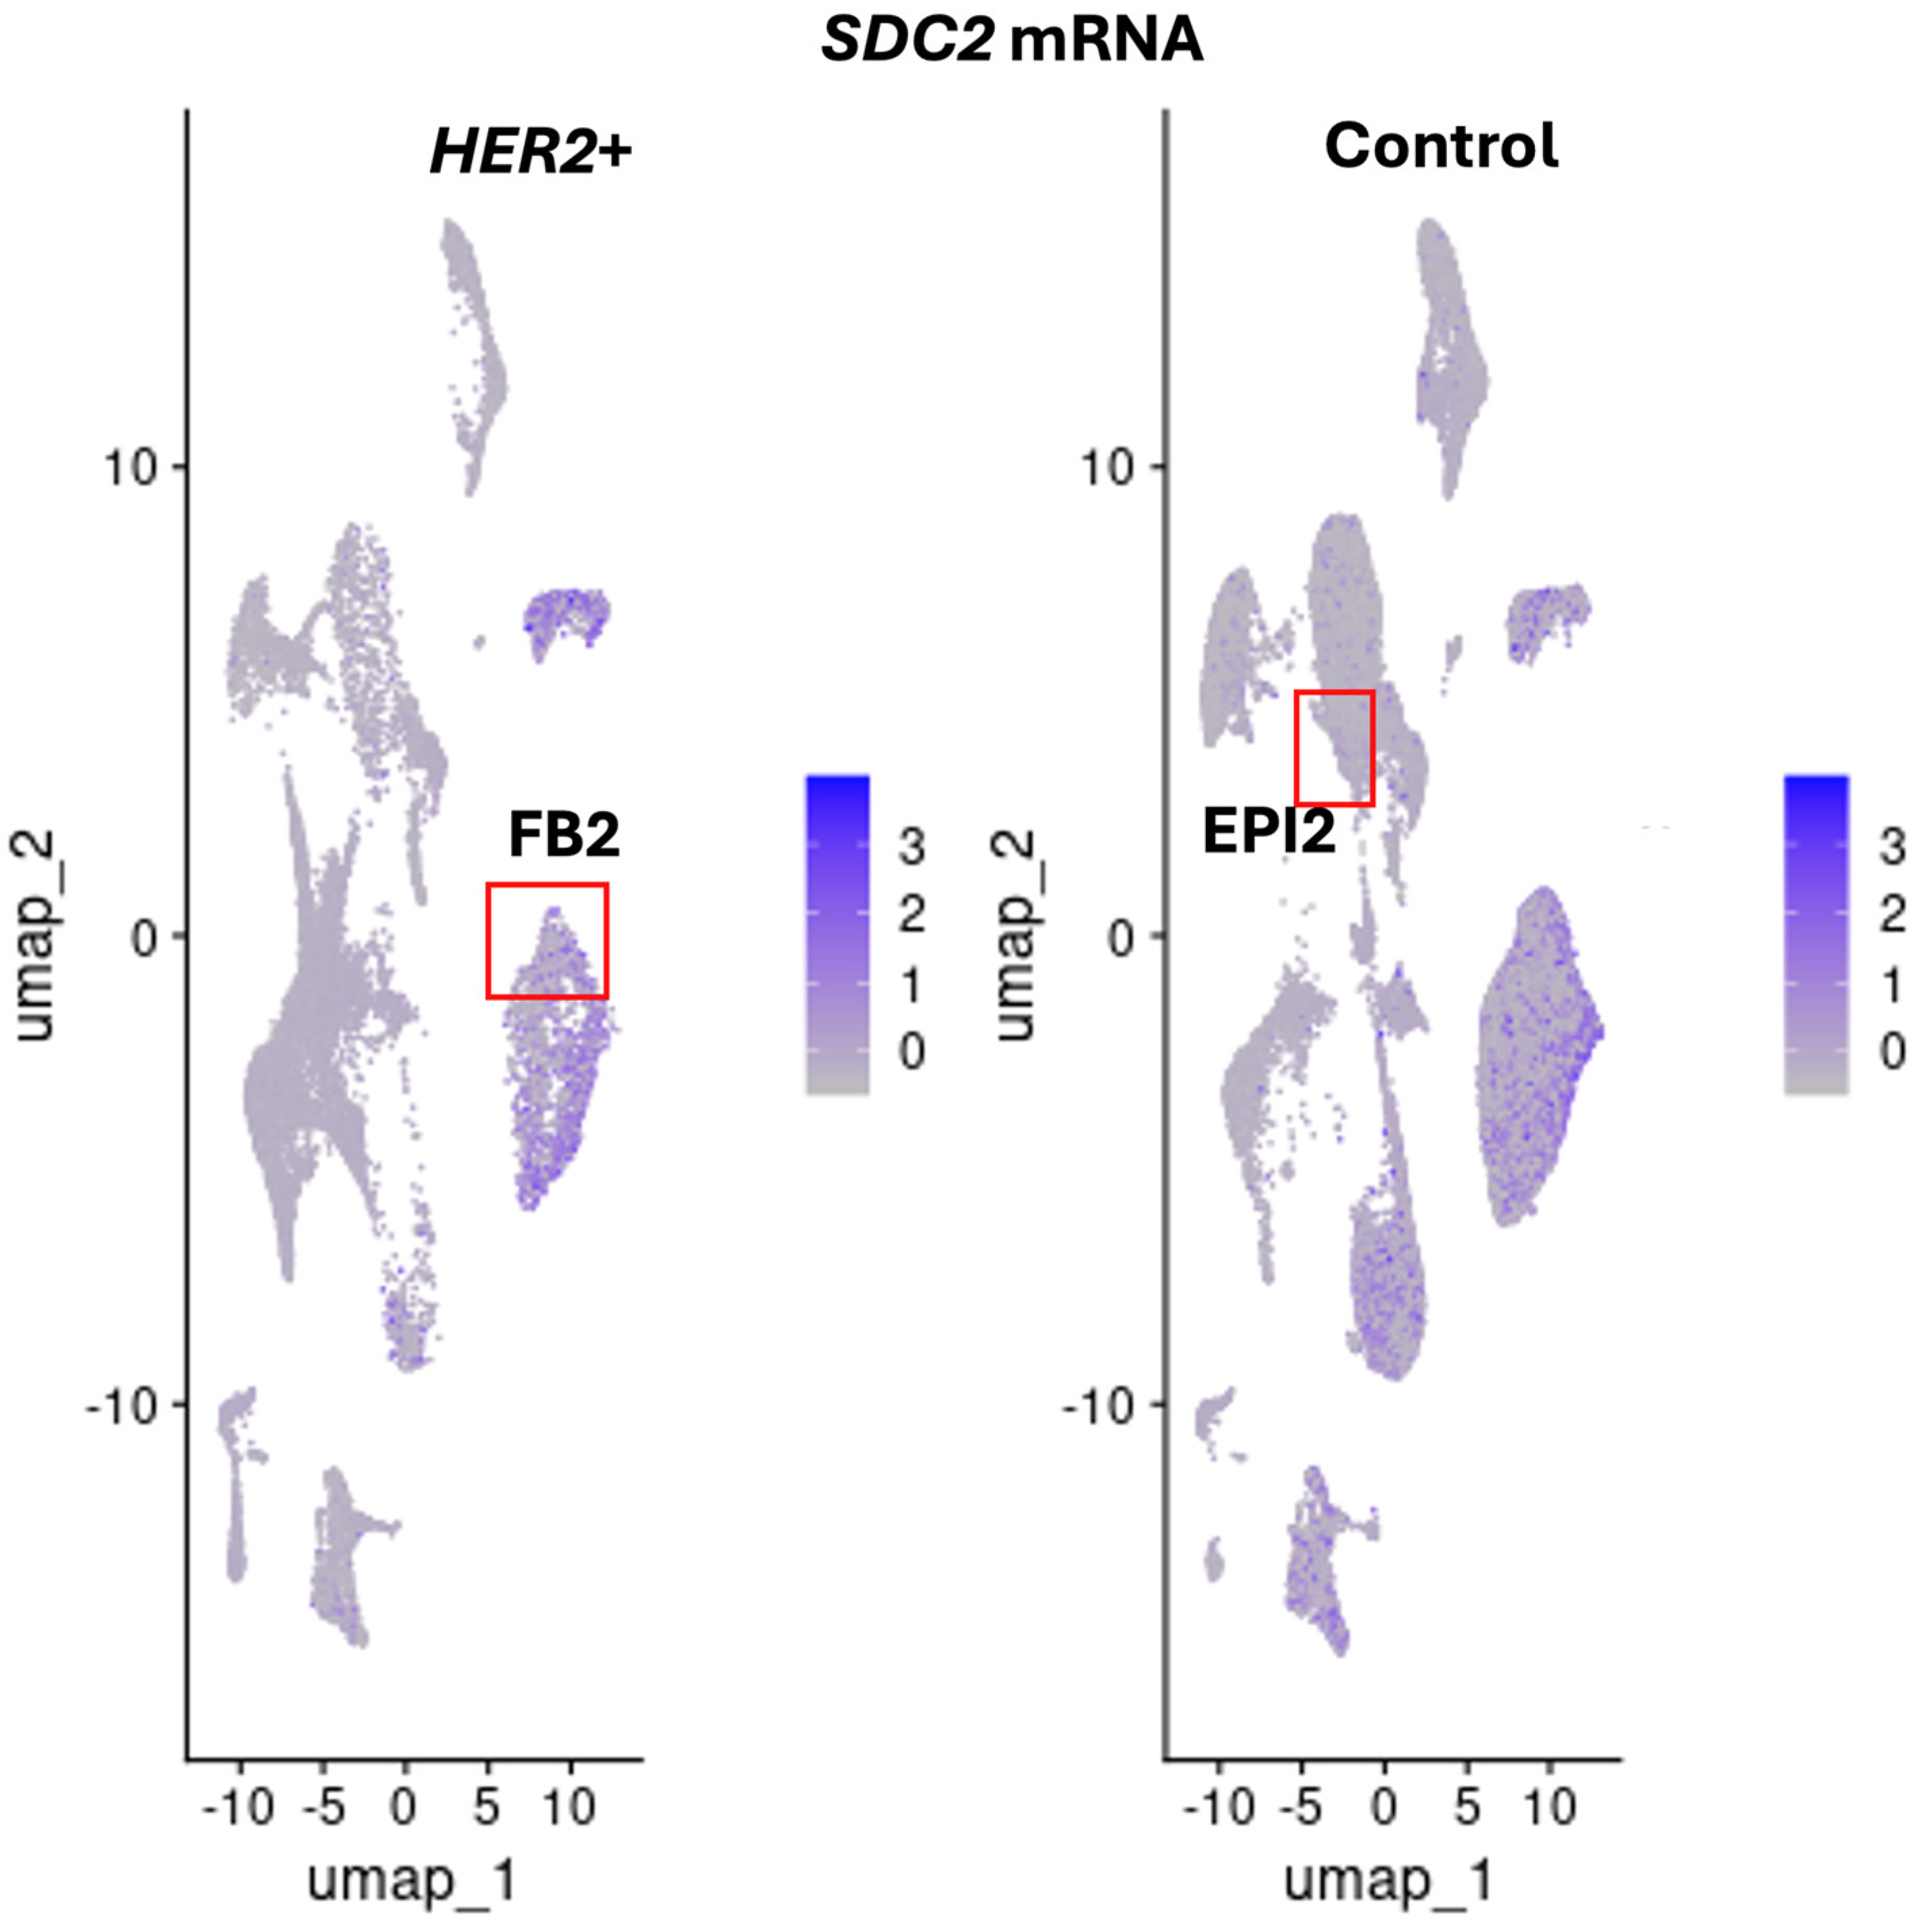
We previously demonstrated that syndecan transmembrane proteins were regulated by TMEM230 in autoimmunity and GBM tumors [43,44]. Syndecan 2 (SDC2), like IRF1 participates in fibroblast cell proliferation and cell growth in stress response. Both SDC2 and IRF1 were found highly expressed in mast cells and FB2 fibroblast cells in normal breast tissue (Figure 7 and Figure 8).
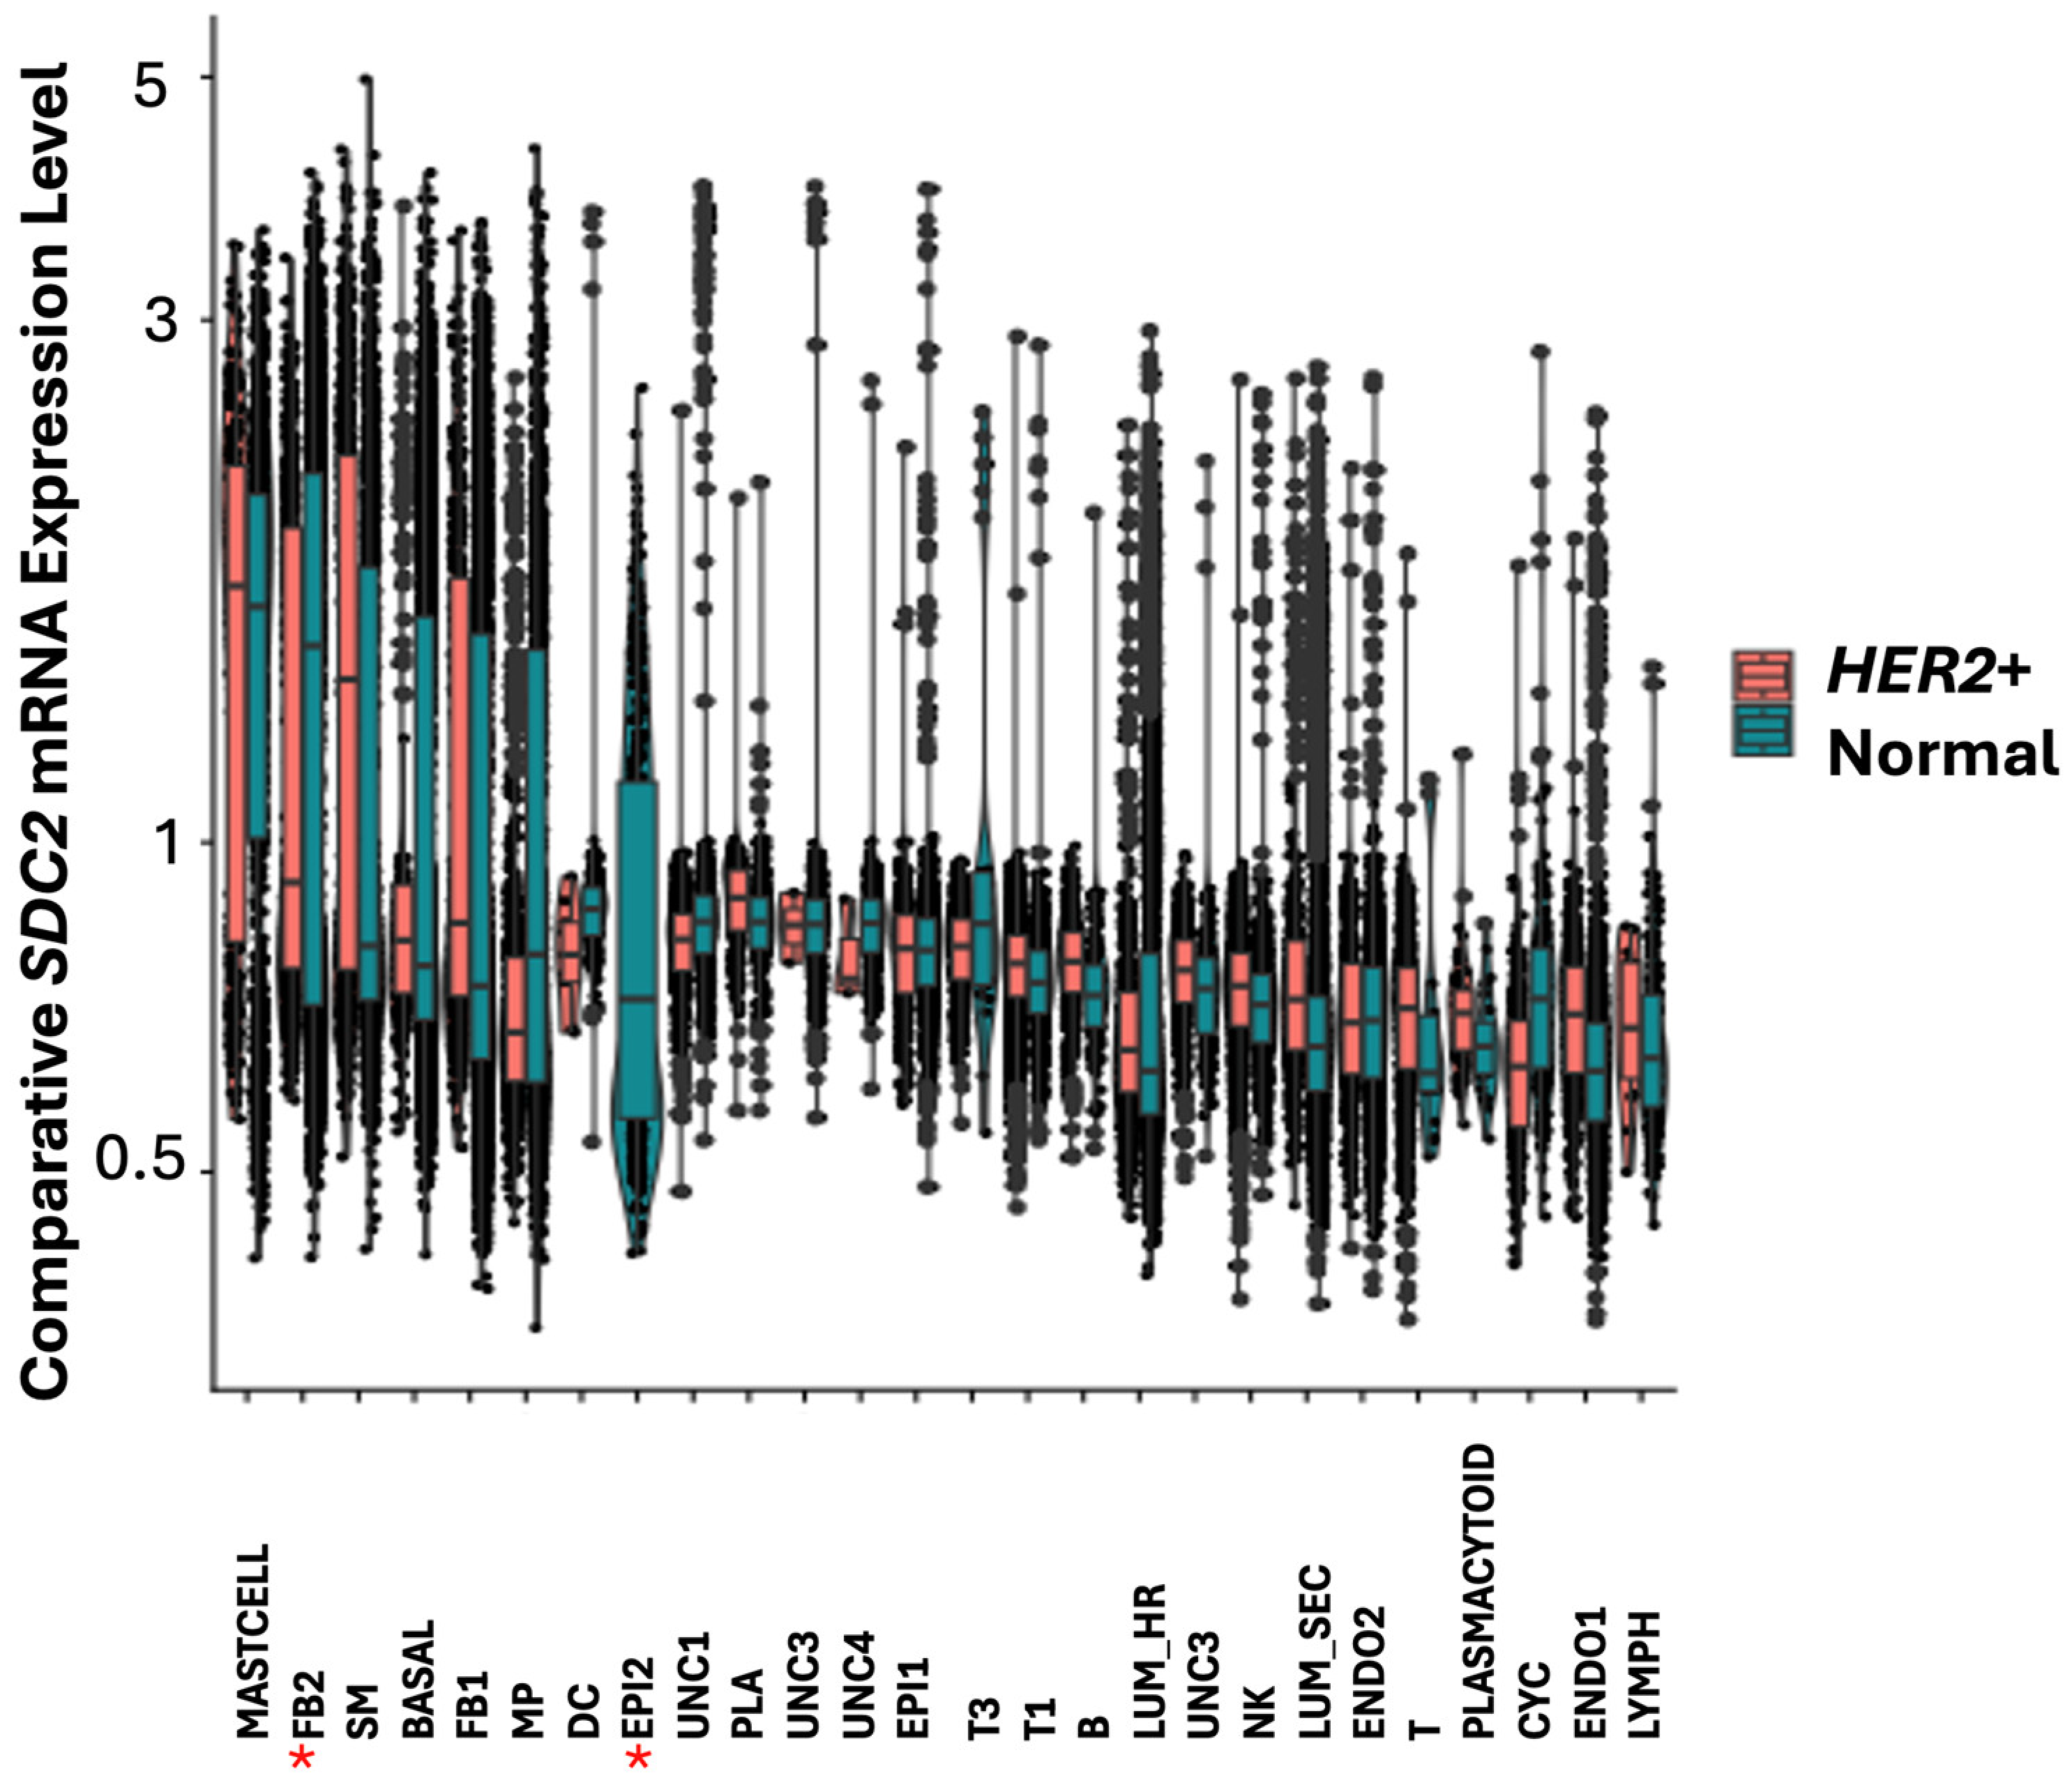
IRF1 and SDC2 were downregulated in FB2 and not detected in epithelial EPI2 cells in HER2+ tumors (Figure 6 and Figure 9). In contrast to IRF1, SDC2 was upregulated in smooth muscle (SM) cells in HER2+ tumors (Figure 9). SDC2 was not found differentially expressed in LUM_SEC and LUM_HR epithelial luminal cells (Figure 9). This suggested that if SDC2 has a role in cancer, it is not in the luminal cells, but in mast cells and in FB2 fibroblast cells. In CXCL12 synovial fibroblast cells from RA patients, SDC2 was found to have a role in extracellular matrix remodeling, suggesting that IRF1 may have a similar role in cancer (Figure 1). Chemokines with C-X-C motifs such as CXCL12 are chemoattractants for immune system cells and are normally localized to sites of injury and infections and play a role in inflammatory processes [45].
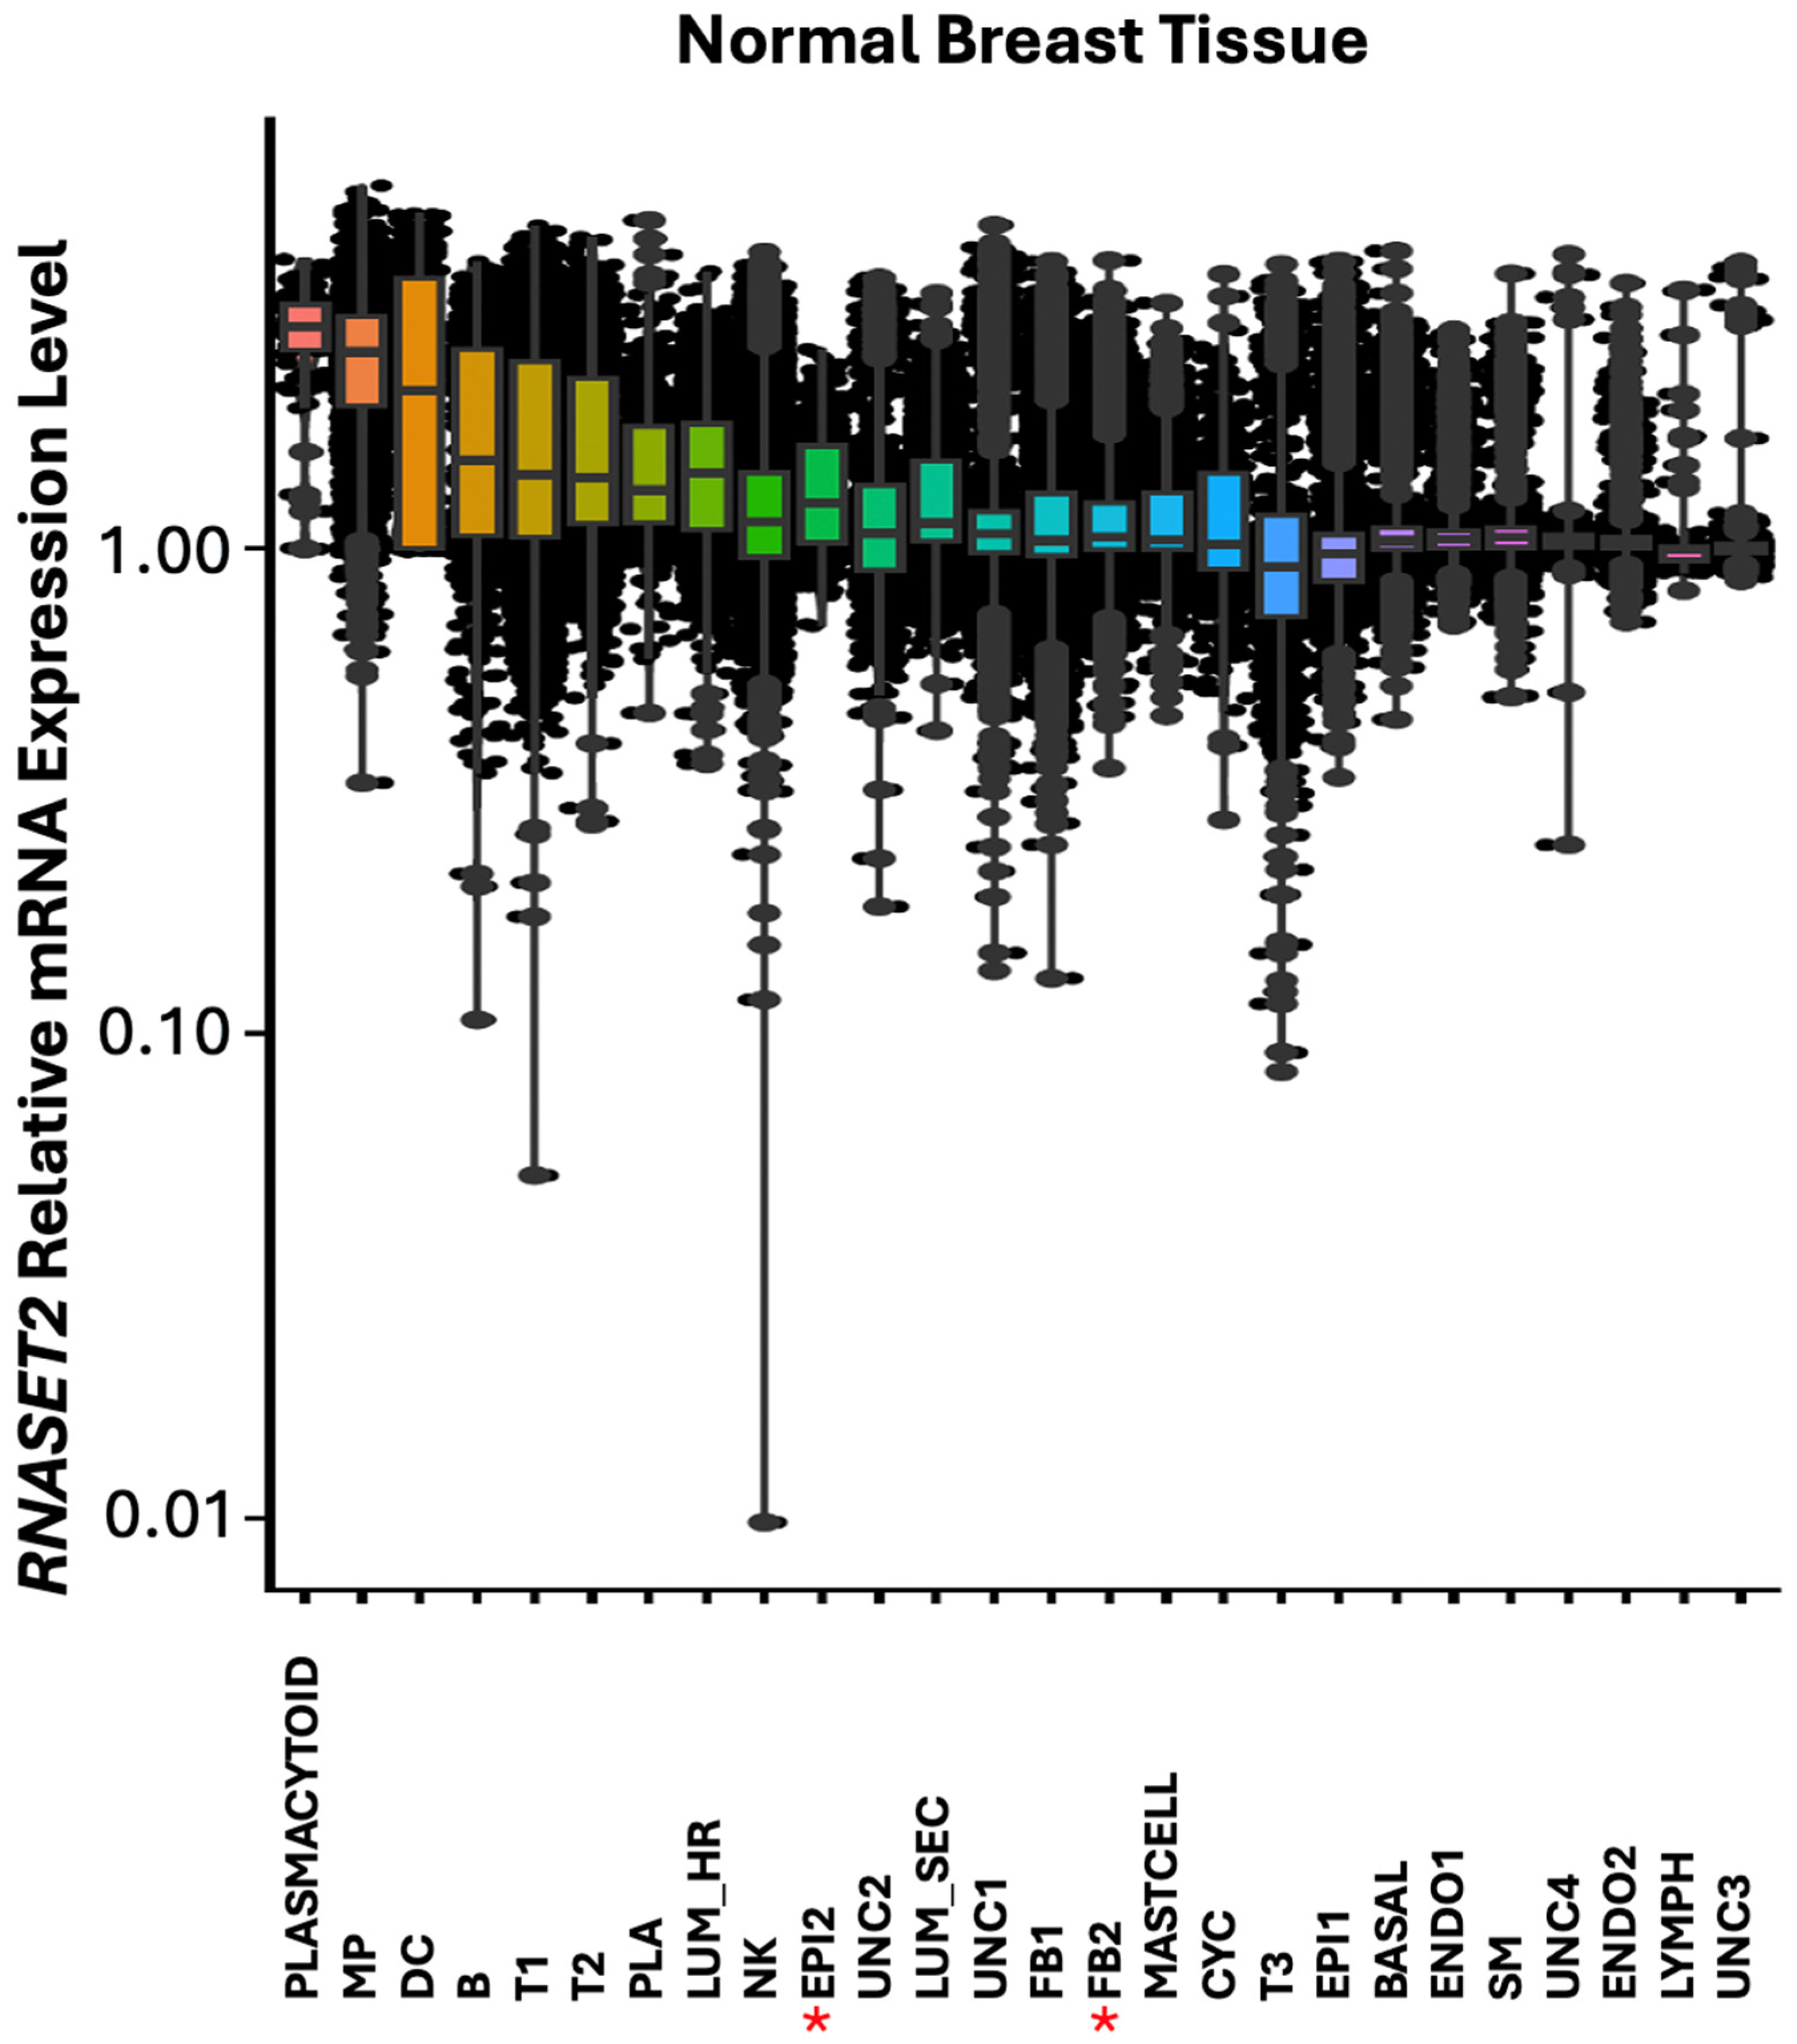
We previously determined TMEM230 had a role in the regulation of antigen processing, transport, and antigen presentation [1,2]. Antigen processing and presentation are dependent on TMEM230 regulating the RNA digesting enzyme RNASET2, a component of lysosomes. Like SDC2, RNASET2 contributes tissue remodeling in CXCL12 fibroblasts [45]. Additionally, RNASET2 like IRF1 is closely linked with immune responses in viral infections and cancer [2,46,47,48]. We therefore investigated the possible role of RNASET2 with IRF1 in breast cancer (Figure 10 and Figure 11).
Highest expression of RNASET2 was found predominantly in cells associated with immune functions such as plasmacytoid, macrophage (MP), dendritic cells (DC), B, T and plasma cells (Figure 10). Additionally, RNASET2 was expressed in the luminal hormone responding (LUM_HR) cluster, in the epithelial (EPI2) cluster and in the luminal secreting cell cluster (LUM_SEC). These cells function as tissue barrier cells in lumen structure protection in infection. In agreement with its role in immune cell function, RNASET2 was downregulated or absent in EPI2 epithelial cell cluster in HER2+ breast tumors, as seen for the expression pattern of IRF1 (Figure 6 and Figure 11).

3.5. Identification of Molecular Pathways Differentially Regulated in HER2+ Tumor and Control Cell Clusters

To better understand the molecular pathways involved in cell stress and defense response that may contribute to tumor development, we performed gene pathway analysis (Table 2, Table 3, Table 4, Table 5, Table 6 and Table 7). Many of the pathways regulated by the TMEM230/RNASET2/SDC2/IRF1 in CXCL12 fibroblast cells from RA patients including oxidative phosphorylation, MYC target genes, DNA repair, TP53, and metabolism (adipogenesis, glycolysis, and fatty acid synthesis and breakdown) (Table 2 and Table 3) were also identified in the FB2 fibroblast cell cluster from HER2+ breast cancer patients. These pathways are active or influenced by transmembrane protein, TMEM230 in the endoplasmic reticulum (ER). For instance, IFN alpha and gamma regulate ER dependent function in antigen presentation, suggesting that the TMEM230/RNASET2/SDC2/IRF1 axis is mis regulated both in autoimmunity and cancer.
Pathways identified in CXCL12 and FB2 fibroblast cell clusters from RA and in the B2 cell cluster from HER2+ breast cancer patients support that TMEM230/RNASET2/SDC2/IRF1 axis have pleiotropic functions (Table 3). The pathways uncovered suggest that the role of IRF1 in the FB2 fibroblast cell cluster can be summarized into regulation of metabolism (glycolysis. adipogenesis, mitochondrial energy production with oxidative phosphorylation, and fatty acid metabolism), tissue remodeling (EMT, angiogenesis, coagulation, and apical junction) and cell and immunity associated stress responses (TP53, hypoxia, MYC, IFNs, and allograft rejection) (Table 3).
Pathways including epithelial to mesenchyme transition (EMT). apical junction, angiogenesis, and coagulation regulation were modulated with IRF1 downregulation in the HER2+ breast cancer FB2 fibroblast cell cluster (Table 3).
The gene pathway analysis also identified previously unknown pathways in IRF1 signaling (Table 2, Table 3, Table 4, Table 5, Table 6 and Table 7). For instance, the IFN-gamma (Table 2, Table 4, and Table 7 in FB2, basal and immune system associated cells) and the tumor necrosis factor, TNF-alpha signaling pathways (Table 4 and Table 7 in basal and immune system associated cells) that have functions in modulating cell growth were uncovered. The IRF1 pleiotropic activity is indicated by the increased expression of IRF1 in HER2+ breast tumor basal cells (Table 4 and Table 5) that in contrast to FB2 cells, were associated with the IL6-JAK-STAT3 signaling pathway.
In contrast to FB2 fibroblasts, IRF1 was not expressed in the uncharacterized cell clusters, UNC1 and UNC4 in normal breast tissue, but it was upregulated in both clusters in tumor tissue (Table 6). In the other cell types, IRF1 was expressed in epithelial EPI2 cells in normal breast but was not detected in HER2+ tumors, suggesting that the loss of these cells may promote tumor formation.
Collectively the pathways identified makes clear that single cell RNA sequencing is a powerful platform for uncovering the complexity of cell and gene interactions in tumor containing diverse cell types. Previous studies using clonally established tumor cell lines could not provide an understanding of the behavior of different cell type interactions in tumors. Similarly, sequencing of whole tumor tissue may not uncover transcriptome profiles induced by the interactions of any specific cell type within a tumor as it would be not clear which genes and pathways are associated with which cell type.
While RNASET2 like IRF1 is closely linked with immune responses in viral infections and like IRF1 is thought to have a role in cancer. RNASET2 was not identified coregulated with IRF1 in FB2 cells. We therefore investigated the possible pathways regulated by RNASET2 in other cell types found in HER2+ breast tumors (Table 7). Largest difference in the expression of RNASET2 between control and HER2+ breast tumors was observed in the uncharacterized epithelial EPI2 cell clusters and in clusters associated with immune functions such as B, natural killer (NK) and plasma cells (Figure 11). Like IRF1, RNASET2 was downregulated in EPI2 (Figure 6) suggesting that these uncharacterized rare cells are linked with RNASET2 activity in oncogenesis. RNASET2 was differentially expressed in the UNC4 and EPI2 cell clusters but the number of cells were too few to identify in these clusters molecular pathways differentially regulated between HER2+ tumor and non-malignant breast. Pathways associated with differential expression of RNASET2 in cells associated with immune functions such as B, natural killer (NK) and plasma cells displayed many pathways including the interferon response, TNFA (TNF-α) and apoptosis pathways (Table 7). Additionally, RNASET2 were also identified having a role in the regulation of cell stress and defense response, such as the mammalian target of rapamycin complex (MTORC) in B cells. MTORC regulates metabolism as nutrients, energy, redox sensor primarily through lysosome proteins such as RNASET2 [2].

4. Conclusions

TMEM230, a transmembrane protein is a master regulator of the endoplasmic reticulum (ER) [49]. As the ER has developed diverse functions during eukaryotic evolution, not surprisingly TMEM230 has pleiotropic functions including the regulation the initial steps of glycosylation in glycoprotein and proteoglycan formation, and their intracellular trafficking and secretion. Glycosylation and glycoconjugate trafficking are essential in immunity and cell stress and defense responses of all tissue cells [1,2]. Stress responses associated with the ER are well represented in the pathways identified in RA and HER2+ breast tumors, as we have shown and include MTORC, unfolded protein response, TP53, IFN and interleukin regulation (Table 1, Table 2, Table 3, Table 4, Table 5, Table 6 and Table 7). Without the immense molecular diversity that glycans generate on molecules, host cell self-proteins and pathogen recognition would not be possible [2]. Loss of proper regulation of the diverse ER functions by TMEM230 is therefore expected to contribute to diverse human pathologies. For instance, TMEM230 regulated glycoproteins and proteoglycans, RNASET2 and SDC2 regulate cell-to-cell and cell-to-extracellular matrix interactions and remodeling in wound healing, inflammation and immune system activities. TMEM230, RNASET2 and IFNs regulate antigen processing, trafficking and presentation in autoimmunity. Sequencing analysis of fibroblast cells from patient with tumors uncovered interferon alpha and gamma pathways with downregulation of IRF1 (Table 2). IFNs promote antigen presentation by increasing expression of major histocompatibility complex (MHC) couple antigens. We observed that like IRF1, SDC2 was downregulated in FB2 and downregulated in epithelial EPI2 cells in HER2+ tumors (Figure 9). SDC2 was not found differentially expressed in LUM_SEC and LUM_HR epithelial luminal cells (Figure 9) suggesting that the role of SDC2 in cancer is in FB2 fibroblast cells. In contrast to SDC2, RNASET2 appears to be linked with IRF1 not in FB2 cells but immune system associated cells (see Figure 6). The unexpected finding was uncovered by single cell transcript analysis, demonstrating the power of this unique platform.
Much of the early publications in identifying the role of IFNs was by using clonally derived specific cell types or global transcript sequencing of the entire tumor tissue, platforms that could not characterize collectively the expression levels of IRF1 in each cell type. Our study is unique as we characterized IRF1 expression in all cell types in breast tissue of HER2+ patients in contrast to previous studies that have utilized breast bulk patient samples in toto or tumor epithelial cell lines. Established cell lines often do not recapitulate the behavior of native cells in normal and tumor tissue. Previous literature suggested that the apparent contradictory, pleiotropic roles of IRF1 are likely due to IRF1 having a vast number of DNA binding site target genes. For instance, a previous study using cancer cell lines have uncovered that cell treatment with IFN-gamma was associated with more that 170,000 DNA binding events associated with IRF1 (see excellent review Perevalova et al. 2024 [8]). This rationale was used to explain why IFNs therefore have both inhibitory and promoting functions. Here we show that the ultimate oncogenic outcome for a tumor mass may be due to the collective interactions of all cell types expressing a specific gene with pleiotropic functions. Here we have uncovered that in addition to IFNs being associated with vast number of DNA binding sites, the mis regulation of protein folding performed in the ER by the E2F pathway may contribute to cancer by secreting aberrantly folded extracellular factors such as SDC2, that have roles immune and tissue interactions. Additional pathways uncovered (Table 3) indicated that different pathways are activated with IRF1 depending on the cell type.
Our study provides insight into how IRF1 differentially expressed in different cell types of the same tumor may in part contribute to the pleiotropic functions observed previously in other studies, that is IRF1 displaying both antitumor and pro-tumor induction properties. In conclusion, our results may help explain why IRF1 may induce or inhibit apoptosis in different cell types in tumors and may help uncover novel IFN based therapies.

Supplementary Materials

The following supporting information can be downloaded at: https://www.mdpi.com/article/10.3390/cells14161246/s1, Figure S1. Transcriptomic expression profile and localization of IRF1 by cell type. High-resolution visualization of tissue composition obtained by Uniform Manifold Approximation and Projection (UMAP) plot of tissue cell type after integrating the expression profiles; Figure S2. Structure of wildtype and IRF1+I4 protein isoforms and regulatory domains; Figure S3. Expression of TP53, p21, CDK2, and BIRC5 with constitutive expression of IRF1+I4 in breast fibroblast cells obtained from control patients with no history of tumors; Figure S4. Live-cell number measurements with cells expressing IRF1+I4 isoform compared to control GFP alone expressing cells by fluorescent activated cell sorting (FACS); Figure S5. Flow cytometry assay of breast fibroblast cells apoptosis induced by UV-C treatment. Cells overexpressing IRF-1 isoforms were treated with 50 J/m2 UV-C. Cy5-flurophores associated with Duramycin were used to measure apoptotic cells during the early stages of apoptosis. IRF-1-wildtype cells result to be the most affected (P3 Population); Table S1. Primers used for Quantitative Real Time PCR; Table S2. Patient cohort information used for single cell sequencing transcript analysis indicating tissue sample ID, clinical metadata, cancer type and HER2 degree and whether patients received any prior treatment from 160 breast samples.

Author Contributions

I.Z. and A.B. conceived idea for IRF-1 splicing in 5q(del) isoforms; L.V., A.B., M.P., E.A., E.P., E.M., G.B., M.G., P.P., I.Z. and R.R. performed the experiments and analyzed the data; E.A. performed single cell mRNA transcript sequence analysis; G.B. contributed new reagents and tools; M.P. assisted in paper writing and data interpretation; T.K., A.D.G. and I.M. provided patient samples and patient clinical information, analyzed the data and provided critical input in the final version of the manuscript; R.R. and I.Z. designed the study, analyzed data and wrote the paper. All authors have read and agreed to the published version of the manuscript.

Funding

This research was funded by Marie Skłodowska-Curie Actions (MSCA), call HORIZON MSCA-2021-SE-01 project number 101086322 (to R.R.); and by the CNR project FOE-2021 DBA.AD005.225 (to R.R.).

Institutional Review Board Statement

Primary fibroblast cells of breast were isolated from heathy patients who have undergone mammoplasty reduction Human mammary cells were isolated from tissues obtained from informed, healthy patients (less than 24 years old), collected with the approval of the Clinical Ethics Committee of the Ministry of Health of Athens, Greece (CEC no. 01072016).

Informed Consent Statement

Informed consent was obtained from all subjects involved in the study and are on file by Clinical Ethics Committee of the Ministry of Health of Athens, Greece (CEC no. 01072016).

Data Availability Statement

scRNA-seq data from publicly available datasets of adult human breast tissue were downloaded from Gene Expression Omnibus (GEO) repository: (https://www.ncbi.nlm.nih.gov/geo/query/acc.cgi?acc=GSE195665) (accessed 20 July 2025) for adult normal healthy breast and (https://www.ncbi.nlm.nih.gov/geo/query/acc.cgi?acc=GSE176078) (accessed 20 July 2025) for human breast cancer patients [19,20]. Five normal breast samples (GSM7500385hbcac76, GSM7500386hbcac77, GSM7500417hbcac108, GSM7500426hbcac117, GSM7500458hbcac149) and 5 HER2+ samples (CID3586, CID3838, CID3921, CID4066, CID45171) were selected for this analysis from 126 samples collected from MD Anderson (MDA), UC Irvine (UCI) or Baylor College of Medicine (BCM). In addition to the clinical metadata, adult normal breast samples were selected based on the procedure from which the tissue source was collected.

Acknowledgments

The authors would like to acknowledge the deep loss of their colleague. Edoardo Abeni who passed away this June 2025. His passion for life and study of the science of life was inspirational and will be truly missed. On a daily level of interaction, I.Z. and R.A.R admired his courage and determination and appreciated his sincere friendship.

Conflicts of Interest

The authors declare no conflict of interest.

References

  1. Cocola, C.; Abeni, E.; Martino, V.; Piscitelli, E.; Pelucchi, P.; Mosca, E.; Chiodi, A.; Mohamed, T.; Palizban, M.; Porta, G.; et al. Transmembrane Protein TMEM230, Regulator of Glial Cell Vascular Mimicry and Endothelial Cell Angiogenesis in High-Grade Heterogeneous Infiltrating Gliomas and Glioblastoma. Int. J. Mol. Sci. 2024, 25, 3967. [Google Scholar] [CrossRef]
  2. Piscitelli, E.; Abeni, E.; Balbino, C.; Angeli, E.; Cocola, C.; Pelucchi, P.; Palizban, M.; Diaspro, A.; Götte, M.; Zucchi, I.; et al. Glycosylation Regulation by TMEM230 in Aging and Autoimmunity. Int. J. Mol. Sci. 2025, 26, 2412. [Google Scholar] [CrossRef]
  3. Chesler, D.A.; Reiss, C.S. The role of IFN-gamma in immune responses to viral infections of the central nervous system. Cytokine Growth Factor Rev. 2002, 13, 441–454. [Google Scholar] [CrossRef]
  4. Colonna, M. TLR pathways and IFN-regulatory factors: To each its own. Eur. J. Immunol. 2007, 37, 306–309. [Google Scholar] [CrossRef]
  5. Kroger, A.; Koster, M.; Schroeder, K.; Hauser, H.; Mueller, P.P. Activities of IRF-1. J. Interferon Cytokine Res. 2002, 22, 5–14. [Google Scholar] [CrossRef]
  6. Mamane, Y.; Heylbroeck, C.; Genin, P.; Algarte, M.; Servant, M.J.; LePage, C.; DeLuca, C.; Kwon, H.; Lin, R.; Hiscott, J. Interferon regulatory factors: The next generation. Gene 1999, 237, 1–14. [Google Scholar] [CrossRef] [PubMed]
  7. Marsili, G.; Borsetti, A.; Sgarbanti, M.; Remoli, A.L.; Ridolfi, B.; Stellacci, E.; Ensoli, B.; Battistini, A. On the role of interferon regulatory factors in HIV-1 replication. Ann. N. Y. Acad. Sci. 2003, 1010, 29–42. [Google Scholar] [CrossRef] [PubMed]
  8. Perevalova, A.M.; Gulyaeva, L.F.; Pustylnyak, V.O. Roles of Interferon Regulatory Factor 1 in Tumor Progression and Regression: Two Sides of a Coin. Int. J. Mol. Sci. 2024, 25, 2153. [Google Scholar] [CrossRef]
  9. Romeo, G.; Fiorucci, G.; Chiantore, M.V.; Percario, Z.A.; Vannucchi, S.; Affabris, E. IRF-1 as a negative regulator of cell proliferation. J. Interferon Cytokine Res. 2002, 22, 39–47. [Google Scholar] [CrossRef] [PubMed]
  10. Tanaka, N.; Taniguchi, T. The interferon regulatory factors and oncogenesis. Semin. Cancer Biol. 2000, 10, 73–81. [Google Scholar] [CrossRef]
  11. Zhou, H.; Tang, Y.-D.; Zheng, C. Revisiting IRF1-mediated antiviral innate immunity. Cytokine Growth Factor Rev. 2022, 64, 1–6. [Google Scholar] [CrossRef]
  12. Zucchi, I.; Prinetti, A.; Scotti, M.; Valsecchi, V.; Valaperta, R.; Mento, E.; Reinbold, R.; Vezzoni, P.; Sonnino, S.; Albertini, A.; et al. Association of rat8 with Fyn protein kinase via lipid rafts is required for rat mammary cell differentiation in vitro. Proc. Natl. Acad. Sci. USA 2004, 101, 1880–1885. [Google Scholar] [CrossRef] [PubMed]
  13. Berg, T.; Ahlborn, L.; Jensen, M.-B.; Knoop, A.S.; Ejlertsen, B.; Rossing, M. Comprehensive mapping elucidates high risk genotypes in primary metastatic breast cancer. Neoplasia 2025, 63, 101162. [Google Scholar] [CrossRef] [PubMed]
  14. Jiang, M.; Jia, K.; Wang, L.; Li, W.; Chen, B.; Liu, Y.; Wang, H.; Zhao, S.; He, Y.; Zhou, C. Alterations of DNA damage response pathway: Biomarker and therapeutic strategy for cancer immunotherapy. Acta Pharm. Sin. B 2021, 11, 2983–2994. [Google Scholar] [CrossRef]
  15. Mansour, M.A.; Kamer-Eldawla, A.M.; Malaeb, R.W.; Aboelhassan, R.; Nabawi, D.H.; Aziz, M.M.; Mostafa, H.N. Unlocking the code: The role of molecular and genetic profiling in revolutionizing glioblastoma treatment. Cancer Treat. Res. Commun. 2025, 43, 100881. [Google Scholar] [CrossRef]
  16. Nelles, R.; Tallack, M.R.; Tate, C.; Hunt, S.; Aung, H.; Henden, A.; Jones, L.; Seymour, L. p53 immunohistochemistry staining is a rapid screening method for TP53 mutation in myeloid malignancies suitable for integration into routine diagnostic laboratory practice. Pathology 2025, 57, 489–494. [Google Scholar] [CrossRef] [PubMed]
  17. Popa, M.-T.; Noditi, A.; Peleaşa, T.-M.; Stoleru, S.; Blidaru, A. Breast Cancer: A Heterogeneous Pathology. Prognostic and Predictive Factors—A Narrative Review. Chirurgia 2025, 120, 32–47. [Google Scholar] [CrossRef]
  18. Tabanifar, B.; Lau, H.; Sabapathy, K. Tumor suppressor genes in the tumor microenvironment. Dis. Model Mech. 2025, 18, dmm052049. [Google Scholar] [CrossRef]
  19. Wu, S.Z.; Al-Eryani, G.; Roden, D.L.; Junankar, S.; Harvey, K.; Andersson, A.; Thennavan, A.; Wang, C.; Torpy, J.R.; Bartonicek, N.; et al. A single-cell and spatially resolved atlas of human breast cancers. Nat. Genet. 2021, 53, 1334–1347. [Google Scholar] [CrossRef] [PubMed] [PubMed Central]
  20. Kumar, T.; Nee, K.; Wei, R.; He, S.; Nguyen, Q.H.; Bai, S.; Blake, K.; Pein, M.; Gong, Y.; Sei, E.; et al. A spatially resolved single-cell genomic atlas of the adult human breast. Nature 2023, 620, 181–191. [Google Scholar] [CrossRef] [PubMed] [PubMed Central]
  21. Boultwood, J.; Fidler, C.; Lewis, S.; MacCarthy, A.; Sheridan, H.; Kelly, S.; Oscier, D.; Buckle, V.J.; Wainscoat, J.S. Allelic loss of IRF1 in myelodysplasia and acute myeloid leukemia: Retention of IRF1 on the 5q- chromosome in some patients with the 5q- syndrome. Blood 1993, 82, 2611–2616. [Google Scholar] [CrossRef]
  22. Manzella, L.; Tirrò, E.; Pennisi, M.S.; Massimino, M.; Stella, S.; Romano, C.; Vitale, S.R.; Vigneri, P. Roles of Interferon Regulatory Factors in Chronic Myeloid Leukemia. Curr. Cancer Drug Targets 2016, 16, 594–605. [Google Scholar] [CrossRef]
  23. Nussinov, R.; Yavuz, B.R.; Jang, H. Molecular principles underlying aggressive cancers. Signal Transduct. Target. Ther. 2025, 10, 42. [Google Scholar] [CrossRef] [PubMed]
  24. Taniguchi, T.; Lamphier, M.S.; Tanaka, N. IRF-1: The transcription factor linking the interferon response and oncogenesis. Biochim. Et Biophys. Acta (BBA)—Rev. Cancer 1997, 1333, M9–M17. [Google Scholar] [CrossRef]
  25. Green, W.; Slovak, M.; Chen, I.-M.; Pallavicini, M.; Hecht, J.; Willman, C. Lack of IRF-1 expression in acute promyelocytic leukemia and in a subset of acute myeloid leukemias with del(5)(q31). Leukemia 1999, 13, 1960–1971. [Google Scholar] [CrossRef]
  26. Harada, H.; Kondo, T.; Ogawa, S.; Tamura, T.; Kitagawa, M.; Tanaka, N.; Lamphier, M.S.; Hirai, H.; Taniguchi, T. Accelerated exon skipping of IRF-1 mRNA in human myelodysplasia/leukemia; a possible mechanism of tumor suppressor inactivation. Oncogene 1994, 9, 3313–3320. [Google Scholar]
  27. Haus, O. The genes of interferons and interferon-related factors: Localization and relationships with chromosome aberrations in cancer. Arch. Immunol. Ther. Exp. 2000, 48, 95–100. [Google Scholar]
  28. Maeck, L.; Haase, D.; Schoch, C.; Hiddemann, W.; Alves, F. Genetic instability in myelodysplastic syndrome: Detection of microsatellite instability and loss of heterozygosity in bone marrow samples with karyotype alterations. Br. J. Haematol. 2000, 109, 842–846. [Google Scholar] [CrossRef]
  29. Maratheftis, C.I.; Bolaraki, P.E.; Giannouli, S.; Kapsogeorgou, E.K.; Moutsopoulos, H.M.; Voulgarelis, M. Aberrant alternative splicing of interferon regulatory factor-1 (IRF-1) in myelodysplastic hematopoietic progenitor cells. Leuk. Res. 2006, 30, 1177–1186. [Google Scholar] [CrossRef] [PubMed]
  30. Mild, G.C.; Schmahl, G.E.; Shayan, P.; Niemeyer, C.M. Expression of Interferon Regulatory Factor 1 and 2 in Hematopoietic Cells of Children with Juvenile Myelomonocytic Leukemia. Leuk. Lymphoma 1999, 35, 507–511. [Google Scholar] [CrossRef]
  31. Voulgarelis, M.; Giannouli, S.; Ritis, K.; Tzioufas, A.G. Myelodysplasia-associated autoimmunity: Clinical and pathophysiologic concepts. Eur. J. Clin. Investig. 2004, 34, 690–700. [Google Scholar] [CrossRef] [PubMed]
  32. Platonova, N.; Scotti, M.; Babich, P.; Bertoli, G.; Mento, E.; Meneghini, V.; Egeo, A.; Zucchi, I.; Merlo, G.R. TBX3, the gene mutated in ulnar-mammary syndrome, promotes growth of mammary epithelial cells via repression of p19ARF, independently of p53. Cell Tissue Res. 2007, 328, 301–316. [Google Scholar] [CrossRef]
  33. Zhang, Q.; Hao, S.; Wei, G.; Liu, X.; Miao, Y. The p53-mediated cell cycle regulation is a potential mechanism for emodin-suppressing osteosarcoma cells. Heliyon 2024, 10, e26850. [Google Scholar] [CrossRef]
  34. Zucchi, I.; Astigiano, S.; Bertalot, G.; Sanzone, S.; Cocola, C.; Pelucchi, P.; Bertoli, G.; Stehling, M.; Barbieri, O.; Albertini, A.; et al. Distinct populations of tumor-initiating cells derived from a tumor generated by rat mammary cancer stem cells. Proc. Natl. Acad. Sci. USA 2008, 105, 16940–16945. [Google Scholar] [CrossRef]
  35. Chen, W.; Zhuang, X.; Chen, Y.; Shen, L.; Yang, H.; Wang, M.; Pan, G.; Tan, J.; Pan, X.; Feng, S.; et al. Discovery of potent and selective CDK2 inhibitors with high safety and favorable bioavailability for the treatment of cancer. Eur. J. Med. Chem. 2025, 290, 117503. [Google Scholar] [CrossRef]
  36. Holota, R.; Dečmanová, V.; Matiašová, A.A.; Košuth, J.; Slovinská, L.; Pačut, L.; Tomori, Z.; Daxnerová, Z.; Ševc, J. Cleaved caspase-3 is present in the majority of glial cells in the intact rat spinal cord during postnatal life. Histochem. Cell Biol. 2024, 161, 269–286. [Google Scholar] [CrossRef] [PubMed]
  37. Yang, X.; Zhang, Y.; Duan, F.; Li, S.; Wang, G. BIRC5 Is a Potential Biomarker Associated with Immune System Infiltration in Glioma. J. Korean Neurosurg. Soc. 2025, 68, 184–201. [Google Scholar] [CrossRef] [PubMed]
  38. Kim, T.S.; Rha, M.S.; Shin, E.C. IFN-gamma Induces IL-15 Trans-Presentation by Epithelial Cells via IRF1. J. Immunol. 2022, 208, 338–346. [Google Scholar] [CrossRef]
  39. Nguyen, H.; Hiscott, J.; Pitha, P.M. The growing family of interferon regulatory factors. Cytokine Growth Factor Rev. 1997, 8, 293–312. [Google Scholar] [CrossRef]
  40. Nicolini, A.; Carpi, A.; Rossi, G. Cytokines in breast cancer. Cytokine Growth Factor Rev. 2006, 17, 325–337. [Google Scholar] [CrossRef]
  41. Ribechini, E.; Hutchinson, J.A.; Hergovits, S.; Heuer, M.; Lucas, J.; Schleicher, U.; Garrote, A.-L.J.; Potter, S.J.; Riquelme, P.; Brackmann, H.; et al. Novel GM-CSF signals via IFN-γR/IRF-1 and AKT/mTOR license monocytes for suppressor function. Blood Adv. 2017, 1, 947–960. [Google Scholar] [CrossRef]
  42. Dudas, J.; Fullar, A.; Bitsche, M.; Schartinger, V.; Kovalszky, I.; Sprinzl, G.M.; Riechelmann, H. Tumor-produced, active interleukin-1beta regulates gene expression in carcinoma-associated fibroblasts. Exp. Cell Res. 2011, 317, 2222–2229. [Google Scholar] [CrossRef] [PubMed]
  43. Katakam, S.K.; Tria, V.; Sim, W.; Yip, G.W.; Molgora, S.; Karnavas, T.; Elghonaimy, E.A.; Pelucchi, P.; Piscitelli, E.; Ibrahim, S.A.; et al. The heparan sulfate proteoglycan syndecan-1 regulates colon cancer stem cell function via a focal adhesion kinase—Wnt signaling axis. FEBS J. 2021, 288, 486–506. [Google Scholar] [CrossRef]
  44. Teixeira, F.C.O.B.; Kumar, A.V.; Katakam, S.K.; Cocola, C.; Pelucchi, P.; Graf, M.; Kiesel, L.; Reinbold, R.; Pavão, M.S.G.; Greve, B.; et al. The Heparan Sulfate Sulfotransferases HS2ST1 and HS3ST2 Are Novel Regulators of Breast Cancer Stem-Cell Properties. Front. Cell Dev. Biol. 2020, 8, 559554. [Google Scholar] [CrossRef] [PubMed]
  45. Worden, A.N.; Pittard, E.G.; Stern, M.; Uline, M.J.; Potts, J.D. The Role of the CXCL12/CXCR4 Signaling Pathway in Regulating Cellular Migration. Microsc. Microanal. 2025, 31, ozaf011. [Google Scholar] [CrossRef] [PubMed]
  46. Kettwig, M.; Ternka, K.; Wendland, K.; Krüger, D.M.; Zampar, S.; Schob, C.; Franz, J.; Aich, A.; Winkler, A.; Sakib, M.S.; et al. Interferon-driven brain phenotype in a mouse model of RNaseT2 deficient leukoencephalopathy. Nat. Commun. 2021, 12, 6530. [Google Scholar] [CrossRef]
  47. Bérouti, M.; Lammens, K.; Heiss, M.; Hansbauer, L.; Bauernfried, S.; Stöckl, J.; Pinci, F.; Piseddu, I.; Greulich, W.; Wang, M.; et al. Lysosomal endonuclease RNase T2 and PLD exonucleases cooperatively generate RNA ligands for TLR7 activation. Immunity 2024, 57, 1482–1496.e8. [Google Scholar] [CrossRef] [PubMed] [PubMed Central]
  48. Gomez-Diaz, C.; Greulich, W.; Wefers, B.; Wang, M.; Bolsega, S.; Effern, M.; Varga, D.P.; Han, Z.; Chen, M.; Bérouti, M.; et al. RNase T2 restricts TLR13-mediated autoinflammation in vivo. J. Exp. Med. 2025, 222, e20241424. [Google Scholar] [CrossRef] [PubMed] [PubMed Central]
  49. Cocola, C.; Magnaghi, V.; Abeni, E.; Pelucchi, P.; Martino, V.; Vilardo, L.; Piscitelli, E.; Consiglio, A.; Grillo, G.; Mosca, E.; et al. Transmembrane Protein TMEM230, a Target of Glioblastoma Therapy. Front. Cell Neurosci. 2021, 15, 703431. [Google Scholar] [CrossRef]
Figure 1. Comparative IRF1 mRNA expression in RA and OA cell clusters from synovial tissue. IRF1 mRNA was downregulated (4 times, p-value ≤ 0.05) in CXCL12 expressing synovial fibroblast cells of RA (see Supplementary Figure S1). Asterisk represents the fibroblast cell cluster in which IRF1 was significantly modulated.
Cells 14 01246 g001
Figure 2. Cells expressing GFP alone (GFP control), WT-IRF1-GFP (WT IRF1 control) or IRF1+I4-GFP (IRF1+I4) were counted with fluorescent activated flow cytometry in multiweek cell culture assays. Decrease in cell number was correlated with IRF1+I4 expression in fibroblast cells of patients without tumors.
Cells 14 01246 g002
Figure 3. HER2+ breast tumor and control breast tissue transcriptomic map clustered by cell type. High-resolution visualization of tissue composition obtained by Uniform Manifold Approximation and Projection (UMAP) plot of tissue cell type after integrating the expression profiles of five normal breast samples and 5 HER2+ samples. scRNA-seq data from publicly available datasets of adult human breast tissue were downloaded from Gene Expression Omnibus (GEO) repository: https://www.ncbi.nlm.nih.gov/geo/query/acc.cgi?acc=GSE195665 (accessed 20 July 2025) for adult normal healthy breast and https://www.ncbi.nlm.nih.gov/geo/query/acc.cgi?acc=GSE176078 (accessed 20 July 2025) for human breast cancer patients. Different clusters were indicated by different colors according to the expression of representative specific markers reported [19,20].
Cells 14 01246 g003
Figure 4. Expression profile and localization of IRF1 in cell clusters of HER2+ tumor and control breast tissue. Cell clusters were defined by markers from Figure 3. Colors indicate the levels of expression from 1 (gray) to 3 (blue), low to high. Fibroblast cluster FB2 and uncharacterized epithelial cluster EPI2 are indicated with red boxes.
Cells 14 01246 g004
Figure 5. Box plot graphical visualization of the expression profile of the IRF1 in normal breast tissue. The y axis represents the expression level. The x axis represents the cell 26 clusters identified in normal breast tissue. Colors indicate different clusters of cell types.
Cells 14 01246 g005
Figure 6. Box plot graphical visualization of the expression profile of IRF1 in cell clusters of HER2+ breast tumor and control breast tissue. The y axis represents expression levels. p value < 0.05 was calculated by Kolmogorov Smirnov (K-S) test. Cell clusters in which IRF1 were significantly modulated in HER2+ and normal tissue are shown with asterisks. Asterisks represent cell clusters in which IRF1 was downregulated or absent in HER2+ tumors.
Cells 14 01246 g006
Figure 7. Expression profile and localization of SDC2 in HER2+ tumor or control cell clusters, with cell clusters defined by markers from Figure 3. Colors indicate the levels of expression from 1 (gray) to 3 (blue), low to high. Fibroblast cluster FB2 and uncharacterized epithelial cluster EPI2 are indicated with red boxes.
Cells 14 01246 g007
Figure 8. Box plot graphical visualization of the expression profile of the SDC2 in normal breast tissue. The y axis represents the expression level. Asterisks represent cell clusters in which IRF1 was downregulated or absent in HER2+ tumors (Figure 6). Colors indicate different clusters of cell types.
Cells 14 01246 g008
Figure 9. Box plot graphical visualization of the expression profile of SDC2 in cell clusters of HER2+ and control breast tissue. The y axis represents the expression level. p value < 0.05 was calculated by Kolmogorov Smirnov (K-S) test. Asterisks indicate cell clusters in which IRF1 was also downregulated in HER2+ tumors. Asterisks represent cell clusters in which IRF1 was downregulated or absent in HER2+ tumors (Figure 6).
Cells 14 01246 g009
Figure 10. Box plot graphical visualization of the expression profile of theRNASET2 in normal breast tissue. The y axis represents the expression level. p value < 0.05 was calculated by Kolmogorov Smirnov (K-S) test. Asterisks indicate cell clusters in which IRF1 was also downregulated in HER2+ tumors. Asterisks represent cell clusters in which IRF1 was downregulated or absent in HER2+ tumors. Colors indicate different clusters of cell types.
Cells 14 01246 g010
Figure 11. Box plot graphical visualization of the expression profile of RNASET2 in cell clusters of HER2+ and control breast tissue. The y axis represents the expression level. p value < 0.05 was calculated by Kolmogorov Smirnov (K-S) test. Asterisks represent cell clusters in which IRF1 was significantly modulated in HER2+ tumors compared to control tissue. RNASET2 was downregulated or absent in EPI2 epithelial cell cluster in tumors as seen for the expression pattern of IRF1 (Figure 6) suggesting that these uncharacterized rare cells link RNASET2 with IRF1 activities in HER2+. Asterisks represent cell clusters in which IRF1 was downregulated or absent in HER2+ tumors.
Cells 14 01246 g011
Table 1. Gene Set Enrichment Analysis (GSEA) identified molecular pathways differentially regulated with downregulation of TMEM230 expression in CXCL12 synovial fibroblast cells of RA compared to OA patients.
CXCL12 Synovial Fibroblast Cells Pathways in Autoimmunitypvalpadj
HALLMARK_OXIDATIVE_PHOSPHORYLATION0.0010405830.00794155
HALLMARK_MYC_TARGET0.001046120.00794155
HALLMARK_DNA_REPAIR0.0011086470.00794155
HALLMARK_REACTIVE_OXIGEN_SPECIES_PATHWAY0.0012706480.00794155
HALLMARK_ADIPOGENESIS0.0010729610.00794155
HALLMARK_FATTY ACID METABOLISM0.001161950.009238729
HALLMARK_UNFOLDED_PROTEIN_RESPONSE0.0011467890.00794155
HALLMARK_XENOBIOTIC_METABOLISM0.0021078020.009238729
HALLMARK_MTORC1_SIGNALING0.0021621620.009238729
HALLMARK_E2F_TARGETS0.0022026430.009238729
HALLMARK_UV RESPONSE_UP0.0022172950.009238729
HALLMARK_COAGULATION0.0011834320.00794155
HALLMARK_GLICOLYSIS0.0043383950.015494267
HALLMARK_HYPOXIA0.008676790.016287
HALLMARK_MYOGENESIS0.018181880.037037037
HALLMARK_MYC_TARGETS_V20.0162907270.037024379
HALLMARK_P53_PATHWAY0.0238095240.044091711
HALLMARK_PEROXISOME0.0250.044642857
Table 2. Selected biological pathways differentially regulated in the HER2+ and control FB2 fibroblast cells.
FB2 Fibroblast Pathways in HER2+ Breast Tissuepvalpadj
HALLMARK_OXIDATIVE_PHOSPHORYLATION0.001030.007135
HALLMARK_EPITHELIAL_MESENCHYMAL_TRANSITION0.0010310.007135
HALLMARK_INTERFERON_ALPHA_RESPONSE0.0011420.007135
HALLMARK_DNA_REPAIR0.0010630.007135
HALLMARK_COAGULATION0.011420.007135
HALLMARK_GLYCOLYSIS0.0010620.007135
HALLMARK_INTERFERON_GAMMA_RESPONSE0.0010440.007135
HALLMARK_APICAL JUNCTION0.0010890.007135
HALLMARK_ADIPOGENESIS0.0020790.010893
HALLMARK_FATTY ACID METABOLISM0.0021790.010893
HALLMARK_ANGIOGENESIS0.0119520.037707
HALLMARK_P53_PATHWAY0.0031280.013034
HALLMARK_MYC_TARGETS_V10.0030930.013034
HALLMARK_HYPOXIA0.0199580.049895
HALLMARK_ALLOGRAFT_REJECTION0.0125860.037707
Table 3. Biological pathways in common or differentially regulated in CXCL12 synovial fibroblasts of RA and FB2 fibroblast cells of HER2+ breast tumor patients. Bold indicates pathways in common.
CXCL12 Synovial Fibroblast PathwayspvalpadjFb2 Fibroblast Pathways in Her2+ Breast Tissuepvalpadj
HALLMARK_OXIDATIVE_PHOSPHORYLATION0.0010405830.00794155HALLMARK_OXIDATIVE_PHOSPHORYLATION0.001030.007135
HALLMARK_MYC_TARGET0.001046120.00794155HALLMARK_EPITHELIAL_MESENCHYMAL_TRANSITION0.0010310.007135
HALLMARK_DNA_REPAIR0.0011086470.00794155HALLMARK_INTERFERON_ALPHA_RESPONSE0.0011420.007135
HALLMARK_REACTIVE_OXIGEN_SPECIES_PATHWAY0.0012706480.00794155HALLMARK_DNA_REPAIR0.0010630.007135
HALLMARK_ADIPOGENESIS0.0010729610.00794155HALLMARK_COAGULATION0.011420.007135
HALLMARK_FATTY ACID METABOLISM0.001161950.009238729HALLMARK_GLYCOLYSIS0.0010620.007135
HALLMARK_UNFOLDED_PROTEIN_RESPONSE0.0011467890.00794155HALLMARK_INTERFERON_GAMMA_RESPONSE0.0010440.007135
HALLMARK_XENOBIOTIC_METABOLISM0.0021078020.009238729HALLMARK_APICAL JUNCTION0.0010890.007135
HALLMARK_MTORC1_SIGNALING0.0021621620.009238729HALLMARK_ADIPOGENESIS0.0020790.010893
HALLMARK_E2F_TARGETS0.0022026430.009238729HALLMARK_FATTY ACID METABOLISM0.0021790.010893
HALLMARK_UV RESPONSE_UP0.0022172950.009238729HALLMARK_ANGIOGENESIS0.0119520.037707
HALLMARK_COAGULATION0.0011834320.00794155HALLMARK_P53_PATHWAY0.0031280.013034
HALLMARK_GLICOLYSIS0.0043383950.015494267HALLMARK_MYC_TARGETS_V10.0030930.013034
HALLMARK_HYPOXIA0.008676790.016287HALLMARK_HYPOXIA0.0199580.049895
HALLMARK_MYOGENESIS0.018181880.037037037HALLMARK_ALLOGRAFT_REJECTION0.0125860.037707
HALLMARK_MYC_TARGETS_V20.0162907270.037024379
HALLMARK_P53_PATHWAY0.0238095240.044091711
HALLMARK_PEROXISOME0.0250.044642857
Table 4. Biological pathways differentially regulated in HER2+ tumor basal cell cluster compared to control breast. Bold indicates pathways in common.
Basal Cell Pathways in Her2+ Breast Tissuepvalpadj
HALLMARK_OXIDATIVE_PHOSPHORYLATION0.0010590.006127
HALLMARK_INTERFERON_ALPHA_RESPONSE0.0011310.006127
HALLMARK_INTERFERON_GAMMA_RESPONSE0.0010530.006127
HALLMARK_TNFA_SIGNALING_VIA_NFKB0.0010320.006127
HALLMARK_APOPTOSIS0.0010890.006127
HALLMARK_COAGULATION0.0011440.006127
HALLMARK_P53_PATHWAY0.0010420.006127
HALLMARK_ALLOGRAFT_REJECTION0.0011150.006127
HALLMARK_ADIPOGENESIS0.0010590.006127
HALLMARK_UV RESPONSE_UP0.002160.008999
HALLMARK_COMPLEMENT0.0021460.008999
HALLMARK_FATTY_ACID_METABOLISM0.0033410.011136
HALLMARK_DNA_REPAIR0.0032360.011136
HALLMARK_REACTIVE_OXIGEN_SPECIES_PATHWAY0.0012250.006127
HALLMARK_INFLAMMATORY_RESPONSE0.0033040.011136
HALLMARK_IL6_JAK_STAT3_SIGNALING0.0036950.011546
HALLMARK_XENOBIOTIC_METABOLISM0.0131870.0333333
HALLMARK_CHOLESTEROL_HOMEOSTASIS0.0083430.024539
HALLMARK_HYPOXIA0.0169490.037481
Table 5. Biological pathways in common or differentially regulated in basal and FB2 fibroblast cells in HER2+ tumors. Bold indicates pathways in common.
Basal Cell Pathways in Her2+ Breast TissuepvalpadjFB2 Cell Cluster Pathways in Her2+ Breast Tissuepvalpadj
HALLMARK_OXIDATIVE_PHOSPHORYLATION0.0010590.006127HALLMARK_OXIDATIVE_PHOSPHORYLATION0.001030.007135
HALLMARK_INTERFERON_ALPHA_RESPONSE0.0011310.006127HALLMARK_EPITHELIAL_MESENKIMAL_TRANSITION0.0010310.007135
HALLMARK_INTERFERON_GAMMA_RESPONSE0.0010530.006127HALLMARK_INTERFERON_ALPHA_RESPONSE0.0011420.007135
HALLMARK_TNFA_SIGNALING_VIA_NFKB0.0010320.006127HALLMARK_DNA_REPAIR0.0010630.007135
HALLMARK_APOPTOSIS0.0010890.006127HALLMARK_COAGULATION0.0011420.007135
HALLMARK_COAGULATION0.0011440.006127HALLMARK_GLYCOLYSIS0.0010620.007135
HALLMARK_P53_PATHWAY0.0010420.006127HALLMARK_INTERFERON_GAMMA_RESPONSE0.0010440.007135
HALLMARK_ALLOGRAFT_REJECTION0.0011150.006127HALLMARK_APICAL_JUNCTION0.0010890.007135
HALLMARK_ADIPOGENESIS0.0010590.006127HALLMARK_ADIPOGENESIS0.0020790.010893
HALLMARK_UV RESPONSE_UP0.002160.008999HALLMARK_FATTY_ACID_METABOLISM0.0021790.010893
HALLMARK_COMPLEMENT0.0021460.008999HALLMARK_ANGIOGENESIS0.0119520.037707
HALLMARK_FATTY_ACID_METABOLISM0.0033410.011136HALLMARK_P53_PATHWAY0.0031280.013034
HALLMARK_DNA_REPAIR0.0032360.011136HALLMARK_MYC_TARGETS0.0030930.013034
HALLMARK_REACTIVE_OXIGEN_SPECIES_PATHWAY0.0012250.006127HALLMARK_HYPOXIA0.0199580.049896
HALLMARK_INFLAMMATORY_RESPONSE0.0033040.011136HALLMARK_ALLOGRAFT_REJECTION0.0125880.037707
HALLMARK_IL6_JAK_STAT3_SIGNALING0.0036950.011546
HALLMARK_XENOBIOTIC_METABOLISM0.0131870.0333333
HALLMARK_CHOLESTEROL_HOMEOSTASIS0.0083430.024539
HALLMARK_HYPOXIA0.0169490.037481
Table 6. Biological pathways in common or differentially regulated in FB2 fibroblast and uncharacterized UNC1 cell cluster in HER2+ tumors and control breast. Bold indicates pathways in common.
FB2 Fibroblast Pathways in Her2+ Breast TissuepvalpadjUNC1 Cell Cluster Pathways in Her2+ Breast Tissuepvalpadj
HALLMARK_OXIDATIVE_PHOSPHORYLATION0.001030.007135HALLMARK_OXIDATIVE_PHOSPHORYLATION0.0011480.012903
HALLMARK_EPITHELIAL_MESENCHYMAL_TRANSITION0.0010310.007135HALLMARK_INTERFERON GAMMA RESPONSE0.0011830.012903
HALLMARK_INTERFERON_ALPHA_RESPONSE0.0011420.007135HALLMARK_HYPOXIA0.0012290.012903
HALLMARK_DNA_REPAIR0.0010630.007135HALLMARK_ALLOGRAFT_REJECTION0.012550.012903
HALLMARK_COAGULATION0.011420.007135HALLMARK_INTERFERON_ALPHA_RESPONSE0.001290.012903
HALLMARK_GLYCOLYSIS0.0010620.007135HALLMARK_MYC_TARGETS0.0022220.015152
HALLMARK_INTERFERON_GAMMA_RESPONSE0.0010440.007135HALLMARK_P53_PATHWAY0.0024240.015152
HALLMARK_APICAL JUNCTION0.0010890.007135HALLMARK_TNFA_SIGNALING_VIA_NFKB0.0023170.015152
HALLMARK_ADIPOGENESIS0.0020790.010893HALLMARK_DNA_REPAIR0.0049570.027793
HALLMARK_FATTY ACID METABOLISM0.0021790.010893HALLMARK_REACTIVE_OXIGEN_SPECIES_PATHWAY0.0072670.027793
HALLMARK_ANGIOGENESIS0.0119520.037707HALLMARK_GLYCOLYSIS0.0077820.027793
HALLMARK_P53_PATHWAY0.0031280.013034HALLMARK_INFLAMMATORY_RESPONSE0.0132630.009384
HALLMARK_MYC_TARGETS_V10.0030930.013034HALLMARK_KRAS_SIGNALING_UP0.0134590.039585
HALLMARK_HYPOXIA0.0199580.049895HALLMARK_IL6_JAK_STAT3_SIGNALING0.0129310.039585
HALLMARK_ALLOGRAFT_REJECTION0.0125860.037707
Table 7. Biological pathways differentially regulated in basal, plasma, and natural killer cell clusters in HER2+ tumors compared to control breast. Bold indicates pathways in common.
B Cell Cluster Pathway in Her2+ Breast TissuepvalpadjNatural Killer Cell Cluster Pathway in Her2+ Breast Tissuepvalpadj
HALLMARK_INTERFERON_GAMMA_RESPONSE0.0011820.009411HALLMARK_ALLOGRAFT_REJECTION0.011890.005746
HALLMARK_TNFA_SIGNALING_VIA_NFKB0.0011350.009411HALLMARK_INTERFERON GAMMA RESPONSE0.0011930.005746
HALLMARK_ALLOGRAFT_REJECTION0.012020.009411HALLMARK_TNFA_SIGNALING_VIA_NFKB0.0011550.005746
HALLMARK_INTERFERON_ALPHA_RESPONSE0.0013180.009411HALLMARK_INTERFERON_ALPHA_RESPONSE0.0012640.005746
HALLMARK_UV_RESPONSE_UP0.0012520.009411HALLMARK_UV_RESPONSE_UP0.0012330.005746
HALLMARK_MTORC1_SIGNALING0.0011450.009411HALLMARK_IL2_STAT5_SIGNALING0.0011920.005746
HALLMARK_HYPOXIA0.0011860.009411HALLMARK_MTORC1_SIGNALING0.0011660.005746
HALLMARK_INFLAMMATORY_RESPONSE0.0026350.016469HALLMARK_APOPTOSIS0.0011930.005746
HALLMARK_FATTY_ACID_METABOLISM0.0040870.022707HALLMARK_INFLAMMATORY_RESPONSE0.0012520.005746
HALLMARK_APOPTOSIS0.0071510.034722HALLMARK_OXIDATIVE_PHOSPHORYLATION0.0011930.005746
HALLMARK_IL2_STAT5_SIGNALING0.0082350.034722HALLMARK_HYPOXIA0.0012210.005746
Plasma cell cluster pathway in Her2+ breast tissuepvalpadjHALLMARK_COMPLEMENT0.0049690.019111
HALLMARK_INTERFERON_ALPHA_RESPONSE0.001370.034247HALLMARK_P53_PATHWAY0.0059670.020704
HALLMARK_ALLOGRAFT_REJECTION0.0012520.034247HALLMARK_IL6_JAK_STAT3_SIGNALING0.0150480.03762
HALLMARK_BILE_ACID_METABOLISM0.013850.036448
Disclaimer/Publisher’s Note: The statements, opinions and data contained in all publications are solely those of the individual author(s) and contributor(s) and not of MDPI and/or the editor(s). MDPI and/or the editor(s) disclaim responsibility for any injury to people or property resulting from any ideas, methods, instructions or products referred to in the content.