Article

miR-370-3p Inhibited the Proliferation of Sheep Dermal Papilla Cells by Inhibiting the Expression of SMAD4

1
College of Agriculture, Yanbian University, Yanji 133002, China
2
Animal Disease Prevention and Control Center of Panshi City, Panshi 132300, China
3
Animal Biotechnology Institute, Jilin Academy of Agricultural Sciences, Gongzhuling 136100, China
*
Authors to whom correspondence should be addressed.
These authors contributed equally to this work.
Cells 2025, 14(10), 714; https://doi.org/10.3390/cells14100714
Submission received: 27 April 2025 / Revised: 12 May 2025 / Accepted: 12 May 2025 / Published: 14 May 2025

Abstract

:
The proliferation and maturation of hair follicles in follicular papilla cells are predominantly governed by miRNAs, which significantly influence the cell cycle, apoptosis, and proliferation. miR-370-3p has been associated with several biological processes and targets SMAD4, a crucial component in hair follicle development. Tissue expression profiling revealed significant differences in miR-370-3p levels between skin tissues of the two sheep breeds in January and October, as well as between tissues of the Xinji fine-wool sheep and Small-tail Han sheep. SMAD4 exhibited significant differences in tissue-specific expression in the heart, spleen, skin, lungs, and muscles from Xinji fine-wool sheep and Small-tail Han sheep. Bioinformatics analysis and dual-luciferase reporter assays validated the regulatory interaction between miR-370-3p and SMAD4. CCK-8 experiments demonstrated that miR-370-3p’s targeting of SMAD4 suppressed cell growth. Cell cycle analysis demonstrated that miR-370-3p’s targeting of SMAD4 influenced the cell cycle. Annexin V-FITC/PI dual labeling demonstrated that miR-370-3p’s targeting of SMAD4 promoted cell apoptosis. RT-qPCR data demonstrated that miR-370-3p’s targeting of SMAD4 elevated the expression of JUN, c-MYC, and TCF7L2 while suppressing β-catenin expression. Western blot (WB) analysis demonstrated that miR-370-3p targeting of SMAD4 significantly promoted c-MYC expression while inhibiting CCND1, CCND2, and β-catenin expression. miR-370-3p and SMAD4 exhibit spatiotemporal expression differences in sheep skin tissues, with widespread expression across various tissues. Furthermore, it confirmed that miR-370-3p targets SMAD4 to inhibit follicular papilla cell proliferation, promote apoptosis, and influence the cell cycle.

1. Introduction

Hair follicles are specialized micro-organs with complex structures and distinct functions, extending from the follicular bulge to the basal region and consisting of integral components such as the hair germ and dermal papilla (DP) [1]. The hair follicle passes through several cyclic phases, including the anagen, catagen, and telogen [2], each characterized by distinct tissue and physiological features governed by extensive gene activation and silencing. The shift from telogen to anagen is characterized by the initiation of new hair shaft formations and the activation of many signaling pathways that regulate the expression of genes related to hair-specific keratin production, inner root sheath development, and pigmentation [3].
MicroRNAs (miRNAs) are small, non-coding RNA molecules, generally around 24 nucleotides long, that are generated endogenously by cells. These molecules attach to complementary sequences in the 3′ untranslated region (3′UTR) of target mRNAs to inhibit translational expression, elucidating its regulatory role [4]. Research has shown that microRNAs (miRNAs) are essential regulators of hair follicle growth and development. miR-205 exhibits significant differences between growth and regression phases in mice, influencing hair follicle cycle transitions [5]. Cao et al. posited that miR-100 derived from exosome-mimetic nanovesicles (ReN-NVs) produced by neural progenitor cells enhances nuclear β-catenin expression, inhibits several Wnt negative regulators, and elevates C-myc and Cyclin D1 (CCND1) levels, thereby facilitating the acceleration of hair follicle growth. Additionally, miR-99/100 and let-7a/c have been identified as pivotal regulators for the regeneration of cardiomyocytes [6]. Moreover, it has been established that miR-218 regulates the Wnt signaling pathway by inhibiting the expression of the SFRP2 gene, consequently affecting apoptosis and resulting in significant variations in rabbit hair length. This finding provides a foundation for future investigations on miR-218′s function in hair follicle growth [7].
In our prior research, we sequenced differentially expressed miRNAs from the skin tissues of Xinji fine-wool sheep and Small-tail Han sheep, each exhibiting unique wool characteristics, and revealed the differential expression of miR-370-3p. Bioinformatic investigations indicated that SMAD family member 4 (SMAD4) may be a target gene of miR-370-3p. Moreover, a mechanism underlying the growth/rest switch in hair follicles has been proposed, which involves endothelial glycogen-dependent cross-signaling between the Wnt/β-catenin and BMP/Smad pathways [8]. Studies have already shown that SMAD4 and SMAD7 are essential regulators of the formation and development of hair follicles. The bone morphogenetic protein (BMP) signaling pathway primarily mediates the effect of SMAD4 on follicular development, whereas SMAD7 disrupts TGF-β/activin/BMP signaling and promotes ubiquitin-mediated degradation of β-catenin, hence inhibiting the Wnt/β-catenin signaling cascade. These activities substantially influence follicular growth and differentiation, and their study demonstrated that SMAD2 and SMAD4 cooperatively regulate epidermal cell homeostasis via the TGF-β pathway [9]. Owens et al. suggested that the loss of the SMAD4 gene contributes to partial degeneration of hair follicles in the skin [10], while Yang et al. highlighted the critical function of SMAD4 in maintaining the shape of hair follicle stem cells [11]. Yang et al. [11] also highlighted the vital role of SMAD4 in preserving the structural integrity of hair follicle stem cells, whereas Owens et al. [10] proposed that the absence of the SMAD4 gene leads to the deterioration of cutaneous hair follicles.
This study aimed to confirm the relationship between miR-370-3p and its target gene SMAD4 and to explore the specific mechanism by which they regulate hair follicle growth, development, and cycling, providing a theoretical basis for the miRNA regulation of dermal papilla cell (DPC) growth and development.

2. Materials and Methods

2.1. Ethical Statement

Three healthy Xinji fine-wool sheep and three healthy Small-tail Han sheep of the same age were selected from the Animal Husbandry Branch of Jilin Academy of Agricultural Sciences. Professional experimenters conducted regular checks on the health status of the experimental animals. To minimize environmental influences, both groups of sheep were kept in the same environment and fed with the same feed. Skin tissue samples were harvested during the anagen phase (October) and the telogen phase (January) of the hair follicle cycle for examination. The livestock collection was carried out following the regulations authorized by the Animal Welfare and Ethics Committee of Jilin Academy of Agricultural Sciences (JNK20210901001, 11 September 2021). Moreover, the international animal welfare guidelines were strictly followed, and euthanasia was performed on the experimental sheep. The drug used for euthanasia was sodium pentobarbital at a dosage of 120 mg/kg. All of the euthanasia procedures and sample collection were conducted by professionally trained and experienced experimental personnel to ensure the accuracy of the operation process and minimize pain for the animals.

2.2. Sample Collection

One-year-old female Small-tail Han and Xinji fine-wool sheep that were not in estrous were used in this study. They were chosen from the Jilin Academy of Agricultural Sciences’ Animal Husbandry Institute. After shearing the wool around the scapular region, the area was disinfected with 75% alcohol. Local anesthesia was administered by subcutaneous injection of lidocaine hydrochloride (Jianmin Pharmaceuticals, Wuhan, China). Under the guidance of professional experimenters, three 1-cm2 skin tissue samples were collected from each sheep. These three skin tissue samples were used for different experiments. The first skin tissue samples were placed in PBS containing 1% penicillin/streptomycin (Bioss, Beijing, China) and stored at 4 °C for DPC isolation. The second skin tissue samples were preserved in 4% paraformaldehyde (Biosharp, Hefei, China) and subsequently stored at room temperature for immunohistochemical analysis. In the third set of samples, the skin, heart, liver, spleen, lungs, kidneys, and muscle tissues were promptly snap-frozen in liquid nitrogen and stored at −80 °C for total RNA and miRNA isolation.

2.3. DPC Isolation and Culture

The skin tissues were subjected to washing with 75% ethanol, followed by three consecutive rinses with PBS containing 1% penicillin/streptomycin. This procedure was performed a total of three times. After washing, the hair shafts and subcutaneous fat layers were removed. DPCs from Small-tail Han sheep were isolated, cultured, and characterized in accordance with the protocols previously developed in our laboratory [12]. The cells were kept in a CO2 incubator (Thermo Fisher Scientific, Waltham, MA, USA) at 37 °C with 5% CO2 in DMEM/F12 (BI, Shanghai, China) supplemented with 10% fetal bovine serum (Cell-Box, Hong Kong, China) and 1% penicillin/streptomycin solution.

2.4. RNA Extraction and Quantitative Real-Time PCR (qRT-PCR)

The RNAeasyTM Animal RNA Extraction Kit (centrifugal column method) (Beyotime, Shanghai, China) was utilized for total RNA extraction. The concentration and purity of the RNA samples were evaluated using a spectrophotometer (Thermo Fisher Scientific, Waltham, MA, USA); and all samples tested had OD260/280 values of 1.8–2.0. Following this, genomic DNA was eliminated, and first-strand cDNA was produced with the HiFiScript Quick gDNA Removal cDNA Synthesis Kit (Cwbio, Taizhou, China), and the resultant cDNA was preserved at −20 °C. Gene expression measurement was conducted with the GoTaq® qPCR Master Mix (Promega, Beijing, China). The 20 μL reaction mixture comprised 10 μL of 2 × GoTaq® qPCR Master Mix, 0.4 μL of each forward and reverse primer, 2 μL of cDNA, and 7.2 μL of Nuclease-Free Water, Waltham, MA, USA. The PCR amplification was performed using the following parameters: an initial denaturation at 95 °C for 10 min, followed by 45 cycles of denaturation at 95 °C for 15 s, and annealing/extension at 60 °C for 1 min. β-actin was employed as the internal reference gene for normalization in the qPCR analysis.
Total miRNA was isolated using the miRcute miRNA Isolation Kit (TIANGEN, Beijing, China), according to the manufacturer’s instructions to ensure the efficient recovery of high-quality miRNA from tissue samples. First-strand cDNA was synthesized using the miRcute Enhanced miRNA cDNA First Strand Synthesis Kit (TIANGEN, Beijing, China), according to the manufacturer’s guidelines. The generated cDNA was subsequently preserved at −20 °C for future examination. The expression of miRNA was measured using the miRcute Enhanced miRNA Fluorescence Quantification Kit (TIANGEN, Beijing, China), adhering to the manufacturer’s guidelines, to precisely assess miRNA levels in the samples. The 20 μL reaction mixture consisted of 10 μL of 2 × PreMix (SYBR and ROX), 0.4 μL of forward primer (200 nM), 0.4 μL of reverse primer (200 nM), 1 μL of cDNA, and 8.2 μL of nuclease-free water. The PCR amplification method comprises an initial denaturation step at 95 °C for 15 min, followed by 5 cycles of denaturation at 94 °C for 20 s, annealing at 65 °C for 30 s, and elongation at 72 °C for 34 s. This was followed by 45 cycles of denaturation at 94 °C for 20 s and annealing at 60 °C for 34 s. U6 small nuclear RNA functioned as the internal control, utilizing the U6 forward primer sourced from Sangon Biotech (Shanghai, China) to normalize the miRNA expression data and reduce any variations in RNA input.
The expression levels of the target genes or miRNAs were quantified using the 2−ΔΔCt method. All primers employed for qRT-PCR are listed in Table 1.

2.5. 3′-UTR Luciferase Reporter Assay

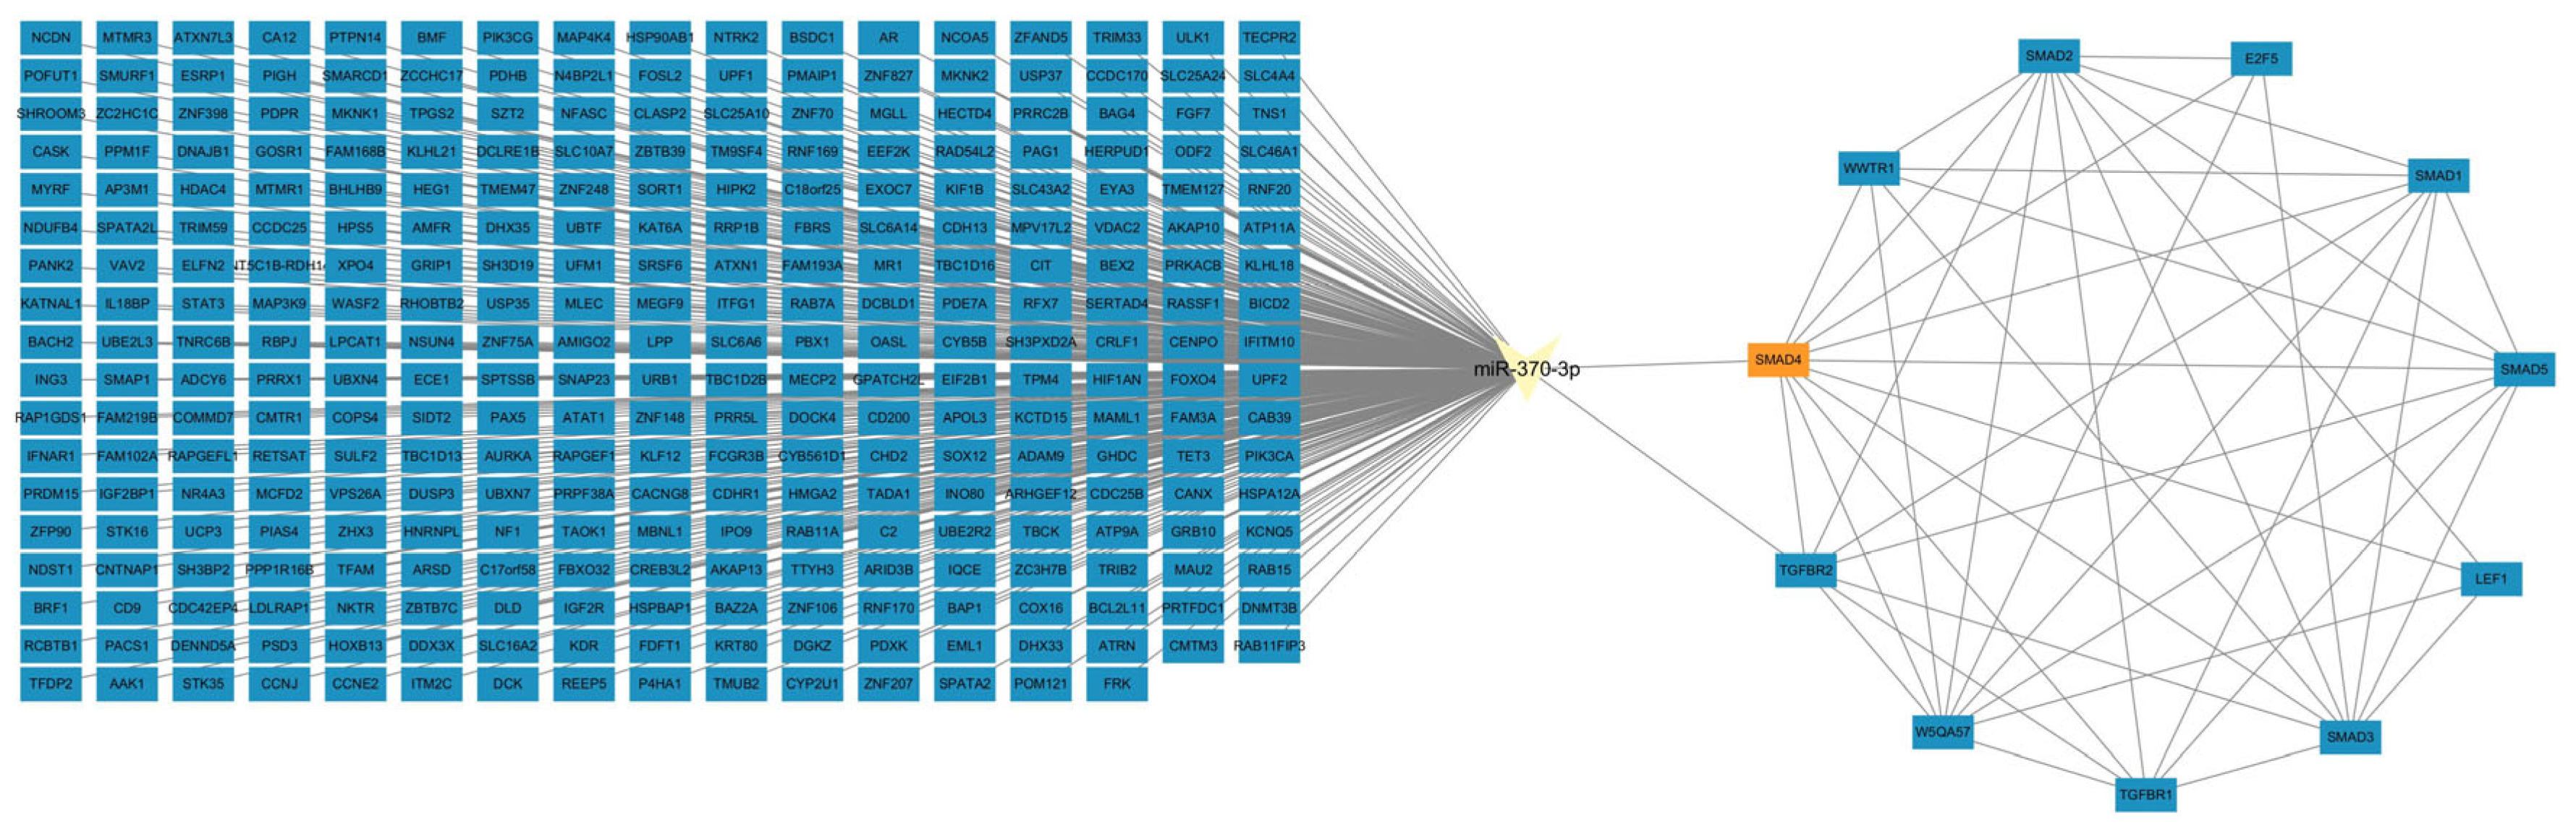
The target genes of miR-370-3p were identified utilizing four internet platforms: miRDB, miRWalk, TargetScan, and starBase. We selected the intersection of the prediction results from these four platforms, and among the genes in the intersection, SMAD4 was chosen for further investigation. The protein–protein interactions of SMAD4 were examined utilizing the web program STRING, and an miRNA–mRNA–mRNA interaction network was developed with Cytoscape 3.9.1.
The interaction sites between miR-370-3p and SMAD4 were predicted using RNAhybrid. According to the expected binding sites, plasmids were designed and constructed: miR-370-3p-mimics, mimics negative control (NC), pmirglo-miR-370-3p-SMAD4-WT, and pmirglo-miR-370-3p-SMAD4-Mut. The constructs were co-transfected into HEK-293T cells using Lipofectamine 3000 (Invitrogen, Carlsbad, CA, USA). Samples were collected 48 h post-transfection. The assays employed a luciferase reporter gene kit (Promega, Beijing, China). The mutation sites are shown in Table 2.

2.6. Cell Transfection

The miR-370-3p mimic, mimic negative control (miR-370-3p mimic-NC), miR-370-3p inhibitor, and inhibitor negative control (miR-370-3p inhibitor-NC) (GenePharma, Shanghai, China) were transfected into DPCs utilizing Lipofectamine 2000 (Invitrogen, Carlsbad, CA, USA). DPCs were then uniformly seeded into a 6-well plate and allowed to proliferate until they reached 75% confluence with a complete growth medium. Transfection was subsequently executed utilizing Lipofectamine™ 2000 (all procedures were carried out under dim lighting). Subsequently, 3.75 μL of mimic or inhibitor was combined with 7.5 μL of Lipofectamine™ 2000 in 125 μL of Opti-MEM™ I reduced-serum medium and incubated at ambient temperature for 5 min. The Lipofectamine 2000 solution was thereafter mixed with the mimic or inhibitor combination and incubated at room temperature for 25 min. The incubated mixture was thereafter poured dropwise into each well of the 6-well plate, at a volume of 250 μL per well, and swirled gently. Subsequent to transfection, cells in the 6-well plates were cultured at 37 °C with 5% CO2 for 48 h before samples were collected for total RNA and total protein extraction.
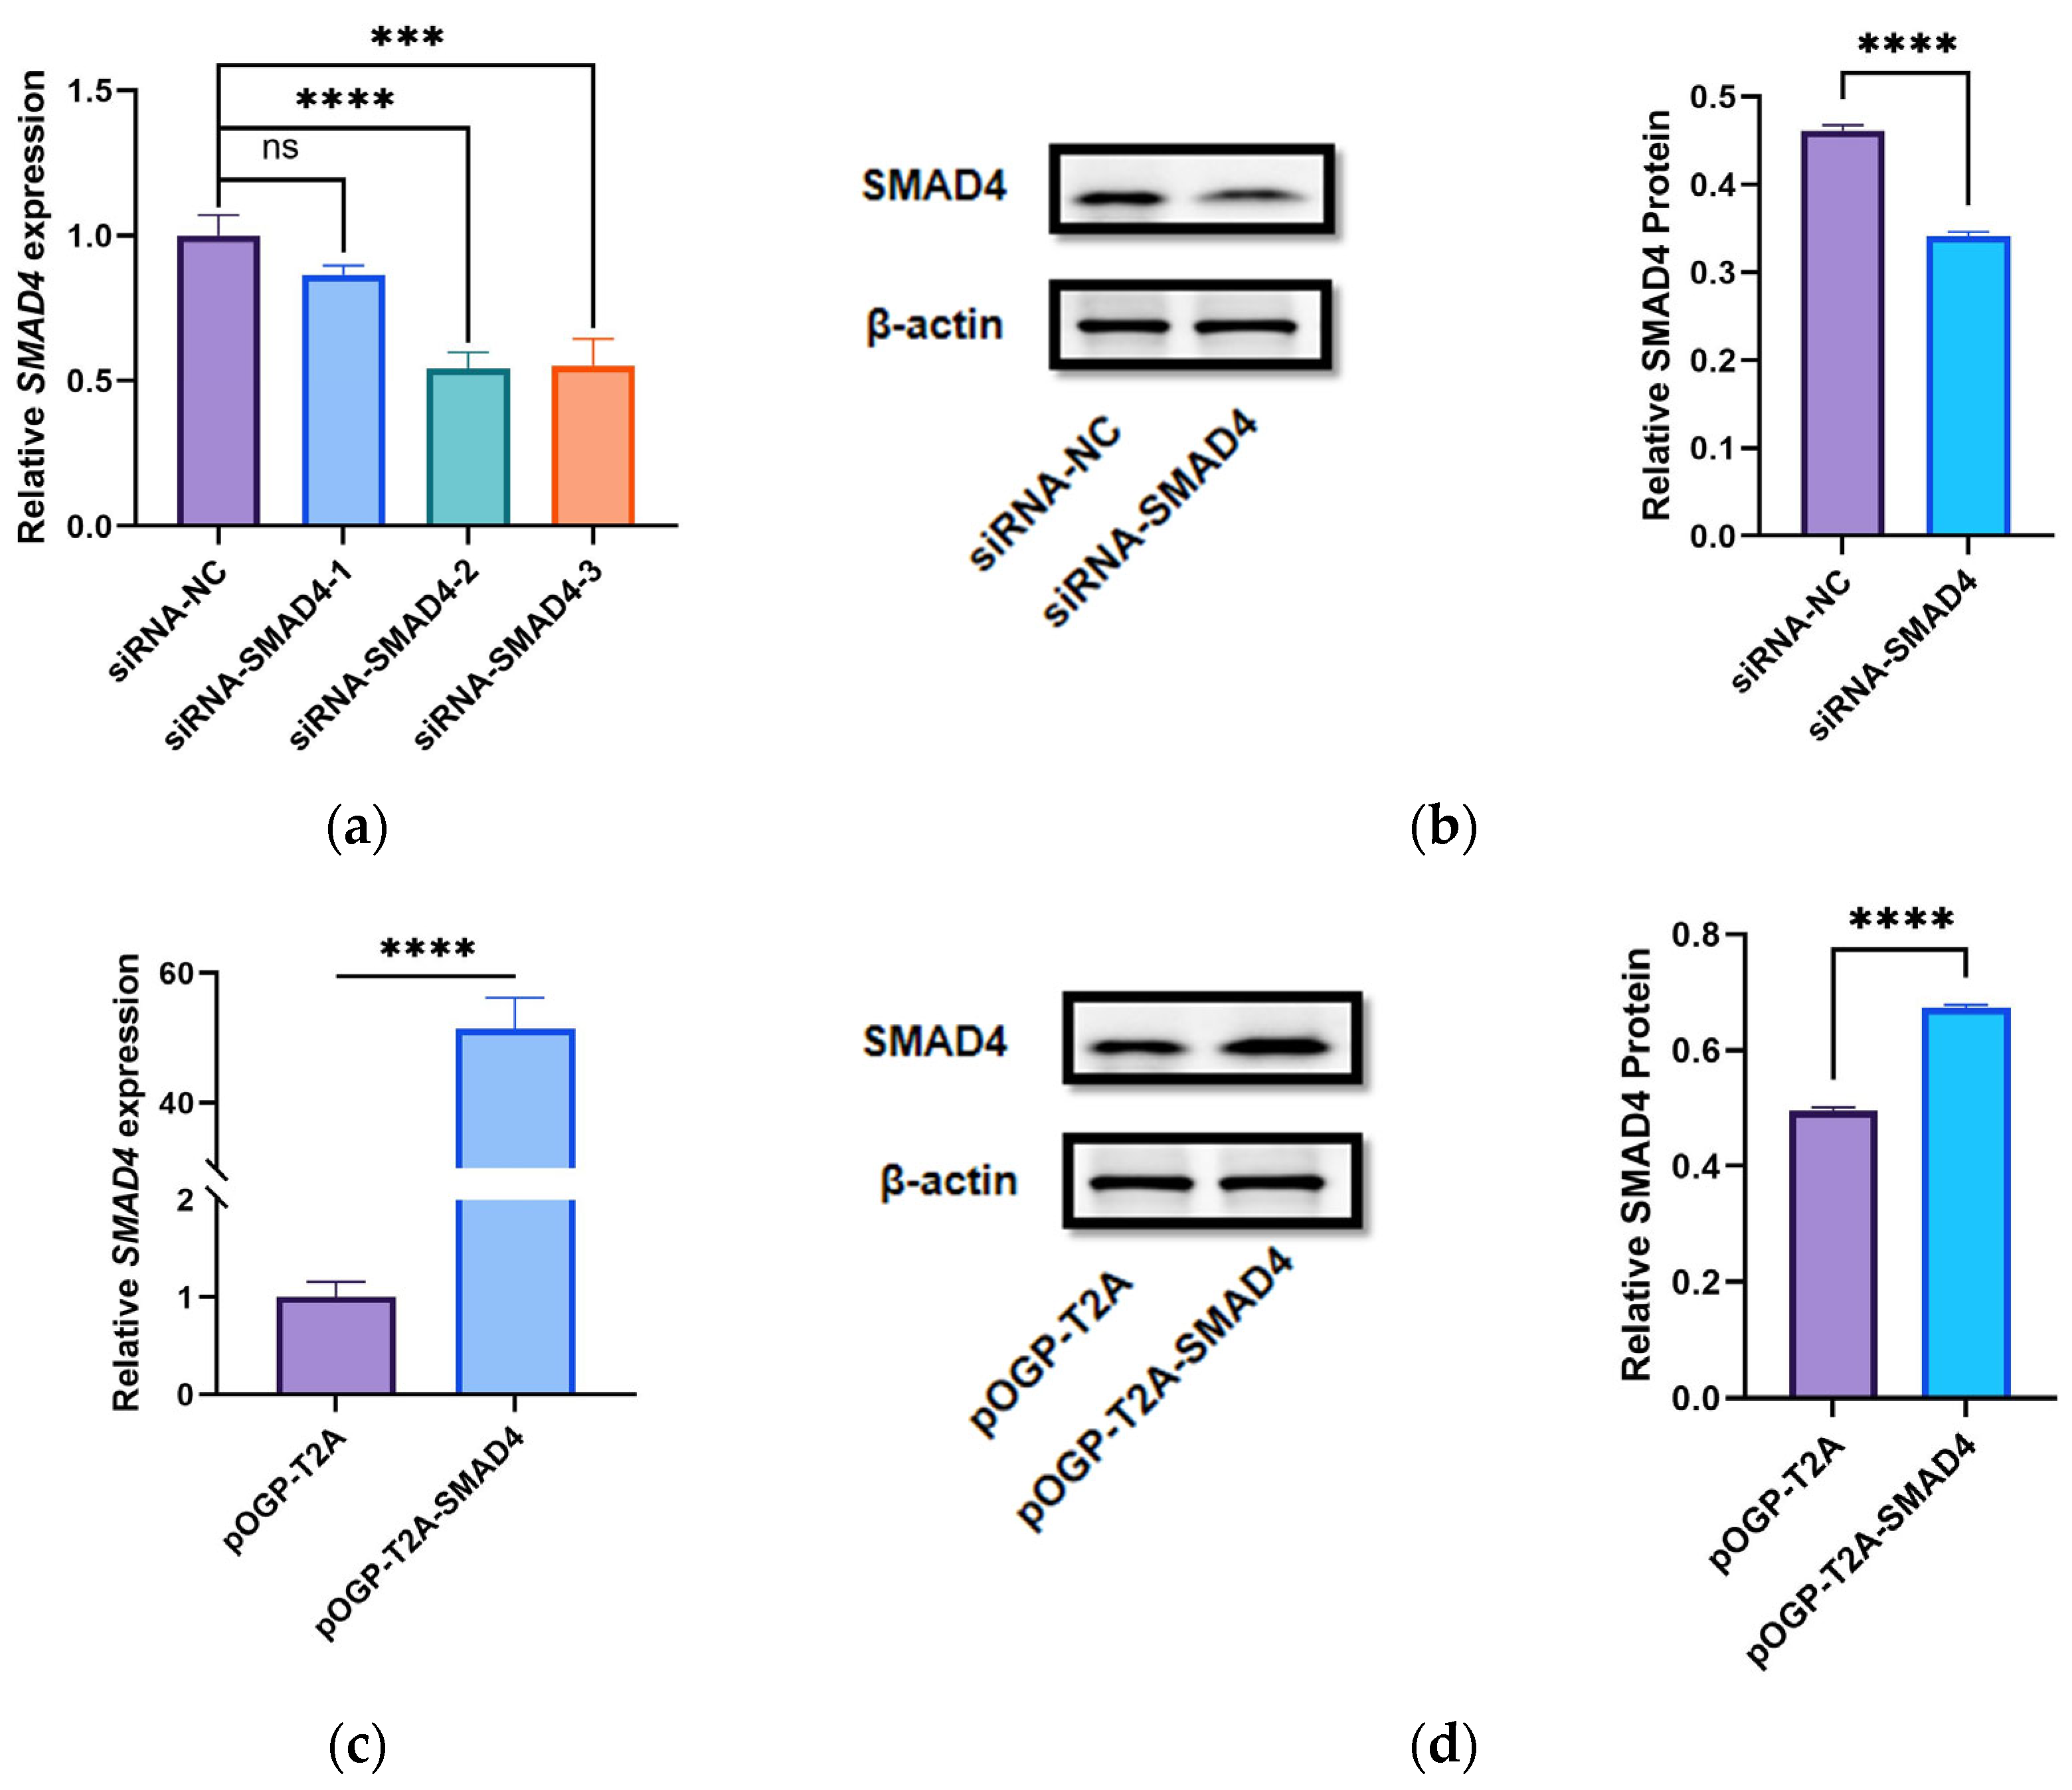
siRNA-SMAD4, siRNA negative control (siRNA-NC), pOGP-T2A, and pOGP-T2A-SMAD4 (pcDNA3.1, JST Scientific, Wuhan, China) were electroporated into DPCs using CUY21 EDIT II (BEX, Tokyo, Japan). Growth-arrested DPCs were seeded into culture bottles and cultured until reaching 90% confluence, with the complete medium being replaced by cell culture medium at 37 °C in a cell culture incubator with 5% CO2 for 24 h. Following two PBS rinses, the cells were digested with 0.25% trypsin, centrifuged for five minutes at 1500× g, and the supernatants removed. Cells were resuspended in 2 mL of Opti-MEM™ I reduced-serum medium, centrifuged at 1500× g for 5 min, and the supernatants were then discarded. Cells were then resuspended in 2 mL of Opti-MEM™ (Invitrogen, Carlsbad, CA, USA) I reduced-serum medium, stained with trypan blue, counted using a cell counter, and 1 × 10⁶ cells were removed and resuspended in 100 μL of Opti-MEM™ I reduced-serum medium. Subsequently, 1 μg of plasmid DNA was added, mixed thoroughly, and transferred into an electroporation cuvette. Electroporation parameters were set, and the cuvette was placed in the electroporator, and after verifying acceptable resistance, electroporation was performed. Post-electroporation, the cells were aspirated back into the culture bottle using a pipette and supplemented with cell culture medium. Fluorescence was detected using a fluorescence microscope after 24 h, and cells were collected 48 h post-electroporation for total RNA and total protein extraction. All sequences utilized are enumerated in Table 3.

2.7. Western Blot

Skin tissue samples were collected and immersed in liquid nitrogen prior to being pulverized in a mortar. Following the lysis of the powder using RIPA tissue/cell lysis buffer (Solarbio, Beijing, China) and subsequent storage at 4 °C, the supernatant was obtained using centrifugation at 2000 rpm for five minutes. The culture media were withdrawn after 48 h of cell transfection, and the cells were lysed using a pre-cooled RIPA lysis solution containing 1% PMSF. The supernatants were subsequently collected. The protein content was determined using the BCA Protein Assay Kit (Cwbio, Taizhou, China).
Proteins were fractionated by SDS-PAGE (10%) and subsequently transferred to PVDF membranes (Sigma Aldrich, Shanghai, China). Blocking was performed using 5% Blotting Grade (Beyotime, Shanghai, China). The chemiluminescent reaction was conducted using Super ECL Plus (UElandy, Suzhou, China), prepared according to a specified ratio. The primary antibodies utilized were SMAD4 (1:1000, Proteintech, Wuhan, China), β-actin (1:2000, Proteintech, Wuhan, China), CCND1 (1:10,000, Proteintech, Wuhan, China), CCND2 (1:1000, Proteintech, Wuhan, China), c-MYC (1:10,000, Proteintech, Wuhan, China), and β-catenin (1:10,000, Proteintech, Wuhan, China).

2.8. Cell Counting Kit-8 (CCK-8) Assay

DPCs were uniformly seeded in a 96-well plate at a density of 1 × 10³ cells per well. Cells underwent a 24 h incubation prior to transfection. Each well was administered 100 µL of fresh culture medium (DMEM/F12 + 10% FBS) supplemented with 10% CCK-8 (Beyotime, Shanghai, China) at 24, 48, 72, and 96 h post-transfection. The wells were subsequently incubated for two hours at 37 °C in darkness. A SpectraMax iD5 microplate reader (Molecular Devices, San Jose, CA, USA) was employed to measure absorbance at 450 nm to assess the reaction intensity and furnish quantitative data for further cellular response analysis.

2.9. Flow Cytometry Assay (FCM)

DPCs were inoculated in 6-well plates and grown until achieving 70–90% confluence prior to transfection. After 48 h of transfection, the progression of the cell cycle in DPCs was evaluated using a Cell Cycle and Apoptosis Detection Kit (Beyotime, Shanghai, China), following the manufacturer’s guidelines. Additionally, apoptosis in the DPCs was assessed using an Annexin V-FITC Apoptosis Detection Kit (Beyotime, Shanghai, China), following the provided protocol. Flow cytometry (Becton, Dickinson, and Company, Queensbury, NY, USA) was employed for comprehensive analysis of cell cycle distribution and apoptosis in DPCs following transfection, allowing for precise quantification and characterization of cellular responses.

2.10. Immunohistochemistry

Skin tissue samples from Xinji fine-wool sheep and Small-tail Han sheep were harvested during both the growth and resting phases and thereafter preserved in 4% paraformaldehyde (Biosharp, Hefei, China) for 48 h to preserve tissue morphology for subsequent analysis. After trimming to the appropriate size, the skin tissues were washed in embedding cassettes for 24 h. Following dehydration and paraffin embedding, sections were taken at ambient temperature. The slides were incubated in a 3% hydrogen peroxide solution (ANNJET, Dezhou, China) in the dark at ambient temperature for 25 min to suppress endogenous peroxidase activity. Thereafter, non-specific binding sites were blocked by incubating the slides with 3% BSA (Servicebio, Wuhan, China) at ambient temperature for 30 min. The SMAD4 basic antibody (1:100, Proteintech, Wuhan, China) was diluted in PBS (Servicebio, Wuhan, China) and administered to the slides, followed by overnight incubation at 4 °C. Following PBS washing, the slides were incubated at room temperature for 50 min with an HRP-conjugated goat anti-mouse IgG secondary antibody (1:200, Servicebio, Wuhan, China). The reaction was visualized using DAB chromogenic reagent (Servicebio, Wuhan, China) under a microscope (E100, Nikon, Japan).

2.11. Statistical Analyses

All data are presented as mean ± standard deviation (SD). Statistical analyses were conducted using SPSS 26 software (IBM, Chicago, IL, USA), with significance evaluated by t-tests or one-way ANOVA, subsequently followed by LSD and Duncan’s post hoc tests. Graphical representations and data analysis were performed using GraphPad Prism 9, the latest version (GraphPad Software, San Diego, CA, USA). Differences were considered nonsignificant (ns) when p > 0.05, with * p < 0.05 indicating significance, ** p < 0.01 indicating high significance, *** p < 0.001 indicating very high significance, and **** p < 0.0001 indicating extreme significance.

3. Results

3.1. Differences in the Spatiotemporal Expression of miR-370-3p and SMAD4 mRNA in Sheep

We utilized qRT-PCR to evaluate the expression patterns of miR-370-3p and SMAD4 mRNA in various tissues of both Xinji fine-wool sheep and Small-tail Han sheep, as illustrated in Figure 1. miR-370-3p exhibited extensive expression throughout seven tissues in both Small-tail Han sheep and Xinji fine-wool sheep, with peak expression levels recorded in the heart of Small-tail Han sheep and the lungs of Xinji fine-wool sheep. A comparative analysis demonstrated a significantly increased amount of miR-370-3p in the heart, spleen, and skin tissues of Small-tail Han sheep compared to Xinji fine-wool sheep, but expression was drastically reduced (Figure 1a). SMAD4 mRNA exhibited extensive expression throughout the seven tissues in both sheep breeds, with peak expression observed in the heart of Small-tail Han sheep and diminished levels in the spleen, liver, and lungs. In contrast, the highest expression in Xinji fine-wool sheep was observed in muscle tissue, with lower expression in the liver and spleen. Comparative analysis demonstrated a notable upregulation of SMAD4 mRNA expression in the heart, spleen, and skin tissues of Small-tail Han sheep relative to Xinji fine-wool sheep, while a noticeable downregulation of SMAD4 expression was detected in the lungs and muscle tissues (Figure 1b).
Considering that SMAD4 is a predicted target of miR-370-3p, we verified their expression levels in the skin tissues of Small-tail Han sheep and Xinji fine-wool sheep during the growth and telogen phases by RT-qPCR. The results showed that the expression level of miR-370-3p was low in the skin tissues of the two types of sheep during the growth phase, while the expression pattern of SMAD4 was opposite to that of miR-370-3p. This indirectly indicates a targeting relationship between miR-370-3p and SMAD4 (Figure 1c,d).

3.2. Localization of SMAD4 in Different Skin Tissues

Immunohistochemical analysis showed the presence and distribution of SMAD4 protein in the hair follicles of both Xinji fine-wool sheep and Small-tail Han sheep. Cross-sectional examination demonstrated expression in the connective tissue sheath, outer root sheath, and hair cortex (Figure 2a,b), whereas longitudinal sections exhibited expression in the hair bulb and dermal sheath (Figure 2c,d). Based on these findings, it is concluded that SMAD4 protein is expressed in the DPCs. PCR using DPC cDNA as a template confirmed the expression of the SMAD4 gene in DPCs (Figure 2e and Figure S1).

3.3. Binding of miR-370-3p to the 3′UTR of SMAD4

The results of target gene prediction indicated that miR-370-3p may have a targeting relationship with SMAD4. The results of protein interaction prediction showed that SMAD4 interacts with SMAD2, SMAD1, TGFBR1, and other proteins (Figure 3). To ascertain if miR-370-3p targets the SMAD4 gene, RNAhybrid was employed to predict binding sites, demonstrating complementary interaction between the mature sequencing of miR-370-3p and the 3′UTR of SMAD4 (Figure 4a). Based on these predicted binding sites, wild-type pmirGLO vectors containing the 3′UTR region of SMAD4 (SMAD4-WT) and a mutant vector (SMAD4-Mut) were generated and subsequently transfected into HEK-293T cells. After 48 h, relative luciferase activity (RLU) was markedly diminished in the WT group (pmirglo-oar-miR-370-3p-SMAD4-WT), contrasted with the control group, but no notable difference was seen in the MUT group (mimics NC + pmirglo-oar-miR-370-3p-SMAD4-Mut) in relation to the control (Figure 4b). The results demonstrate that miR-370-3p directly interacts with SMAD4 by adhering to its 3′ untranslated region (UTR). The findings demonstrate that SMAD4 is an exact target gene of miR-370-3p.
DPCs were incubated with miR-370-3p mimics, mimic NC, miR-370-3p inhibitor, and inhibitor NC for 48 h, and subsequently subjected to RT-qPCR and Western blot analyses to evaluate the regulatory effect of miR-370-3p on the mRNA and protein expression levels of SMAD4.RT-qPCR research revealed a substantial downregulation of SMAD4 expression following the overexpression of miR-370-3p, whereas the silencing of miR-370-3p led to a pronounced upregulation of SMAD4 expression (Figure 4c). WB analysis confirmed the findings from RT-qPCR (Figure 4d and Figure S2), further validating the targeted interaction between SMAD4 and miR-370-3p.

3.4. Detection of SMAD4 siRNA and Overexpression Plasmid Transfection Efficiency

We transfected siRNA-NC, siRNA-SMAD4-1, siRNA-SMAD4-2, and siRNA-SMAD4-3 into DPCs for 48 h, followed by RT-qPCR to assess the knockdown efficiency of the siRNAs. Results indicated that siRNA-SMAD4-2 exhibited the most effective knockdown (Figure 5a) and was designated as siRNA-SMAD4 for subsequent experiments. Further validation using WB confirmed significant interference by siRNA-SMAD4 on SMAD4 protein expression levels (Figure 5b and Figure S3). Overall, these results demonstrated successful knockdown of SMAD4 mRNA and protein levels by siRNA-SMAD4.
Next, we transfected the constructed overexpression plasmid pOGP-T2A-SMAD4 into DPCs for 48 h, followed by RT-qPCR and WB to assess the overexpression efficiency of the plasmid. The findings demonstrated that pOGP-T2A-SMAD4 markedly enhanced SMAD4 expression both at the mRNA and protein levels, validating its suitability for further experimental protocols (Figure 5b,d and Figure S4).

3.5. miR-370-3p Modulates Cellular Phenotype Through SMAD4

This study investigated the impact of miR-370-3p and SMAD4 on the mRNA level of genes associated with cell phenotype (Figure 6). The findings indicated that miR-370-3p substantially reduced the expression of the proliferation-related genes Proliferating Cell Nuclear Antigen (PCNA) and CCND1 mRNA; considerably diminished the presentation of the cell cycle-associated genes Cyclin-dependent kinase 4 (CDK4) and Cyclin D2 (CCND2) mRNA; significantly enhanced the mRNA expression of the apoptosis-related gene BCL2-associated X protein (Bax) and suppressed B-cell lymphoma 2 (Bcl-2) mRNA expression. The results indicated that miR-370-3p might inhibit the proliferation of DPCs and affect the cell cycle.
Transfection of siRNA-NC, siRNA-SMAD4, pOGP-T2A, and pOGP-T2A-SMAD4 into DPCs for 48 h, followed by RT-qPCR, revealed that SMAD4 significantly upregulated the expression of proliferation-related genes PCNA and CCND1 mRNA; substantially increased the expression of cell cycle-associated genes CDK4 and CCND2 mRNA; significantly downregulated the expression of the apoptosis-related gene Bax mRNA; and markedly increased Bcl-2 mRNA expression. The results indicated that SMAD4 might promote the proliferation of DPCs and affect the cell cycle.
This research examined the influence of miR-370-3p and SMAD4 on DPC proliferation by the CCK-8 test. The findings indicated that the overexpression of miR-370-3p significantly inhibited DPC proliferation consistently from 24 to 96 h. The suppression of miR-370-3p expression did not notably affect proliferation during the 0–24 h interval but dramatically enhanced proliferation from 48 to 96 h. Transfection of siRNA-NC, siRNA-SMAD4, pOGP-T2A, and pOGP-T2A-SMAD4 into DPCs for 48 h, followed by CCK-8 tests, demonstrated that SMAD4 overexpression markedly enhanced cell proliferation from 24 to 96 h. Conversely, interference with SMAD4 expression significantly inhibited cell proliferation from 24 to 72 h, with no significant difference observed at 96 h. Overall, the study results demonstrate that miR-370-3p targets SMAD4 to suppress DPC proliferation (Figure 7).
Cell cycle analysis revealed that the overexpression of miR-370-3p led to a substantial buildup of cells in the G1 phase and a marked reduction in the proportion of cells in the S phase compared to the control group. Suppression of miR-370-3p expression significantly increased the quantity of cells in the S phase compared to the controls. Transfection of siRNA-NC, siRNA-SMAD4, pOGP-T2A, and pOGP-T2A-SMAD4 into DPCs for 48 h followed by cell cycle analysis showed that interference with SMAD4 expression markedly elevated the number of cells in the G1 phase while reducing the number of cells in the S phase relative to the control group, with no substantial change noted in the G2 phase. Conversely, SMAD4 overexpression significantly decreased the cell count in the G1 phase and increased the cell count in the S phase compared to the control group, with no significant alteration observed in the G2 phase. These data imply that miR-370-3p targeting SMAD4 plays a regulatory function in the cell cycle of DPCs (Figure 8).
Furthermore, to assess the impact of miR-370-3p on DPC apoptosis, Annexin V-FITC/PI dual labeling was performed. The results demonstrated that the overexpression of miR-370-3p significantly increased the apoptosis rate compared to the control group, whereas the inhibition of miR-370-3p expression substantially decreased the apoptosis rate. The transfer of siRNA-NC, siRNA-SMAD4, pOGP-T2A, and pOGP-T2A-SMAD4 into DPCs for 48 h, followed by Annexin V-FITC/PI staining, demonstrated that the downregulation of SMAD4 expression markedly increased the apoptosis rate compared to the control group, while SMAD4 overexpression significantly decreased apoptosis relative to the control. The findings demonstrate that miR-370-3p induces apoptosis in dermal DPCs via targeting SMAD4 (Figure 9).

3.6. miR-370-3p Binds SMAD4 and Modulates Gene Expression in DPCs

The upstream and downstream genes of SMAD4 within the Wnt/β-catenin signaling cascade were analyzed after transfection of DPCs with miR-370-3p mimic-NC, miR-370-3p mimic, miR-370-3p inhibitor-NC, miR-370-3p inhibitor, siRNA-NC, siRNA-SMAD4, pOGP-T2A, and pOGP-T2A-SMAD4 for 48 h. RT-qPCR was used to detect the mRNA expression levels of JUN, c-MYC, transcription factor 7-like 1 (TCF7L1), transcription factor 7-like 2 (TCF7L2), and β-catenin in DPCs.
When miR-370-3p was overexpressed, there was a significant increase in JUN, c-MYC, and TCF7L2 expression, and a marked inhibition of β-catenin expression, with no significant effect on TCF7L1 expression (Figure 10a). Conversely, inhibition of miR-370-3p expression significantly suppressed JUN, c-MYC, and TCF7L2 expression, markedly promoted β-catenin expression, and showed no significant effect on TCF7L1 expression.
Furthermore, upon interference of SMAD4 expression, there was significant suppression of transcription factor 7 (TCF7) and β-catenin expression, and significant promotion of JUN, c-MYC, and TCF7L2 expression, with no significant effect on TCF7L1 expression (Figure 10b). Also, overexpression of SMAD4 significantly promoted TCF7 and β-catenin expression, suppressed JUN, c-MYC, and TCF7L2 expression, and had no discernible impact on the expression of TCF7L1.
In addition, following the transfection of miR-370-3p mimic-NC, miR-370-3p mimic, miR-370-3p inhibitor-NC, miR-370-3p inhibitor, siRNA-NC, siRNA-SMAD4, pOGP-T2A, and pOGP-T2A-SMAD4 into DPCs for 48 h, the protein expression levels of CCND1, CCND2, c-MYC, and β-catenin were evaluated by Western blotting. The results showed that miR-370-3p overexpression significantly increased c-MYC expression while significantly reducing β-catenin, CCND1, and CCND2 expression (Figure 11a,b and Figure S4). CCND1, CCND2, and β-catenin expression were significantly increased while c-MYC expression was significantly decreased when miR-370-3p expression was inhibited. Moreover, interference with SMAD4 expression significantly suppressed CCND1, CCND2, and β-catenin expression, while significantly promoting c-MYC expression. However, overexpression of SMAD4 significantly suppressed c-MYC expression and significantly promoted CCND1, CCND2, and β-catenin expression.

4. Discussion

Numerous cell types, including DPCs and hair follicle stem cells (HFSCs), carefully regulate the growth and development of hair follicles. HFSCs are vital for sustaining the long-term regeneration potential of hair follicles, whereas DPCs deliver crucial signals that direct follicular morphogenesis, cycling, and differentiation. Together, these cell populations interact within a highly coordinated microenvironment to ensure proper follicular function and hair production. Wnt/β-catenin, Notch, Sonic Hedgehog (Shh), and BMP are among the several signaling pathways that control the growth and differentiation of hair follicles. These pathways control key processes like cell proliferation and differentiation, ensuring proper hair follicle function [13]. The genetic regulatory network governing hair follicle development is highly complex, encompassing a range of signaling pathways, including Wnt, BMP, EDAR, and Shh. These pathways function interactively within the follicular microenvironment, coordinating cellular processes that regulate follicle morphogenesis and cycling [2,14]. MicroRNAs influence the biological processes of cancer, including invasion, metastasis, apoptosis, and proliferation, by controlling significant signaling pathways such as PI3K/Akt, MAPK, and Wnt [15].
MicroRNAs (miRNAs) are diminutive, non-coding RNA molecules, typically around 24 nucleotides in length, that regulate gene expression post-transcriptionally. They affect outcomes by binding to specific areas in the 3′UTR of target mRNAs, leading to either mRNA destruction or translational repression. MiRNAs have a vital role in regulating multiple biological processes, including cell differentiation, proliferation, and apoptosis, through these pathways [16]. They provide crucial regulatory functions in organismal growth and development, and research has underscored the important functions of miR-370-3p in disorders like myocardial infarction, heart failure, lung cancer of non-small cells, and pneumonia [17,18,19]. Moreover, miR-370-3p has been linked to the regulation of tumors and malignancies. Jia et al. demonstrated that CircCCNB1 suppresses cervical cancer proliferation through the miR-370-3p/SOX4 pathway, emphasizing the significance of circular RNAs (circRNAs) in the regulation of cancer-related signaling pathways [20]. This study highlights the crucial function of miR-370-3p in facilitating the regulatory impact of circCCNB1 on carcinogenic mechanisms. Additionally, it has been suggested that circ_0025033 facilitates the advancement of ovarian cancer by modulating the has-miR-370-3p/SLC1A5 pathway. This underscores the regulatory role of circular RNAs (circRNAs) in influencing miRNA activity, which in turn affects critical cellular processes such as amino acid transport. Such regulation may be integral to tumor growth and metabolism, thus highlighting the complex molecular interactions contributing to ovarian cancer progression [21]. Experimental evidence by Li et al. confirmed that circARID1A regulated glioblastoma migration and invasion via the miR-370-3p/TGFBR2 axis [22]. Additionally, miR-370-3p is implicated in the control of several physiological processes in rats, and studies have indicated its role in the regulation of goat hair follicle development. Considering the notable disparities in wool fiber diameter between Xinjiang fine-wool sheep and Tan sheep, together with prior research on miR-370-3p in goats conducted by Haierhan, it has been deduced that 
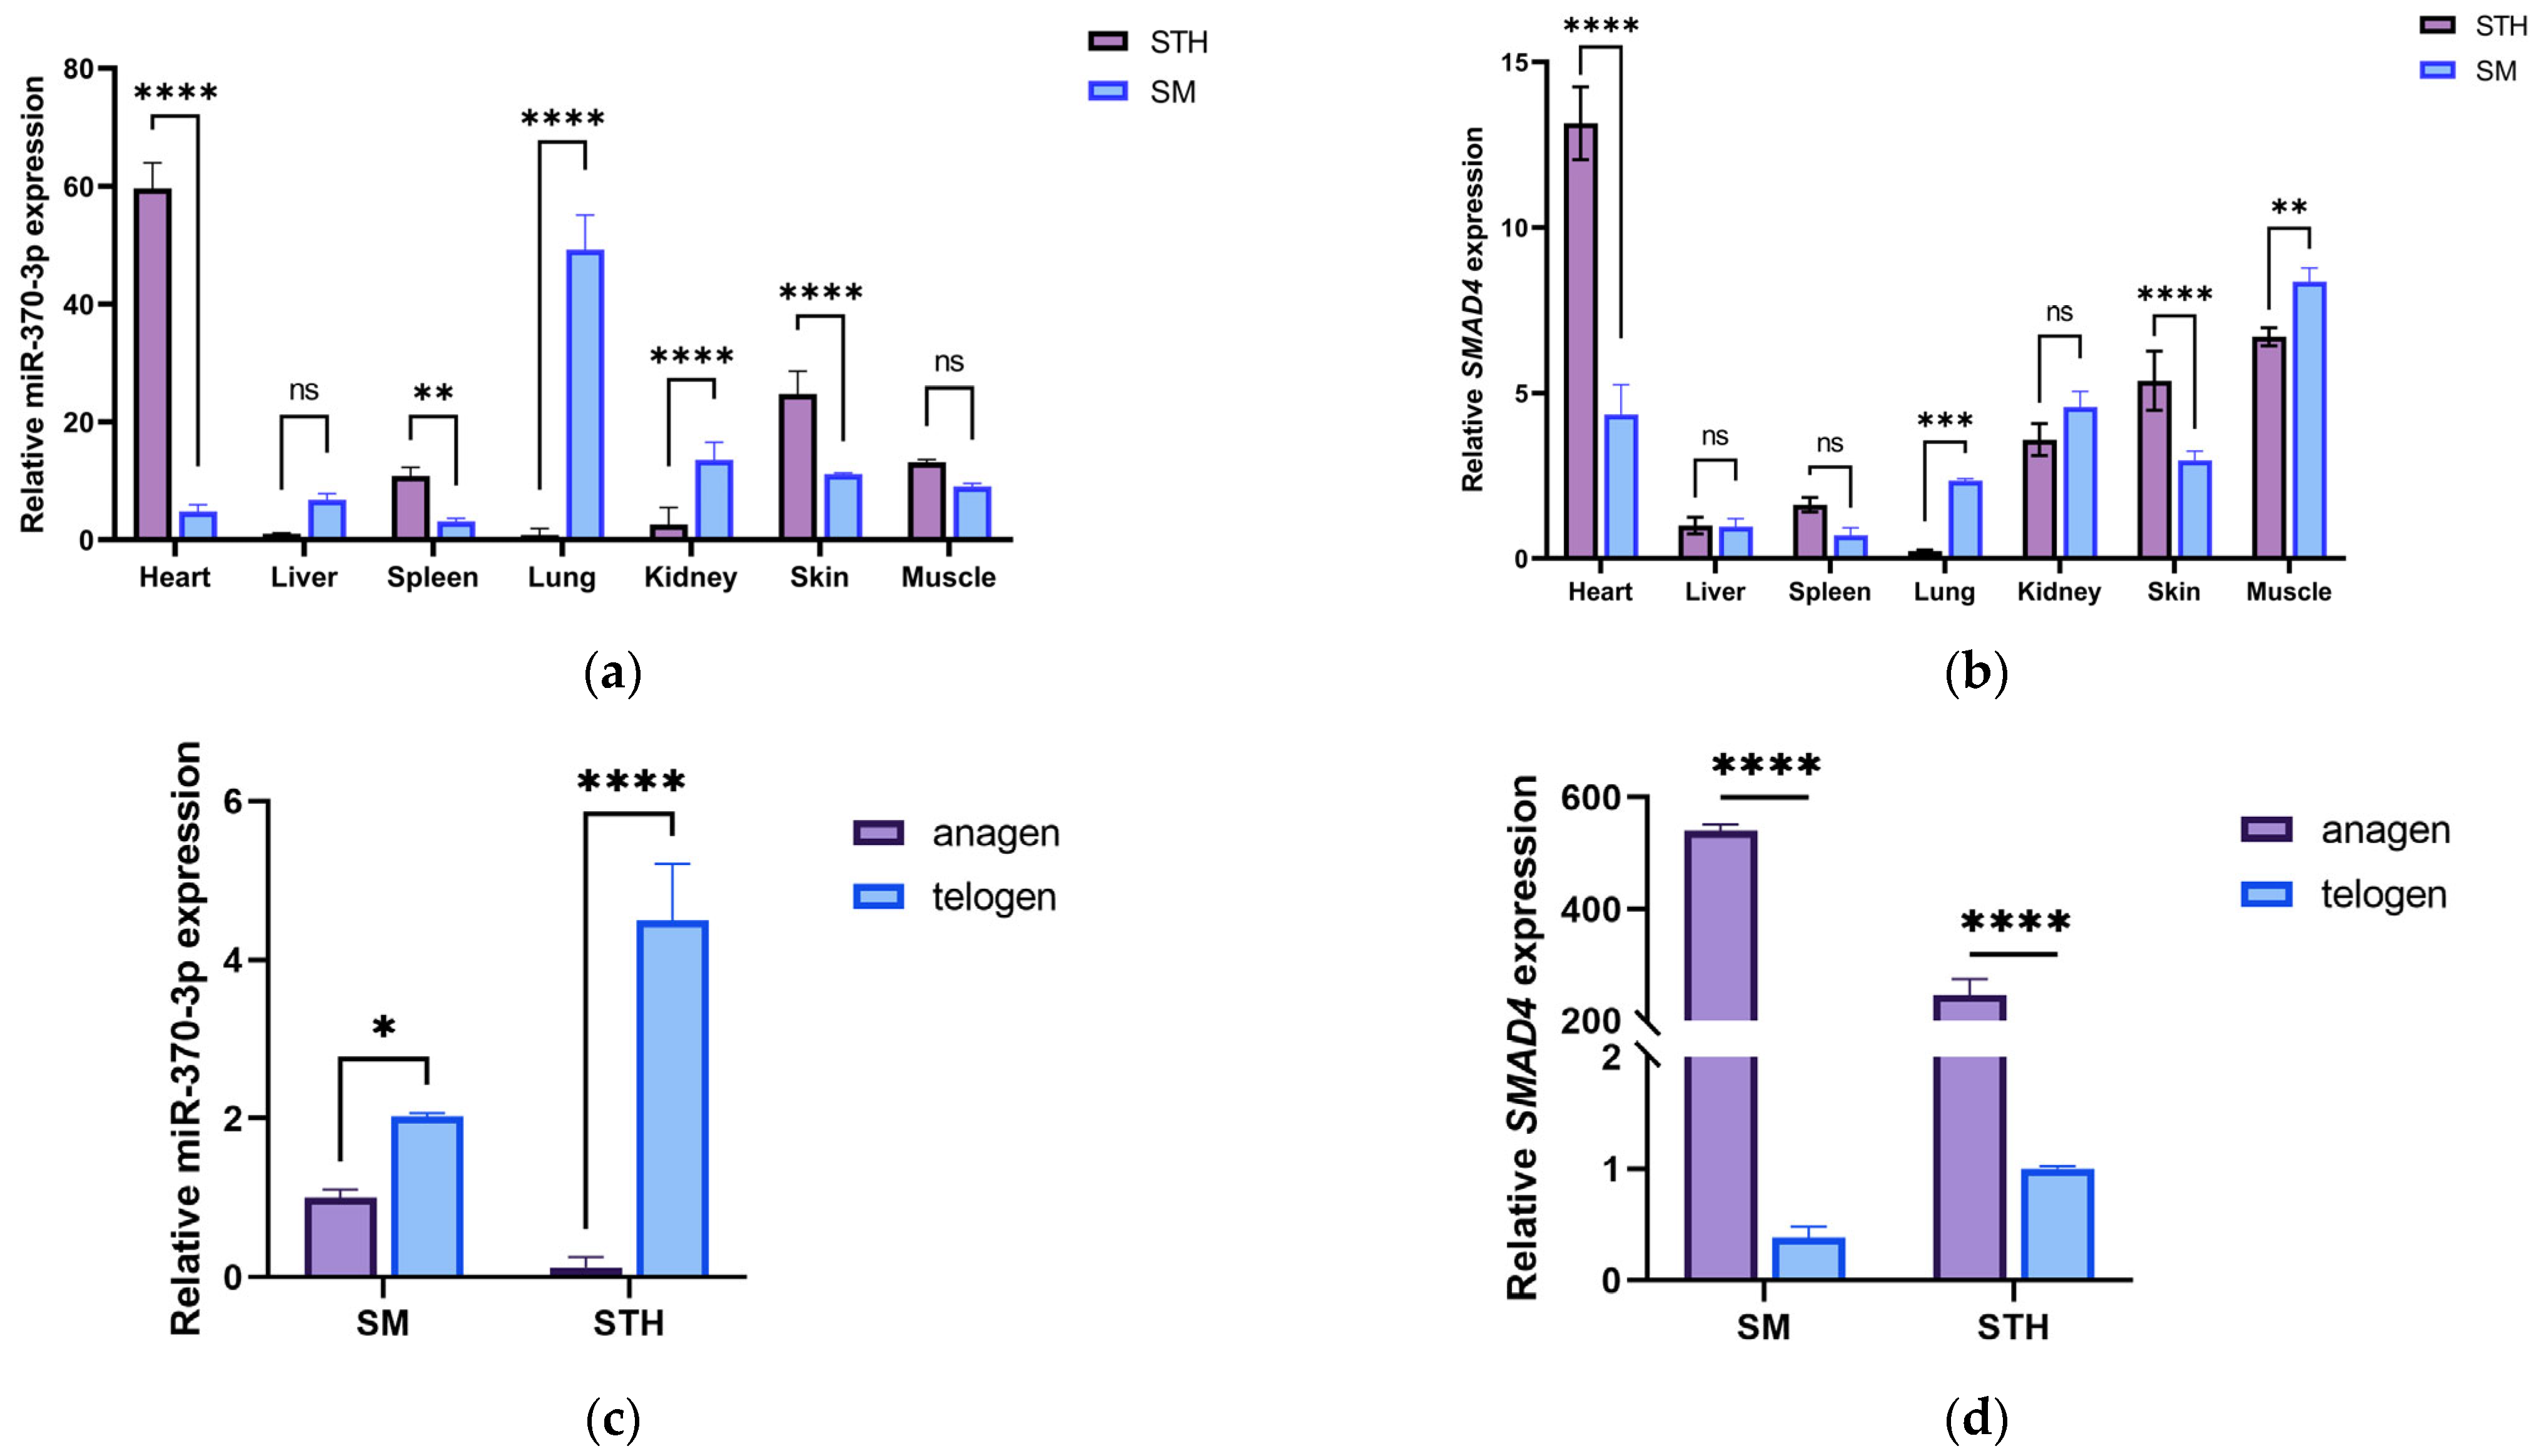
miR-370-3p may be linked to follicles for hair growth and development. This study gathered skin samples from sheep in October (hair follicle growth phase) and January (hair follicle resting phase) for fluorescence quantitative PCR, revealing significant differences in spatiotemporal expression of miR-370-3p in skin tissues. This suggests that miR-370-3p may have a regulatory role in the growth, cycle, and phenotype of sheep hair follicles. The analysis of miR-370-3p tissue expression demonstrated significant variation in expression patterns between the two sheep breeds. Target gene validation using dual-luciferase reporter assays and detection at the gene and protein levels confirmed SMAD4 as a target for miR-370-3p, consistent with previous studies. Subsequent transient transfection assays on DPCs confirmed the targeting efficacy of miR-370-3p on SMAD4, leading to the downregulation of SMAD4 expression.
Prior studies have highlighted the pivotal function of the SMAD family in regulating hair follicle cycling and the differentiation of associated cells, hence indicating its significance in the molecular pathways governing hair follicle growth and homeostasis. SMAD2 has been suggested to modulate hair follicle development and growth in Angora rabbit dermal tissues through the TGF-β signaling pathway, underscoring the critical role of SMAD family members in hair follicle dynamics [23]. Research demonstrates that miR-203a-3p inhibits SMAD1 expression, hence facilitating the process of differentiation of HFSCs induced by loureirin A. This shows that miR-203a-3p is pivotal in regulating HFSC differentiation by modulating the SMAD1 signaling pathway [12]. Nan et al. [24] revealed that All-trans-retinoic acid (ATRA) reduces DPC proliferation and promotes apoptosis via the TGF-β2/Smad2/3 signaling pathway, therefore decreasing hair follicle development. This finding underscores the regulatory influence of ATRA on hair follicle dynamics via modulation of essential biological mechanisms, including growth and apoptosis. SMAD7 is acknowledged as an antagonist of Wnt/β-catenin signaling, and its activation can alter the differentiation of skin cells from hair follicle production to sebaceous gland development. This indicates that SMAD7 is essential in regulating the equilibrium between hair follicle and sebaceous gland development by opposing the Wnt/β-catenin pathway, therefore affecting skin appendage differentiation [25]. Li et al. proposed that downregulation of the transcription factor SMAD3 inhibits TGF-β signaling, inducing premature entry and prolongation of dormant hair follicles into the growth phase [26]. These findings imply that the SMAD4 protein may influence the hair follicle cycle and associated cellular phenotypes, thereby contributing to variations in wool traits. This suggests that SMAD4 may regulate critical processes, including follicular differentiation, growth, and development, which are vital for defining wool characteristics. Additional study is necessary to clarify the specific molecular pathways by which SMAD4 influences hair follicle dynamics and its possible impact on wool phenotypes. Research has demonstrated that the ablation of the SMAD4 gene leads to the deterioration of hair follicles in the epidermis, highlighting its essential role in regulating hair follicle growth and development [10,27]. SMAD4 is essential for the proper development of hair follicles, and its functional deletion in mice disrupts the normal hair follicle cycle. This disturbance can result in abnormal skin development, thereby elevating the risk of skin cancers or carcinomas [27,28].
Park et al. suggested that the Wip1 gene inhibits TGF-β signaling by regulating SMAD4 phosphorylation [29]. Wang et al. demonstrated that the inhibition of TGF-β1 gene expression leads to reduced SMAD4 phosphorylation, hence promoting apoptosis and impeding proliferation of cells, assault, and the transition from epithelial to mesenchymal in gallbladder cancer. The results highlight the crucial role of the TGF-β/SMAD4 signaling pathway in regulating vital cellular processes in cancer growth and suggest potential therapeutic options for targeting this pathway in gallbladder cancer [30]. Structural analyses reveal that the MH1 and MH2 modules of SMAD4 are linked by a flexible region, enabling dynamic conformational changes. This flexibility is crucial for the protein’s function, as it facilitates transient interactions with other SMAD proteins and transcriptional regulators, thereby modulating its role in TGF-β signaling and cellular responses [31]. These results indicate that SMAD4 may modulate cell phenotypes by affecting cellular processes vital for the organism’s physiological functioning, such as proliferation, differentiation, and death. This regulation likely contributes to tissue development and overall homeostasis.
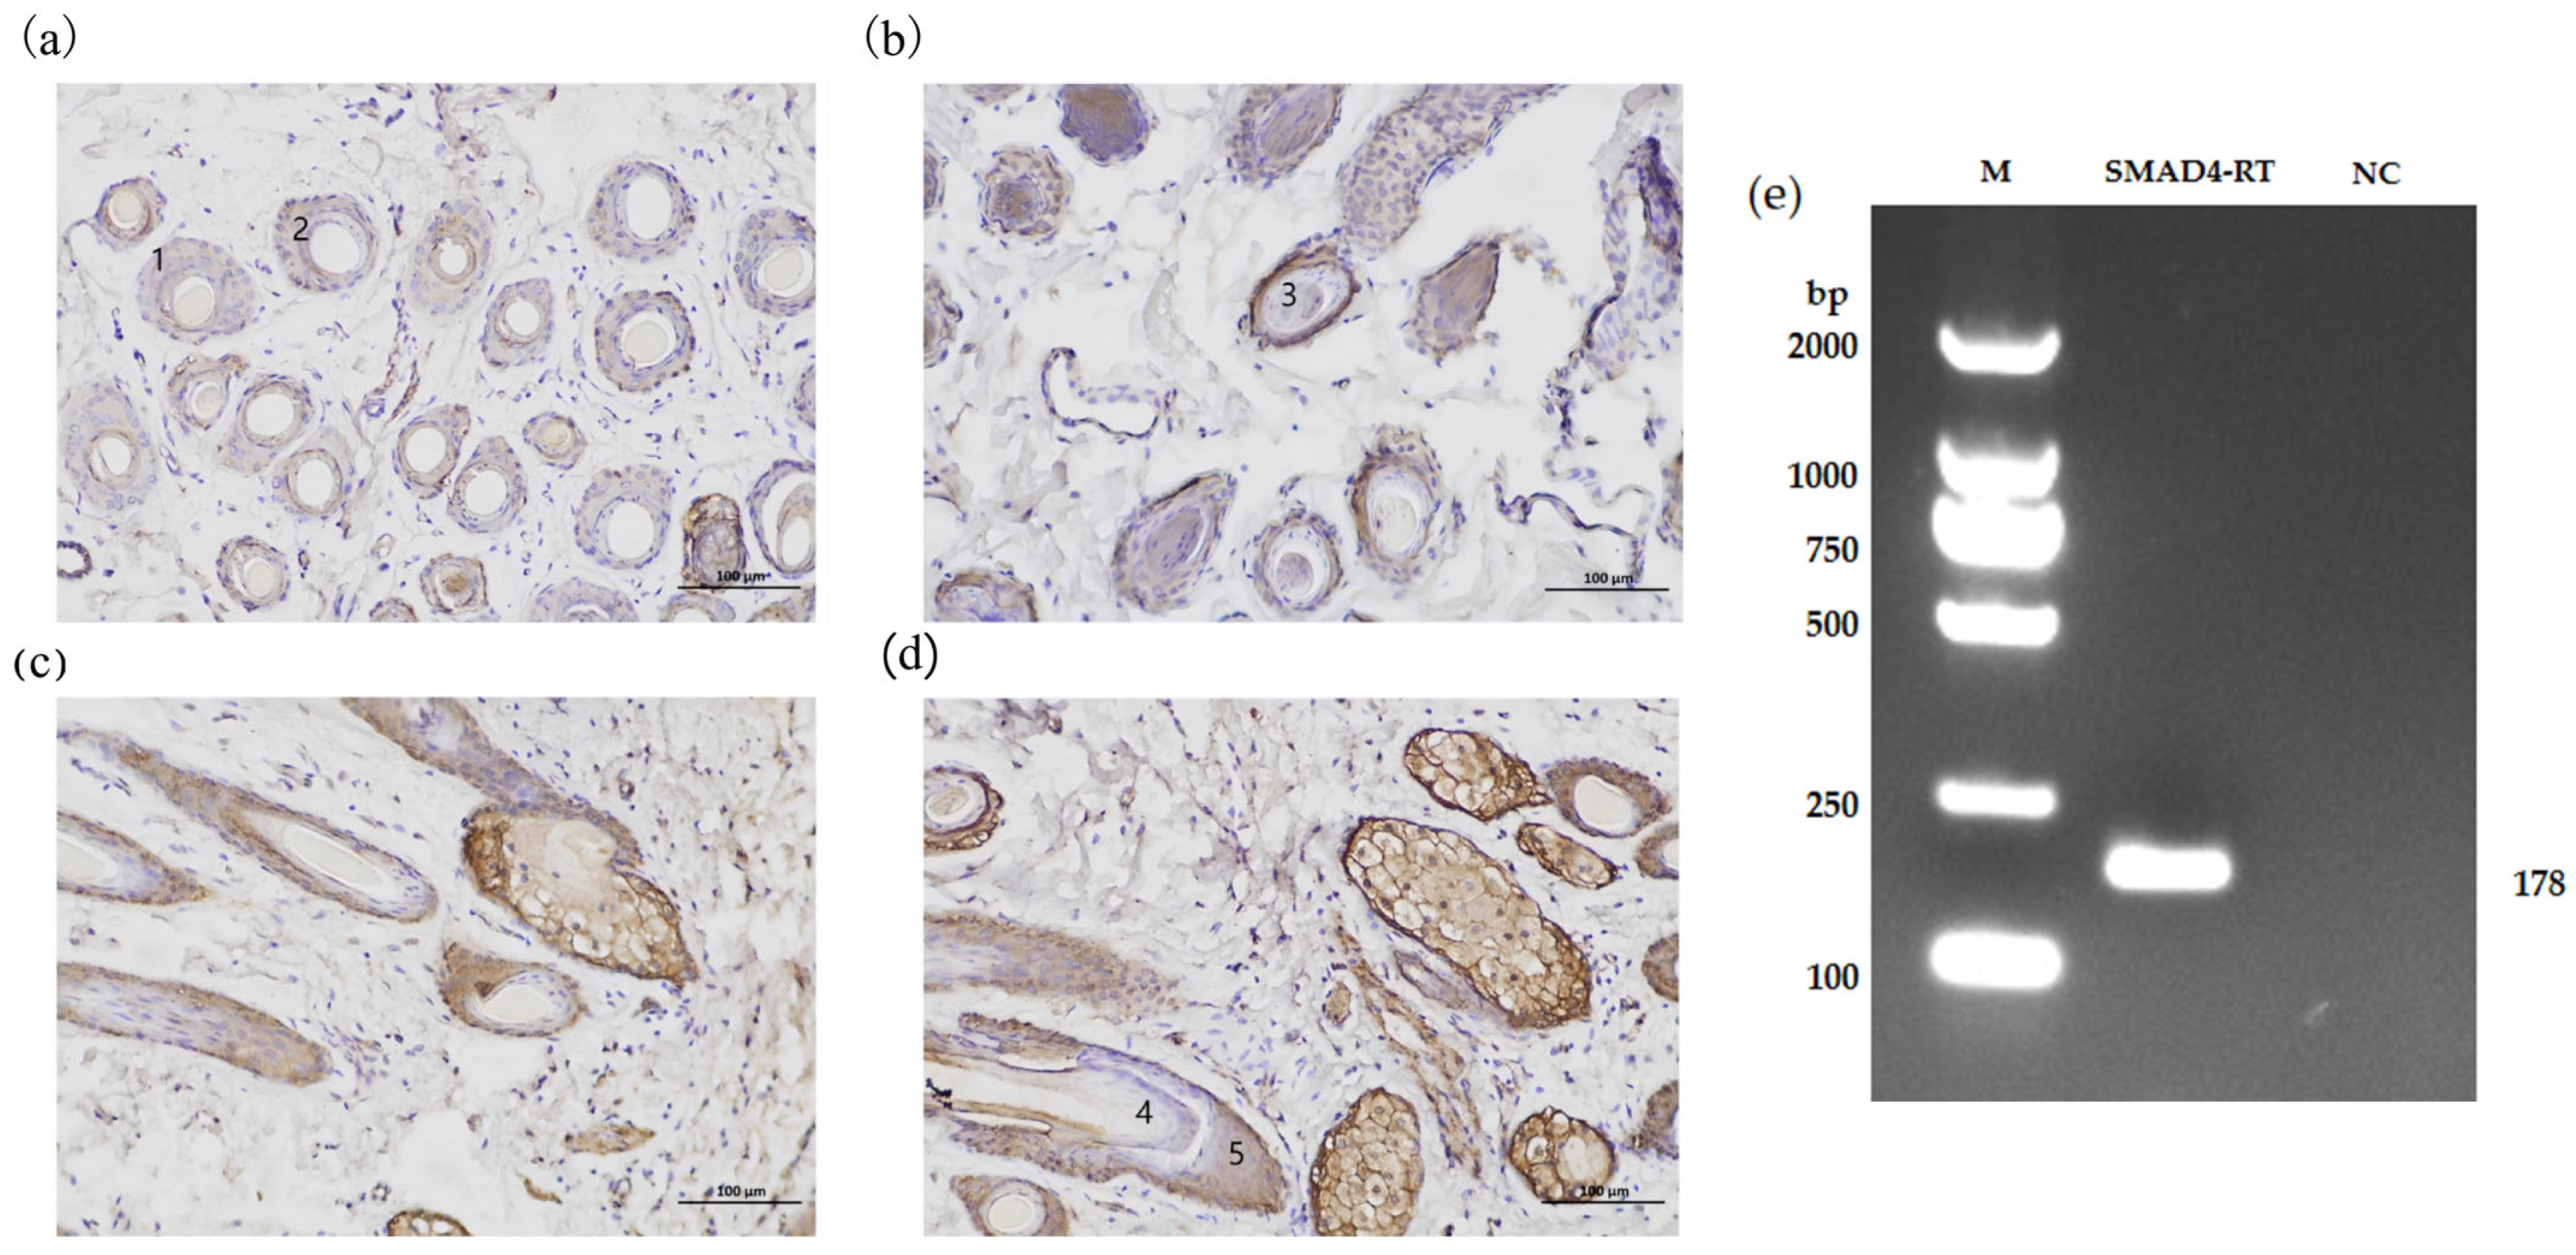
To elucidate the regulatory function of the SMAD4 gene in sheep, real-time quantitative PCR (qPCR) was utilized to assess the expression levels of SMAD4 across different tissues in Small-tail Han sheep and Xinji fine-wool sheep. We found that there were significant differences in heart, spleen, skin, lung, and muscle tissues between the two breeds. Considering the substantial disparities in wool fiber diameter and hair follicle density between Small-tail Han sheep and Xinji fine-wool sheep, together with the pronounced variations in SMAD4 gene expression in the skin tissues of both breeds in January (hair follicle growth phase), We hypothesize that the SMAD4 gene may be involved in the regulation of hair follicle growth and development, aligning with predictions derived from protein interaction analysis. Immunohistochemistry results further validated the expression of the SMAD4 protein in multiple parts of the hair follicle, confirming our hypothesis. This study validated the expression of the SMAD4 gene in several sheep tissues, underscoring its essential role in hair follicle growth and development. Future research will employ DPCs from this study to analyze the regulatory effects of miR-370-3p and SMAD4 genes on cell phenotypes and the mechanisms governing hair follicle cell cycles in Tan sheep.
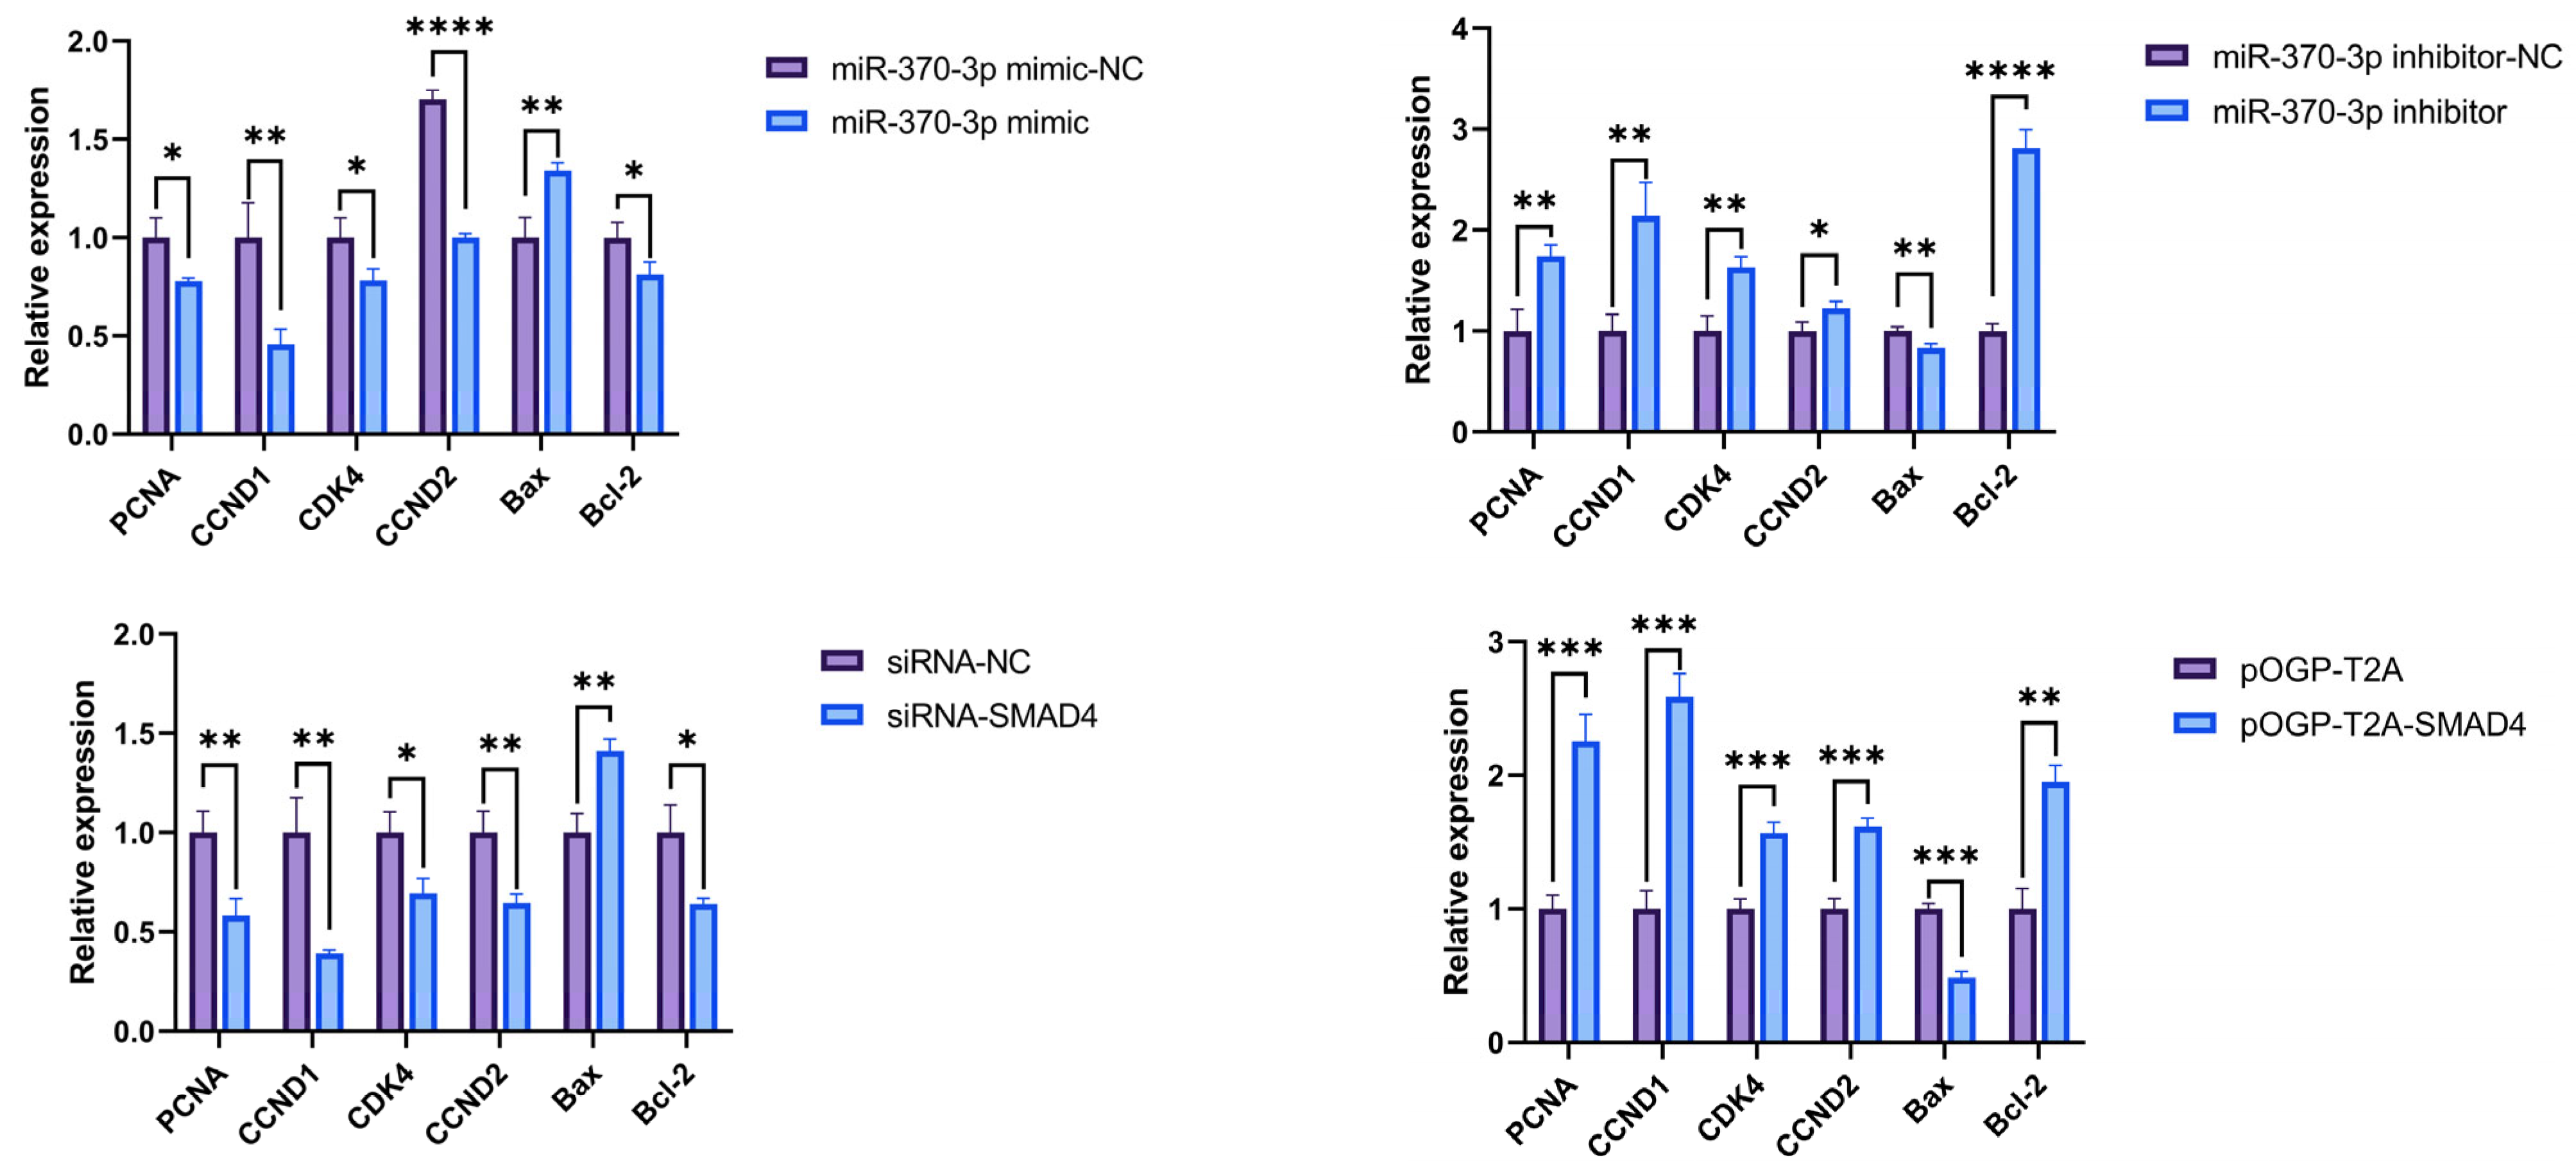
Through RT-qPCR, cell phenotype-related genes (PCNA, CCND1, CDK4, CCND2, Bax, Bcl-2) were preliminarily determined to be affected by miR-370-3p in DPCs, influencing cell proliferation, cycle, and apoptosis, possibly through targeting 
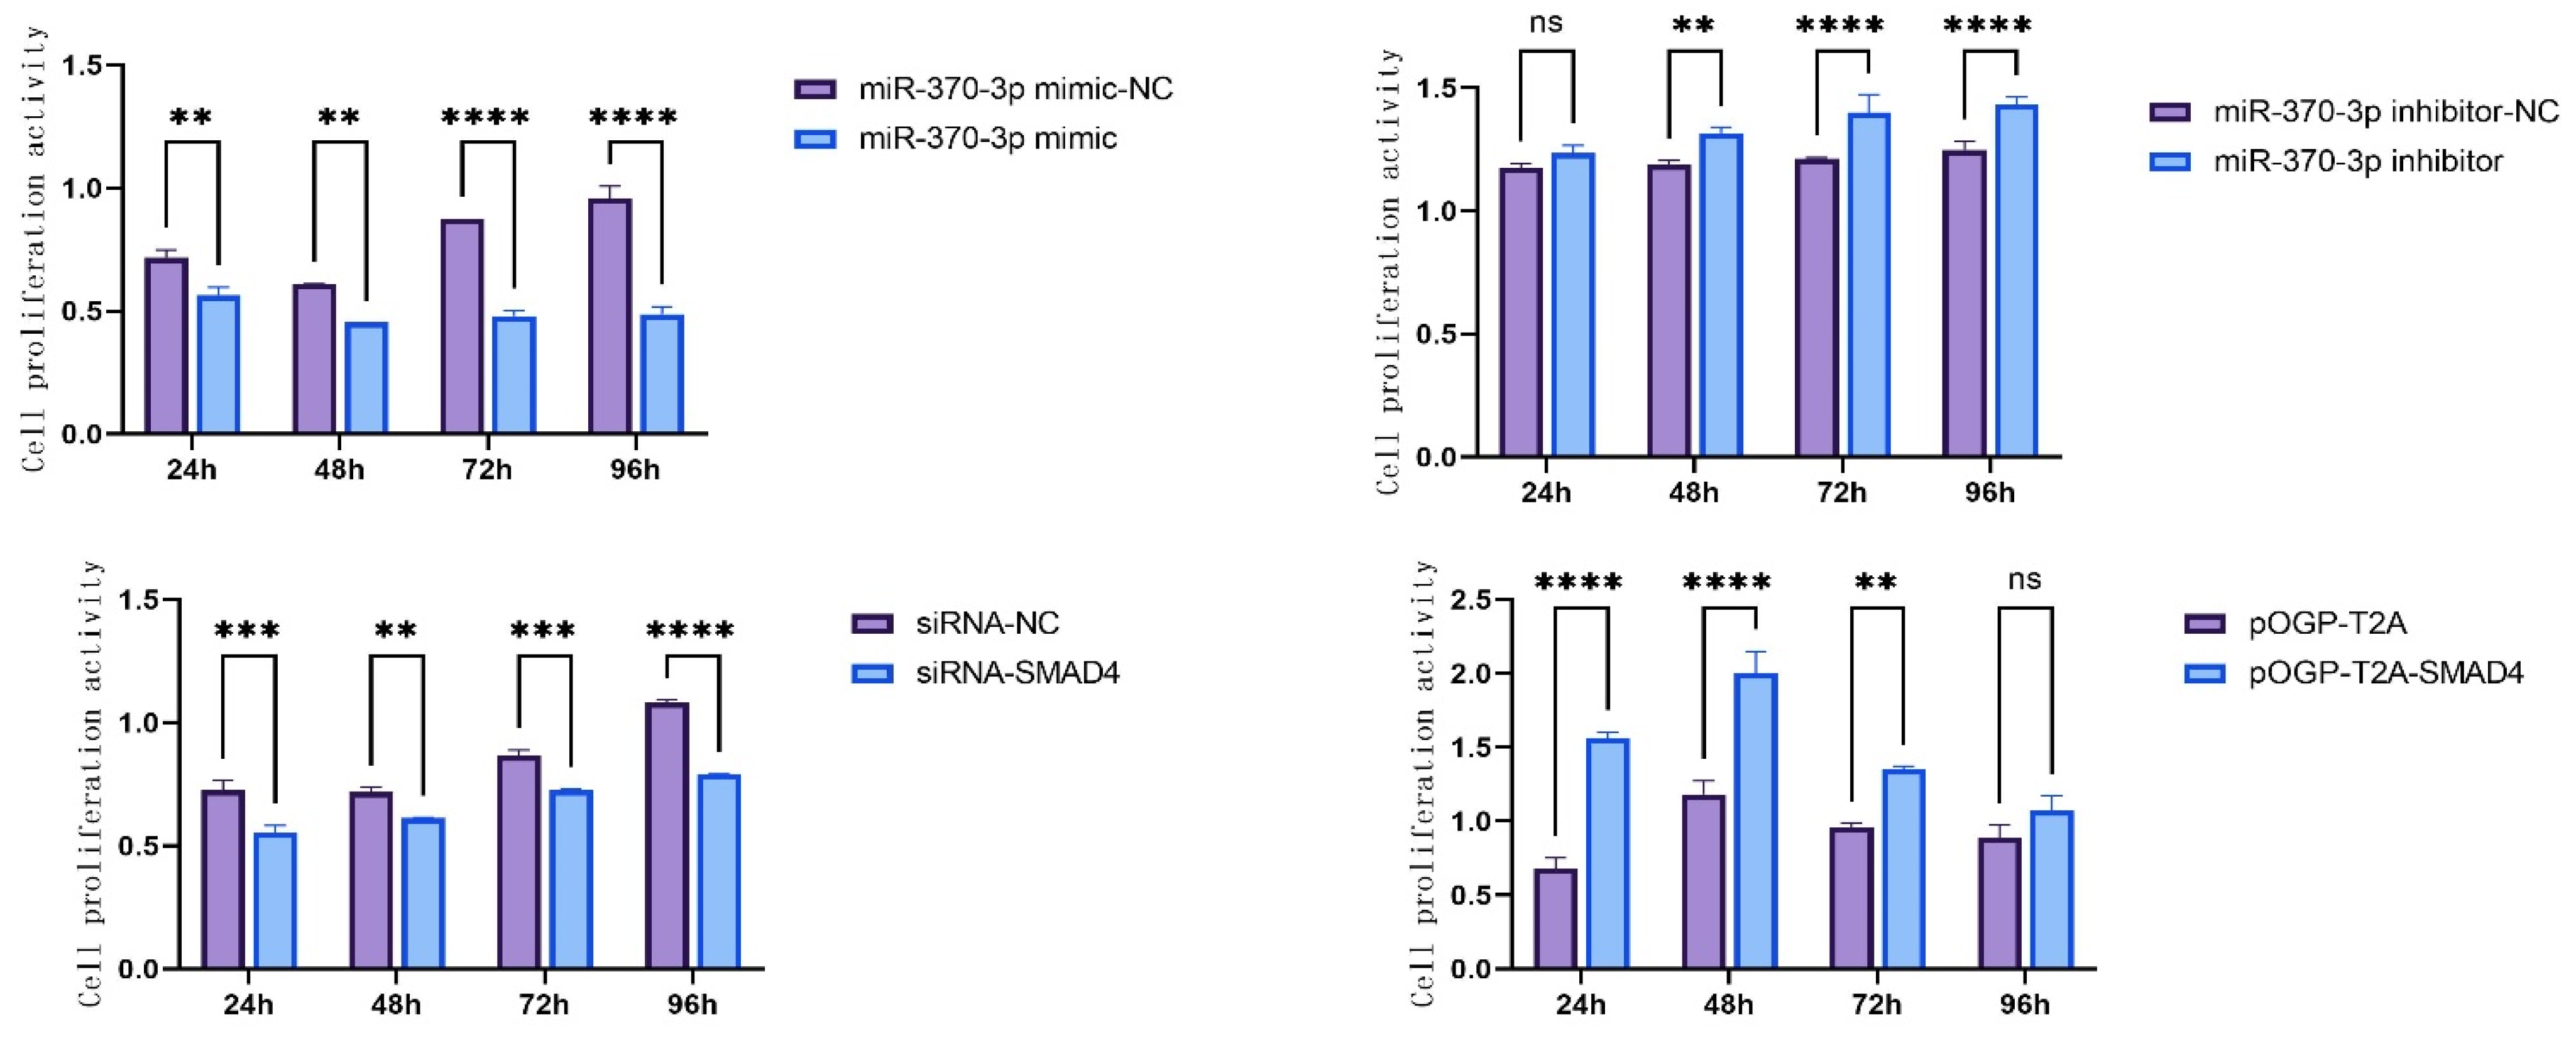
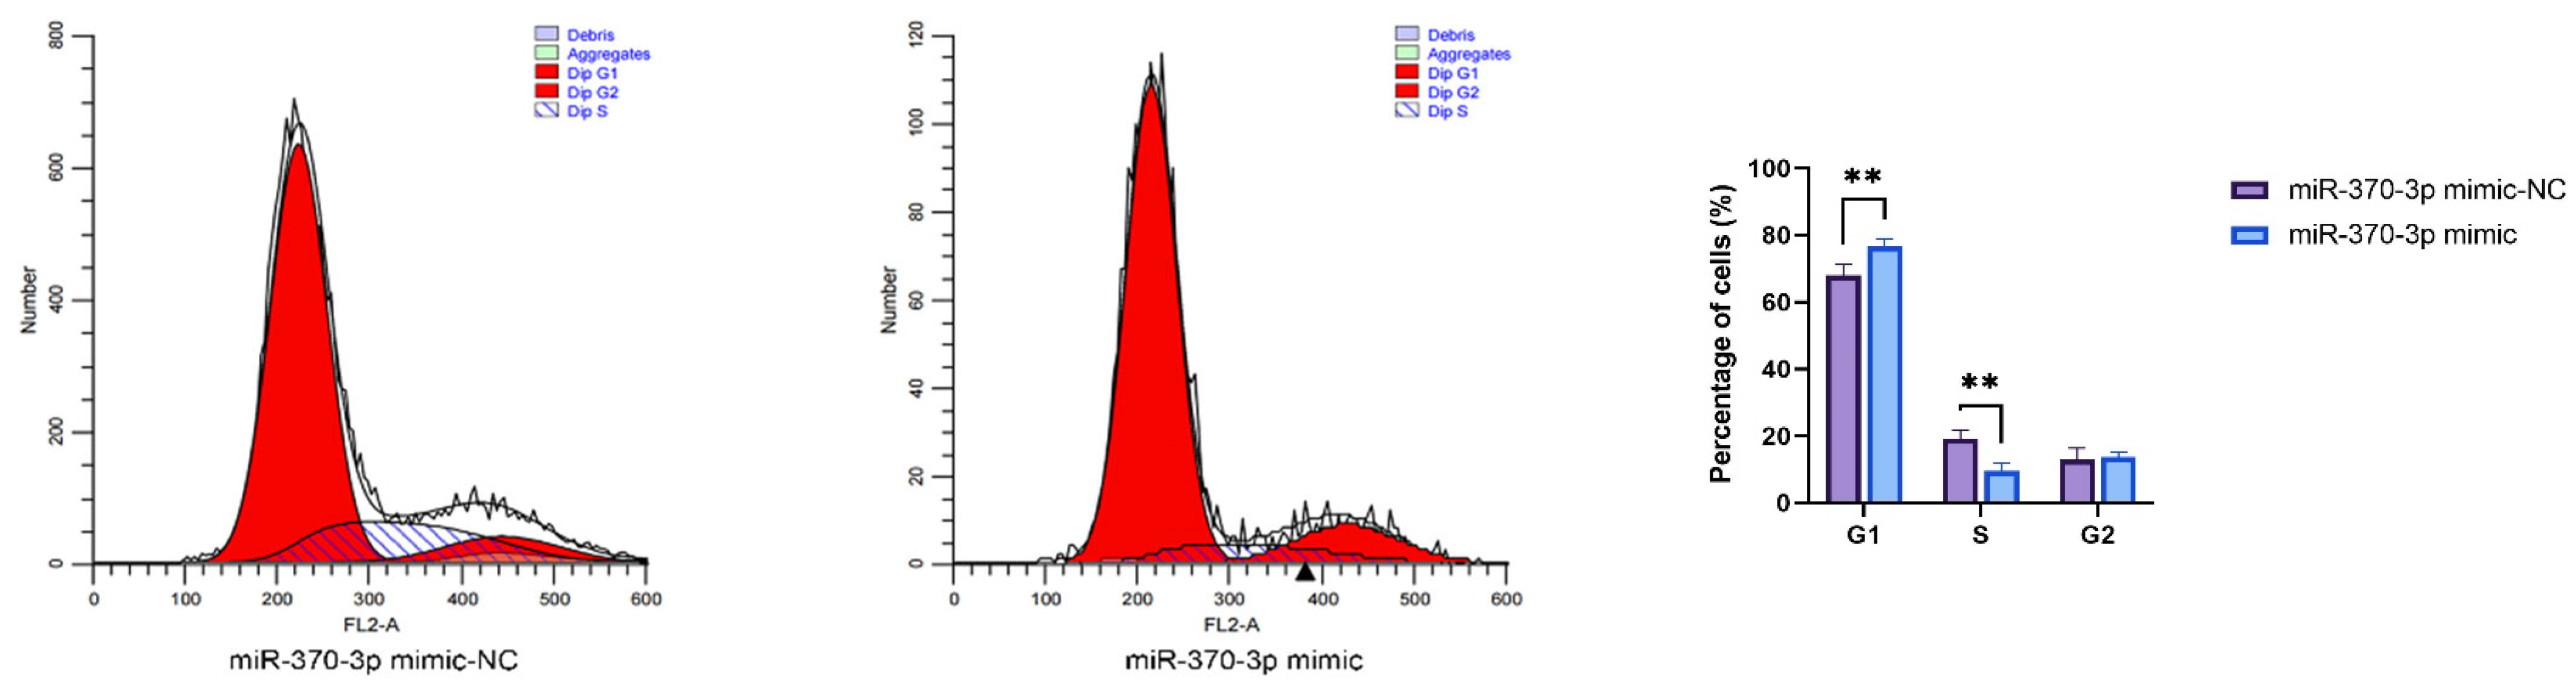
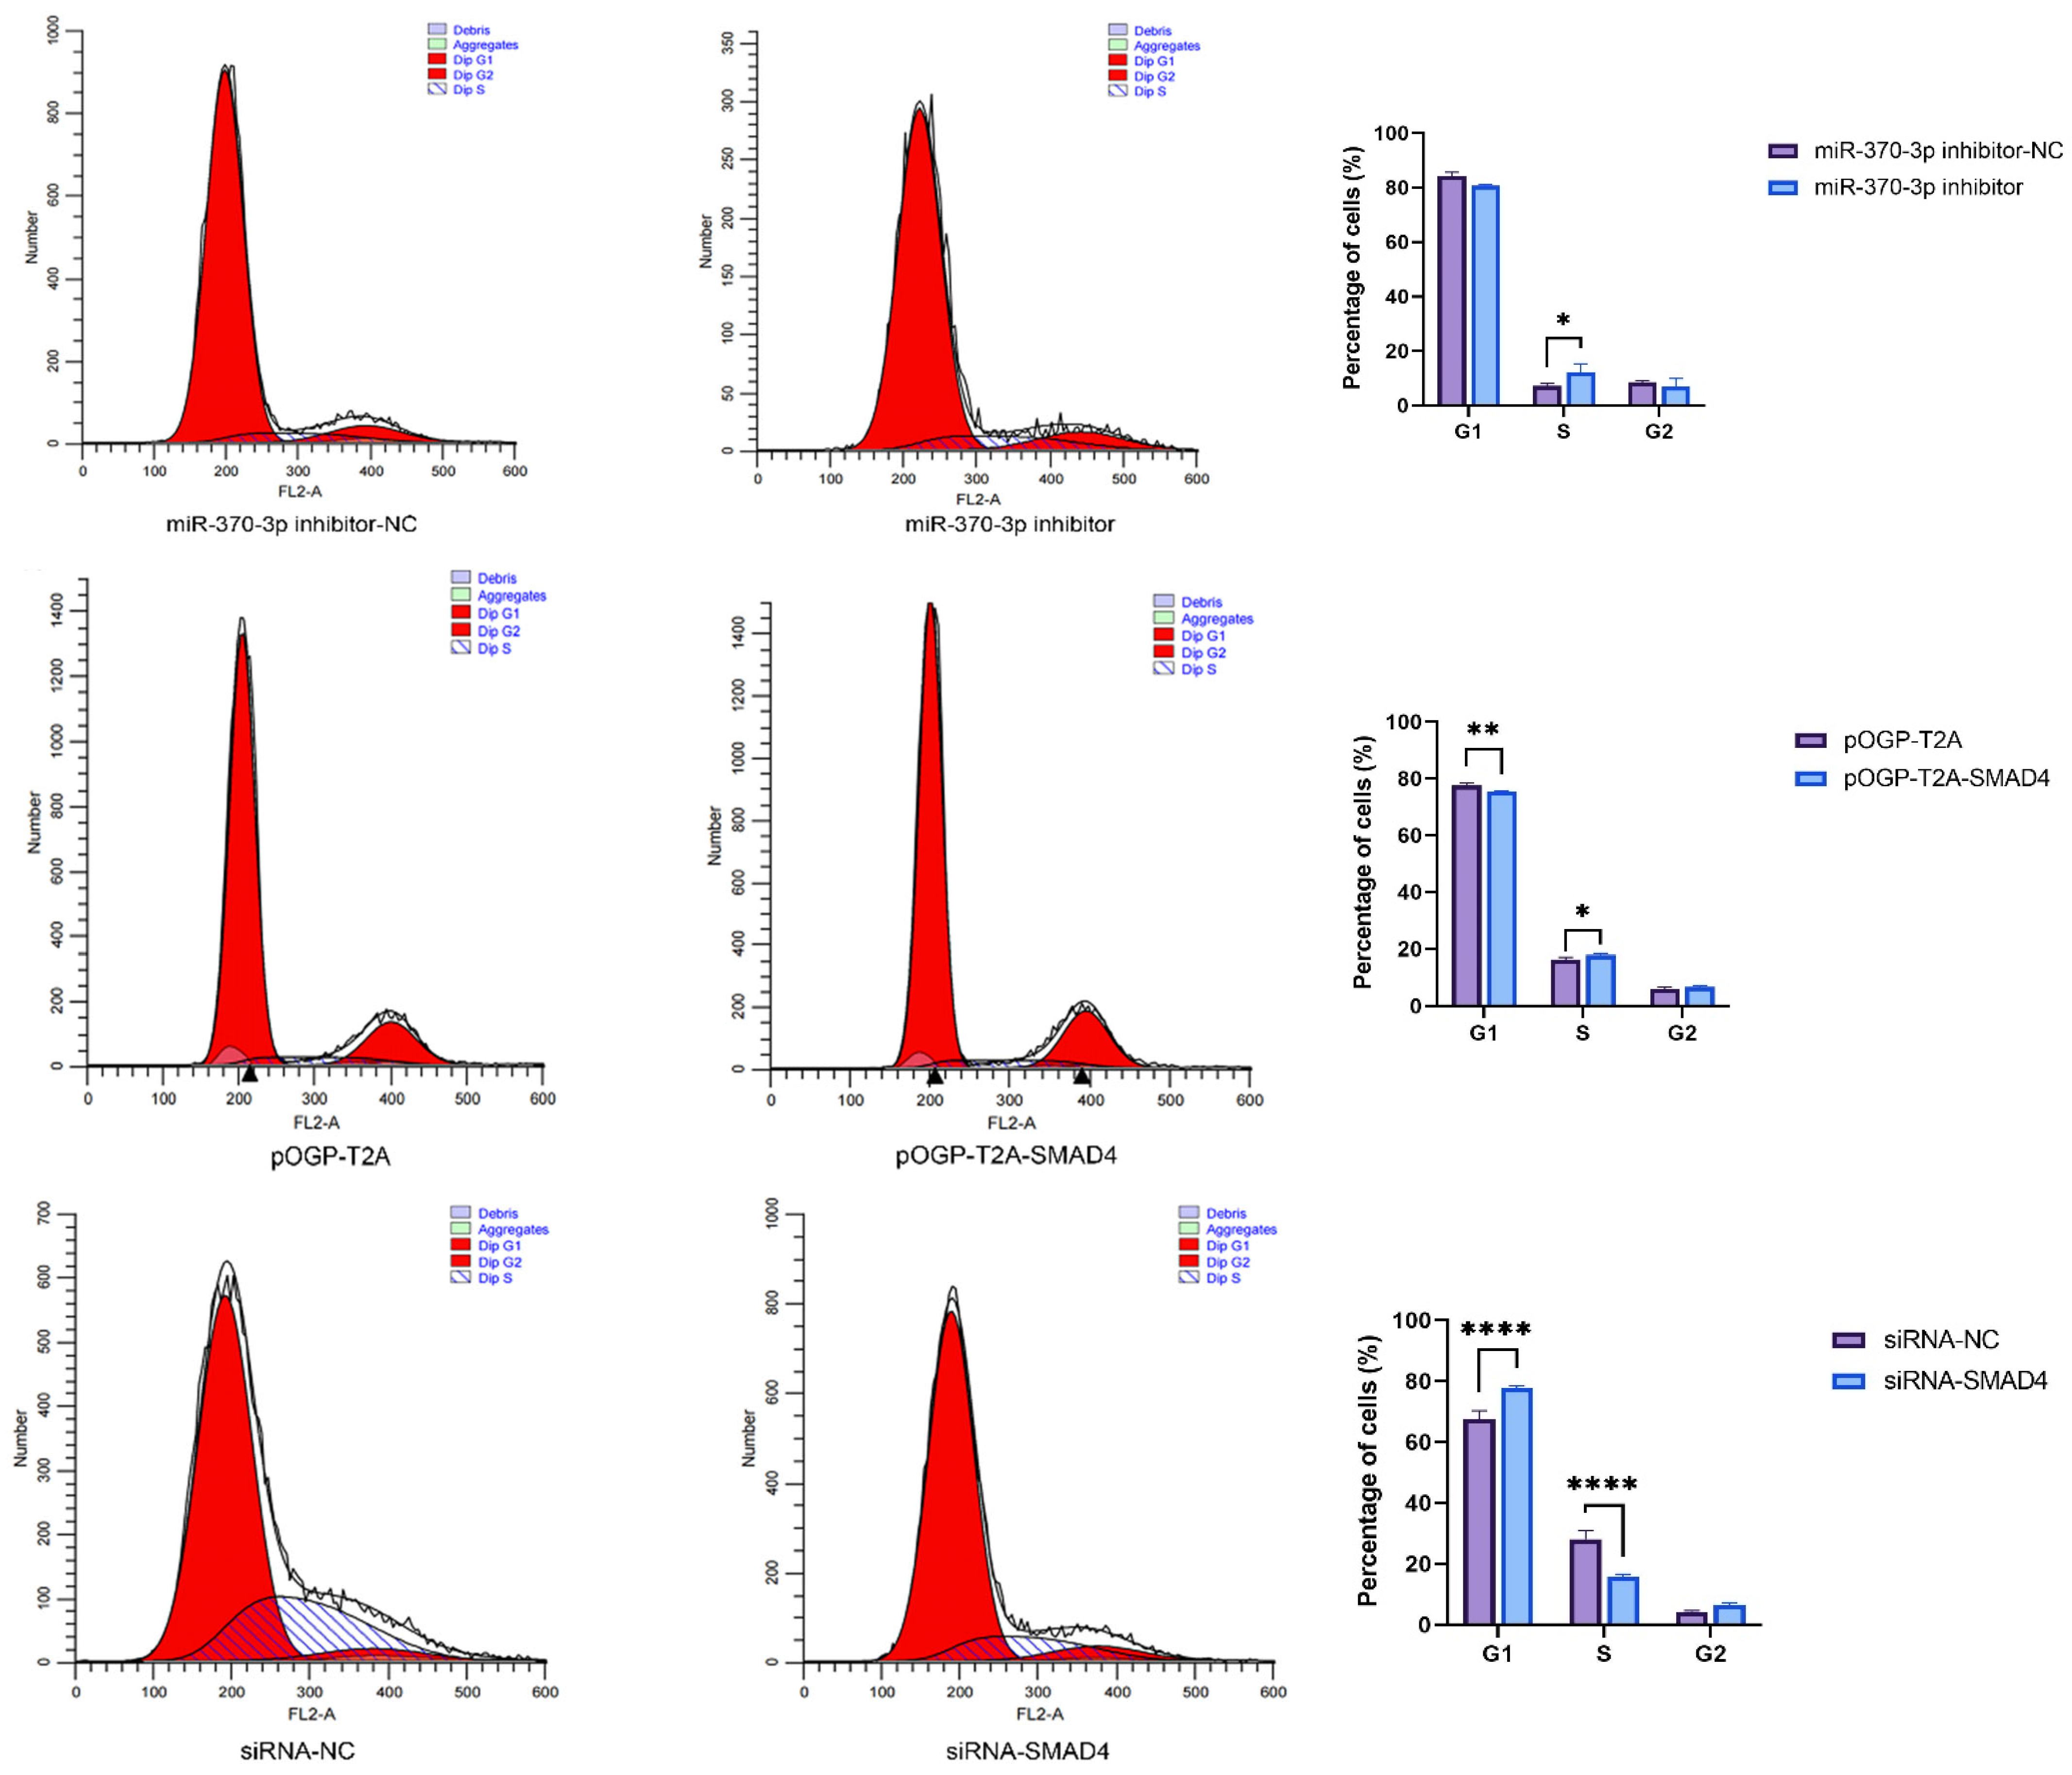
SMAD4. This study utilized CCK-8 assays and flow cytometry to substantiate these hypotheses, demonstrating that miR-370-3p inhibits DPC proliferation and affects the cell cycle, perhaps by regulating related genes, consistent with previous research [32]. Research using Annexin V-FITC and PI dual staining demonstrated that miR-370-3p promotes cellular death. In contrast, SMAD4 affects DPC phenotype differently; it promotes DPC proliferation, inhibits apoptosis, and has a certain effect on the cell cycle. Overall, it is inferred that miR-370-3p participates in regulating DPC cell phenotypes by targeting SMAD4.
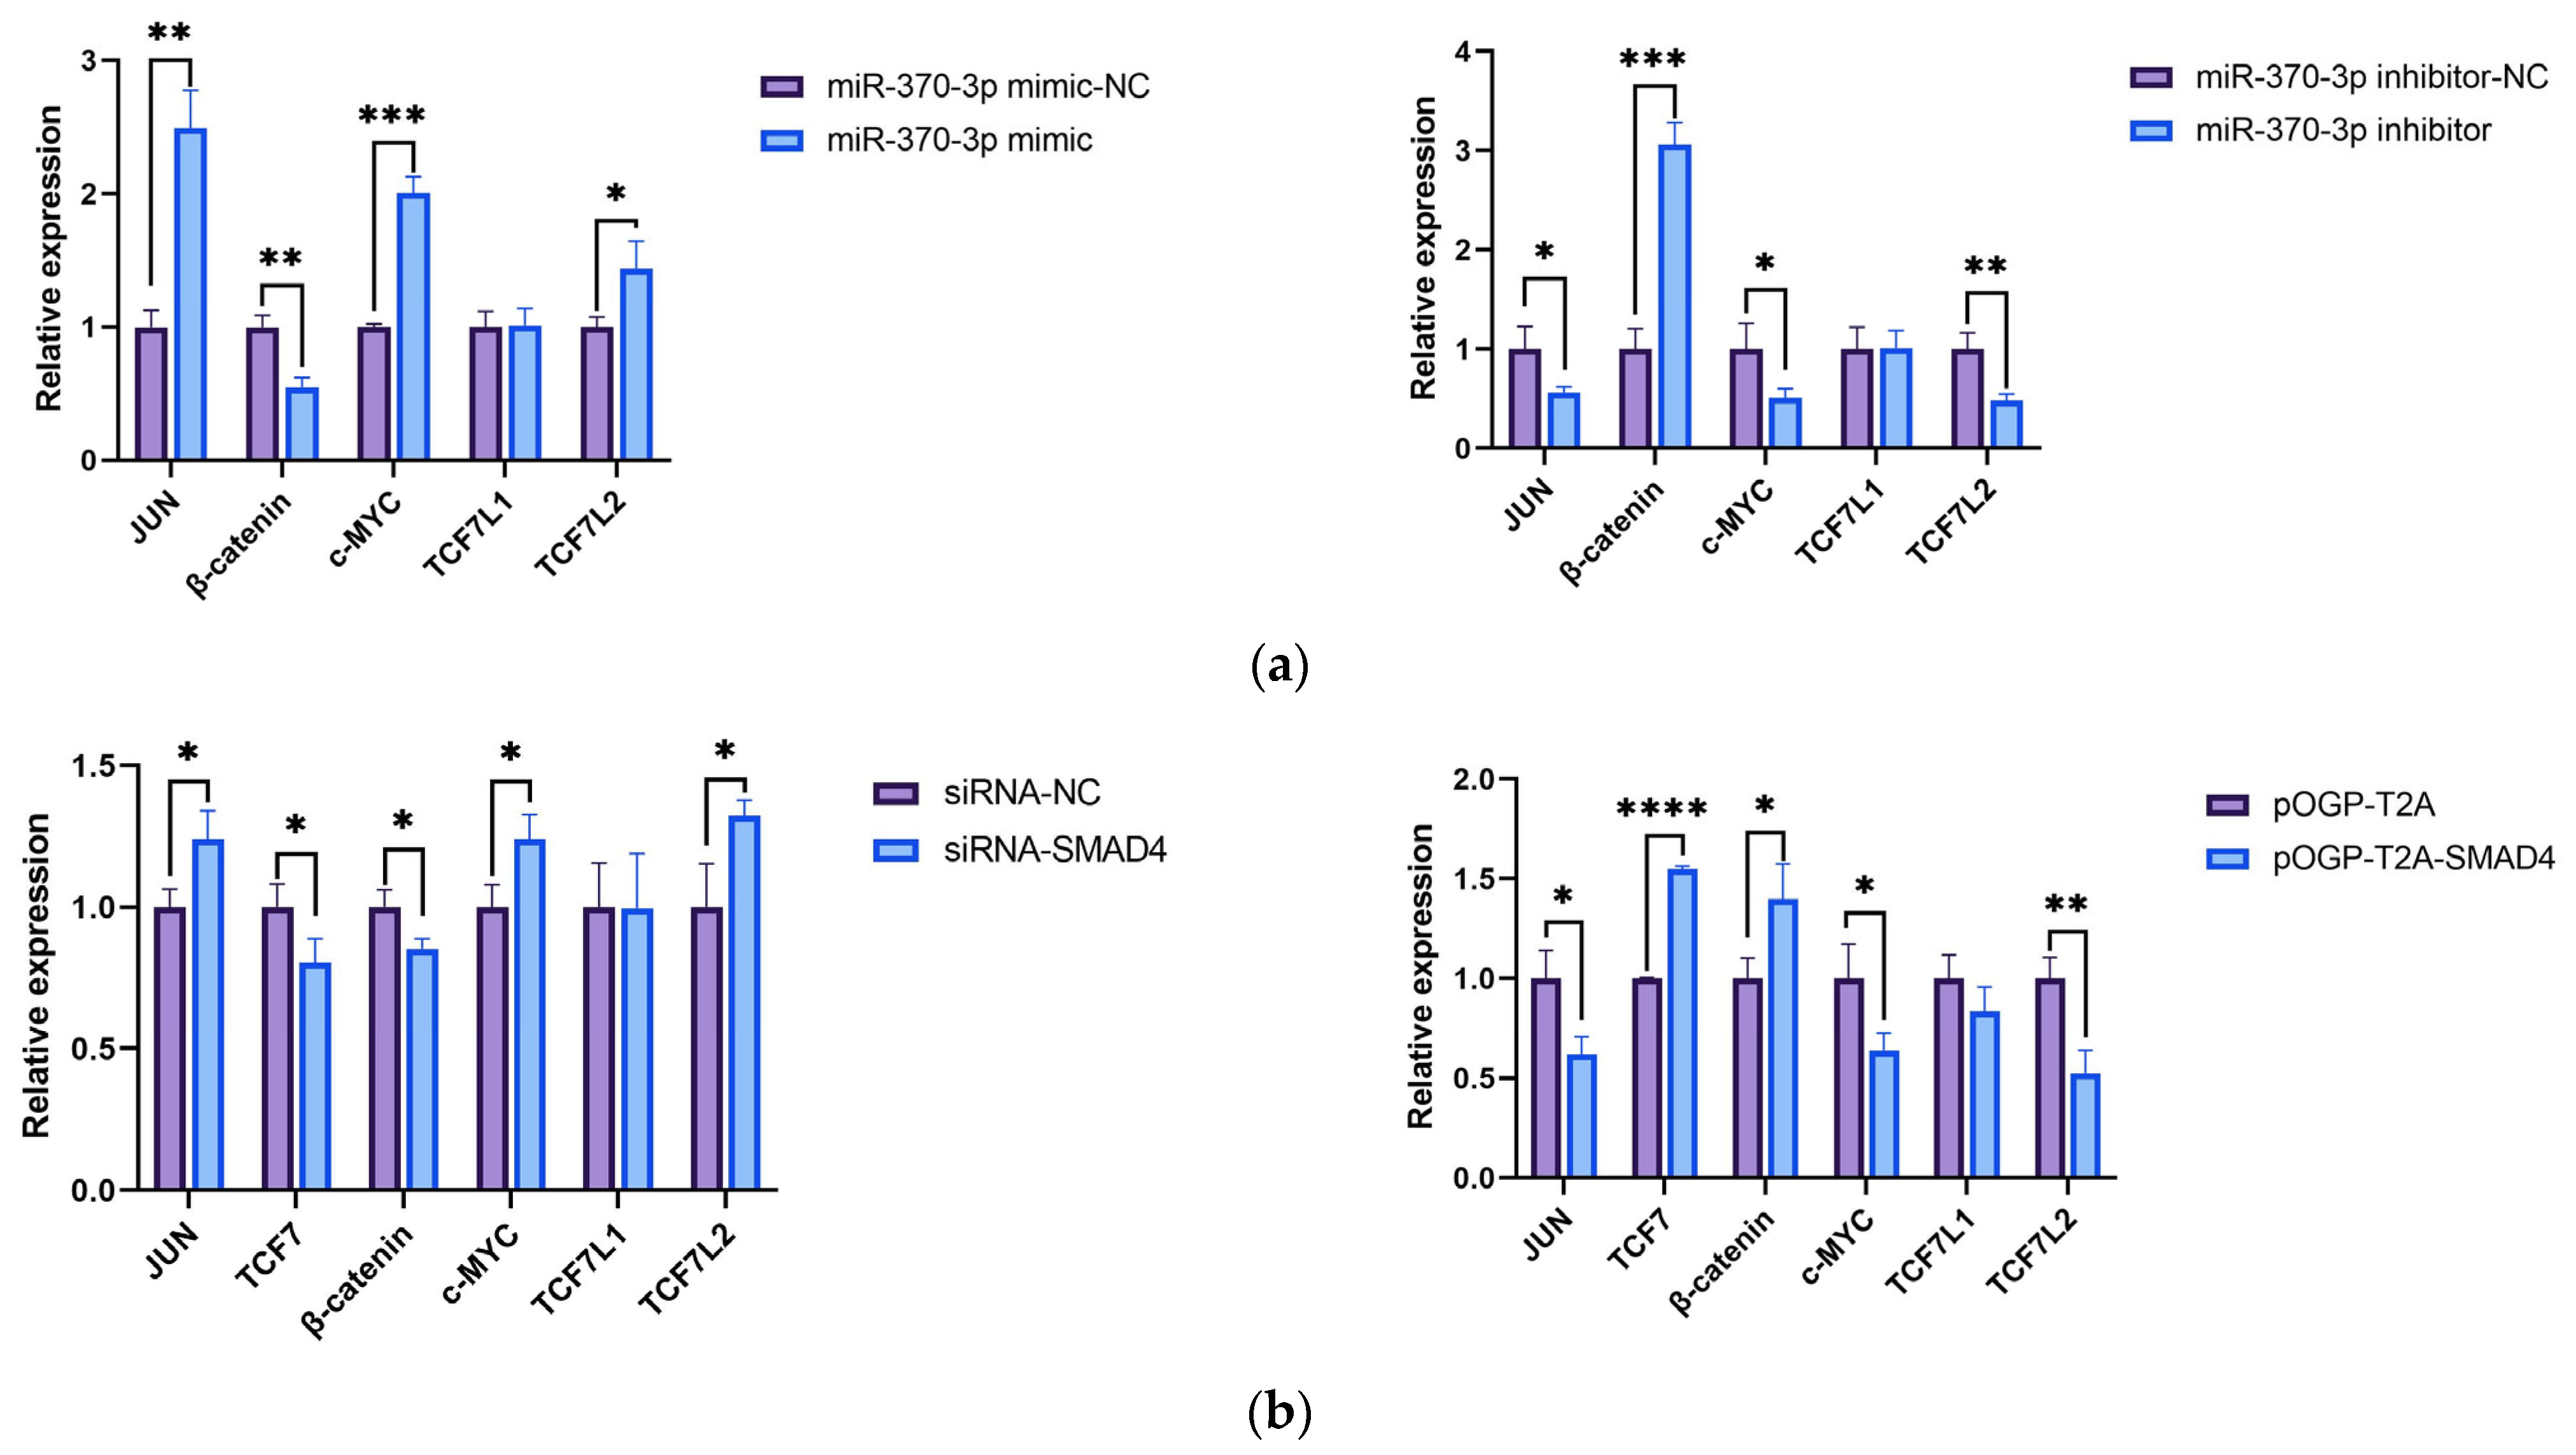
Currently, there is no relevant research on the effects of miR-370-3p and SMAD4 on sheep dermal papilla cells (DPCs). In this study, to explore the molecular mechanism by which miR-370-3p regulates SMAD4 and affects the development and growth of DPCs, the expression levels of relevant genes in DPCs were detected. The results showed that the targeting of SMAD4 by miR-370-3p could affect the expression of relevant genes such as JUN, c-MYC, and 
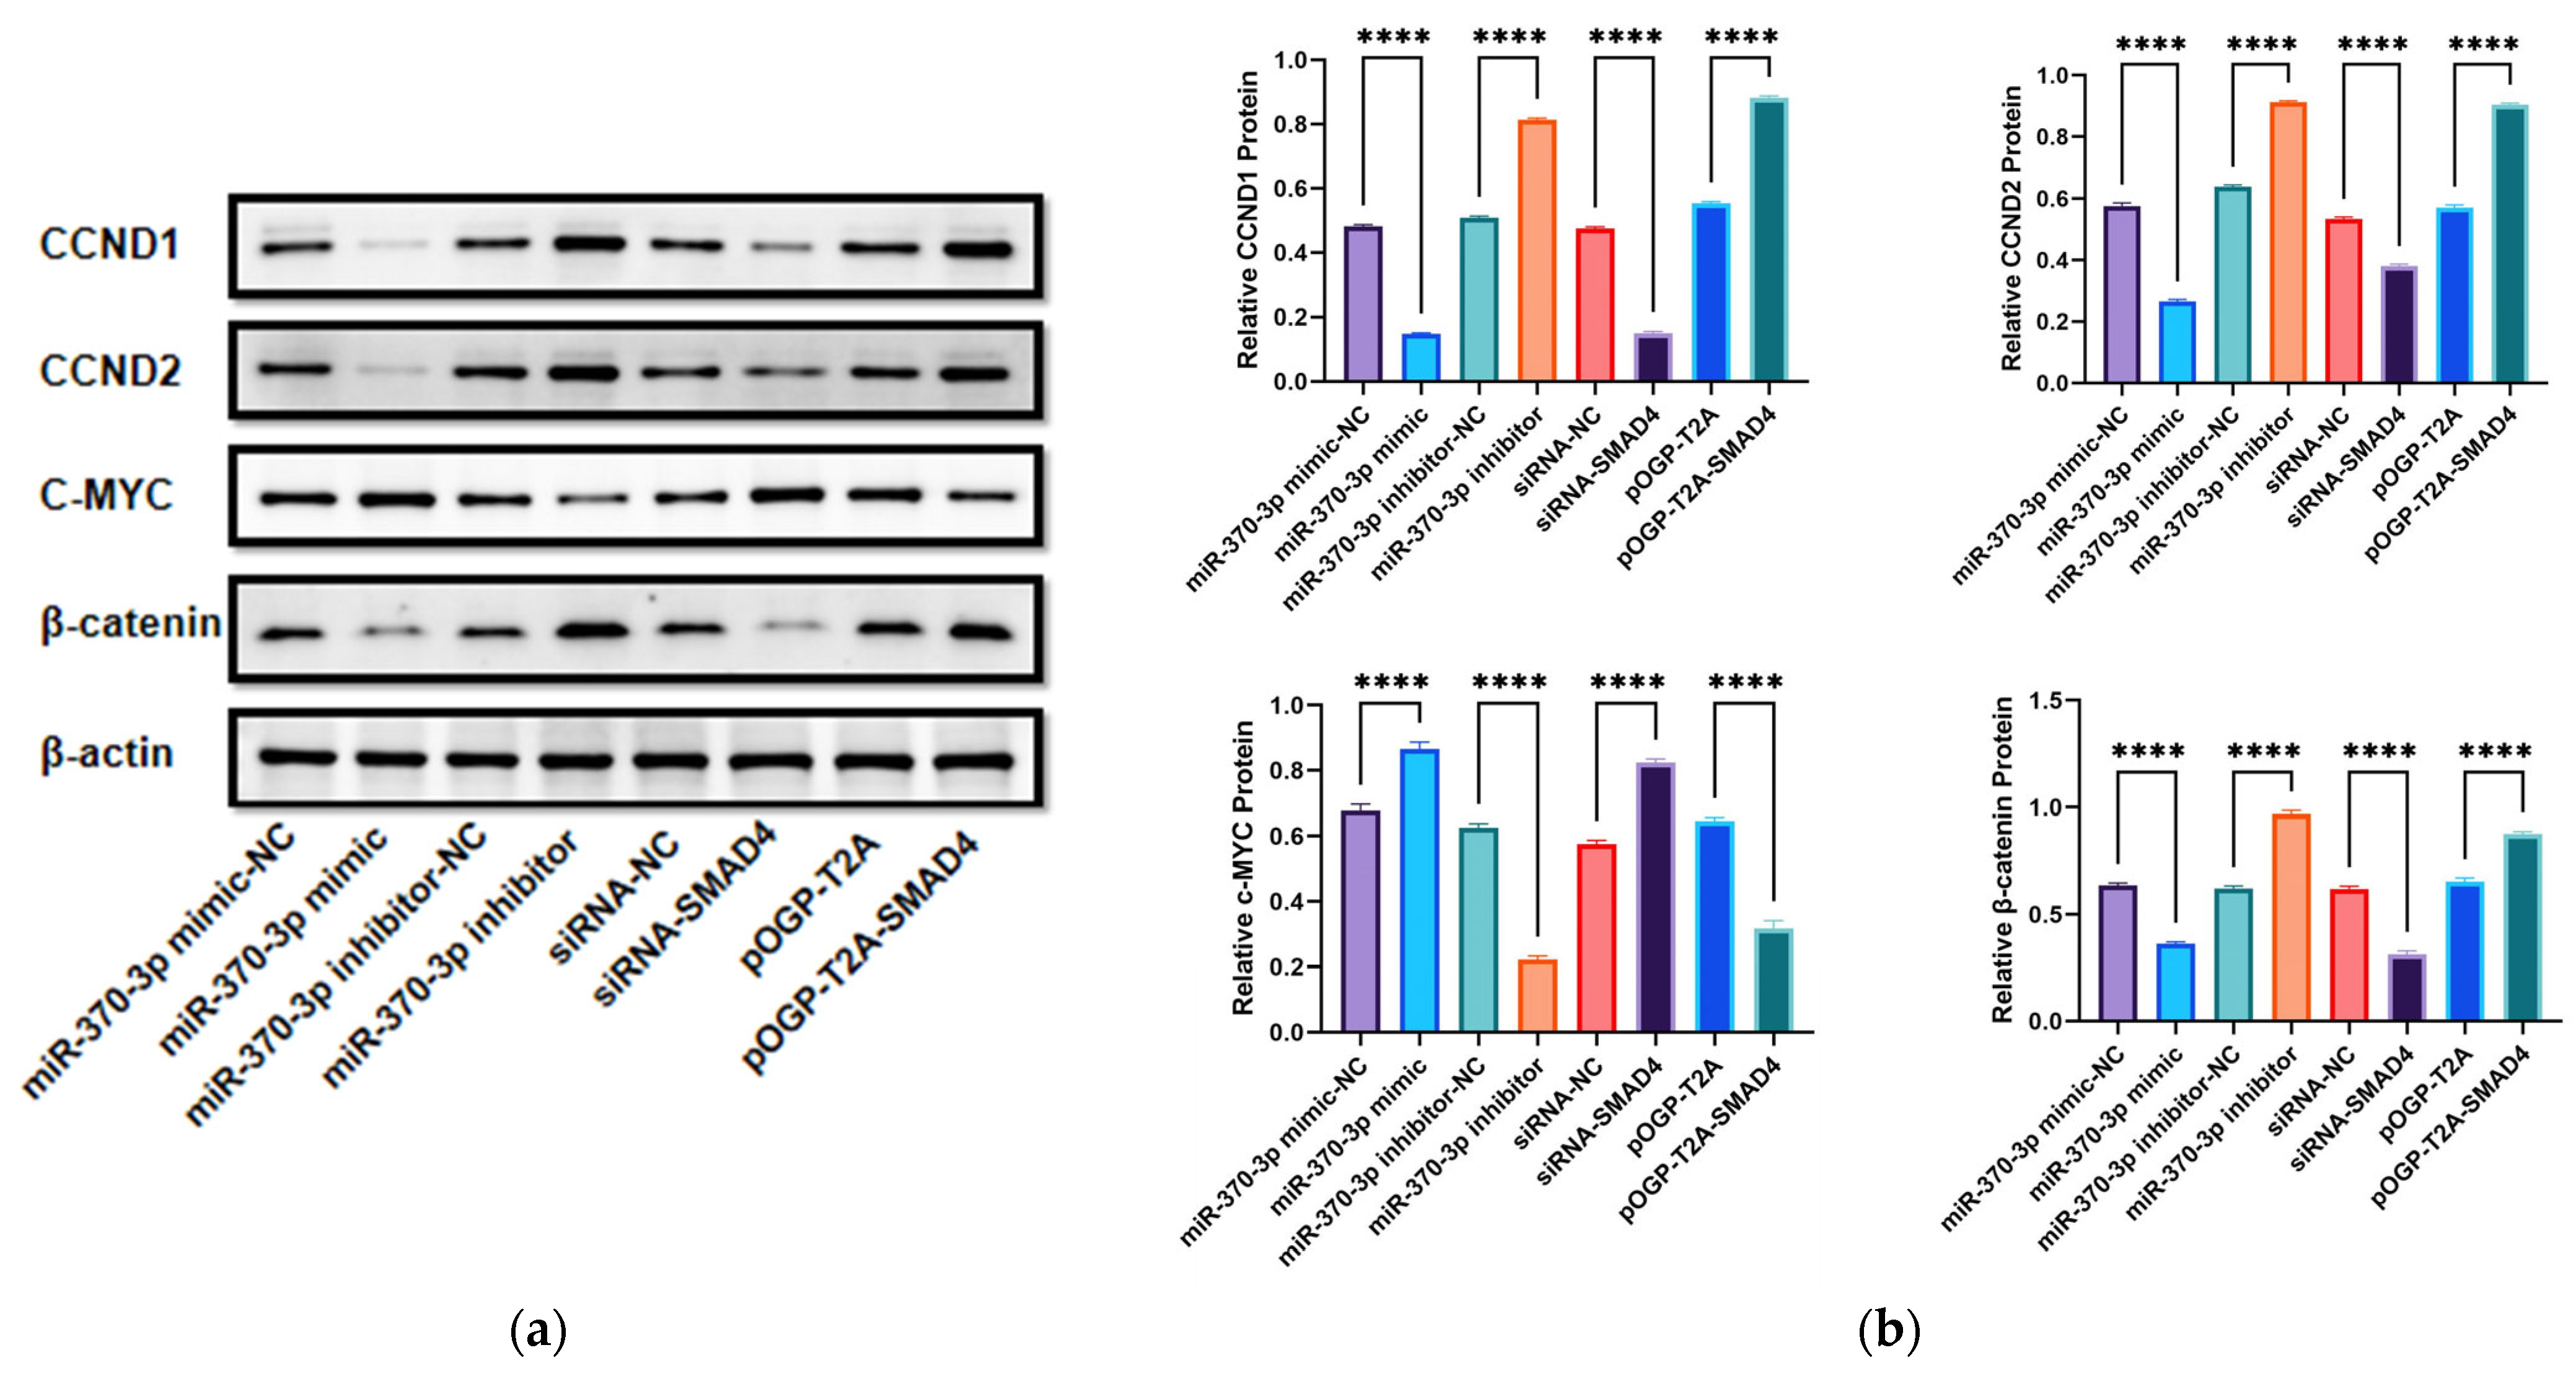
β-catenin. To further validate the results of real-time quantitative polymerase chain reaction (RT-qPCR), we selected several key proteins (cyclin D1 (CCND1), cyclin D2 (CCND2), β-catenin, and c-MYC) for Western blot analysis. The results were consistent with those of RT-qPCR. I would argue that SMAD4 participates in several biological processes in cross-talk with the Wnt/β-catenin pathway [33,34,35,36]. Regarding the phenomenon that SMAD4 affects the expression of the upstream gene β-catenin, we speculated that there might be a negative regulatory mechanism, which needs to be verified in the next stage of our research.

5. Conclusions

In this study, we utilized RT-qPCR to validate the expression profiles of miR-370-3p and SMAD4 in various tissues of two sheep breeds. A luciferase reporter assay confirmed the targeting relationship between miR-370-3p and SMAD4. Immunohistochemistry and PCR verified the expression of SMAD4 in dermal papilla cells (DPCs). Combined with the CCK8 assay and flow cytometry, we examined the cells transfected with plasmids. The results indicated that miR-370-3p inhibited the proliferation of DPCs, whereas SMAD4 promoted DPC proliferation, and both had an impact on the cell cycle. Finally, we employed a real-time quantitative polymerase chain reaction (RT-qPCR) and Western blot to explore the expression of relevant genes in DPCs. The results showed that miR-370-3p influenced the expression of genes such as JUN, c-MYC, and β-catenin. Therefore, miR-370-3p participates in regulating the proliferation, cell cycle progression, and apoptosis of DPCs by targeting and regulating the expression of SMAD4.

Supplementary Materials

The following supporting information can be downloaded at https://www.mdpi.com/article/10.3390/cells14100714/s1; Figure S1: Expression of SMAD4 in DPCs; Figure S2: Uncropped blots for the experiment shown in Figure 4d describing the impact of miR-370-3p on the expression levels of SMAD4 and β-actin protein; Figure S3: Uncropped blots for the experiment shown in Figure 5b,d describing the impact of SMAD4 on the expression levels of SMAD4 and β-actin protein; Figure S4: Uncropped blots for the experiment shown in Figure 11a describing the expression levels of CCND1, CCND2,C-MYC, β-catenin, β-actin protein.

Author Contributions

D.W. and J.F. conceptualized and devised the experiments; D.W. and W.L. conducted the experiments; C.Z., H.L., J.C. and S.J. investigated and provided the software; Y.Q. and J.F. conducted a data analysis; J.F. and D.W. authored the text. F.S. and L.Z. amended the text. All writers reviewed and endorsed the final article. All authors have read and agreed to the published version of the manuscript.

Funding

This study received funding from the National Natural Science Foundation of China (Grant No. 32060781) and the Jilin Provincial Department of Education Foundation Program (Grant No. JJKH20220543KJ).

Institutional Review Board Statement

All animal care and procedures adhered to institutional and national requirements and received approval from the Institutional Animal Care and Use Committee of the Science and Technology Ethics Review Committee of Jilin Academy of Agricultural Sciences (China)(JNK20210901001, 11 September 2021).

Informed Consent Statement

Not applicable.

Data Availability Statement

All datasets utilized and/or examined in this investigation are accessible from the relevant author upon reasonable request.

Acknowledgments

We would like to thank the Jilin Academy of Agricultural Sciences and Yanbian University for supporting this study.

Conflicts of Interest

The authors declare no conflicts of interest.

Abbreviations

3′-UTRs3′-untranslated regions
ANOVAAnalysis of variance
miRNAsmicroRNAs
PBSPhosphate-buffered saline
PVDFPolyvinylidene difluoride
RT-qPCRQuantitative real-time PCR
SDS-PAGESodium dodecyl sulphate-polyacrylamide gel electrophoresis

References

  1. Peterson, A.; Nair, L.S. Hair Follicle Stem Cells for Tissue Regeneration. Tissue Eng. Part B Rev. 2022, 28, 695–706. [Google Scholar] [CrossRef] [PubMed]
  2. Lin, X.; Zhu, L.; He, J. Morphogenesis, Growth Cycle and Molecular Regulation of Hair Follicles. Front. Cell Dev. Biol. 2022, 10, 899095. [Google Scholar] [CrossRef] [PubMed]
  3. Mardaryev, A.N.; Ahmed, M.I.; Vlahov, N.V.; Fessing, M.Y.; Gill, J.H.; Sharov, A.A.; Botchkareva, N.V. Micro-RNA-31 controls hair cycle-associated changes in gene expression programs of the skin and hair follicle. FASEB J. 2010, 24, 3869–3881. [Google Scholar] [CrossRef]
  4. Bartel, D.P. MicroRNAs: Target recognition and regulatory functions. Cell 2009, 136, 215–233. [Google Scholar] [CrossRef]
  5. Yan, S.; Jiao, K. Functions of miRNAs during Mammalian Heart Development. Int. J. Mol. Sci. 2016, 17, 789. [Google Scholar] [CrossRef]
  6. Cao, L.; Tian, T.; Huang, Y.; Tao, S.; Zhu, X.; Yang, M.; Gu, J.; Feng, G.; Ma, Y.; Xia, R.; et al. Neural progenitor cell-derived nanovesicles promote hair follicle growth via miR-100. J. Nanobiotechnology 2021, 19, 20. [Google Scholar] [CrossRef]
  7. Zhao, B.; Chen, Y.; Yang, N.; Chen, Q.; Bao, Z.; Liu, M.; Hu, S.; Li, J.; Wu, X. miR-218-5p regulates skin and hair follicle development through Wnt/β-catenin signaling pathway by targeting SFRP2. J. Cell. Physiol. 2019, 234, 20329–20341. [Google Scholar] [CrossRef]
  8. Calvo-Sánchez, M.I.; Fernández-Martos, S.; Carrasco, E.; Moreno-Bueno, G.; Bernabéu, C.; Quintanilla, M.; Espada, J. A role for the Tgf-β/Bmp co-receptor Endoglin in the molecular oscillator that regulates the hair follicle cycle. J. Mol. Cell Biol. 2019, 11, 39–52. [Google Scholar] [CrossRef]
  9. Owens, P.; Bazzi, H.; Engelking, E.; Han, G.; Christiano, A.M.; Wang, X.J. SMAD4-dependent desmoglein-4 expression contributes to hair follicle integrity. Dev. Biol. 2008, 322, 156–166. [Google Scholar] [CrossRef]
  10. Owens, P.; Han, G.; Li, A.G.; Wang, X.J. The role of Smads in skin development. J. Investig. Dermatol. 2008, 128, 783–790. [Google Scholar] [CrossRef]
  11. Yang, L.; Wang, L.; Yang, X. Disruption of SMAD4 in mouse epidermis leads to depletion of follicle stem cells. Mol. Biol. Cell 2009, 20, 882–890. [Google Scholar] [CrossRef] [PubMed]
  12. Luo, Z.; Dou, J.; Xie, F.; Lu, J.; Han, Q.; Zhou, X.; Kong, J.; Chen, D.; Liu, A. miR-203a-3p promotes loureirin A-induced hair follicle stem cells differentiation by targeting Smad1. Anat. Rec. Hoboken 2021, 304, 531–540. [Google Scholar] [CrossRef] [PubMed]
  13. Li, J.; Zhao, B.; Yao, S.; Dai, Y.; Zhang, X.; Yang, N.; Bao, Z.; Cai, J.; Chen, Y.; Wu, X. Dermal PapillaCell-Derived Exosomes Regulate Hair Follicle Stem Cell Proliferation via LEF1. Int. J. Mol. Sci. 2023, 24, 3961. [Google Scholar] [CrossRef] [PubMed]
  14. Rendl, M.; Lewis, L.; Fuchs, E. Molecular dissection of mesenchymal-epithelial interactions in the hair follicle. PLoS Biol. 2005, 3, e331. [Google Scholar] [CrossRef]
  15. Inui, M.; Martello, G.; Piccolo, S. MicroRNA control of signal transduction. Nat. Rev. Mol. Cell Biol. 2010, 11, 252–263. [Google Scholar] [CrossRef]
  16. Huntzinger, E.; Izaurralde, E. Gene silencing by microRNAs: Contributions of translational repression and mRNA decay. Nat. Rev. Genet. 2011, 12, 99–110. [Google Scholar] [CrossRef]
  17. Long, X.; Wang, D.G.; Wu, Z.B.; Liao, Z.M.; Xu, J.J. Circular RNA hsa_circ_0004689 (circSWT1) promotes NSCLC progression via the miR-370-3p/SNAIL axis by inducing cell epithelial-mesenchymal transition (EMT). Cancer Med. 2023, 12, 8289–8305. [Google Scholar] [CrossRef]
  18. Wang, P.; Zhang, H.; Zhao, W.; Dai, N. Silencing of long non-coding RNA KCNQ1OT1 alleviates LPS-induced lung injury by regulating the miR-370-3p/FOXM1 axis in childhood pneumonia. BMC Pulm. Med. 2021, 21, 247. [Google Scholar] [CrossRef]
  19. Yanni, J.; D’Souza, A.; Wang, Y.; Li, N.; Hansen, B.J.; Zakharkin, S.O.; Smith, M.; Hayward, C.; Whitson, B.A.; Mohler, P.J.; et al. Silencing miR-370-3p rescues funny current and sinus node function in heart failure. Sci. Rep. 2020, 10, 11279. [Google Scholar] [CrossRef]
  20. Jia, C.; Chen, F.; Li, W.; Zhu, X.; Wang, Y.; Guo, H.; Xi, H. CircCCNB1 Knockdown Blocks the Progression of Cervical Cancer by Acting as Competing Endogenous RNA in the miR-370-3p/SOX4 Pathway. Ann. Clin. Lab. Sci. 2023, 53, 94–105. [Google Scholar]
  21. Ma, H.; Qu, S.; Zhai, Y.; Yang, X. circ_0025033 promotes ovarian cancer development via regulating the hsa_miR-370-3p/SLC1A5 axis. Cell. Mol. Biol. Lett. 2022, 27, 94. [Google Scholar] [CrossRef] [PubMed]
  22. Li, B.; Chen, J.; Wu, Y.; Luo, H.; Ke, Y. Decrease of circARID1A retards glioblastoma invasion by modulating miR-370-3p/ TGFBR2 pathway. Int. J. Biol. Sci. 2022, 18, 5123–5135. [Google Scholar] [CrossRef] [PubMed]
  23. Bao, Z.; Zhao, B.; Hu, S.; Yang, N.; Liu, M.; Li, J.; Liang, S.; Zhou, T.; Chen, Y.; Wu, X. Characterization and functional analysis of SMAD2 regulation in hair follicle cycle in Angora rabbits. Gene 2021, 770, 145339. [Google Scholar] [CrossRef]
  24. Nan, W.; Li, G.; Si, H.; Lou, Y.; Wang, D.; Guo, R.; Zhang, H. All-trans-retinoic acid inhibits mink hair follicle growth via inhibiting proliferation and inducing apoptosis of dermal papilla cells through TGF-β2/Smad2/3 pathway. Acta Histochem. 2020, 122, 151603. [Google Scholar] [CrossRef]
  25. Han, G.; Li, A.G.; Liang, Y.Y.; Owens, P.; He, W.; Lu, S.; Yoshimatsu, Y.; Wang, D.; Ten Dijke, P.; Lin, X.; et al. Smad7-induced beta-catenin degradation alters epidermal appendage development. Dev. Cell 2006, 11, 301–312. [Google Scholar] [CrossRef]
  26. Li, Z.; Ryu, S.W.; Lee, J.; Choi, K.; Kim, S.; Choi, C. Protopanaxatirol type ginsenoside Re promotes cyclic growth of hair follicles via inhibiting transforming growth factor β signaling cascades. Biochem. Biophys. Res. Commun. 2016, 470, 924–929. [Google Scholar] [CrossRef]
  27. Yuan, C.; Jiao, L.; Yang, L.; Ying, W.; Hu, Z.; Liu, J.; Cui, F.; Li, L.; Qian, L.; Teng, Y.; et al. The up-regulation of 14-3-3 proteins in SMAD4 deficient epidermis and hair follicles at catagen. Proteomics 2008, 8, 2230–2243. [Google Scholar] [CrossRef]
  28. Yang, L.; Mao, C.; Teng, Y.; Li, W.; Zhang, J.; Cheng, X.; Li, X.; Han, X.; Xia, Z.; Deng, H.; et al. Targeted disruption of SMAD4 in mouse epidermis results in failure of hair follicle cycling and formation of skin tumors. Cancer Res. 2005, 65, 8671–8678. [Google Scholar] [CrossRef]
  29. Park, D.S.; Yoon, G.H.; Kim, E.Y.; Lee, T.; Kim, K.; Lee, P.C.; Chang, E.J.; Choi, S.C. Wip1 regulates SMAD4 phosphorylation and inhibits TGF-β signaling. EMBO Rep. 2020, 21, e48693. [Google Scholar] [CrossRef]
  30. Wang, Z.; Zhao, X.; Ma, Z.; Liu, L.; Wang, B.; Li, Y. WITHDRAWN: Modulation on gallbladder carcinoma by TGF-β1 via IGFBP-2. Cancer Biomark. 2018. [Google Scholar] [CrossRef]
  31. Gomes, T.; Martin-Malpartida, P.; Ruiz, L.; Aragón, E.; Cordeiro, T.N.; Macias, M.J. Conformational landscape of multidomain SMAD proteins. Comput. Struct. Biotechnol. J. 2021, 19, 5210–5224. [Google Scholar] [CrossRef] [PubMed]
  32. Hai, E.; Han, W.; Wu, Z.; Ma, R.; Shang, F.; Wang, M.; Liang, L.; Rong, Y.; Pan, J.; Wang, Z.; et al. Chi-miR-370-3p regulates hair follicle morphogenesis of Inner Mongolian cashmere goats. G3 Bethesda 2021, 11, jkab091. [Google Scholar] [CrossRef] [PubMed]
  33. Du, X.; Li, Q.; Yang, L.; Liu, L.; Cao, Q.; Li, Q. SMAD4 activates Wnt signaling pathway to inhibit granulosa cell apoptosis. Cell Death Dis. 2020, 11, 373. [Google Scholar] [CrossRef]
  34. Lanauze, C.B.; Sehgal, P.; Hayer, K.; Torres-Diz, M.; Pippin, J.A.; Grant, S.F.A.; Thomas-Tikhonenko, A. Colorectal Cancer-Associated SMAD4 R361 Hotspot Mutations Boost Wnt/β-Catenin Signaling through Enhanced SMAD4-LEF1 Binding. Mol. Cancer Res. 2021, 19, 823–833. [Google Scholar] [CrossRef]
  35. McCarthy, S.S.; Karolak, M.; Oxburgh, L. SMAD4 controls proliferation of interstitial cells in the neonatal kidney. Development 2022, 149, dev199984. [Google Scholar] [CrossRef]
  36. Voorneveld, P.W.; Kodach, L.L.; Jacobs, R.J.; van Noesel, C.J.; Peppelenbosch, M.P.; Korkmaz, K.S.; Molendijk, I.; Dekker, E.; Morreau, H.; van Pelt, G.W.; et al. The BMP pathway either enhances or inhibits the Wnt pathway depending on the SMAD4 and p53 status in CRC. Br. J. Cancer 2015, 112, 122–130. [Google Scholar] [CrossRef]
Figure 1. The expression patterns and spatiotemporal distribution of miR-370-3p and SMAD4 in several tissues of Xinji fine-wool sheep and Small-tail Han sheep. (a) Distribution of miR-370-3p in various tissues of Xinji fine-wool sheep and Small-tail Han sheep. (b) Distribution of SMAD4 mRNA in various tissues of Xinji fine-wool sheep and Small-tail Han sheep. (c) Expression levels of miR-370-3p in skin tissues across several sheep breeds at multiple time intervals. (d) Quantification of SMAD4 expression levels in skin tissues across several sheep breeds at multiple time intervals. STH: Small-tail Han sheep; SM: Xinji fine-wool sheep; anagen: growing phase; telogen: resting phase. Data are shown as mean ± SD (n = 3). Comparisons within the same breed across several tissues: distinct superscript letters denote significant changes (p < 0.05); identical superscript letters signify no significant differences (p > 0.05). Comparative analysis of the same tissue across several breeds: * p < 0.05, ** p < 0.01, *** p < 0.001, **** p < 0.0001, ns: not significant.
Cells 14 00714 g001
Figure 2. Localization of SMAD4 in skin tissues and its expression in DPCs. (a) The cross-section of tissue from the skin from Xinji fine-wool sheep. (b) Cross-section of skin tissue from Small-tail Han sheep. (c) Longitudinal slice of dermal tissue from Xinji fine-wool sheep. (d) Longitudinal slice of dermal tissue from Small-tail Han sheep. 1—Connective tissue sheath; 2—Outer root sheath; 3—Hair cortex; 4—Hair bulb; 5—Dermal sheath. (e) Expression of SMAD4 in DPCs. M D2000 DNA Marker; SMAD4-RT SMAD4 gene PCR amplification product; NC negative control.
Cells 14 00714 g002
Figure 3. Network Interaction Analysis for miR-370-3p and SMAD4 mRNA.
Cells 14 00714 g003
Figure 4. Validation of the correlation between miR-370-3p and SMAD4. (a) Illustration of the binding site for the target gene. (b) Relative luciferase activity following transfection with mimic NC combined with pmirglo-oar-miR-370-3p-SMAD4-WT, miR-370-3p mimics with pmirglo-oar-miR-370-3p-SMAD4-WT, mimic NC with pmirglo-oar-miR-370-3p-SMAD4-Mut, and miR-370-3p mimics with pmirglo-oar-miR-370-3p-SMAD4-Mut for a duration of 48 h. (c) The impact of miR-370-3p mimetics and antagonists on the mRNA expression levels of SMAD4. (d) Impact of miR-370-3p on the expression levels of SMAD4 protein; Grayscale evaluation of SMAD4 protein expression. Data are shown as mean ± standard deviation (n = 3). Statistical significance is shown by ** p < 0.01, *** p < 0.001, **** p < 0.0001, while “ns” signifies no significant difference.
Cells 14 00714 g004
Figure 5. SMAD4 siRNA sequence screening and overexpression plasmid verification. (a) Screening of siRNA sequences. (b) Effect of siRNA-SMAD4 on SMAD4 protein levels; Gray value analysis. (c) Effect of pOGP-T2A-SMAD4 on SMAD4 mRNA levels. (d) Effect of pOGP-T2A-SMAD4 on SMAD4 protein levels; Gray value analysis. The data are shown as mean ± SD (n = 3). Statistical significance was established with *** p < 0.001 and **** p < 0.0001, whilst “ns” denotes no significant difference.
Cells 14 00714 g005
Figure 6. The impact of miR-370-3p and SMAD4 on the mRNA expression of genes related to cellular phenotypic traits. Data are expressed as mean ± SD (n = 3), * p < 0.05, ** p < 0.01, *** p < 0.001, **** p < 0.0001.
Cells 14 00714 g006
Figure 7. The impact of miR-370-3p and SMAD4 on cellular proliferation. Data are expressed as mean ± SD (n = 3), ** p < 0.01, *** p < 0.001, **** p < 0.0001, ns: no significance.
Cells 14 00714 g007
Figure 8. Flow cytometric examination of cell cycle distribution, encompassing statistical assessment of the proportions of cells in the G1, S, and G2 phases, based on the flow cytometry data displayed on the left. Data are expressed as mean ± SD (n = 3), * p < 0.05, ** p < 0.01, **** p < 0.0001.
Cells 14 00714 g008aCells 14 00714 g008b
Figure 9. Flow cytometric examination of apoptosis and the computation of apoptosis rate, ascertained by evaluating the fraction of apoptotic cells from the left flow cytometry data. Data are expressed as mean ± SD (n = 3), * p < 0.05, ** p < 0.01, *** p < 0.001, **** p < 0.0001.
Cells 14 00714 g009
Figure 10. (a) The impact of miR-370-3p on the mRNA expression levels of critical genes associated with the Wnt/β-catenin signaling pathway. (b) Impact of SMAD4 on the mRNA expression of genes associated with the Wnt/β-catenin signaling pathway. Data are expressed as mean ± SD (n = 3), * p < 0.05, ** p < 0.01, *** p < 0.001, **** p < 0.0001.
Cells 14 00714 g010
Figure 11. (a): Impact of miR-370-3p and SMAD4 on the protein expression levels of genes within the DPCs. (b): Analysis of protein grayscale. Data are expressed as mean ± SD (n = 3), **** p < 0.0001.
Cells 14 00714 g011
Table 1. Primers used for qRT-PCR.
Primer NamePrimer Sequence (from 5′ to 3′)Usage
miR-370-3pTGCTGGGGTGGAACCTGGTmiRNA qRT-PCR
SMAD4-FTGAGCTTGCATTCCAGCCTCCSMAD4 qRT-PCR
SMAD4-RCCAAGCAAAAGCGATCTCCTCCSMAD4 qRT-PCR
β-actin-FCCGCAAATGCTTCTAGGCGGβ-actin qRT-PCR
β-actin-RTCGCACGAGGCCAATCTCATβ-actin qRT-PCR
PCNA-FTGGGACATCAGCTCAAGTGGPCNA qRT-PCR
PCNA-RAAGGGTTAGCTGCACCAAGGPCNA qRT-PCR
CCND1-FCCTCTCCTATCACCGCCTGACCND1 qRT-PCR
CCND1-RTTTGGGGTCCAAGTTCTGCTCCND1 qRT-PCR
CDK4-FACCTCTCGATACGAGCCAGTCDK4 qRT-PCR
CDK4-RCGTTGGGGACTCTCACACTCCDK4 qRT-PCR
CCND2-FAGCACGCTCAGACCTTCATCCCND2 qRT-PCR
CCND2-RAGGCAATCCACATCCGTGTTCCND2 qRT-PCR
Bcl-2-FTGAGTTCGGAGGGGTCATGTBcl-2 qRT-PCR
Bcl-2-RGGTACTCGGTCATCCACAGGBcl-2 qRT-PCR
Bax-FTGTCGCCCTTTTCTACTTTGCCBax qRT-PCR
Bax-RAATGTCCAGCCCATGATGGTCBax qRT-PCR
c-MYC-FCCCCTGCCAAAAGGTCAGAATCGGc-MYC qRT-PCR
c-MYC-RACGTGGCATCTCTTTAGGACCAc-MYC qRT-PCR
β-catenin-FTCAGGATACCCAGCGTCGTAβ-catenin qRT-PCR
β-catenin-RAGCAGCTGCACAAACAATGGβ-catenin qRT-PCR
JUN-FGCTTCCAAGTGCCGGAAAAGJUN qRT-PCR
JUN-RGCTGCGTTAGCATGAGTTGGJUN qRT-PCR
TCF7-FGAAAAGCACCAAGAATCCAACTCF7 qRT-PCR
TCF7-RCTAGAGCACTGTCATCGGAATCF7 qRT-PCR
TCF7L1-FGCAAATCCCACATCCCCTCATCF7L1 qRT-PCR
TCF7L1-RCACCATGTGAGGGGAGAACCTCF7L1 qRT-PCR
TCF7L2-FACCTGTCCATGATGCCTCCGTCF7L2 qRT-PCR
TCF7L2-RAGGAAGATGTCGACGGCTGTGTCF7L2 qRT-PCR
Table 2. Information on Mutation Sites of the Vector.
Carrier NameMutated Site Sequence
pmirglo-oar-miR-370-3p-SMAD4-WT6101 CCTGAAGTCAGAGGAGTCATGCCATAACTCAAGAGACGAGCCACACTTAG
6151 CTTCTGCTTT GGGGAAAACT GGTCAGCTATGGGCTCTGGT AGGTCCTTTG
6201 TGGCTTTCTG TATGCTTTTG CCTGGTTGAA GTCTGTGGCT AAAAAAACAG
pmirglo-oar-miR-370-3p-SMAD4-Mut6101 CCTGAAGTCA GAGGAGTCAT GCCATAACTC AAGAGACGAG CCACACTTAG
6151 CTTCTGCTTT GGGGAAAACT GGTCAGCTAT GGGATATGAT CTTTCCTTTG
6201 TGGCTTTCTG TATGCTTTTG CCTGGTTGAA GTCTGTGGCT AAAAAAACAG
pmirGLO: carrier name; OAR: Ovis aries.
Table 3. Sequences of miR-370-3p mimic, miR-370-3p inhibitor, and siRNA-SMAD4 used in this study.
NameSequences
miR-370-3p mimicsense:5′-GCCUGCUGGGGUGGAACCUGGUCU-3’
anti-sense:5’-ACCAGGUUCCACCCCAGCAGGCUU-3’
miR-370-3p inhibitorsense:5’-AGACCAGGUUCCACCCCAGCAGGC-3’
siRNA-SMAD4-1sense:5’-GCAGCCAUAGUGAAGGAUUTT-3’
anti-sense:5’-AAUCCUUCACUAUGGCUGCTT-3’
siRNA-SMAD4-2sense:5’-GCCUCCUAUUUCUAAUCAUTT-3’
anti-sense:5’-AUGAUUAGAAAUAGGAGGCTT-3’
siRNA-SMAD4-3sense:5’-CCUUCACACCAUGCCUAUUTT-3’
anti-sense:5’-AAUAGGCAUGGUGUGAAGGTT-3’
Disclaimer/Publisher’s Note: The statements, opinions and data contained in all publications are solely those of the individual author(s) and contributor(s) and not of MDPI and/or the editor(s). MDPI and/or the editor(s) disclaim responsibility for any injury to people or property resulting from any ideas, methods, instructions or products referred to in the content.

