Article

Repurposing Drugs for Senotherapeutic Effect: Potential Senomorphic Effects of Female Synthetic Hormones

RNA-Mediated Mechanisms of Disease Group, Department of Clinical and Biomedical Sciences (Medical School), Faculty of Health and Life Sciences, University of Exeter, Exeter EX2 5DW, UK
*
Author to whom correspondence should be addressed.
Cells 2024, 13(6), 517; https://doi.org/10.3390/cells13060517
Submission received: 26 January 2024 / Revised: 26 February 2024 / Accepted: 11 March 2024 / Published: 15 March 2024

Abstract

:
Repurposing previously approved drugs may fast track the route to the clinic for potential senotherapeutics and improves the inefficiency of the clinical drug development pipeline. We performed a repurposing screen of 240 clinically approved molecules in human primary dermal fibroblasts for their effects on CDKN2A expression. Molecules demonstrating effects on CDKN2A expression underwent secondary screening for senescence-associated beta galactosidase (SAB) activity, based on effect size, direction, and/or molecule identity. Selected molecules then underwent a more detailed assessment of senescence phenotypes including proliferation, apoptosis, DNA damage, senescence-associated secretory phenotype (SASP) expression, and regulators of alternative splicing. A selection of the molecules demonstrating effects on senescence were then used in a new bioinformatic structure–function screen to identify common structural motifs. In total, 90 molecules displayed altered CDKN2A expression at one or other dose, of which 15 also displayed effects on SAB positivity in primary human dermal fibroblasts. Of these, 3 were associated with increased SAB activity, and 11 with reduced activity. The female synthetic sex hormones—diethylstilboestrol, ethynyl estradiol and levonorgestrel—were all associated with a reduction in aspects of the senescence phenotype in male cells, with no effects visible in female cells. Finally, we identified that the 30 compounds that decreased CDKN2A activity the most had a common substructure linked to this function. Our results suggest that several drugs licensed for other indications may warrant exploration as future senotherapies, but that different donors and potentially different sexes may respond differently to senotherapeutic compounds. This underlines the importance of considering donor-related characteristics when designing drug screening platforms.

1. Introduction

Senescence is a hallmark of ageing, and an emerging therapeutic target [1,2]. Senescence may appear as part of natural development, but during ageing, it is induced by replicative exhaustion or by cellular stressors such as DNA damage, oncogenes, and other forms of cellular stress [3,4,5,6,7]. Despite the original definition that senescence is irreversible, recent research indicates that the senescence phenotypes can be reversed by some classes of drugs [8,9]. Senotherapeutics (compounds that target senescence) include those that attenuate the deleterious characteristics of senescent cells (senomorphics) and drugs that cause preferential lysis of senescent cells (senolytics) [8,9,10]. Clearance of senescent cells significantly extends lifespan, improves mobility and fur condition in mouse models of progeria, and improves multiple aspects of functionality in aged wild-type mice [11,12,13,14,15]. Senolysis has also been seen to confer additional health benefits in humans; combinations of the senolytic drugs dasatinib and quercetin compounds are currently in trials for diabetic kidney disease and idiopathic pulmonary fibrosis (IPF) [16,17]. However, some initial results from senolytic trials also show potential adverse effects, e.g., hypoglycaemia [18].
Attenuating the senescent state using senomorphic approaches may also be useful. It is possible to uncouple features of senescence, such as reversal of senescence-associated beta galactosidase (SAB) staining from other aspects such as proliferation; such effects are often dose-dependent [19]. The ideal senotherapeutic candidate would be able to reverse senescence and attenuate the senescence-associated secretory phenotype (SASP) (a senomorphic effect), but would not necessarily elicit re-entry to cell cycle, since rejuvenated cells may still carry a mutation load. Conversely, any compounds that are identified as increasing senescence might represent potential oncodrugs. Forcing cancerous cells to enter a senescent state might provide a better tolerated oncotherapeutic approach and provide an opportunity to selectively target the resulting cells with senolytic drugs.
It is likely that some known and licensed drugs have some senomorphic or senolytic capacity. The drug development pipeline is inefficient, with only 15.3% of drugs in phase 1 clinical trials in the US advancing to gain FDA-approval [20]. Repurposing drugs which are already approved for clinical use represents a tactic which avoids the problems with the leaky pipeline of drug development. For example, trametinib, a MEK inhibitor currently used as a cancer treatment, exhibits a biphasic dose response, affecting different aspects of senescence depending on dose [21]. Panels of small molecules for drug repurposing studies can be procured and customized commercially, giving plenty of opportunities to adapt drug repurposing screens for different indications.
Bioinformatic approaches can also be used to complement wet laboratory screening. Structure–function associations may be of particular interest in the context of a screen for senescence. If a certain structure is associated with a senomorphic or senolytic function, then this provides an opportunity to identify potentially useful compounds from public drug databases by screening them for the structure. This strategy could offer the discovery of novel drugs in a quicker way than traditional pharmaceutical discovery processes. Similarly, any structural association with specific senescence related functions may provide mechanistic insight into the cellular processes at hand.
We aimed to screen a range of compounds for effects on aspects of the senescence phenotype using in vitro screens in primary human dermal fibroblasts and bioinformatic structure–function analysis. We identified several existing clinically approved molecules as having capacity to attenuate aspects of the senescence phenotype in a sex-specific manner. Finally, we have worked up a structure–function screening pipeline and identified a molecular substructure that is associated with alterations in CDKN2A expression (a biomarker of senescence) or SAB positivity. Our work indicates that repurposing studies augmented by bioinformatic or machine learning approaches may prove a rich vein of research for the identification of new classes of senotherapeutic molecules, but donor characteristics, such as sex and individual genetics, can influence senescence outcome and should be accounted for in study design.

2. Materials & Methods

2.1. Drug Panel, Screen Design and Preparation

A selection of 240 compounds were chosen from the MedChemExpress FDA-Approved Drug Library Plus panel of 2278 compounds (MedChemTronica, Stockholm, Sweden). We selected drugs that target known senescence/cell fate pathways, that cover a variety of other cellular functions (including apoptosis and autophagy), and a variety of commonly prescribed or household medicines. Drug identities and targets are given in Supplementary Table S1 and Supplementary Figure S1 (summary graphs were produced using Microsoft Office, Redmond, WA, USA). Most compounds are FDA-approved with the remainder approved by the EMA or other countries. Compounds were all supplied at 10 mM concentrations in DMSO by the manufacturer. Concordant with similar screens [19,22], compounds were diluted to 1 µM or 10 µM in Gibco™ ultrapure RNase/DNase free water suitable for preparation of cell culture media and laboratory reagents (A1287301, Gibco™, Billings, MT, USA). Vehicle DMSO controls were prepared in the same manner. On the basis of our first pass results, an additional synthetic female hormone (Levonorgestrel; also known as D-Norgestrel, MedChemTronica, Stockholm, Sweden) which targets the progesterone receptor was also added to secondary screen. A flow chart (produced using Microsoft Office and Biorender.com, Toronto, Canada) illustrating our screening approach is given in Figure 1 and the Graphical Abstract.

2.2. Cells Used in This Study

Normal human dermal fibroblast (nHDF) cells from one male and one female donor were commercially sourced with full ethical permission granted at source (Promocell, Heidelberg, catalogue number C-12302, lot numbers 445Z026.3 (male) and 467Z026.3 (female)). Both donors were Caucasian. The male donor was 36 years old at the time of donation, and the female donor was 28 years old. The cells were taken from the abdomen of the male donor, whereas the female donor’s cells were taken from the breast. Cells were grown in DMEM 1 g/L glucose + phenol red (31885023, Gibco™, Billings, MT, USA), 10% human serum (H3667, Sigma-Aldrich, St. Louis, MO, USA) and 1% 10,000 U/mL penicillin—10,000 µg/mL streptomycin (15140122, Gibco™, Billings, MT, USA). Cells were grown in antibiotic–free media for 48 to 72 h before seeding, and all treatments were performed without the presence of antibiotics in the medium.

2.3. Primary Screen

2.3.1. Tissue Culture and Drug Treatment Conditions

Male nHDF cells had average cumulated population doublings (cPDL) of 38.91 (range of 34.41–40.13 cPDL) at the time of seeding for the primary screen. For this, cells were seeded out in 96-well plates at 6000 cells per well (a density of 1880 cells/cm2) and treated 72 h after seeding. Dose and incubation times were informed by previous work from our research group and the literature discussed in the introduction [19,22,23]. On the day of treatment, the medium was removed and replaced with 135 µL of fresh medium and 15 µL of the appropriate stock solution of each drug or control. Doxorubicin was included as a known inducer of senescence. The drug or control was applied for 24 h before two washes in DPBS (catalogue number 14190136, Gibco™, Billings, MT, USA) and performing the RNA extraction.

2.3.2. Quantification of CDKN2A Expression

RNA was extracted from treated cells using the PureLink™ Pro 96 RNA Purification Kit (catalogue number 12173–011A, Fisher Scientific, Pittsburgh, PA, USA) according to manufacturer’s instructions and eluted in a volume of 45 µL of RNase-free water. RNA quality and quantity was sampled using the Thermo Scientific™ Nanodrop 8000 Spectrophotometer (ThermoFisher, Waltham, MA, USA). Two test plates had compromised RNA quality and were excluded from the analysis. The maximum RNA volume possible based on reaction volume constraints was reverse-transcribed using the High-Capacity cDNA Reverse Transcription Kit (catalogue number 4368813, ThermoFisher, Waltham, MA, USA) according to the manufacturer’s instructions. Reverse transcription was performed on the Applied Biosystems™ Veriti™ 96-Well Fast Thermal Cycler platform. Cycling conditions were: 25 °C for 10 min, 37 °C for 120 min, 85 °C for 5 min and a 4 °C hold step. Real-time quantitative PCR (RT-qPCR) reactions were carried out on the Quantstudio 12K platform (Applied Biosystems™, Birchwood, UK) as 5 µL reactions on 384-well plates. Cycling conditions were: 50 °C for 2 min, 95 °C for 10 min, followed by 50 cycles of 95 °C for 15 s and 60 °C for 1 min. Each reaction contained 1 µL of cDNA product, 900 nM each primer and 250 nM probe and TaqMan™ Universal Mastermix II. CDKN2A expression was assessed using the Hs00923894_m1 TaqMan™ Gene Expression Assay (FAM) (catalogue 4331182, ThermoFisher, Waltham, MA, USA). Endogenous housekeeper control genes were PGK1 (assay ID HS99999906_m1), PPIA (assay ID Hs04194521_s1) and UBC (assay ID Hs05002522_g1), empirically determined to represent the most stable baseline accordingly to the RefFinder webtool [24]. All were procured from ThermoFisher (Waltham, MA, USA). Assays were performed in two biological and three technical replicates for each compound/control at both treatment doses. Relative gene expression levels were calculated using the comparative CT technique relative to the geometric mean expression level of the three housekeeping genes [25]. Levels were normalized to the average of the vehicle control on each plate and were expressed as natural log to aid against skew of data. The mean ± three standard deviations was used to provide upper and lower bounds for prioritization of compounds for follow up.

2.4. Secondary Screen

To assess the induction of senescence, experiments were carried out using early passage male cells (cPDL = 32.69), whereas work to assess potential reduction in senescent cell load was carried out using later passage cells (cPDL = 40.77–43.2). Later passage cells were assessed at the point that they had slowed to half their original division speed. For assessment of SAB activity, cells were seeded in 12-well plates at an average seeding density of 6226 cells/cm2. Cells were grown for 24 to 48 h before treatment as in the primary screen and each compound was applied for 24 h prior to assessment of SAB activity, which was carried out using the Senescence Cells Histochemical Staining Kit (Merck, Gillingham, UK), according to manufacturer’s instructions. Five images per biological replicate were imaged at 10 × magnification using a Zeiss AxioCam ERC55 PrimoVert microscope and later counted manually using ImageJ 1.47v software (US National Institute of Health, Bethesda, MD, USA) [26]. Differences in SAB staining between test compounds and controls were assessed by one-way ANOVA with an uncorrected Fisher’s LSD post hoc test and graphed using GraphPad Prism version 9.4.1 for Windows (GraphPad Software, San Diego, CA, USA, www.graphpad.com, accessed on 24 January 2024).

2.5. In Depth Characterization of Female Synthetic Hormone Compounds

2.5.1. Tissue Culture and Dosing Regime

Based on the results of our primary and secondary screen, we selected three female synthetic hormones for follow up due to evidence of effects on senescence. Cells for this work had an average cPDL of 39.46 at the time of seeding for male cells and 33.68 for female cells, and were assessed as being late passage at the point that they had slowed to half their original division speed. Cells were seeded at approximately 7200 cells/cm2 in a 12-well plate for the SAB assay, at ~6000 cells/cm2 in a 12-well plate on 13 mm coverslips for immunocytochemical staining, at ~7000 cells/cm2 in a 24-well plate on 13 mm coverslips for the TUNEL assay experiments and at ~14,000 cells/cm2 in a 6-well plate for RNA extractions. Cells were treated with either a DMSO vehicle control (J66650.AD, Thermo Scientific Alfa Aesar, Haverhill, MA, USA), or a 10 µM dose of diethylstilboestrol, ethynyl estradiol, or levonorgestrel (Catalogue numbers HY-14598, HY-B0216 or HY-B0257, respectively, MedChemExpress, Stockholm, Sweden). Fresh medium was added to the plates before the addition of the treatment stock. Cells were treated for 24 h before the removal of treatment, followed by immediate staining or harvesting.

2.5.2. Quantification of Senescent Cell Load Using SAB Staining

Cultures were stained for SAB activity using the Senescence Cells Histochemical Staining kit (CS0030, Merck, Darmstadt, Germany) according to the manufacturer’s instructions. After 24 h of staining, cells were imaged at 10× magnification using a Zeiss AxioCam ERC55 PrimoVert. Five images per biological replicate were captured and later counted manually using ImageJ 1.47v software (US National Institute of Health, Bethesda, MD, USA) [26]. Differences in SAB staining between test compounds and controls were assessed by one-way ANOVA with an uncorrected Fisher’s LSD post hoc test and graphed using GraphPad Prism version 9.4.1 for Windows (GraphPad Software, San Diego, CA, USA, www.graphpad.com).

2.5.3. Quantification of Cellular Proliferation and DNA Damage Repair Using Immunocytochemical Staining for Ki67 and γH2AX

Following two washes in DPBS (14190136, Gibco™), the cells were fixed with 4% paraformaldehyde and stored in DPBS. Prior to staining, the cells were washed again in DPBS and blocked with ADST [antibody diluent solution—triton: DPBS, 0.1 M L-Lysine (303341000, Thermo Scientific™, Waltham, MA, USA), 1% w/v Human Serum Albumin Fraction V (12668-10GM, Sigma-Aldrich, St. Louis, MO, USA), Triton X-100 (A16046.AP, Thermo Scientific Alfa Aesar)] and 5% human serum (H3667, Sigma-Aldrich) for 30 min. Antibodies were commercially derived from Abcam (Cambridge, UK): Rb anti-Ki67 (ab15580, ab16667), Ms anti-γH2AX (ab26350), Alexa Fluor ® 555 Goat pAb to Rb (ab150078, ab150086) and Alexa Fluor ® 488 Goat pAb to Ms (ab150117). Primary antibodies were applied overnight at 2.5 µg/mL (suspended in ADST with 2% human serum). Secondary antibodies were applied at 5 µg/mL and 4′,6-diamidino-2-phenylindole (DAPI, D1306, Invitrogen™, Waltham, MA, USA) at 1 µg/mL (suspended in ADST with 2% human serum) were applied for 1 h. Then, the coverslips were mounted with Dako mounting medium (S302380-2, Agilent, Santa Clara, CA, USA). Five representative images per coverslip were captured at 10× magnification using a Leica DM4 B Upright Microscope and cells were manually scored positive or negative for each parameter manually using the Leica Application Suite X 2019 3.7.1.21655v software (Leica Microsystems, Wetzlar, Germany). Differences in cell kinetic parameters between treated and control cells were assessed by one-way ANOVA with an uncorrected Fisher’s LSD post hoc test and graphed using GraphPad Prism version 9.4.1 for Windows (GraphPad Software, San Diego, CA, USA, www.graphpad.com).

2.5.4. Quantification of Apoptosis Using TUNEL Assay

Cells were washed in DPBS (14190136, Gibco™), before the cells were fixed with 4% paraformaldehyde, washed again and stored in DPBS. The Click-iT® TUNEL Alexa Fluor® Imaging Assay (C10245, ThermoFisher) was performed according to the manufacturer’s instructions using additional DPBS, bovine serum albumin (BSA) fraction V fatty acid-free (10775835001, Roche, Basel, Switzerland), and Triton X-100 (A16046.AP, Thermo Scientific Alfa Aesar). In the same manner as for the other immunofluorescently stained cells, the Leica DM4 B Upright Microscope at 10× magnification was used to capture five images per coverslip. The cells in the images were later counted manually using Leica Application Suite X 2019 3.7.1.21655v software (Leica Microsystems, Wetzlar, Germany). Differences in TUNEL staining between test compounds and controls were assessed by one-way ANOVA with an uncorrected Fisher’s LSD post hoc test and graphed using GraphPad Prism version 9.4.1 for Windows (GraphPad Software, San Diego, CA, USA, www.graphpad.com).

2.5.5. Quantitative RT-qPCR Assessment of Gene Expression

RNA was extracted from cells using TRI Reagent Solution (AM9738, Invitrogen™) according to the manufacturer’s instructions, with the addition of 10 mM MgCl2 (AM9530G, Invitrogen™) before phase separation (to aid in RNA recovery [27]) and 1.2 µL of 15 mg/mL GlycoBlue™ Coprecipitant (AM9516, Invitrogen™) prior to washing (to aid in pellet visualisation). RNA was resuspended in 20 µL 1 × TE buffer, pH 8.0 (BP2473-500, Fisher Bioreagents) and assessed for concentration and quality using the Thermo Scientific™ Nanodrop 8000 Spectrophotometer (Thermo Fisher Scientific, Waltham, MA, USA). RNA was reverse-transcribed at 10 ng/µL in a 20 µL reaction, using the High-Capacity cDNA Reverse Transcription Kit (4368813, Applied Biosystems™, Waltham, MA, USA) according to the manufacturer’s instructions. Reverse transcription was performed on an Applied Biosystems™ Veriti™ 96-Well Fast Thermal Cycler with the following cycling conditions: 25 °C for 10 min, 37 °C for 120 min, 85 °C for 5 min and a 4 °C hold step. A total of 12.5 ng of cDNA was pre-amplified according to the manufacturer’s instructions using TaqMan™ PreAmp Master Mix (4384266, Applied Biosystems™, Waltham, MA, USA) and pooled TaqMan™ Gene Expression Assays (FAM) (4331182, TaqMan®, Life Technologies, Carlsbad, CA, USA). Transcripts encoding factors associated with apoptosis, the senescence-associated secretory phenotype (SASP) and regulators of alternative splicing were assessed by RT-qPCR. A table of genes assessed is provided in Table 1. Using the Applied Biosystems™ Veriti™ 96-Well Fast Thermal Cycler, the cycling conditions were: 95 °C for 10 min, 14 cycles of [95 °C for 15 s, 60 °C for 4 min], 99 °C for 10 min, and a 4 °C hold step. The pre-amplified cDNA products were diluted by a factor of 10 in 1 × TE buffer, pH 8.0 (BP2473-500, Fisher Bioreagents, Thermo Fisher Scientific, Waltham, MA, USA). RT-qPCR was performed in three biological and three technical replicates on the Quantstudio 12K platform (Applied Biosystems™, Waltham, MA, USA) as 5 µL reactions on 384-well plates. The cycling conditions were: 50 °C for 2 min, 95 °C for 10 min, followed by 50 cycles of 95 °C for 15 s and 60 °C for 1 min. 1 µL of diluted, pre-amplified cDNA product was used per reaction with 0.25 µL of Taqman™ Gene Expression Assay (equating to 900 nM primer and 250 nM probe). Gene expression was calculated using the comparative CT technique [25] relative to the geometric mean of five housekeeping genes (GUSB, IDH3B, PGK1, PPIA and UBC) empirically selected for stability as described above [24], and normalized to expression levels in the respective cell type’s vehicle-treated control. Results were assessed for statistical significance using a one-way ANOVA with an uncorrected Fisher’s LSD post hoc test and graphed using GraphPad Prism version 9.4.1 for Windows (GraphPad Software, San Diego, CA, USA, www.graphpad.com).

2.6. Bioinformatic Assessment of Structure–Function Relationships

Structural information on each compound tested was obtained from the supplier (MedChemTronica, Stockholm, Sweden). The SMILES (simplified molecular input line entry system) data was transformed into SDF (structure data file) data for analysis with ChemmineR and fmcsR packages in Rstudio software version 4.1.0 [28,29,30,31]. Tanimoto coefficients, measures of structural similarity [28], were computed for each pair of compounds and used to construct a matrix of intragroup comparisons of structural similarity. Computing resource limitations imposed a maximum of 30 compounds per test group. The average Tanimoto coefficient across the matrix of functionally related compounds was compared against the average Tanimoto coefficient for a control group of non-functionally related compounds using an unpaired t test in GraphPad Prism version 9.4.1 for Windows (GraphPad Software, San Diego, CA, USA, www.graphpad.com). A dendrogram was constructed for groups of interest to illustrate the structural similarity between compounds. If a structure–function relationship was suggested, the exact maximum common substructure was computed for the two least similar compounds (as identified in the dendrogram) to identify the maximum common substructure across the whole test group.

2.6.1. Methodological Validation

Producing a statistical comparison between similarity matrices represents a novel use for the matrix outputs of ChemmineR. A significant difference between intragroup average Tanimoto coefficients indicates that compounds in the test group are more structurally similar than the control group. When the test group contains only compounds with a particular function of interest, a significant difference may suggest a structure–function relationship. The maximum common substructure of the group may therefore suggest (or be incorporated within) a substructure which is associated with the function of interest. To validate this approach, a group of compounds that share a known functionally related substructure was compared against a control group. Validation compounds were selected from the MedChemExpress FDA-Approved Drug Library Plus panel of 2278 compounds (MedChemTronica, Stockholm, Sweden).
Given that our in vitro screens had already highlighted some oestrogenic compounds and that the provided drug library information identified compounds that target the oestrogen receptor, we decided to validate the approach by trying to identify a known structure–function relationship using compounds that target the oestrogen receptor. These compounds are known to share substructures which are linked with their function of targeting the oestrogen receptor. The validation test group consisted of 30 compounds versus a control group of 30 functionally unrelated compounds. The number of oestrogenic compounds in the validation test group was varied to assess the sensitivity of the method: using 30, 10, 4, 3 and 2 oestrogenic compounds in a group of other non-oestrogenic compounds totaling 30 for comparison against the control group of 30 functionally unrelated compounds.

2.6.2. Structure–Function Analysis of In Vitro Screen Results

The first two test groups were the compounds that had either increased or decreased CDKN2A gene expression the most (averaged across both doses). The third test group was a selection of compounds that had decreased SAB activity in the screen. Control compounds acting as a non-functionally associated control group were selected based on the compounds with the least effect on CDKN2A expression and were matched to the number of compounds in each test group. In total, 78 individual compounds were used in the study. Test groups of compounds are described in Supplementary Figures S2–S4.

3. Results

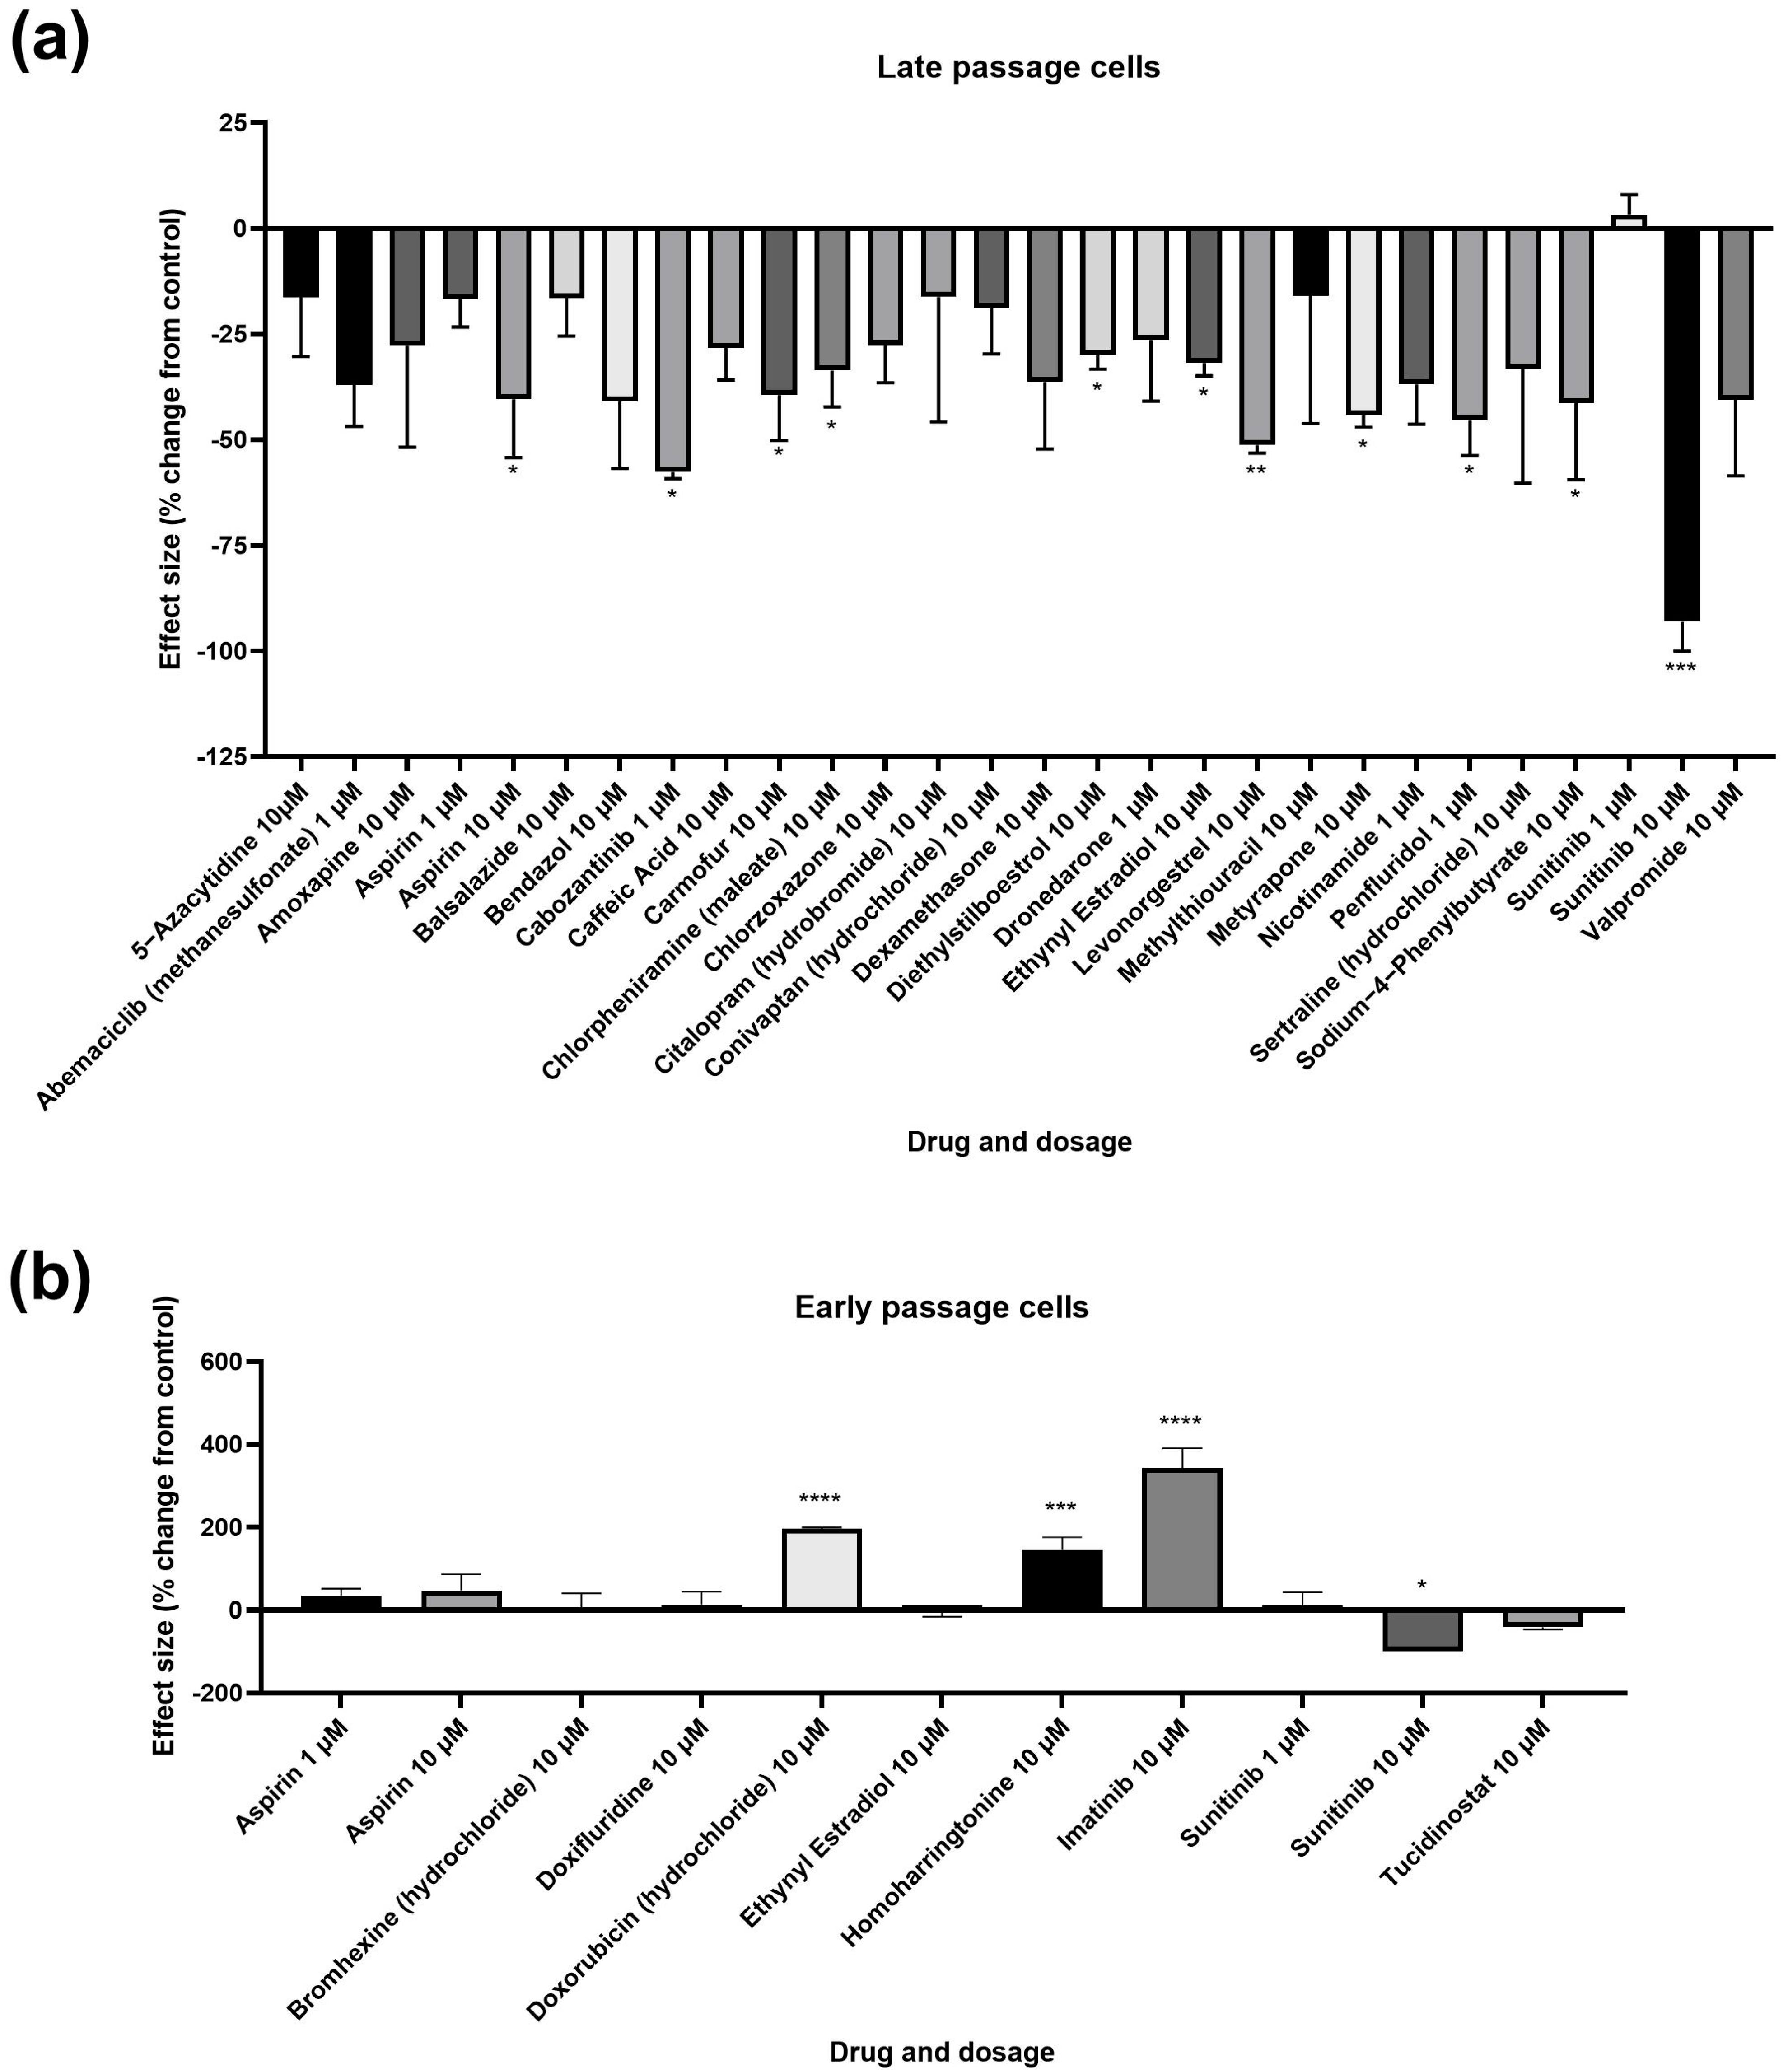
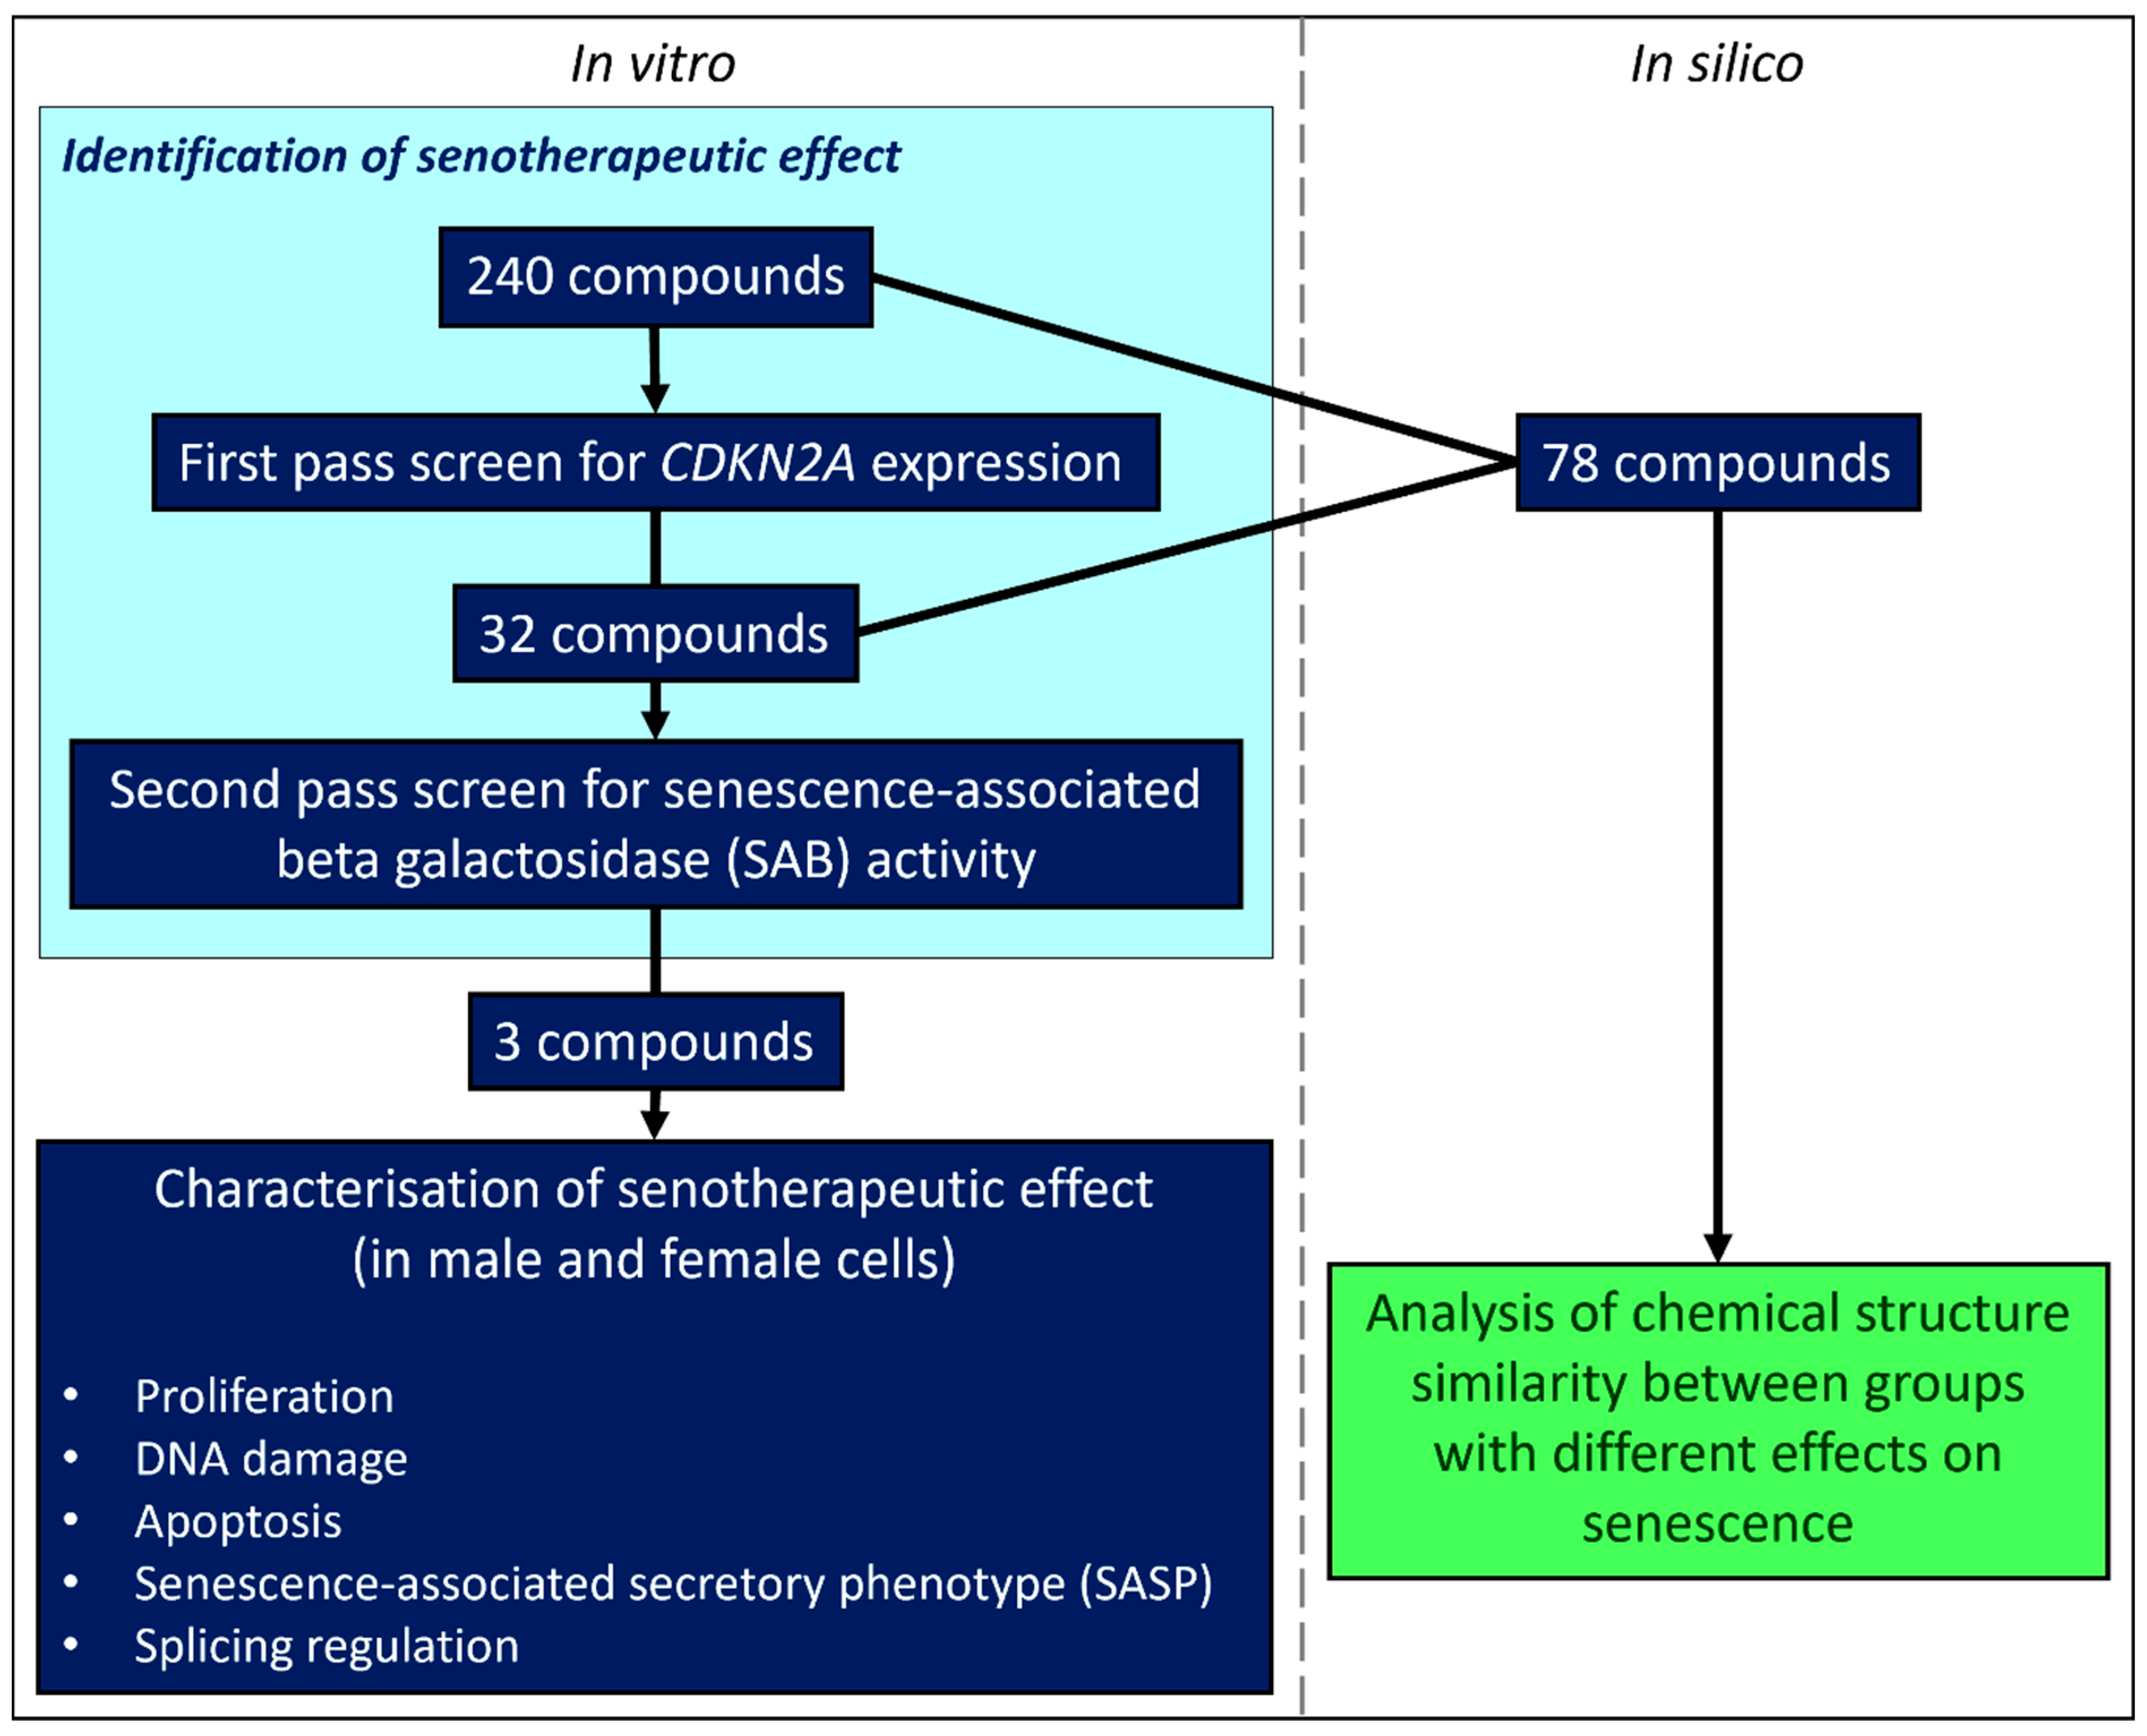
3.1. Primary and Secondary Screens

We identified 90 molecules that altered CDKN2A gene expression in male cells, with 20 increasing senescent cell load and 70 decreasing senescent cell load by more than mean ± three standard deviations of the control treatments (Table 2). 32 compounds were selected for secondary screening based on effect size, widespread usage or due to having different effect directionality between doses from the primary screen. Of these, 11 compounds elicited a reduction in SAB positivity, and three caused an increase in SAB positivity (Figure 2; Table 3). Compounds causing a statistically significant decrease in SAB activity included the non-steroidal anti-inflammatory drug (NSAID) aspirin, the cancer drugs cabozantinib, and carmofur, the antihistamine chlorpheniramine (maleate), the 11β-hydroxylase inhibitor metyrapone, the antipsychotic penfluridol, the ammonia lowering drug sodium-4-phenylbutyrate and the synthetic female sex hormones diethylstilboestrol, ethynyl estradiol and levonorgestrel. Most of these effects were evident at 10 µM concentration, though aspirin and penfluridol had effects at a lower concentration of 1 µM. Although the cancer drug, sunitinib, caused a significant decrease in SAB activity at 10 µM in both early and late passage cells, the drug caused mass cell death rather than acting as a senotherapeutic. Compounds demonstrating induction of senescence included the anticancer agents: doxorubicin, homoharringtonine and imatinib.

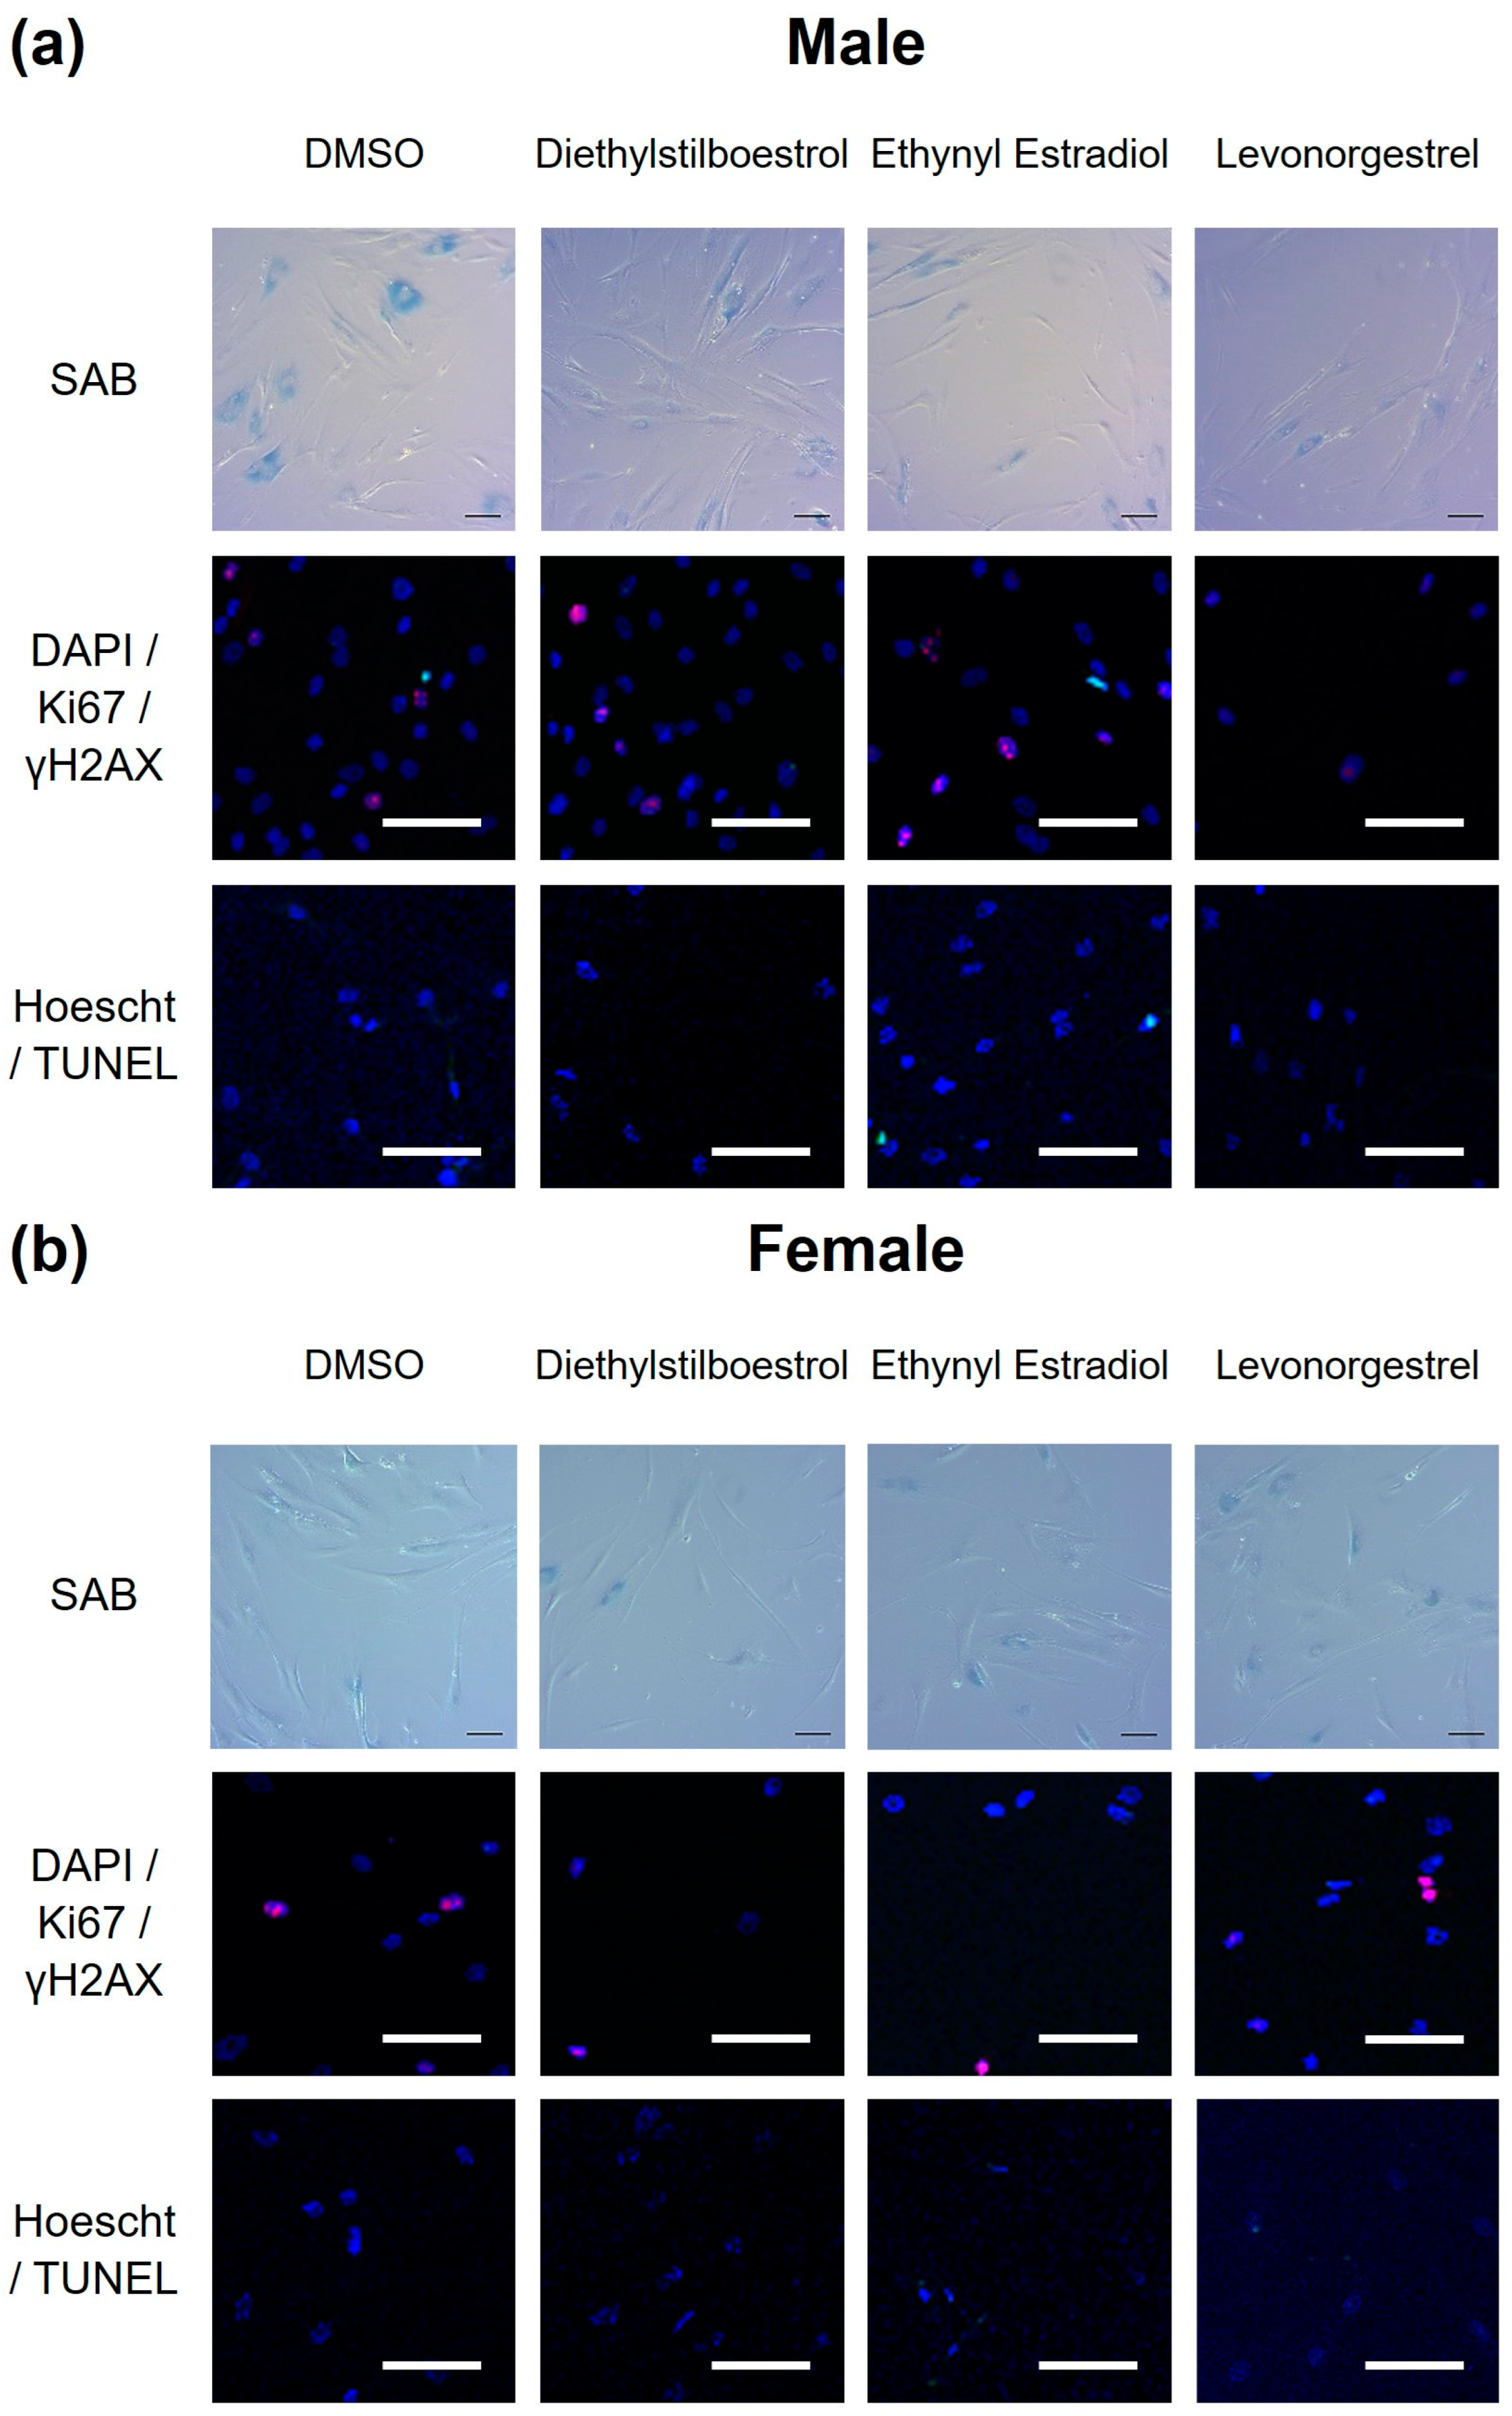
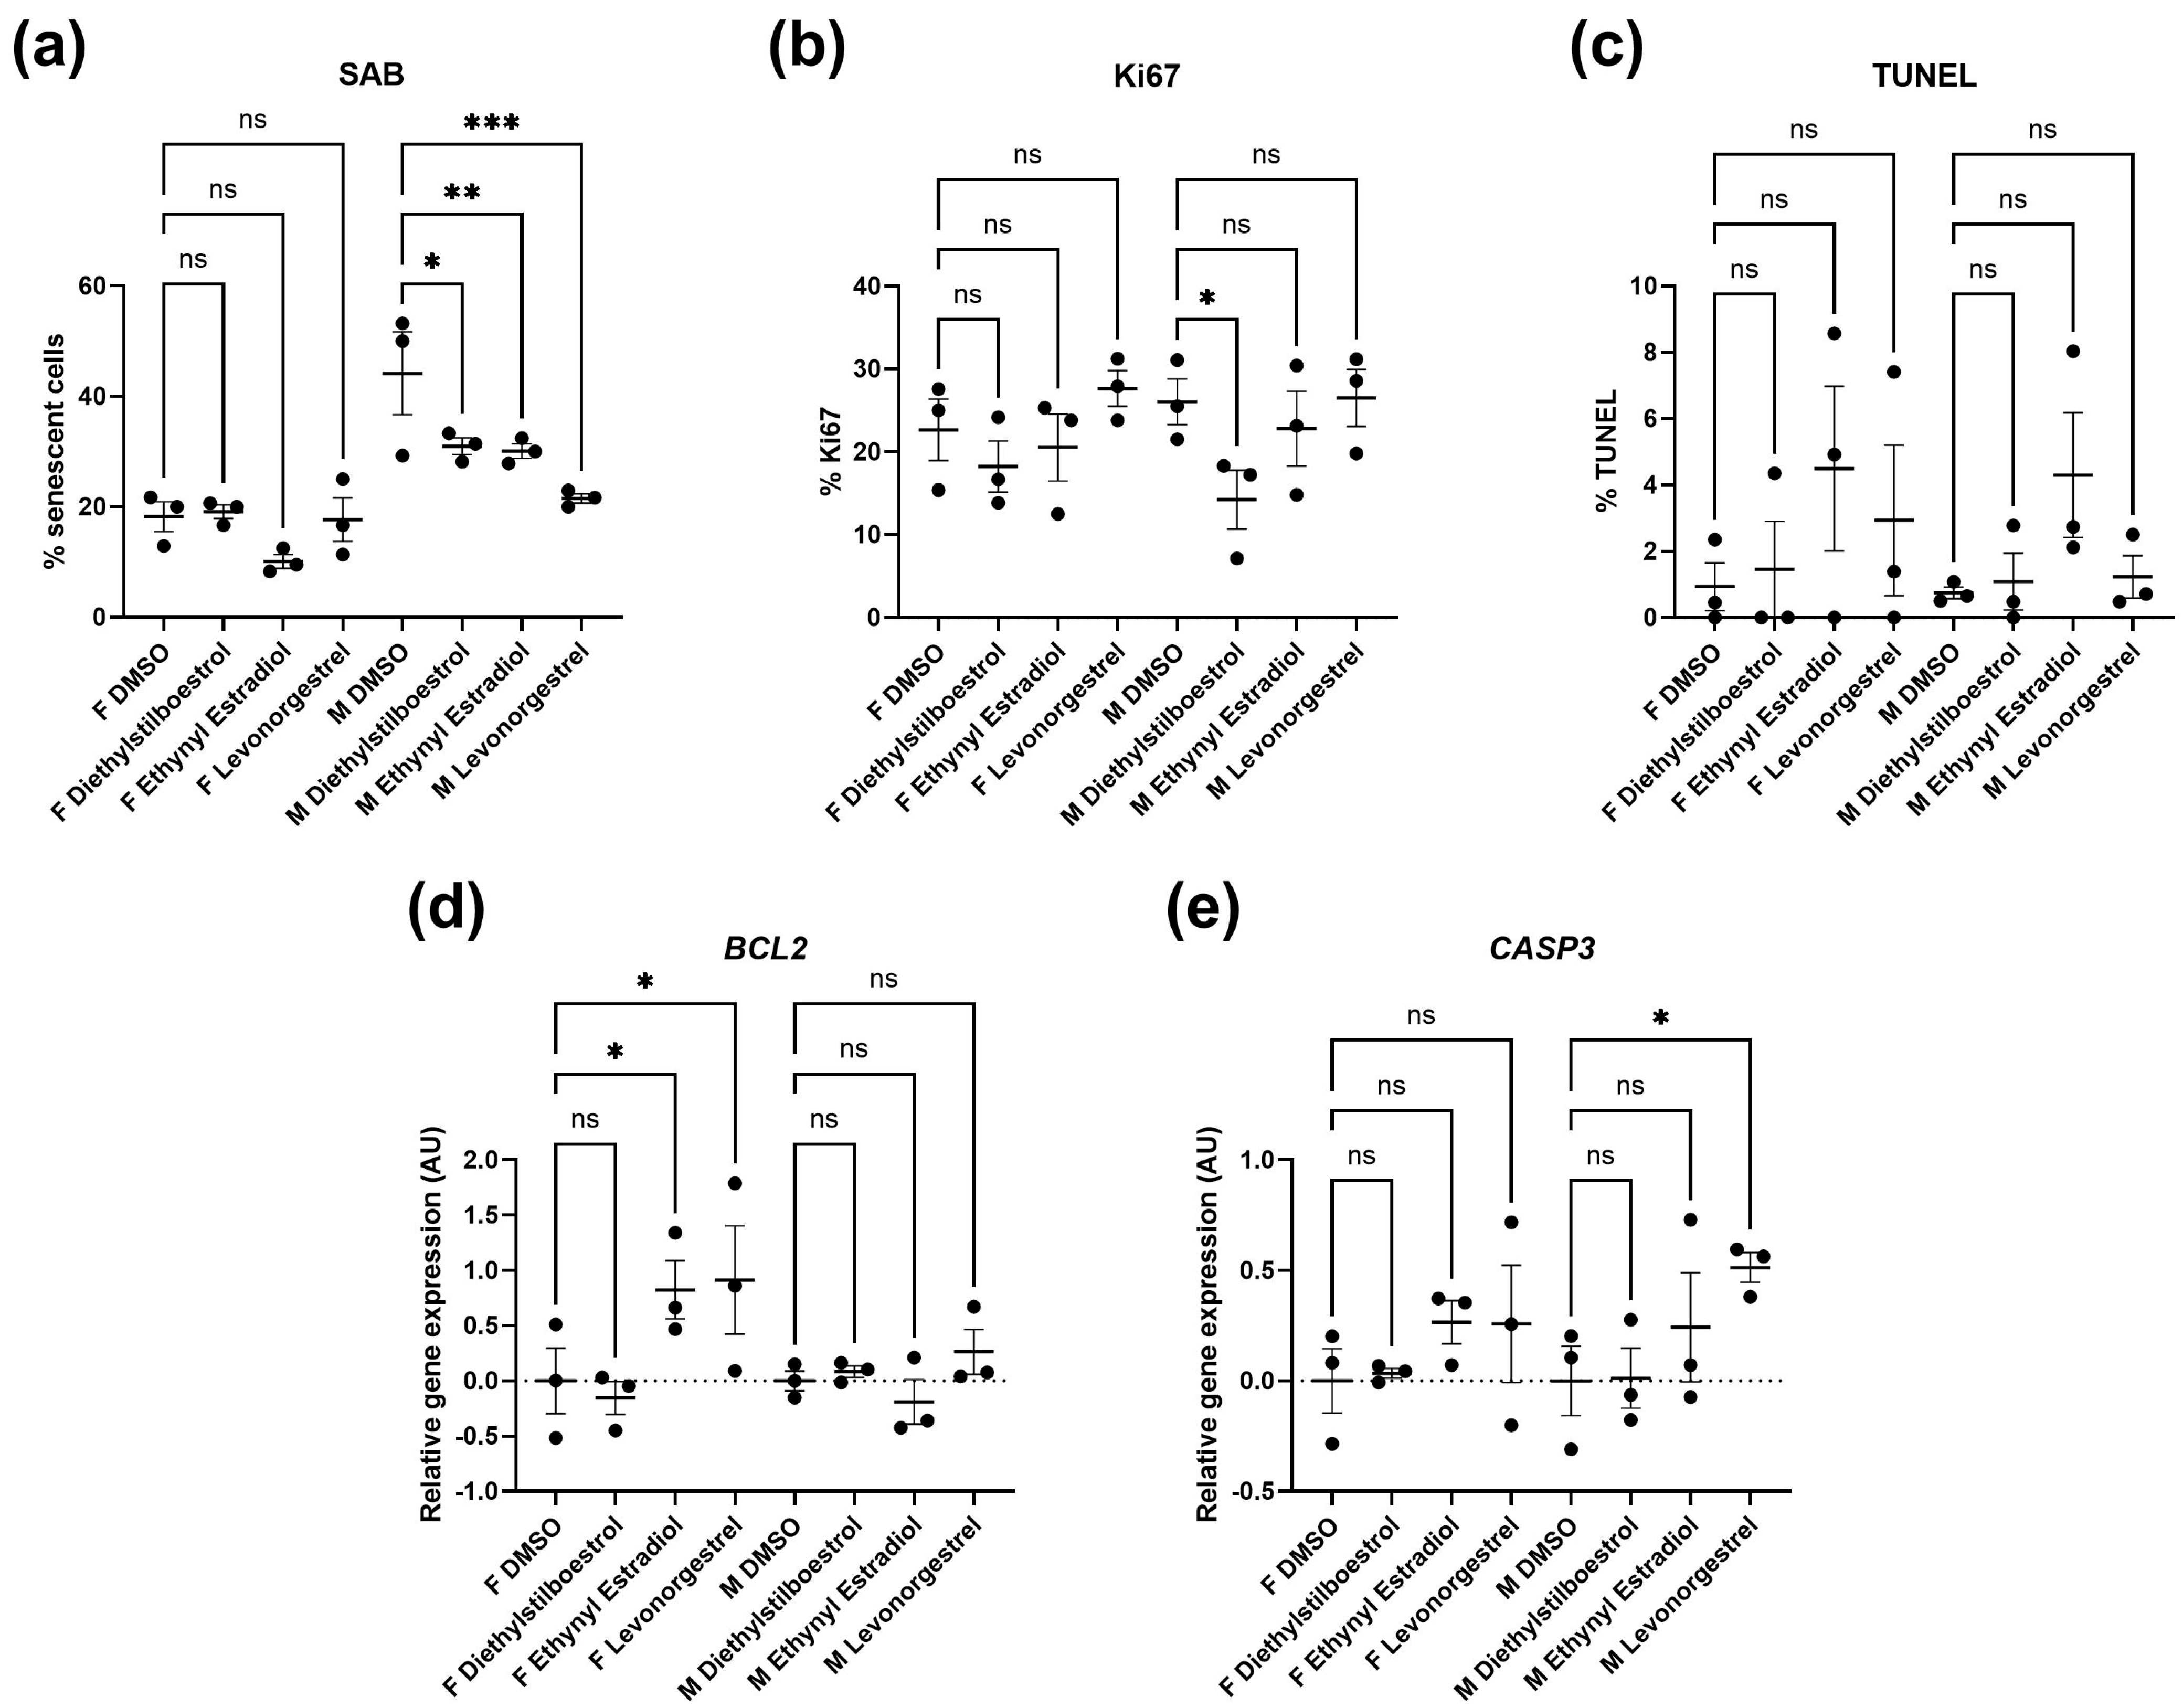
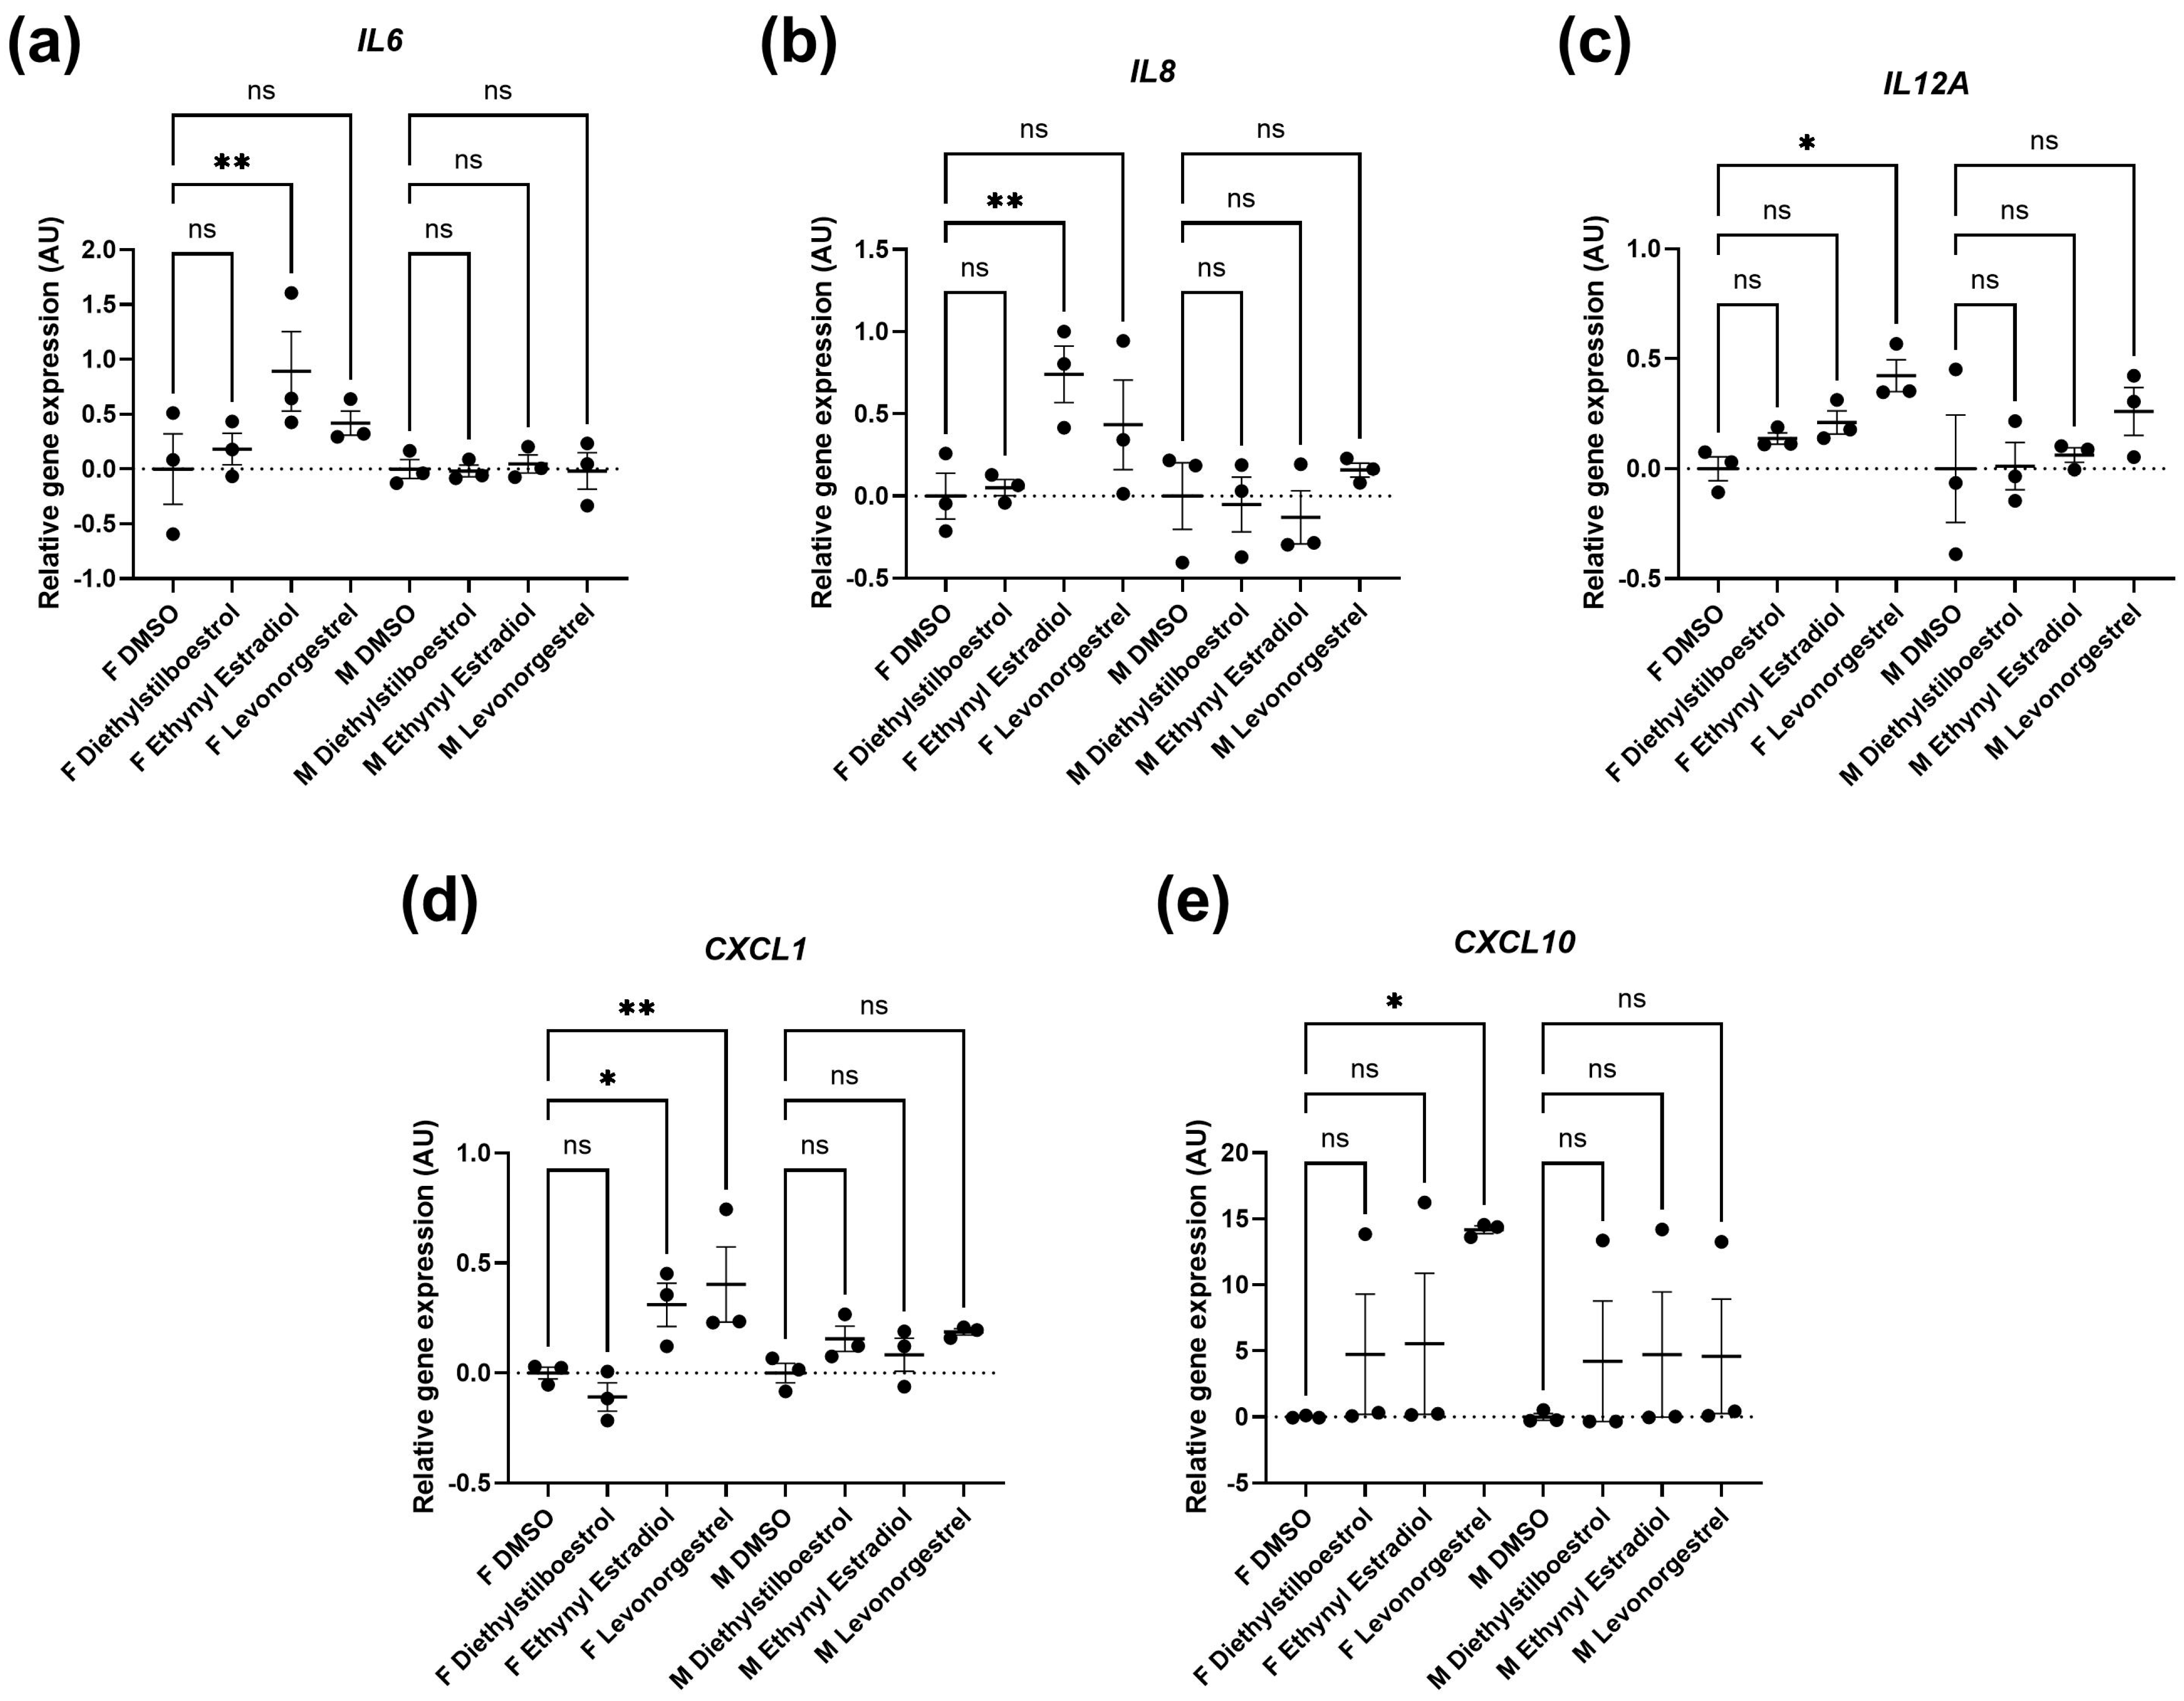
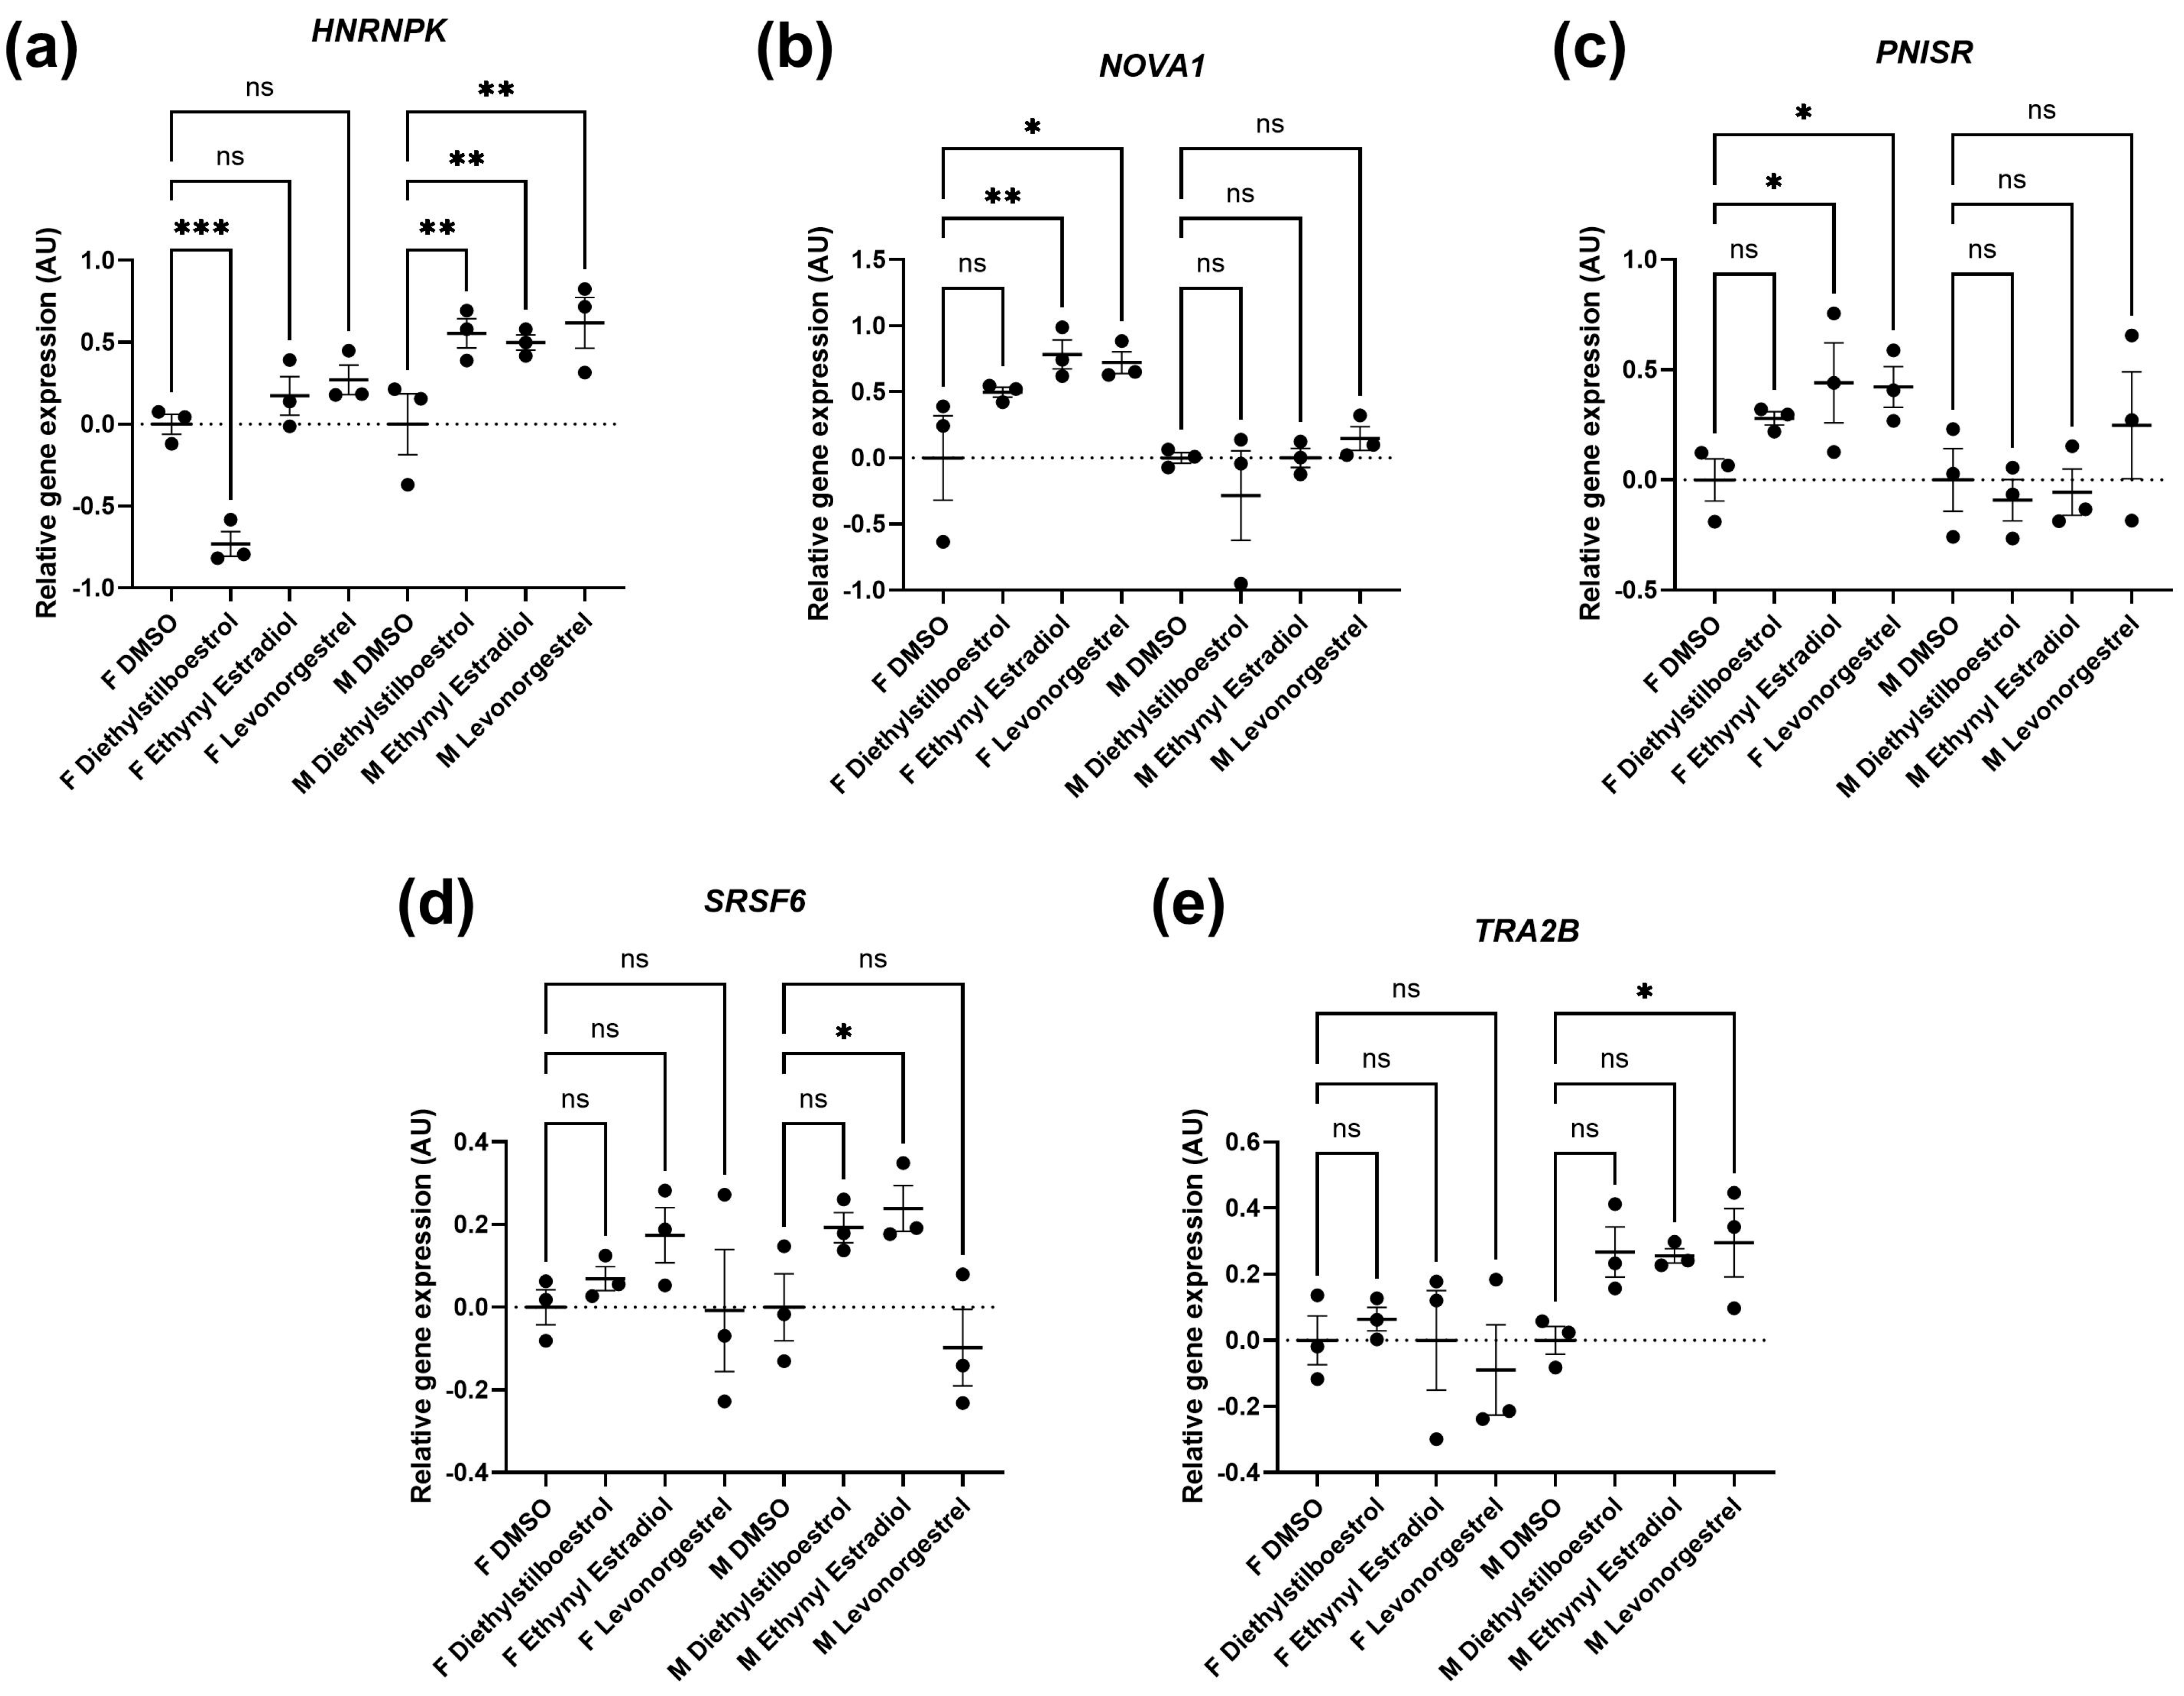
3.2. Potential Donor Characteristic-Specific Differences in Cellular Senescence Kinetics in Response to Treatment with Female Synthetic Sex Hormones

Female synthetic sex hormones were prominent across both screens, so we examined the effects of these compounds in more detail in senescent male and female primary dermal fibroblasts. We identified that all three synthetic female hormones caused a decrease in SAB activity in male fibroblasts (a 30%, 32% and 51% decrease in stained cells for diethylstilboestrol, ethynyl estradiol and levonorgestrel; p = 0.0122, 0.0083 and 0.0002, respectively). Notably, these effects were not evident in the female cells (Figure 3a and Figure 4; Supplementary Table S2).
Effects on proliferation were minimal, with only diethylstilboestrol demonstrating a 45% decrease in proliferation (p = 0.0289) in male cells (Figure 3b and Figure 4; Supplementary Table S2). Levels of γH2AX, (indicating DNA damage repair) were very low in all cell types and treatments, reflected in very low levels of cell death in the culture as measured by TUNEL assay; an average of 2.1% of cells had evidence of double strand breaks with no significant difference noted between any of the experimental groups (Figure 3c and Figure 4; Supplementary Table S2). We also noted some donor-specific changes in apoptotic markers (Figure 3; Supplementary Tables S3 and S4). We observed an 82% and a 91% increase in BCL2 expression following treatment with ethynyl estradiol or levonorgestrel in female cells (p = 0.0351 and 0.0214). BCL2 expression was unchanged in male cells. Conversely, CASP3 was increased by 51% in response to levonorgestrel (p = 0.0397) in male cells but was unchanged in female cells.
Furthermore, the treatments only affected SASP factor expression in the female cells, appearing to be mildly pro-inflammatory (Figure 5; Supplementary Tables S3 and S4). Diethylstilboestrol caused an 89% increase in IL6 expression (p = 0.0057) and increased IL8 expression by 74% (p = 0.0062). Ethynyl estradiol caused a 54% increase in expression of CXCL1 (p = 0.0174). Levonorgestrel caused a very large effect in CXCL10 expression (a 14-fold increase, p = 0.0162) but it is important to note that gene expression of CXCL10 in the controls was very low. Levonorgestrel also elicited a 40% and an 42% increase in CXCL1 and IL12A expression, respectively (p = 0.0033 and 0.0148) No other SASP markers were altered in either the male or the female cells.
Splicing factor dysregulation is known to be a driver of senescence, and targeted restoration of splicing factor expression yields senomorphic effects [32]. We noted differences in the expression of splicing factor genes between the male and the female primary dermal fibroblasts in response to synthetic female sex hormones (Figure 6; Supplementary Tables S3 and S4). Diethylstilboestrol, ethynyl estradiol, and levonorgestrel induced a 55%, 50% and 62% increase in HNRNPK expression in male cells (p = 0.0029, 0.0060 and 0.0012, respectively), whereas diethylstilboestrol caused a 73% decrease in female cells (p = 0.0003). In male cells, ethynyl estradiol induced a 24% increase in SRSF6 expression (p = 0.0449) and levonorgestrel induced a 30% increase in TRA2B expression (p = 0.0361), but no effects on expression of either gene were observed in female cells. In female cells, ethynyl estradiol and levonorgestrel induced a 78% and 72% increase in the gene expression of the spliceosomal component, NOVA1 (p = 0.0065 and 0.0109, respectively), and induced a 44% and 42% increase in PNISR expression (p = 0.0372 and 0.0452, respectively), whereas male cells were unaffected.

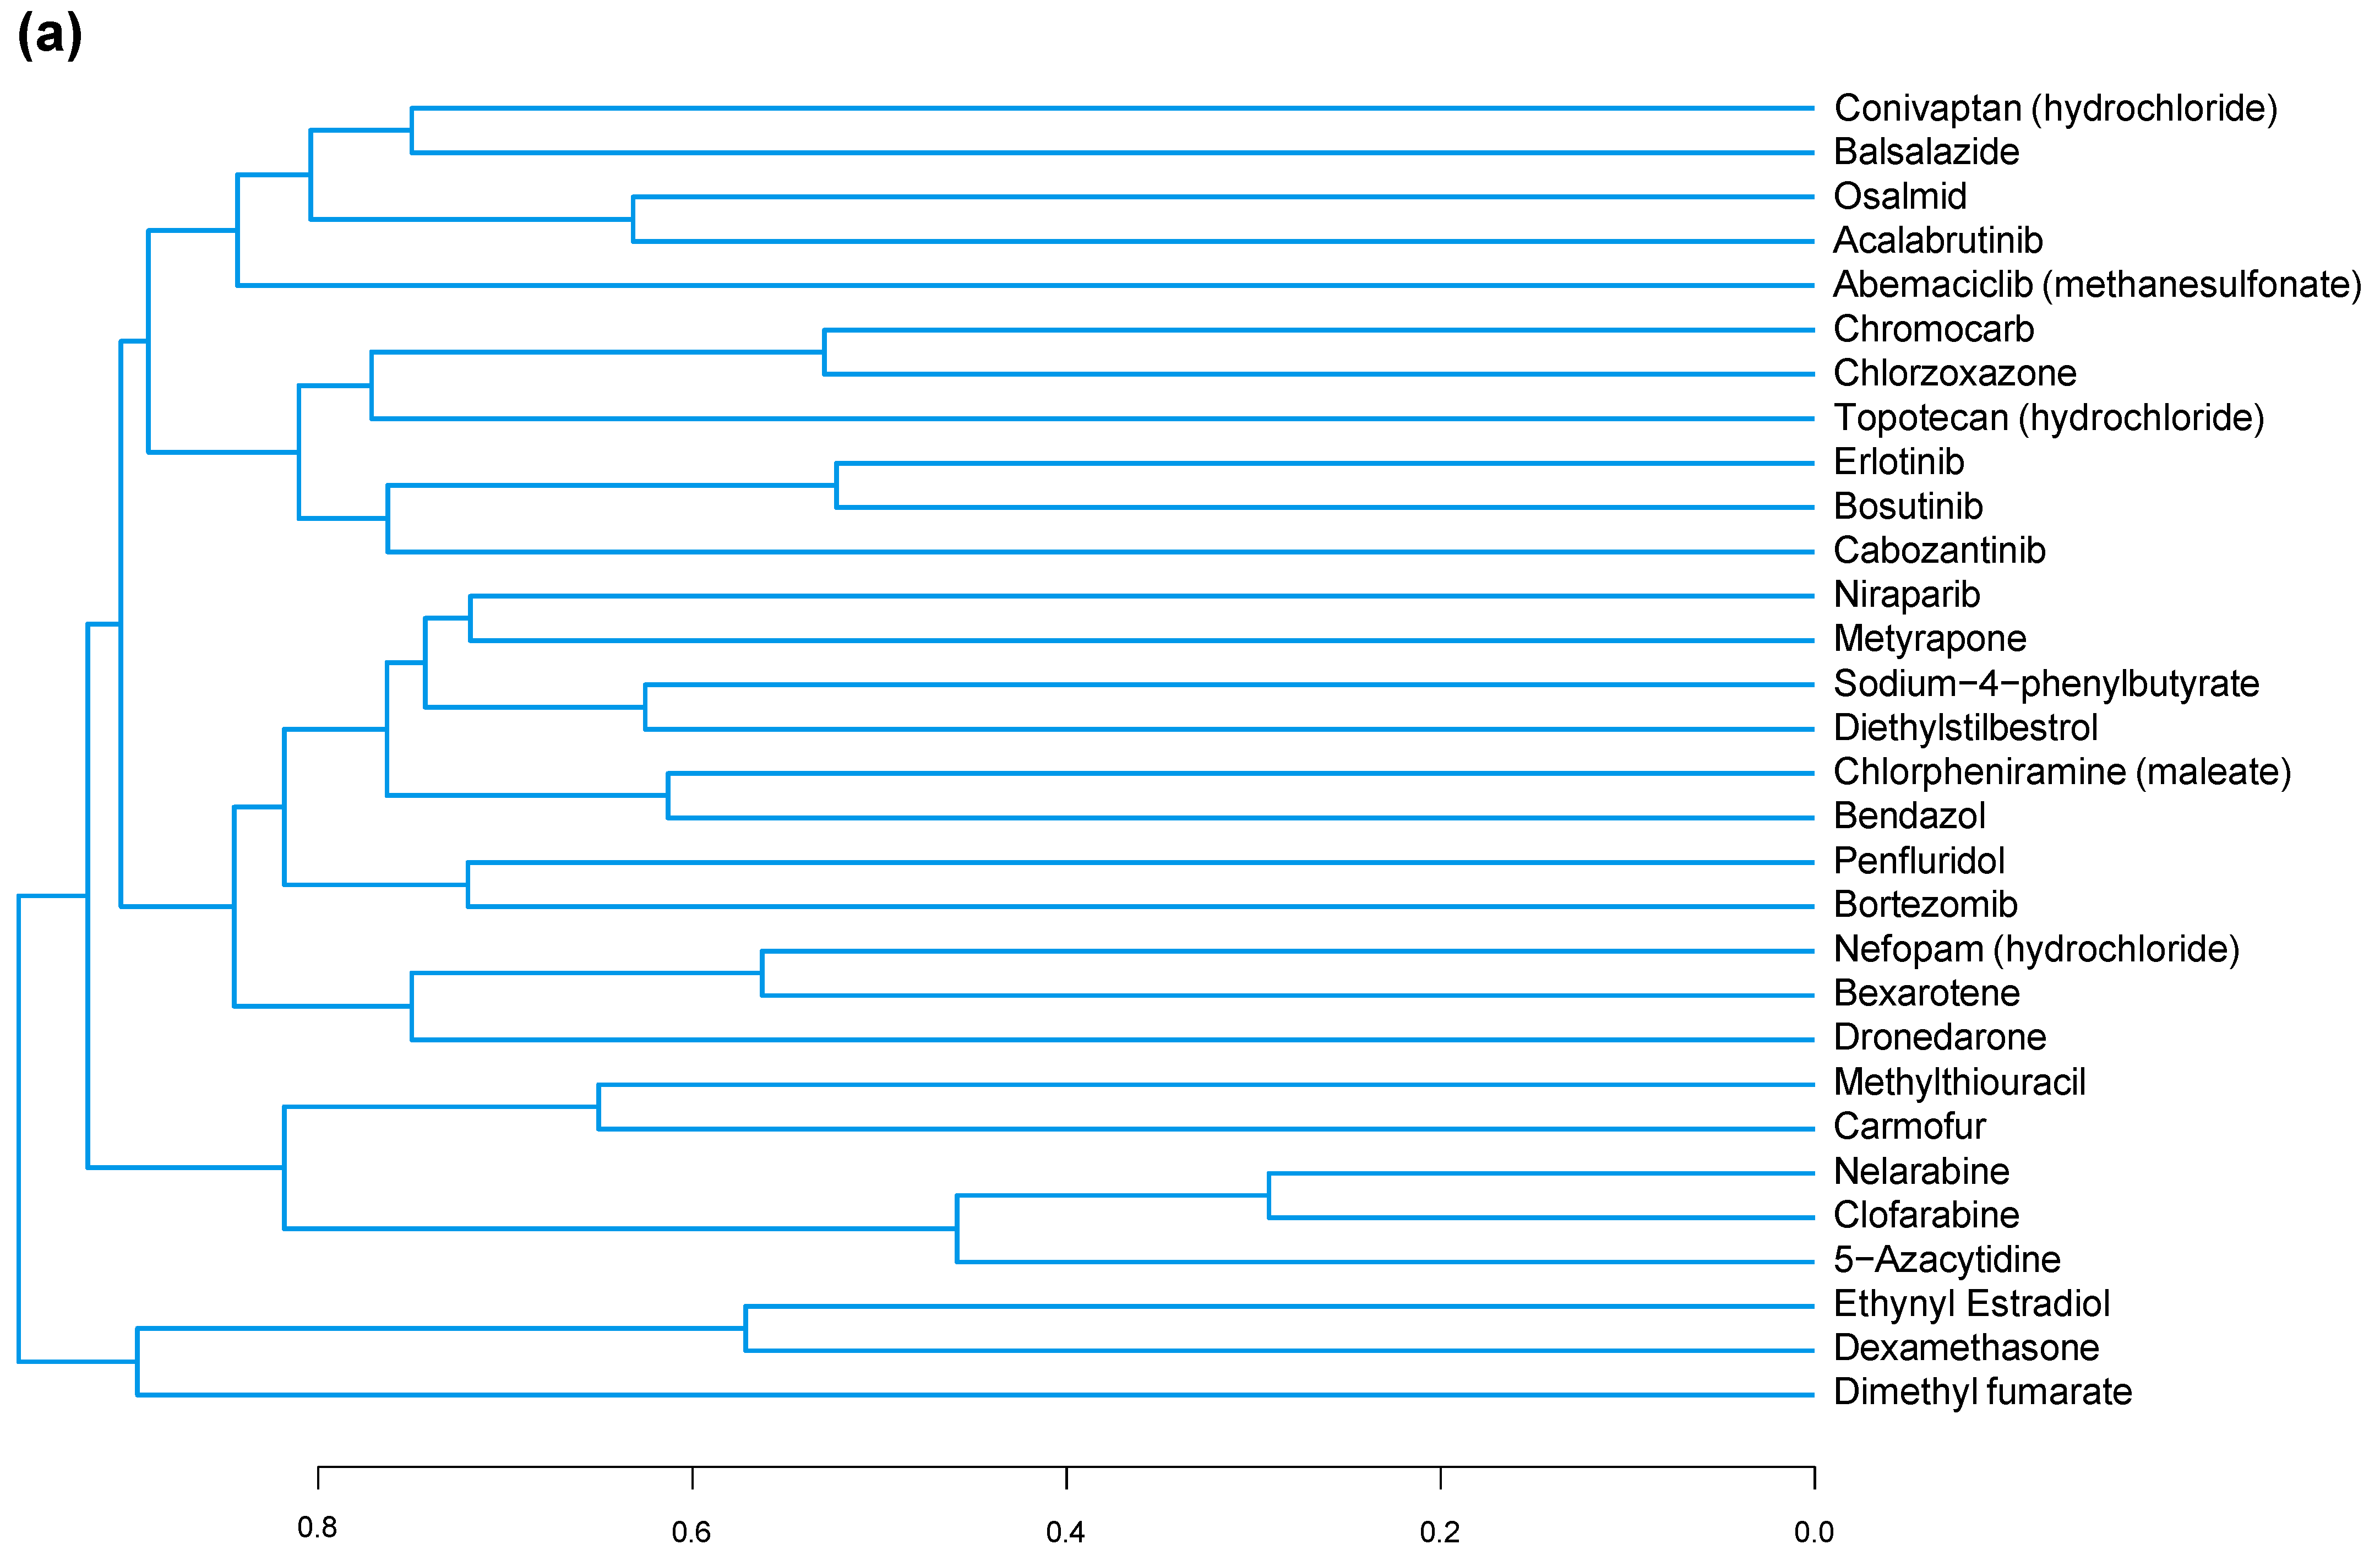
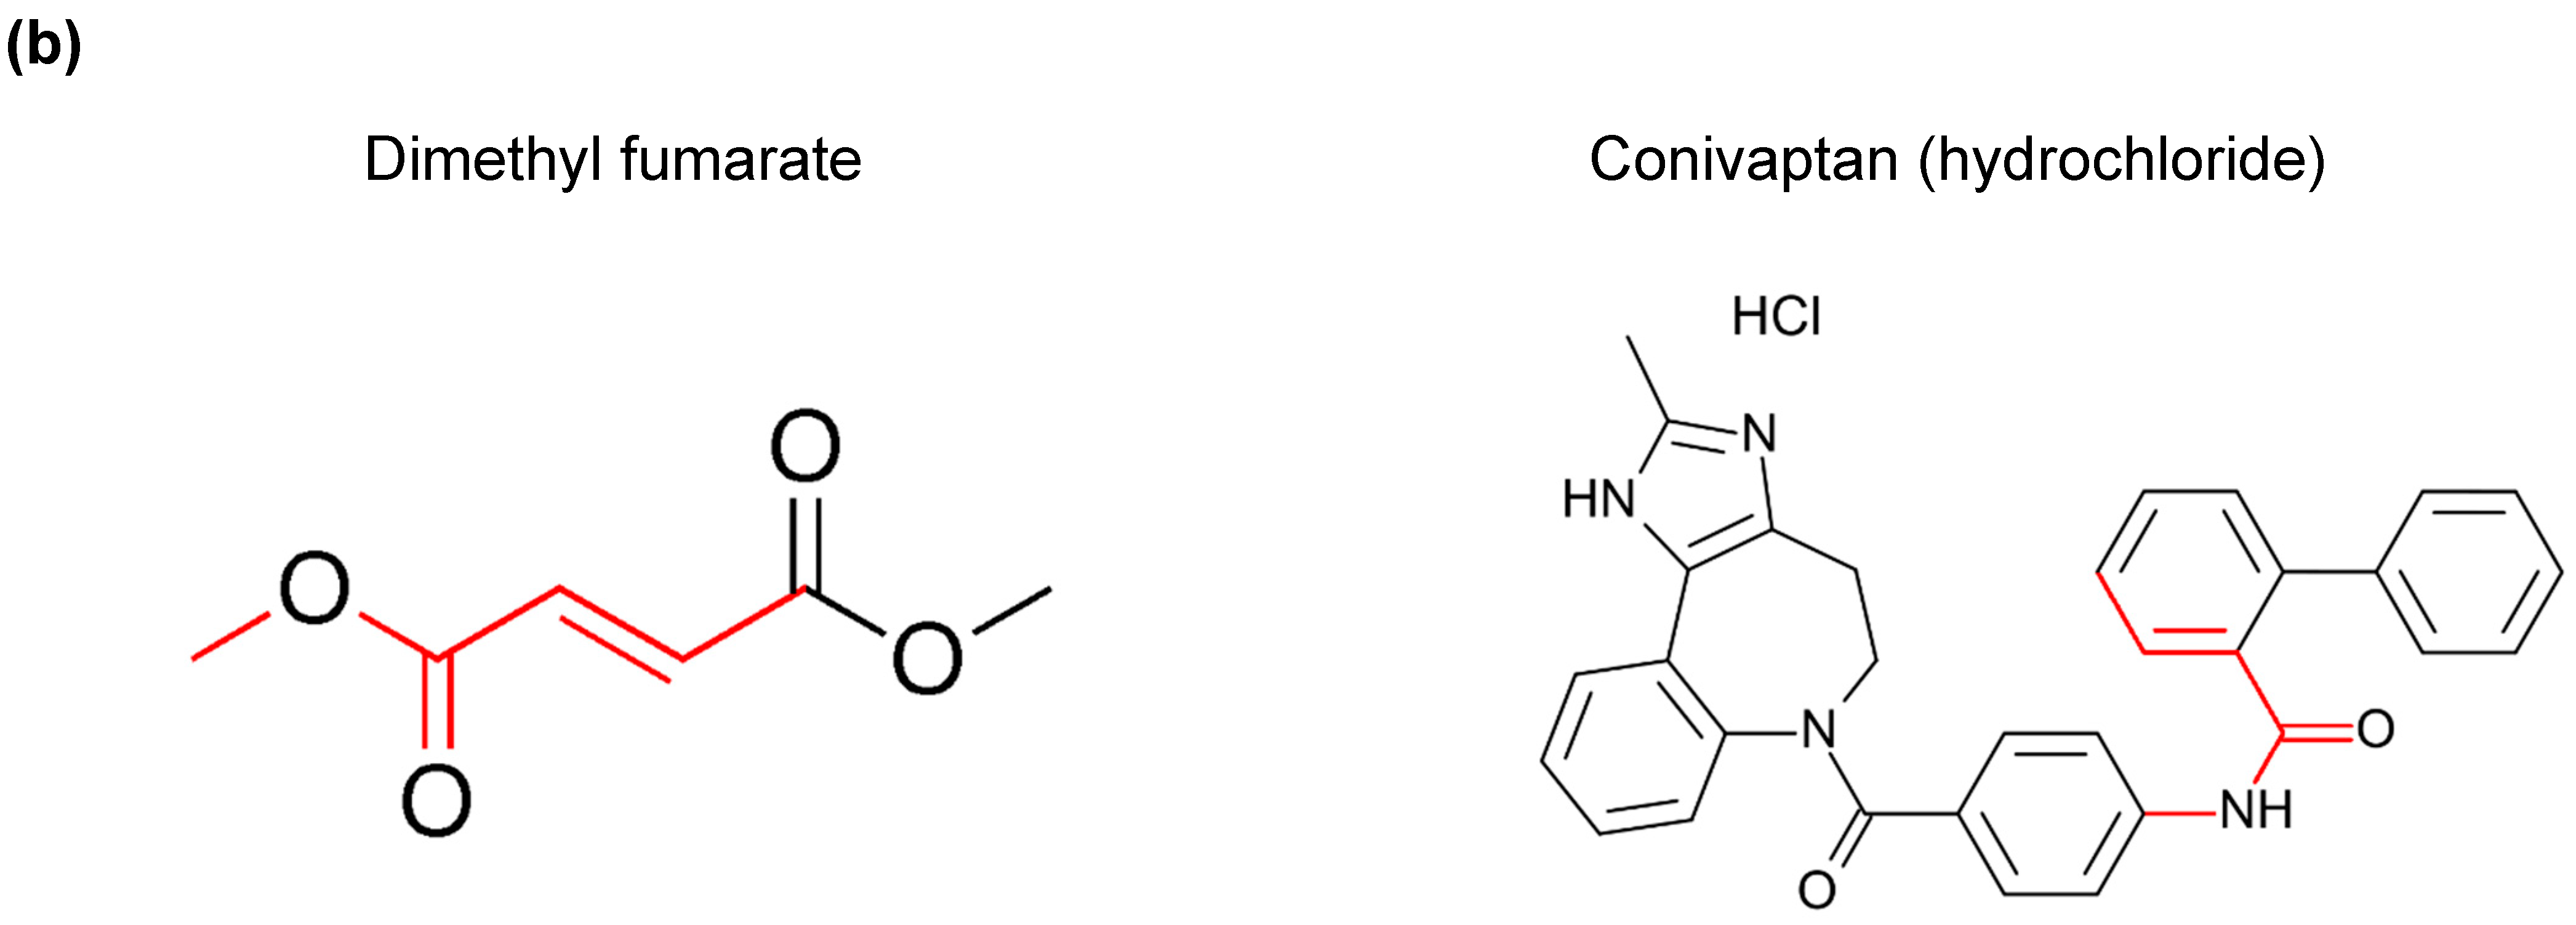
3.3. A Common Substructure Was Identified for Compounds That Decreased CDKN2A

A structure–function analysis was used to identify any substructure associated with compounds that were grouped by their functionality from the screens for CDKN2A gene expression and/or SAB activity. Prior to this analysis, methodological validation of the bioinformatic statistical approach indicated that the method is not very sensitive. Only the methodological validation test group consisting of 30 oestrogen receptor-targeting compounds (mean Tanimoto coefficient ± standard error of the mean (SEM); 0.3634 ± 0.007869, n = 900) versus 30 control compounds (0.1886 ± 0.005936, n = 900) was significantly different (p < 0.0001). Variations of the 30-compound validation test group with fewer oestrogenic compounds and more functionally unrelated compounds were not significant when compared against the control group: ten oestrogenic compounds (0.1877 ± 0.006082, n = 900, p = 0.9167), five oestrogenic compounds (0.1820 ± 0.006138, n = 900, p = 0.4418), three oestrogenic compounds (0.1885 ± 0.006182, n = 900, p = 0.9985), two oestrogenic compounds (0.1861 ± 0.006148, n = 900, p = 0.7690), and a group with zero oestrogenic compounds (0.1851 ± 0.006323, n = 900, p = 0.6895).
In total, 78 individual compounds (and the associated data on their effects on CDKN2A expression and/or SAB activity) were used to provide input for a structure–function analysis (Supplementary Figures S2–S4). The first test group consisted of the 30 compounds that decreased CDKN2A expression the most (averaged across both doses). Structures for this group are shown in Supplementary Figure S2. This test group (0.2107 ± 0.005580, n = 900) was significantly structurally different from the control group (0.1755 ± 0.006050, n = 900) with a p < 0.0001. A dendrogram was constructed to visualize the structural similarity of the compounds in the group in Figure 7a. The maximum common substructure between the two least similar compounds in the second test group is shown in red in Figure 7b.
The number of compounds that increased SAB activity (n = 3) was too small to be suitable for this type of analysis, but the number of compounds that decreased SAB activity was appropriate (n = 11). Sunitinib was omitted from the analysis as it caused mass cell death rather than acting to reduce senescence. Test group two therefore consisted of a group of ten compounds that decreased SAB activity (Supplementary Figure S3), and their Tanimoto coefficients were compared against the coefficients of a control group of ten compounds that did not have an effect on CDKN2A expression. The average Tanimoto coefficient was not significantly different in the test group (0.2928 ± 0.02544, n = 100) compared to the control group (0.2524 ± 0.02900, n = 100, p = 0.2964).
The third test group (Supplementary Figure S3) comprised the eight compounds that increased CDKN2A expression (above the mean ± 3 SDs criterion) when averaged across both doses. The average Tanimoto coefficient of this group (0.2817 ± 0.03492: mean ± SEM, n = 64) had no significant difference when compared against the average Tanimoto coefficient of eight compounds that had no effect on CDKN2A expression (0.2482 ± 0.03798, n = 64, p = 0.5169).

4. Discussion

We performed a drug repurposing screen on 240 FDA-approved molecules for effects on cellular senescence phenotypes. We identified 90 compounds that have effects on CDKN2A expression in human primary dermal fibroblasts, 11 of which bring about a reduction in senescent cell load and 3 of which increase senescent cell load as measured by SAB activity. Three of the compounds that reduce senescent cell load are the synthetic female sex hormones diethylstilboestrol, ethynyl estradiol and levonorgestrel, which exert senotherapeutic effects in male dermal fibroblasts, but not in female cells, where their effects are mildly inflammatory. Finally, we have identified a chemical substructure associated with reduced CDKN2A expression. Our findings are important for future research into drugs to target the molecular basis of ageing, as they indicate that some senotherapeutic effects may be specific to certain donor characteristics, e.g., sex, which has major implications for therapeutic screening cascades and eventual population level treatment options.
Several of the compounds that we identified as having effects on senescence phenotypes are frequently prescribed or are common household drugs, some of which have also been previously linked with pathways associated with ageing. Aspirin, for example has been shown to extend lifespan in mice [33], metyrapone is an 11β-hydroxylase inhibitor known to activate autophagy [34,35] and penfluridol, a potent antipsychotic medication, has been shown to increase lifespan in Drosophila melanogaster [36]. Several known senotherapeutic compounds (dasatinib (hydrochloride), metformin (hydrochloride), resveratrol and trametinib) were not amongst the largest effects on CDKN2A, suggesting that smaller effects could also be worth examining in similar screens in the future. In the primary screen, we observed that some drug classes had interesting effects on senescence, suggesting that more research is needed into these effects as it may be that certain drugs are more (or less) suitable for use in older patients due to their effects on senescence. Unsurprisingly, we detected effects on senescence kinetics for drugs used in the treatment of cancer, but perhaps less predictably, we also detected effects for antidepressant drugs, anticonvulsant drugs, and female synthetic sex hormones.
Our study has identified a maximum common structural motif that was present even in molecules with very little other structural similarity. This compares well with work in the literature from Olascoaga-Del Angel et al., where several chemotypes associated with senomorphic or senolytic properties were identified [37]. The maximum common substructure that we identified was also common across 11 of the 13 structures in their larger-scale analysis [37]. This finding is strengthened when we consider that the new approach used for the identification of structural similarities was not very sensitive, as noted during the methodology validation.
Diethylstilboestrol, ethynyl estradiol and levonorgestrel were all associated with a decrease in CDKN2A expression in male cells. These drugs are commonly used in hormone replacement therapy, contraceptives or as oncodrugs [38,39]. Female hormones are associated with protective benefits in ageing [40,41,42], and there is some evidence of sex differences in senescence-associated phenotypes [43,44,45,46,47,48,49,50,51,52,53]. It is clear that being biologically female offers protective benefits against ageing [46,54], and the two main female hormones, oestrogen and progesterone, are known to be involved in many ageing and senescence-related pathways [47,55,56,57,58]. The typical nuclear receptors for these two hormones, the oestrogen receptors (ERα and ERβ) and progesterone receptors (PR-A and PR-B) are involved in the same pathways [57,59]. There is comparatively little information about the senotherapeutic properties of synthetic female sex hormones in humans [48,60,61]; most research has been carried out in mouse models treated with synthetic oestrogens [58,62,63,64].
We found differences in SAB positivity, expression of splicing factors and expression of mRNAs encoding SASP proteins between male and female cells in response to female sex hormones. Sex differences in drug responses are not uncommon, and a sexual dimorphism has been reported in mice in response to senotherapeutics [65,66]. Recently, the NIA Interventions Testing Program in mice has revealed sex differences in effects on longevity in response to 17-α-estradiol and aspirin [67,68]. Anthropometric parameters such as bodyweight, fat distribution, and differences in pharmacokinetics and pharmacodynamics may mean that women are more sensitive to some drugs, have altered clearance kinetics and may experience more drug interactions [69]. In humans, oestrogen and progesterone are endogenous to both sexes, but differ in their circulating levels [70,71]. Unlike progesterone, there are many forms of oestrogen: estrone (E1), estradiol (E2), estriol (E3), and other minor oestrogens, but the major oestrogen is E2. This has two isoforms: 17α-estradiol and the more potent and biologically-most relevant 17β-estradiol [59,72]. Oestrogens are discussed more often than progesterones in relation to senescence, but in this study levonorgestrel, a progesterone, had a larger effect on senescence than the oestrogens. Diethylstilboestrol decreased proliferation in male cells, which is at odds with oestrogen’s often growth-inducing effects, e.g., during the female pubertal growth spurt [70]. Ethynyl estradiol caused an increase in BCL2 expression in female cells only, but did not affect other markers of apoptosis or DNA damage. At this time, it is not clear whether the observed sex differences arise from differences in bioavailability, or from an undescribed non-canonical role of the hormones over and above canonical oestrogen/progesterone signaling, particularly given the senomorphic effect occurs with treatment of either a synthetic oestrogen or a progesterone. The classical signaling pathways for both oestrogen and progesterone feature the hormone and its respective nuclear receptor(s) acting as ligand-activated transcription factors. The complex binds to hormone responsive elements (HREs) in the genome to control gene expression. There are many HREs across the genome, for example there are over 70,000 oestrogen-responsive-elements identified [73]. Both hormones can act via other pathways, including membrane bound GPCRs. Activation of their respective GPCRs can activate cell fate pathways such as Ras/Raf/MEK/ERK and PI3K/Akt, as well as cross-signaling with classical hormonal signaling pathways [74,75]. Both pathways have previously been implicated in senescence in human cells [21] and in lifespan in invertebrate models [76]. Differing expression, activity and/or sensitivity of receptors between the sexes might also be factoring into the senotherapeutic effect observed in this study. Another consideration is that the female fibroblasts used in our study were donated by a pre-menopausal woman: it is possible that cells from women who are undergoing or have gone through the menopause may have differing responses to synthetic female hormones, or indeed they may have a similar effect compared to the effect seen in the male cells.
Translating the findings of repurposing screens into the clinic needs careful consideration. When considering these compounds in vivo, dosage is also a factor. Many compounds associated with senomorphic effect display biphasic dose responses, which may arise from the autoregulatory relationships between the affected genes and pathways [21]. It is therefore possible that repeated exposure and/or higher/lower dosage may have different effects in a systemic setting. It is also possible that the effects may be tissue specific and/or donor-specific: future studies should use multiple cell types from multiple donors of different sexes. Repurposing drugs identified to have senotherapeutic effect may also not be clinically feasible as severe side effects may alter the risk-benefit relationship for milder age-related diseases. The three female synthetic hormones identified in this study do not currently offer a potential clinical application as a mainstream senotherapeutic drug as the effect is not observed in females who routinely take the medicines, and males taking the hormones may have feminising side-effects. Indeed, diethylstilboestrol has been linked with transgenerational cancers and may not be appropriate in the context of senotherapeutics.

5. Conclusions

Our work demonstrates the utility of repurposing screens, combined with bioinformatic structure–function analyses to identify chemical structures that may be suitable for eventual senotherapeutic benefit. Our study suggests that the sexual dimorphisms in senomorphic/geroprotective effects in animal models may also exist in human cells. We identify several compounds of interest for future senotherapeutic research in the screen including the three female synthetic hormones. We use a new approach to also identify a chemical substructure associated with a decrease in senescence. Our work also highlights the need for patient characteristics such as biological sex to be taken into consideration even in early in vitro pre-clinical work; high throughput screening cascades are often carried out using a single clone of a well characterized transformed cell line, and other senotherapeutic compounds may be sex-specific. This statement could equally be applied to other individual anthropometric or genetic characteristics. Biological sex in in vitro experiments can cause dimorphic effects and this should be considered more regularly when designing experiments, particularly in the process of investigating senotherapeutic compounds. The easiest cell type may not always be the best candidate for such screens. However, provided that studies are designed appropriately to factor in donor characteristics such as sex, repurposing remains a potent mechanism for identifying new jobs for old drugs.

Supplementary Materials

The following supporting information can be downloaded at: https://www.mdpi.com/article/10.3390/cells13060517/s1, Figure S1: Descriptive data for the drug panel for the senescence screen. Figure S2: The chemical structures of compounds that decreased senescent cell load. Figure S3: Chemical structures of compounds that decreased senescent cell load. Figure S4: The chemical structures of compounds that increased senescent cell load. Figure S5: Dendrogram indicating structure-function similarity for compounds influencing senescence. Figure S6: Dendrogram indicating structure-function similarity for compounds influencing senescence. Table S1: Information on compound synonyms, targets and pathways used in a screen for CDKN2A gene expression. Table S2: Statistics of the percentage of cells stained for biomarkers in female (F) and male (M) dermal fibroblast cells treated with female synthetic hormones at 10 µM or a DMSO-only control. Table S3: Gene expression data in female (F) dermal fibroblast cells treated with female synthetic hormones at 10 µM or a DMSO-only control. Table S4: Gene expression data in male (M) dermal fibroblast cells treated with female synthetic hormones at 10 µM or a DMSO-only control.

Author Contributions

L.R.B. designed the experiment, performed laboratory work, data analysis and prepared the manuscript. R.F. performed laboratory work and helped prepare the manuscript. L.W.H. provided overall oversight and managed the project. All authors have read and agreed to the published version of the manuscript.

Funding

The authors gratefully acknowledge funding from Animal Free Research UK. No reagents containing animal-derived biomaterials were purchased with this grant.

Institutional Review Board Statement

This work was performed with commercially sourced cell lines from donors, and as such, ethical requirements were fulfilled at source.

Informed Consent Statement

Not applicable.

Data Availability Statement

The original contributions presented in the study are included in the article/Supplementary Materials, further inquiries can be directed to the corresponding author/s.

Acknowledgments

This research was supported by the National Institute for Health and Care Research (NIHR) Exeter Biomedical Research Centre (BRC). The views expressed are those of the author(s) and not necessarily those of the NIHR or the Department of Health and Social Care.

Conflicts of Interest

L.W.H. is an inventor on the patent PCT/GB2019/052125, and is a founder, chief scientific officer, and research and development lead for SENISCA, Ltd. L.R.B. and R.F. have no financial interest to declare in relation to the content of this manuscript.

References

  1. Terzi, M.Y.; Izmirli, M.; Gogebakan, B. The Cell Fate: Senescence or Quiescence. Mol. Biol. Rep. 2016, 43, 1213–1220. [Google Scholar] [CrossRef] [PubMed]
  2. Tigges, J.; Krutmann, J.; Fritsche, E.; Haendeler, J.; Schaal, H.; Fischer, J.W.; Kalfalah, F.; Reinke, H.; Reifenberger, G.; Stühler, K.; et al. The Hallmarks of Fibroblast Ageing. Mech. Ageing Dev. 2014, 138, 26–44. [Google Scholar] [CrossRef] [PubMed]
  3. Muñoz-Espín, D.; Cañamero, M.; Maraver, A.; Gómez-López, G.; Contreras, J.; Murillo-Cuesta, S.; Rodríguez-Baeza, A.; Varela-Nieto, I.; Ruberte, J.; Collado, M.; et al. Programmed Cell Senescence during Mammalian Embryonic Development. Cell 2013, 155, 1104. [Google Scholar] [CrossRef] [PubMed]
  4. Storer, M.; Mas, A.; Robert-Moreno, A.; Pecoraro, M.; Ortells, M.C.; Di Giacomo, V.; Yosef, R.; Pilpel, N.; Krizhanovsky, V.; Sharpe, J.; et al. Senescence Is a Developmental Mechanism That Contributes to Embryonic Growth and Patterning. Cell 2013, 155, 1119–1130. [Google Scholar] [CrossRef]
  5. Hayflick, L.; Moorhead, P.S. The Serial Cultivation of Human Diploid Cell Strains. Exp. Cell Res. 1961, 25, 585–621. [Google Scholar] [CrossRef]
  6. Toussaint, O.; Remacle, J.; Dierick, J.F.; Pascal, T.; Frippiat, C.; Zdanov, S.; Magalhaes, J.P.; Royer, V.; Chainiaux, F. From the Hayflick Mosaic to the Mosaics of Ageing. Role of Stress-Induced Premature Senescence in Human Ageing. Int. J. Biochem. Cell Biol. 2002, 34, 1415–1429. [Google Scholar] [CrossRef]
  7. Serrano, M.; Lin, A.W.; McCurrach, M.E.; Beach, D. Oncogenic Ras Provokes Premature Cell Senescence Associated with Accumulation of P53 and P16 INK4a. Cell 1997, 88, 593–602. [Google Scholar] [CrossRef]
  8. Niedernhofer, L.J.; Robbins, P.D. Senotherapeutics for Healthy Ageing. Nat. Rev. Drug Discov. 2018, 17, 377. [Google Scholar] [CrossRef]
  9. Lee, B.P.; Harries, L.W. Senotherapeutic Drugs: A New Avenue for Skincare? Plast. Reconstr. Surg. 2021, 148, 21S–26S. [Google Scholar] [CrossRef]
  10. Kirkland, J.L.; Tchkonia, T.; Zhu, Y.; Niedernhofer, L.J.; Robbins, P.D. The Clinical Potential of Senolytic Drugs. J. Am. Geriatr. Soc. 2017, 65, 2297–2301. [Google Scholar] [CrossRef]
  11. Baker, D.J.; Wijshake, T.; Tchkonia, T.; Lebrasseur, N.K.; Childs, B.G.; Van De Sluis, B.; Kirkland, J.L.; Van Deursen, J.M. Clearance of P16 Ink4a-Positive Senescent Cells Delays Ageing-Associated Disorders. Nature 2011, 479, 232–236. [Google Scholar] [CrossRef]
  12. Baker, D.J.; Childs, B.G.; Durik, M.; Wijers, M.E.; Sieben, C.J.; Zhong, J.; Saltness, R.A.; Jeganathan, K.B.; Verzosa, G.C.; Pezeshki, A.; et al. Naturally Occurring P16Ink4a-Positive Cells Shorten Healthy Lifespan. Nature 2016, 530, 184–189. [Google Scholar] [CrossRef]
  13. Gu, Y.; Avolio, E.; Alvino, V.V.; Thomas, A.C.; Herman, A.; Miller, P.J.; Sullivan, N.; Faulkner, A.; Madeddu, P. The Tyrosine Kinase Inhibitor Dasatinib Reduces Cardiac Steatosis and Fibrosis in Obese, Type 2 Diabetic Mice. Cardiovasc. Diabetol. 2023, 22, 214. [Google Scholar] [CrossRef]
  14. Krzystyniak, A.; Wesierska, M.; Petrazzo, G.; Gadecka, A.; Dudkowska, M.; Bielak-Zmijewska, A.; Mosieniak, G.; Figiel, I.; Wlodarczyk, J.; Sikora, E. Combination of Dasatinib and Quercetin Improves Cognitive Abilities in Aged Male Wistar Rats, Alleviates Inflammation and Changes Hippocampal Synaptic Plasticity and Histone H3 Methylation Profile. Aging 2022, 14, 572–595. [Google Scholar] [CrossRef]
  15. Dungan, C.M.; Murach, K.A.; Zdunek, C.J.; Tang, Z.J.; Nolt, G.L.; Brightwell, C.R.; Hettinger, Z.; Englund, D.A.; Liu, Z.; Fry, C.S.; et al. Deletion of SA Β-Gal+ Cells Using Senolytics Improves Muscle Regeneration in Old Mice. Aging Cell 2022, 21, e13528. [Google Scholar] [CrossRef] [PubMed]
  16. Hickson, L.J.; Langhi Prata, L.G.P.; Bobart, S.A.; Evans, T.K.; Giorgadze, N.; Hashmi, S.K.; Herrmann, S.M.; Jensen, M.D.; Jia, Q.; Jordan, K.L.; et al. Senolytics Decrease Senescent Cells in Humans: Preliminary Report from a Clinical Trial of Dasatinib plus Quercetin in Individuals with Diabetic Kidney Disease. EBioMedicine 2019, 47, 446–456. [Google Scholar] [CrossRef] [PubMed]
  17. Justice, J.N.; Nambiar, A.M.; Tchkonia, T.; Lebrasseur, N.K.; Pascual, R.; Hashmi, S.K.; Prata, L.; Masternak, M.M.; Kritchevsky, S.B.; Musi, N.; et al. Senolytics in Idiopathic Pulmonary Fibrosis: Results from a First-in-Human, Open-Label, Pilot Study. EBioMedicine 2019, 40, 554–563. [Google Scholar] [CrossRef] [PubMed]
  18. Gonzales, M.M.; Garbarino, V.R.; Kautz, T.F.; Palavicini, J.P.; Lopez-Cruzan, M.; Dehkordi, S.K.; Mathews, J.J.; Zare, H.; Xu, P.; Zhang, B.; et al. Senolytic Therapy in Mild Alzheimer’s Disease: A Phase 1 Feasibility Trial. Nat. Med. 2023, 29, 2481–2488. [Google Scholar] [CrossRef]
  19. Latorre, E.; Torregrossa, R.; Wood, M.E.; Whiteman, M.; Harries, L.W. Mitochondria-Targeted Hydrogen Sulfide Attenuates Endothelial Senescence by Selective Induction of Splicing Factors HNRNPD and SRSF2. Aging 2018, 10, 1666–1681. [Google Scholar] [CrossRef] [PubMed]
  20. Hay, M.; Thomas, D.W.; Craighead, J.L.; Economides, C.; Rosenthal, J. Clinical Development Success Rates for Investigational Drugs. Nat. Biotechnol. 2014, 32, 40–51. [Google Scholar] [CrossRef]
  21. Latorre, E.; Ostler, E.L.; Faragher, R.G.A.; Harries, L.W. FOXO1 and ETV6 Genes May Represent Novel Regulators of Splicing Factor Expression in Cellular Senescence. FASEB J. 2019, 33, 1086–1097. [Google Scholar] [CrossRef]
  22. Latorre, E.; Birar, V.C.; Sheerin, A.N.; Jeynes, J.C.C.; Hooper, A.; Dawe, H.R.; Melzer, D.; Cox, L.S.; Faragher, R.G.A.; Ostler, E.L.; et al. Small Molecule Modulation of Splicing Factor Expression Is Associated with Rescue from Cellular Senescence. BMC Cell Biol. 2017, 18, 31. [Google Scholar] [CrossRef]
  23. Barra, V.; Chiavetta, R.F.; Titoli, S.; Provenzano, I.M.; Carollo, P.S.; Di Leonardo, A. Specific Irreversible Cell-Cycle Arrest and Depletion of Cancer Cells Obtained by Combining Curcumin and the Flavonoids Quercetin and Fisetin. Genes 2022, 13, 1125. [Google Scholar] [CrossRef]
  24. Xie, F.; Xiao, P.; Chen, D.; Xu, L.; Zhang, B. MiRDeepFinder: A MiRNA Analysis Tool for Deep Sequencing of Plant Small RNAs. Plant Mol. Biol. 2012, 80, 75–84. [Google Scholar] [CrossRef]
  25. Pfaffl, M.W. A New Mathematical Model for Relative Quantification in Real-Time RT–PCR. Nucleic Acids Res. 2001, 29, 2002–2007. [Google Scholar] [CrossRef]
  26. Schneider, C.A.; Rasband, W.S.; Eliceiri, K.W. NIH Image to ImageJ: 25 Years of Image Analysis. Nat. Methods 2012, 9, 671–675. [Google Scholar] [CrossRef] [PubMed]
  27. Kim, Y.K.; Yeo, J.; Kim, B.; Ha, M.; Kim, V.N. Short Structured RNAs with Low GC Content Are Selectively Lost during Extraction from a Small Number of Cells. Mol. Cell 2012, 46, 893–895. [Google Scholar] [CrossRef] [PubMed]
  28. Cao, Y.; Charisi, A.; Cheng, L.C.; Jiang, T.; Girke, T. ChemmineR: A Compound Mining Framework for R. Bioinformatics 2008, 24, 1733–1734. [Google Scholar] [CrossRef] [PubMed]
  29. Backman, T.W.H.; Cao, Y.; Girke, T. ChemMine Tools: An Online Service for Analyzing and Clustering Small Molecules. Nucleic Acids Res. 2011, 39, 486–491. [Google Scholar] [CrossRef] [PubMed]
  30. Wang, Y.; Backman, T.W.H.; Horan, K.; Girke, T. FmcsR: Mismatch Tolerant Maximum Common Substructure Searching in R. Bioinformatics 2013, 29, 2792–2794. [Google Scholar] [CrossRef] [PubMed]
  31. RStudio Team RStudio: Integrated Development Environment for R 2020.RStudio: Integrated Development for R. RStudio, PBC, Boston, MA, USA. Available online: http://www.rstudio.com/ (accessed on 25 January 2024).
  32. Holly, A.C.; Melzer, D.; Pilling, L.C.; Fellows, A.C.; Tanaka, T.; Ferrucci, L.; Harries, L.W. Changes in Splicing Factor Expression Are Associated with Advancing Age in Man. Mech. Ageing Dev. 2013, 134, 356–366. [Google Scholar] [CrossRef] [PubMed]
  33. Strong, R.; Miller, R.A.; Astle, C.M.; Floyd, R.A.; Flurkey, K.; Hensley, K.L.; Javors, M.A.; Leeuwenburgh, C.; Nelson, J.F.; Ongini, E.; et al. Nordihydroguaiaretic Acid and Aspirin Increase Lifespan of Genetically Heterogeneous Male Mice. Aging Cell 2008, 7, 641–650. [Google Scholar] [CrossRef]
  34. Jahn, H.; Schick, M.; Kiefer, F.; Kellner, M.; Yassouridis, A.; Wiedemann, K. Metyrapone as Additive Treatment in Major Depression: A Double-Blind and Placebo-Controlled Trial. Arch. Gen. Psychiatry 2004, 61, 1235–1244. [Google Scholar] [CrossRef] [PubMed]
  35. Holczer, M.; Márton, M.; Kurucz, A.; Bánhegyi, G.; Kapuy, O. A Comprehensive Systems Biological Study of Autophagy-Apoptosis Crosstalk during Endoplasmic Reticulum Stress. BioMed Res. Int. 2015, 2015, 319589. [Google Scholar] [CrossRef] [PubMed]
  36. Kang, H.L.; Benzer, S.; Min, K.T. Life Extension in Drosophila by Feeding a Drug. Proc. Natl. Acad. Sci. USA 2002, 99, 838–843. [Google Scholar] [CrossRef] [PubMed]
  37. Olascoaga-Del Angel, K.S.; Gutierrez, H.; Königsberg, M.; Pérez-Villanueva, J.; López-Diazguerrero, N.E. Exploring the Fuzzy Border between Senolytics and Senomorphics with Chemoinformatics and Systems Pharmacology. Biogerontology 2022, 23, 453–471. [Google Scholar] [CrossRef] [PubMed]
  38. FSRH. FSRH Clinical Guideline: Combined Hormonal Contraception; FSRH: London, UK, 2020; Volume 2019. [Google Scholar]
  39. Joint Formulary Committee Diethylstilbestrol. British National Formulary. 2024. Available online: https://bnf.nice.org.uk/drugs/diethylstilbestrol/ (accessed on 25 January 2024).
  40. Pike, C.J. Sex and the Development of Alzheimer’s Disease. J. Neurosci. Res. 2017, 95, 671–680. [Google Scholar] [CrossRef]
  41. Tramunt, B.; Smati, S.; Grandgeorge, N.; Lenfant, F.; Arnal, J.F.; Montagner, A.; Gourdy, P. Sex Differences in Metabolic Regulation and Diabetes Susceptibility. Diabetologia 2020, 63, 453–461. [Google Scholar] [CrossRef]
  42. Regitz-Zagrosek, V.; Kararigas, G. Mechanistic Pathways of Sex Differences in Cardiovascular Disease. Physiol. Rev. 2017, 97, 1–37. [Google Scholar] [CrossRef]
  43. Ruggierii, A.; Anticoli, S.; D’ambrosio, A.; Giordani, L.; Mora, M. The Influence of Sex and Gender on Immunity, Infection and Vaccination. Ann. Ist. Super. Sanita 2016, 52, 198–204. [Google Scholar] [CrossRef]
  44. Borrás, C.; Sastre, J.; García-Sala, D.; Lloret, A.; Pallardó, F.V.; Viña, J. Mitochondria from Females Exhibit Higher Antioxidant Gene Expression and Lower Oxidative Damage than Males. Free Radic. Biol. Med. 2003, 34, 546–552. [Google Scholar] [CrossRef]
  45. Han, Y.; Wennersten, S.A.; Wright, J.M.; Ludwig, R.W.; Lau, E.; Lam, M.P.Y. Proteogenomics Reveals Sex-Biased Aging Genes and Coordinated Splicing in Cardiac Aging. Am. J. Physiol. Heart Circ. Physiol. 2022, 323, H538–H558. [Google Scholar] [CrossRef]
  46. Hägg, S.; Jylhävä, J. Sex Differences in Biological Aging with a Focus on Human Studies. eLife 2021, 10, e63425. [Google Scholar] [CrossRef]
  47. Rubin, J.B.; Lagas, J.S.; Broestl, L.; Sponagel, J.; Rockwell, N.; Rhee, G.; Rosen, S.F.; Chen, S.; Klein, R.S.; Imoukhuede, P.; et al. Sex Differences in Cancer Mechanisms. Biol. Sex Differ. 2020, 11, 17. [Google Scholar] [CrossRef]
  48. Ng, M.; Hazrati, L.N. Evidence of Sex Differences in Cellular Senescence. Neurobiol. Aging 2022, 120, 88–104. [Google Scholar] [CrossRef]
  49. Yousefzadeh, M.J.; Zhao, J.; Bukata, C.; Wade, E.A.; McGowan, S.J.; Angelini, L.A.; Bank, M.P.; Gurkar, A.U.; McGuckian, C.A.; Calubag, M.F.; et al. Tissue Specificity of Senescent Cell Accumulation during Physiologic and Accelerated Aging of Mice. Aging Cell 2020, 19, e13094. [Google Scholar] [CrossRef]
  50. Waskar, M.; Landis, G.N.; Shen, J.; Curtis, C.; Tozer, K.; Abdueva, D.; Skvortsov, D.; Tavaré, S.; Tower, J. Drosophila Melanogaster P53 Has Developmental Stage-specific and Sex-specific Effects on Adult Life Span Indicative of Sexual Antagonistic Pleiotropy. Aging 2009, 1, 903–936. [Google Scholar] [CrossRef]
  51. Rall-Scharpf, M.; Friedl, T.W.P.; Biechonski, S.; Denkinger, M.; Milyavsky, M.; Wiesmüller, L. Sex-Specific Differences in DNA Double-Strand Break Repair of Cycling Human Lymphocytes during Aging. Aging 2021, 13, 21066–21089. [Google Scholar] [CrossRef] [PubMed]
  52. Trzeciak, A.R.; Barnes, J.; Ejiogu, N.; Foster, K.; Brant, L.J.; Zonderman, A.B.; Evans, M.K. Age, Sex, and Race Influence Single-Strand Break Repair Capacity in a Human Population NIH Public Access. Free Radic. Biol. Med. 2008, 45, 1631–1641. [Google Scholar] [CrossRef] [PubMed]
  53. Groß, S.; Mmel, U.-D.; Klintschar, M.; Bartel, F. Germline Genetics of the P53 Pathway Affect Longevity in a Gender Specific Manner. Curr. Aging Sci. 2014, 7, 91–100. [Google Scholar] [CrossRef] [PubMed]
  54. Rochelle, T.L.; Yeung, D.K.Y.; Bond, M.H.; Li, L.M.W. Predictors of the Gender Gap in Life Expectancy across 54 Nations. Psychol. Health Med. 2015, 20, 129–138. [Google Scholar] [CrossRef]
  55. Sasaki, Y.; Ikeda, Y.; Miyauchi, T.; Uchikado, Y.; Akasaki, Y.; Ohishi, M. Estrogen-Sirt1 Axis Plays a Pivotal Role in Protecting Arteries against Menopause-Induced Senescence and Atherosclerosis. J. Atheroscler. Thromb. 2020, 27, 47–59. [Google Scholar] [CrossRef] [PubMed]
  56. Vernier, M.; Giguère, V. Aging, Senescence and Mitochondria: The PGC-1/ERR Axis. J. Mol. Endocrinol. 2021, 66, R1–R14. [Google Scholar] [CrossRef] [PubMed]
  57. Diep, C.H.; Charles, N.J.; Gilks, C.B.; Kalloger, S.E.; Argenta, P.A.; Lange, C.A. Progesterone Receptors Induce FOXO1-Dependent Senescence in Ovarian Cancer Cells. Cell Cycle 2013, 12, 1433–1449. [Google Scholar] [CrossRef] [PubMed]
  58. Harrison, D.E.; Strong, R.; Reifsnyder, P.; Kumar, N.; Fernandez, E.; Flurkey, K.; Javors, M.A.; Lopez-Cruzan, M.; Macchiarini, F.; Nelson, J.F.; et al. 17-a-Estradiol Late in Life Extends Lifespan in Aging UM-HET3 Male Mice; Nicotinamide Riboside and Three Other Drugs Do Not Affect Lifespan in Either Sex. Aging Cell 2021, 20, e13328. [Google Scholar] [CrossRef] [PubMed]
  59. Wilkinson, H.N.; Hardman, M.J. The Role of Estrogen in Cutaneous Ageing and Repair. Maturitas 2017, 103, 60–64. [Google Scholar] [CrossRef] [PubMed]
  60. Russell, S.J.; Kahn, C.R. Endocrine Regulation of Ageing. Nat. Rev. Mol. Cell Biol. 2007, 8, 681–691. [Google Scholar] [CrossRef]
  61. Van den Beld, A.W.; Kaufman, J.M.; Zillikens, M.C.; Lamberts, S.W.J.; Egan, J.M.; van der Lely, A.J. The Physiology of Endocrine Systems with Ageing. Lancet Diabetes Endocrinol. 2018, 6, 647–658. [Google Scholar] [CrossRef]
  62. Dai, X.; Hong, L.; Shen, H.; Du, Q.; Ye, Q.; Chen, X.; Zhang, J. Estradiol-Induced Senescence of Hypothalamic Astrocytes Contributes to Aging-Related Reproductive Function Declines in Female Mice. Aging 2020, 12, 6089–6108. [Google Scholar] [CrossRef]
  63. Garratt, M.; Lagerborg, K.A.; Tsai, Y.M.; Galecki, A.; Jain, M.; Miller, R.A. Male Lifespan Extension with 17-α Estradiol Is Linked to a Sex-Specific Metabolomic Response Modulated by Gonadal Hormones in Mice. Aging Cell 2018, 17, e12786. [Google Scholar] [CrossRef]
  64. Song, C.H.; Kim, N.; Nam, R.H.; Choi, S.I.; Lee, H.N.; Surh, Y.J. 17β-Estradiol Supplementation Changes Gut Microbiota Diversity in Intact and Colorectal Cancer-Induced ICR Male Mice. Sci. Rep. 2020, 10, 12283. [Google Scholar] [CrossRef]
  65. Fang, Y.; Medina, D.; Stockwell, R.; McFadden, S.; Quinn, K.; Peck, M.R.; Bartke, A.; Hascup, K.N.; Hascup, E.R. Sexual Dimorphic Metabolic and Cognitive Responses of C57BL/6 Mice to Fisetin or Dasatinib and Quercetin Cocktail Oral Treatment. GeroScience 2023, 45, 2535–2850. [Google Scholar] [CrossRef]
  66. Saemann, L.; Naujoks, P.; Hartrumpf, L.; Pohl, S.; Simm, A.; Szabó, G. Sex-Specific Protection of Endothelial Function after Vascular Ischemia/Reperfusion Injury by the Senomorphic Agent Ruxolitinib. Int. J. Mol. Sci. 2023, 24, 11727. [Google Scholar] [CrossRef]
  67. National Institute on Aging Intervention Testing Program: Supported Interventions. Available online: https://www.nia.nih.gov/research/dab/in-terventions-testing-program-itp/supported-interventions (accessed on 25 January 2024).
  68. Jiang, N.; Nelson, J.F. Sex Differences in Mouse Longevity and Responses to Geroprotective Drugs: Implications for Human Intervention. Public Policy Aging Rep. 2023, 33, 120–124. [Google Scholar] [CrossRef]
  69. Soldin, O.P.; Mattison, D.R. Sex Differences in Pharmacokinetics and Pharmacodynamics. Clin. Pharmacokinet. 2009, 48, 143. [Google Scholar] [CrossRef] [PubMed]
  70. Institute of Medicine (US). Committee on Understanding the Biology of Sex and Gender. In Exploring the Biological Contributions to Human Health: Does Sex Matter? Sex Begins in the Womb; Wizemann, T.M., Pardue, M.-L., Eds.; National Academies Press (US): Washington, DC, USA, 2001. [Google Scholar]
  71. Oettel, M.; Mukhopadhyay, A.K. Progesterone: The Forgotten Hormone in Men? Aging Male 2004, 7, 236–257. [Google Scholar] [CrossRef] [PubMed]
  72. Hiller-Sturmhöfel, S.; Bartke, A. The Endocrine System: An Overview. Alcohol Health Res. World 1998, 22, 153–164. [Google Scholar]
  73. Fuentes, N.; Silveyra, P. Estrogen Receptor Signaling Mechanisms. Adv. Protein Chem. Struct. Biol. 2019, 116, 135. [Google Scholar] [CrossRef]
  74. Ranganathan, P.; Nadig, N.; Nambiar, S. Non-Canonical Estrogen Signaling in Endocrine Resistance. Front. Endocrinol. 2019, 10, 708. [Google Scholar] [CrossRef] [PubMed]
  75. Thomas, P. Membrane Progesterone Receptors (MPRs, PAQRs): Review of Structural and Signaling Characteristics. Cells 2022, 11, 1785. [Google Scholar] [CrossRef]
  76. Slack, C.; Alic, N.; Foley, A.; Cabecinha, M.; Hoddinott, M.P.; Partridge Correspondence, L. The Ras-Erk-ETS-Signaling Pathway Is a Drug Target for Longevity. Cell 2015, 162, 72–83. [Google Scholar] [CrossRef] [PubMed]
Figure 1. Flowchart describing experimental design.
Cells 13 00517 g001
Figure 2. Assessment of effects on senescent cell load using senescence-associated beta galactosidase (SAB) activity. (a). Effect of treatments on SAB activity in cells at a late passage with higher levels of SAB activity. (b). Effect of treatments on SAB activity in cells at an early passage with low levels of SAB activity. Error bars show standard error of the mean (SEM), and statistical significance of p values computed using one-way ANOVA with uncorrected Fisher’s LSD post hoc tests. * p < 0.05, ** p < 0.01, *** p < 0.001 and **** p < 0.0001.
Cells 13 00517 g002
Figure 3. Senescence kinetics for senescent male and female primary dermal fibroblasts. Percentage of cells stained for (a). senescence-associated beta galactosidase (SAB), (b). Ki67, a marker of proliferation and (c). Terminal deoxynucleotidyl transferase dUTP nick end labeling (TUNEL), a marker of DNA damage, in female (F) and male (M) dermal fibroblast cells treated with synthetic female hormones at 10 µM or a DMSO-only control. Gene expression of markers for apoptosis, (d). BCL2 and (e). CASP3, in female (F) and male (M) dermal fibroblast cells. n = 3 for all groups. Error bars show standard error of the mean (SEM), and statistical significance of p values computed using one-way ANOVA with uncorrected Fisher’s LSD post hoc tests is reported: (ns) not significant, * p < 0.05, ** p < 0.01 and *** p < 0.001.
Cells 13 00517 g003
Figure 4. Example of staining for senescence kinetics for senescent male (a) and female (b) primary dermal fibroblasts. Cells are stained for senescence-associated beta galactosidase (SAB; a marker of senescence), Ki67 (a marker of proliferation), γH2AX (a marker of DNA damage repair), and Terminal deoxynucleotidyl transferase dUTP nick end labelling (TUNEL; a marker of DNA damage) in female and male dermal fibroblast cells treated with synthetic female hormones at 10 µM or a DMSO-only control. SAB staining appears blue and was imaged using brightfield microscopy. Cells were multiplex stained for Ki67 (red) and γH2AX (green) with nuclei stained for DAPI (blue), and imaged on a fluorescence microscope at 10× magnification. Cells were stained for TUNEL (green) and Hoescht (blue), and imaged on a fluorescence microscope at 10× magnification. Scale bars indicate 100 µm.
Cells 13 00517 g004
Figure 5. Gene expression of genes encoding senescence-associated secretory phenotype (SASP) factors in female (F) and male (M) dermal fibroblast cells treated with synthetic female hormones at 10 µM or a DMSO-only control. Graph demonstrating the effect of synthetic female sex hormones on (a). IL6, (b). IL8, (c). IL12A, (d). CXCL1 and (e). CXCL10 expression. Error bars show standard error of the mean (SEM), and statistical significance of p values computed using one-way ANOVA with uncorrected Fisher’s LSD post hoc tests is reported: (ns) not significant, * p < 0.05 and ** p < 0.01.
Cells 13 00517 g005
Figure 6. Splicing factor expression following treatment with synthetic female sex hormones. Graph demonstrating the effect of synthetic female sex hormones on (a). HNRNPK, (b). NOVA1, (c). PNISR, (d). SRSF6 and (e). TRA2B expression. n = 3 for all groups. Error bars show standard error of the mean (SEM), and statistical significance of p values computed using one-way ANOVA with uncorrected Fisher’s LSD post hoc tests is reported: (ns) not significant, * p < 0.05, ** p < 0.01 and *** p < 0.001.
Cells 13 00517 g006
Figure 7. Structure-function analysis of compounds that decreased CDKN2A expression. (a). Dendrogram constructed using the Tanimoto coefficient to show structural similarity of compounds tested that decreased CDKN2A gene expression. (b). Maximum common substructure of the two least structurally similar compounds that decreased CDKN2A gene expression.
Cells 13 00517 g007aCells 13 00517 g007b
Table 1. Gene name and TaqMan™ Gene Expression assay IDs used for characterization experiments.
Gene NameAssay IDGene NameAssay ID
AKAP17AHs00946624_m1IL-10Hs00961622_m1
ATMHs00175892_m1IL12AHs01073447_m1
BCL2Hs04986394_s1IL12BHs01011518_m1
CASP1Hs00354836_m1IL-1BHs01555410_m1
CASP3Hs00234387_m1 IL-2Hs00174114_m1
CASP7Hs00169152_m1IL-6Hs00174131_m1
CASP8Hs06630780_s1INFγHs00989291_m1
CASP9Hs00962278_m1LTA (TNFβ)Hs99999086_m1
CXCL1Hs00236937_m1MMP1Hs00899658_m1
CXCL10Hs00171042_m1MMP3Hs00968305_m1
CXCL8 (IL-8)Hs00174103_m1MMP9Hs00957562_m1
GUSBHs00939627_m1NOVA1Hs00359592_m1
HNRNPA0Hs00246543_s1PGK1HS99999906_m1
HNRNPA1Hs01656228_s1PNISRHs00369090_m1
HNRNPA2B1Hs00242600_m1PPIAHs04194521_s1
HNRNPDHs01086912_m1SRSF1Hs00199471_m1
HNRNPH3Hs01032113_g1SRSF2Hs00427515_g1
HNRNPKHs00829140_s1SRSF3Hs00751507_s1
HNRNPMHs00246018_m1SRSF6Hs00607200_g1
HNRNPUL2Hs00859848_m1SRSF7Hs00196708_m1
IDH3BHs00199382_m1TNFαHs00174128_m1
IL-10Hs00961622_m1TRA2βHs00907493_m1
IL12AHs01073447_m1UBCHs01871556_s1
Table 2. Fold change in CDKN2A (arbitrary units, relative to control) by compound and dose in the initial senescence screen. All effects listed here were more than three standard deviations above or below the mean of control treatments.
Drug NameDose (µM)Fold Change in CDKN2A
Tucidinostat102.048
Doxifluridine101.559
Doxorubicin (hydrochloride)101.498
Bromhexine (hydrochloride)101.167
Homoharringtonine101.160
Chlorambucil101.133
Aspirin101.072
Amoxapine101.034
Doxorubicin (hydrochloride)10.969
Imatinib100.948
Montelukast (sodium)100.888
Atorvastatin (hemicalcium salt)100.822
Ribociclib100.820
Baricitinib (phosphate)100.820
Irinotecan (hydrochloride)100.804
Levoleucovorin (calcium)100.798
Epirubicin (hydrochloride)100.790
Cobimetinib100.773
Homoharringtonine10.765
Decitabine100.744
Sunitinib100.722
Temozolomide100.700
Silibinin10−0.686
Diacerein10−0.694
Vinorelbine (ditartrate)1−0.713
Alpelisib10−0.717
Ethamsylate10−0.734
Diethylstilboestrol1−0.753
Altretamine10−0.782
Panobinostat1−0.791
Sertraline (hydrochloride)1−0.805
Deferoxamine (mesylate)10−0.822
Balsalazide1−0.852
Pexidartinib1−0.890
Bexarotene10−0.894
Clofarabine10−0.897
Caffeic acid10−0.903
Pazopanib (hydrochloride)10−0.909
Aspirin1−0.916
Dexamethasone1−0.917
Pazopanib10−0.921
Rucaparib (phosphate)10−0.984
Glasdegib1−1.005
Aceglutamide10−1.020
Trimethoprim10−1.021
Crizotinib (hydrochloride)10−1.051
Acalabrutinib1−1.069
Zidovudine10−1.080
Citalopram (hydrobromide)10−1.094
Topotecan (hydrochloride)10−1.111
Rucaparib (phosphate)1−1.126
Alpelisib1−1.153
Sertraline (hydrochloride)10−1.154
Erlotinib1−1.157
Triclabendazole10−1.168
Nefopam (hydrochloride)10−1.174
Altretamine1−1.184
Bortezomib1−1.212
Nefopam (hydrochloride)1−1.217
Penfluridol10−1.230
Clioquinol10−1.241
Ethynyl estradiol1−1.259
Panobinostat10−1.260
Clofibrate1−1.272
Mizoribine10−1.291
Belinostat10−1.330
Valpromide10−1.351
Bosutinib1−1.354
Berberine (chloride hydrate)10−1.367
Nelarabine1−1.403
Acalabrutinib10−1.405
Tofacitinib (citrate)10−1.412
Erdosteine1−1.470
Bortezomib10−1.475
Bosutinib10−1.478
Osalmid1−1.493
Topotecan (hydrochloride)1−1.515
Bezafibrate10−1.523
Orotic acid10−1.532
Methylthiouracil1−1.551
Chlorpheniramine (maleate)10−1.559
Nitisinone1−1.561
Teniposide10−1.577
Sulfasalazine10−1.584
Pemetrexed (disodium hemipenta hydrate)1−1.702
Nifuroxazide10−1.705
Osalmid10−1.716
Nicotinamide1−1.717
Erlotinib10−1.741
Bendazol1−1.820
Bexarotene1−1.835
5-Azacytidine1−1.837
Nelarabine10−1.893
Clofarabine1−1.905
Niraparib10−1.927
Mycophenolic acid10−1.963
5-Azacytidine10−2.022
Chlorzoxazone1−2.045
Metyrapone1−2.066
Dimethyl fumarate10−2.099
Dexamethasone10−2.209
Dimethyl fumarate1−2.227
Chromocarb10−2.277
Penfluridol1−2.460
Bendazol10−2.486
Methylthiouracil10−2.527
Ethynyl estradiol10−2.684
Abemaciclib (methanesulfonate)10−2.768
Conivaptan (hydrochloride)10−2.908
Sunitinib1−2.926
Diethylstilbestrol10−3.068
Dronedarone1−4.099
Sodium 4-phenylbutyrate10−4.861
Cabozantinib10−7.875
Metyrapone10−8.532
Abemaciclib (methanesulfonate)1−11.417
Cabozantinib1−11.571
Carmofur10−11.805
Balsalazide10−11.887
Chlorzoxazone10−12.035
Table 3. Results from a screen for senescence-associated beta galactosidase (SAB) activity in male human dermal fibroblasts. The mean percentages of cells stained for SAB were compared against the corresponding DMSO-only vehicle control for each batch of the screen. Assays 1–5 were performed on later passage fibroblasts to investigate potential reductions in senescence. Assays 6–7 were performed on earlier passage fibroblasts to investigate potential increases in senescence. The mean ± standard error of the mean (SEM) and p values from one-way ANOVAs with Fisher’s LSD post hoc test are reported: (-) not applicable, (ns) not significant, * p < 0.05, ** p < 0.01, *** p < 0.001 and **** p < 0.0001.
TreatmentMeanSEMpSignificance
Assay 1 Control 10 µM44.177.506--
5-Azacytidine 10 µM36.996.1910.2496ns
Caffeic Acid 10 µM31.673.340.0553ns
Chlorpheniramine (maleate) 10 µM29.333.8050.0264*
Diethylstilboestrol 10 µM30.981.5070.0445*
Ethynyl estradiol 10 µM30.11.3170.0337*
Levonorgestrel 10 µM21.540.85410.002**
Assay 2 Control 10 µM40.059.082--
Amoxapine 10 µM28.929.5970.4353ns
Bendazol 10 µM23.676.3480.2568ns
Citalopram (hydrobromide) 10 µM33.5611.830.6466ns
Methylthiouracil 10 µM33.6912.090.6531ns
Sertraline (hydrochloride) 10 µM26.8110.880.3556ns
Valpromide 10 µM23.847.2420.2615ns
Assay 3 Control 10 µM27.523.686--
Balsalazide 10 µM22.992.480.3251ns
Carmofur 10 µM16.72.9850.0288*
Chlorzoxazone 10 µM19.912.4380.109ns
Conivaptan (hydrochloride) 10 µM22.332.9880.2627ns
Metyrapone 10 µM15.360.75930.0161*
Sodium-4-phenylbutyrate 10 µM16.164.9950.0228*
Assay 4 Control 1 µM19.194.546--
Abemaciclib (methanesulfonate) 1 µM12.091.8880.1025ns
Cabozantinib 1 µM8.130.29870.0159*
Dronedarone 1 µM14.122.7680.234ns
Nicotinamide 1 µM12.111.7950.1034ns
Penfluridol 1 µM10.481.5860.0495*
Assay 4 Control 10 µM16.114.794--
Dexamethasone 10 µM10.262.5530.1728ns
Assay 5 Control 1 µM39.18.275--
Aspirin 1 µM32.612.5870.3269ns
Sunitinib 1 µM40.421.8160.8398ns
Assay 5 Control 10 µM36.063.345--
Aspirin 10 µM21.394.9970.0396*
Sunitinib 10 µM2.5632.5630.0002***
Assay 6 Control 1 µM3.1630.5069--
Aspirin 1 µM4.2870.50530.4963ns
Sunitinib 1 µM3.4931.0160.2333ns
Assay 6 Control 10 µM4.2230.6868--
Aspirin 10 µM6.2271.6650.8404ns
Sunitinib 10 µM000.0199*
Imatinib 10 µM18.672.064<0.0001****
Assay 7 Control 10 µM4.070.8632--
Bromhexine (hydrochloride) 10 µM5.651.8180.3679ns
Doxifluridine 10 µM6.041.6370.2654ns
Doxorubicin (hydrochloride) 10 µM15.840.1804<0.0001****
Ethynyl estradiol 10 µM5.330.81840.4704ns
Homoharringtonine 10 µM13.111.6090.0001***
Tucidinostat 10 µM3.130.270.5886ns
Disclaimer/Publisher’s Note: The statements, opinions and data contained in all publications are solely those of the individual author(s) and contributor(s) and not of MDPI and/or the editor(s). MDPI and/or the editor(s) disclaim responsibility for any injury to people or property resulting from any ideas, methods, instructions or products referred to in the content.

