

Salivary Biomarkers for Parkinson’s Disease: A Systematic Review with Meta-Analysis


Abstract
1. Introduction
2. Materials and Methods
2.1. Search Strategy and Data Extraction
- -
- for PubMed: saliva* AND (marker* OR biomarker* OR enzyme* OR metabolite* OR hormon*) AND (Parkinson* OR Alzheimer*);
- -
- for Scopus: TITLE-ABS-KEY (saliva* AND (marker* OR biomarker* OR enzyme* OR metabolite* OR hormon*) AND (parkinson* OR alzheimer*));
- -
- for Web of Science: TS = (saliva* AND (marker* OR biomarker* OR enzyme* OR metabolite* OR hormon*) AND (Parkinson* OR Alzheimer*)).
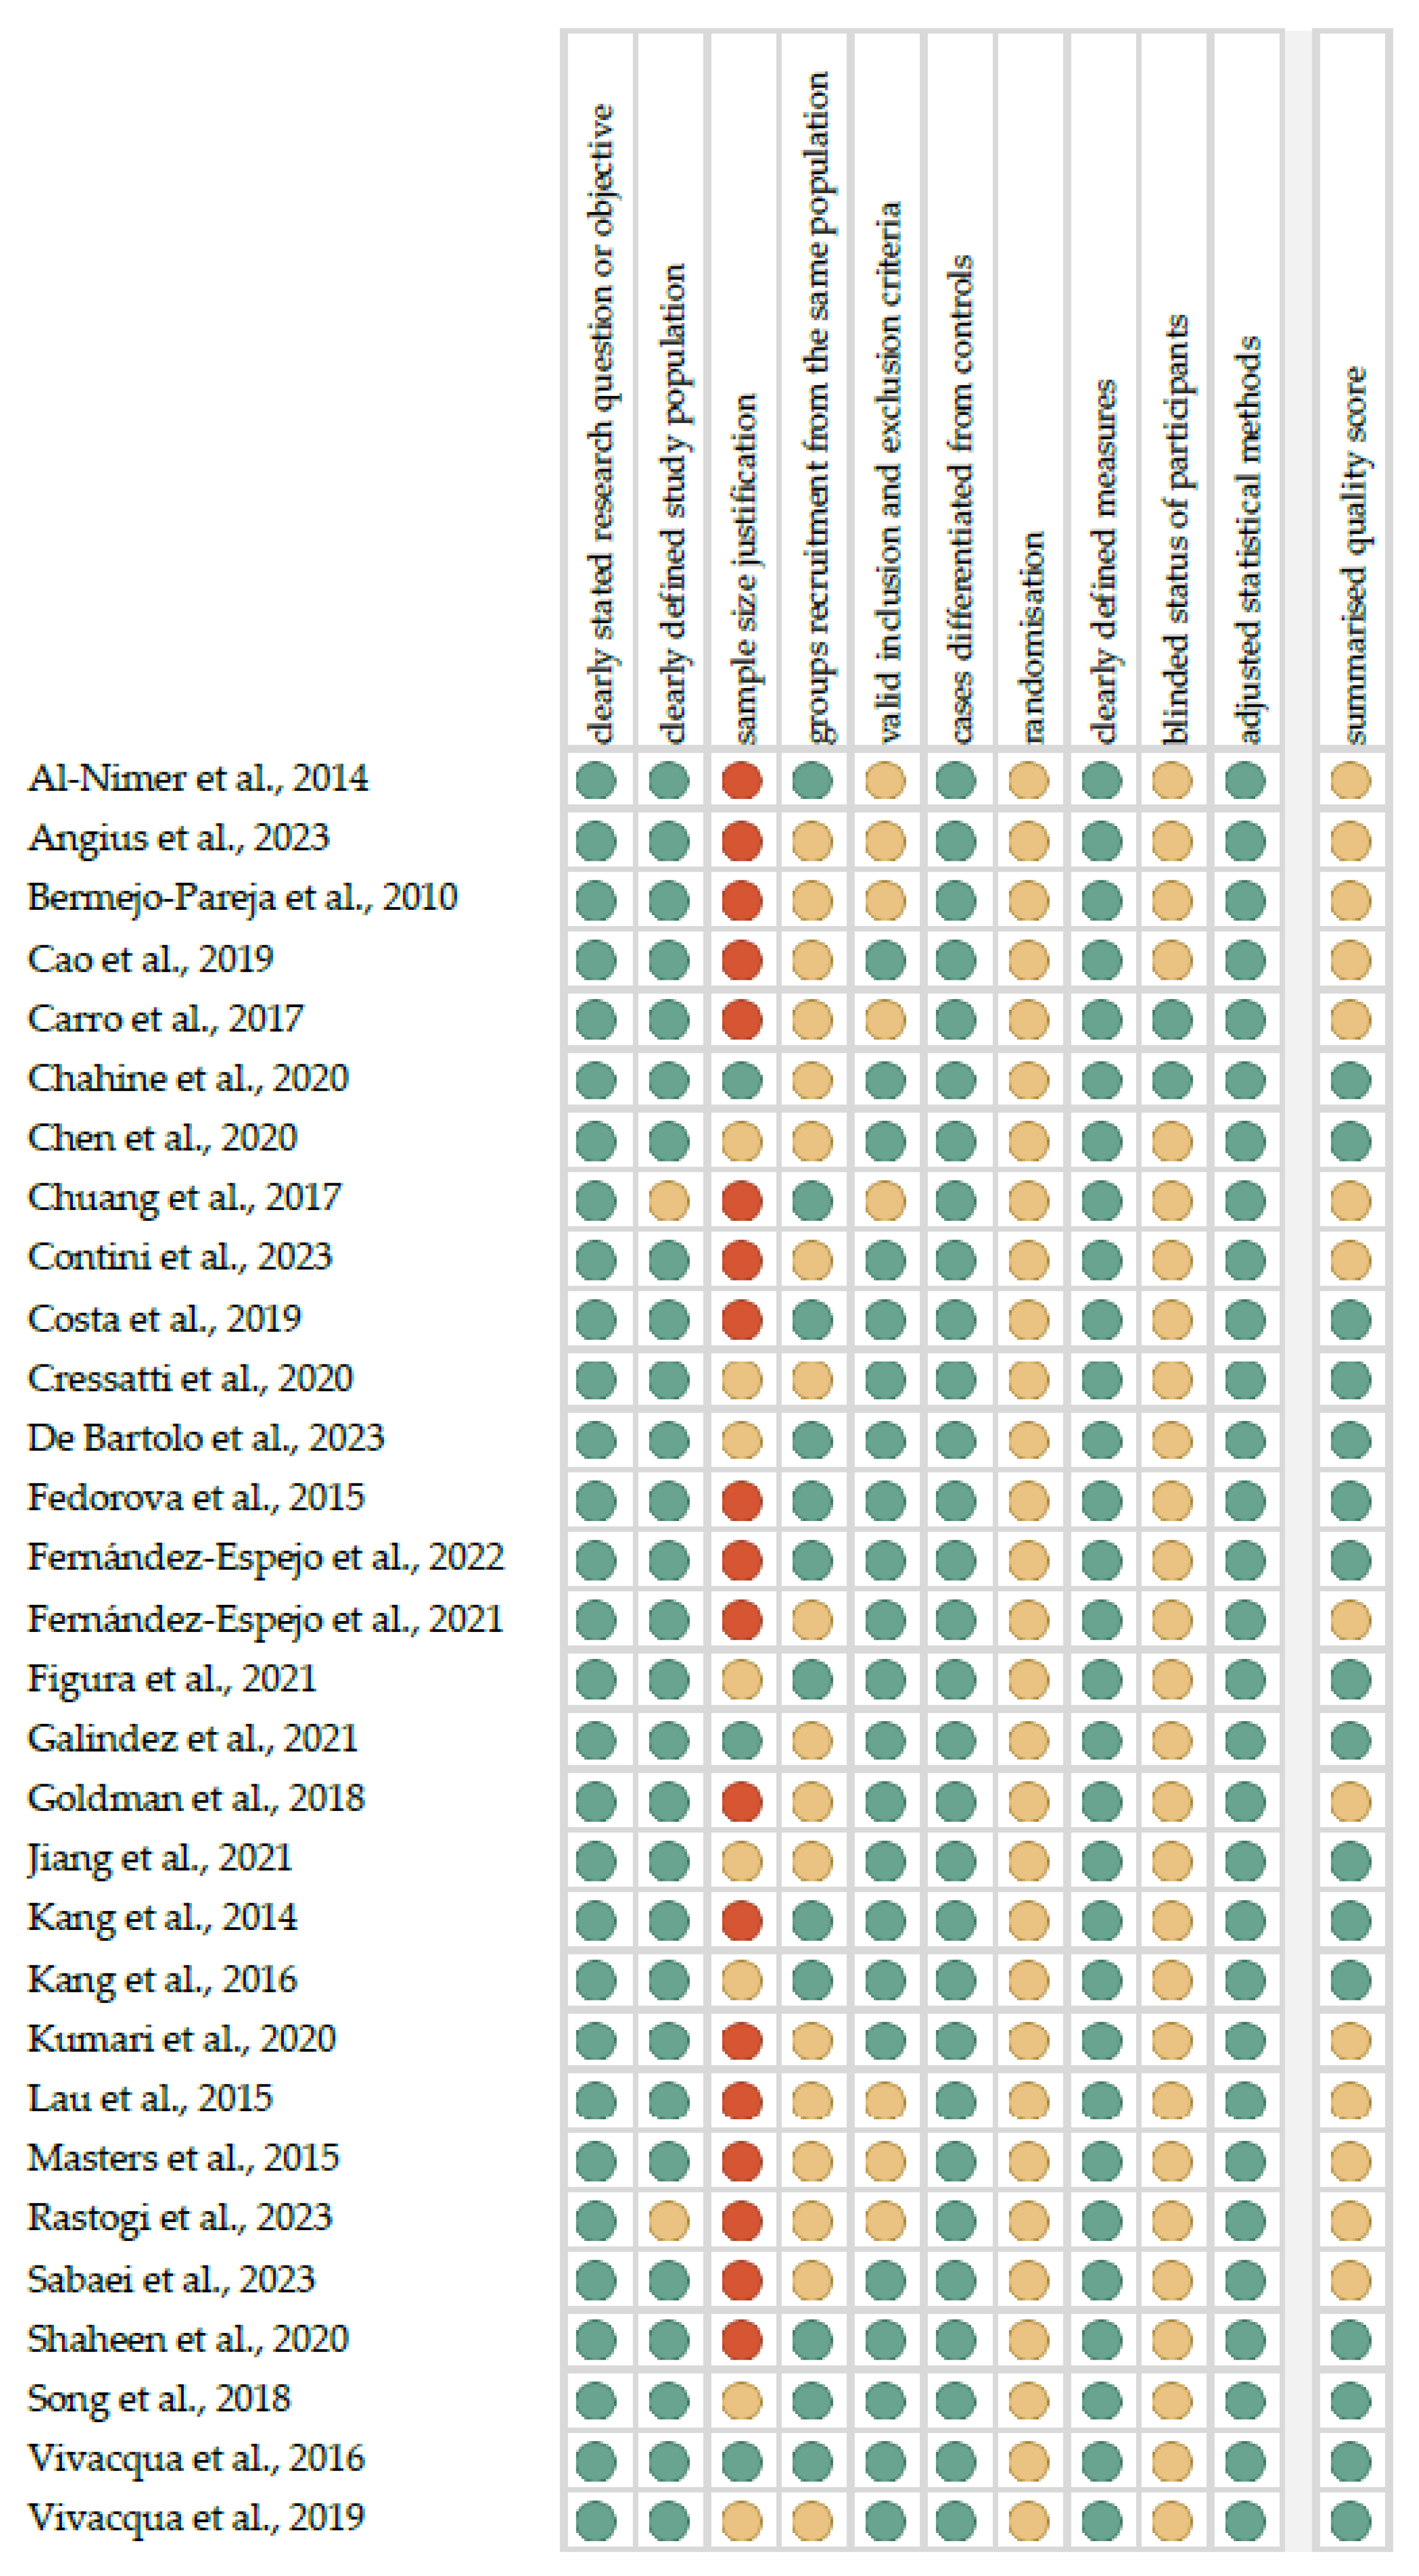
2.2. Quality Assessment and Critical Appraisal for the Systematic Review of Included Studies

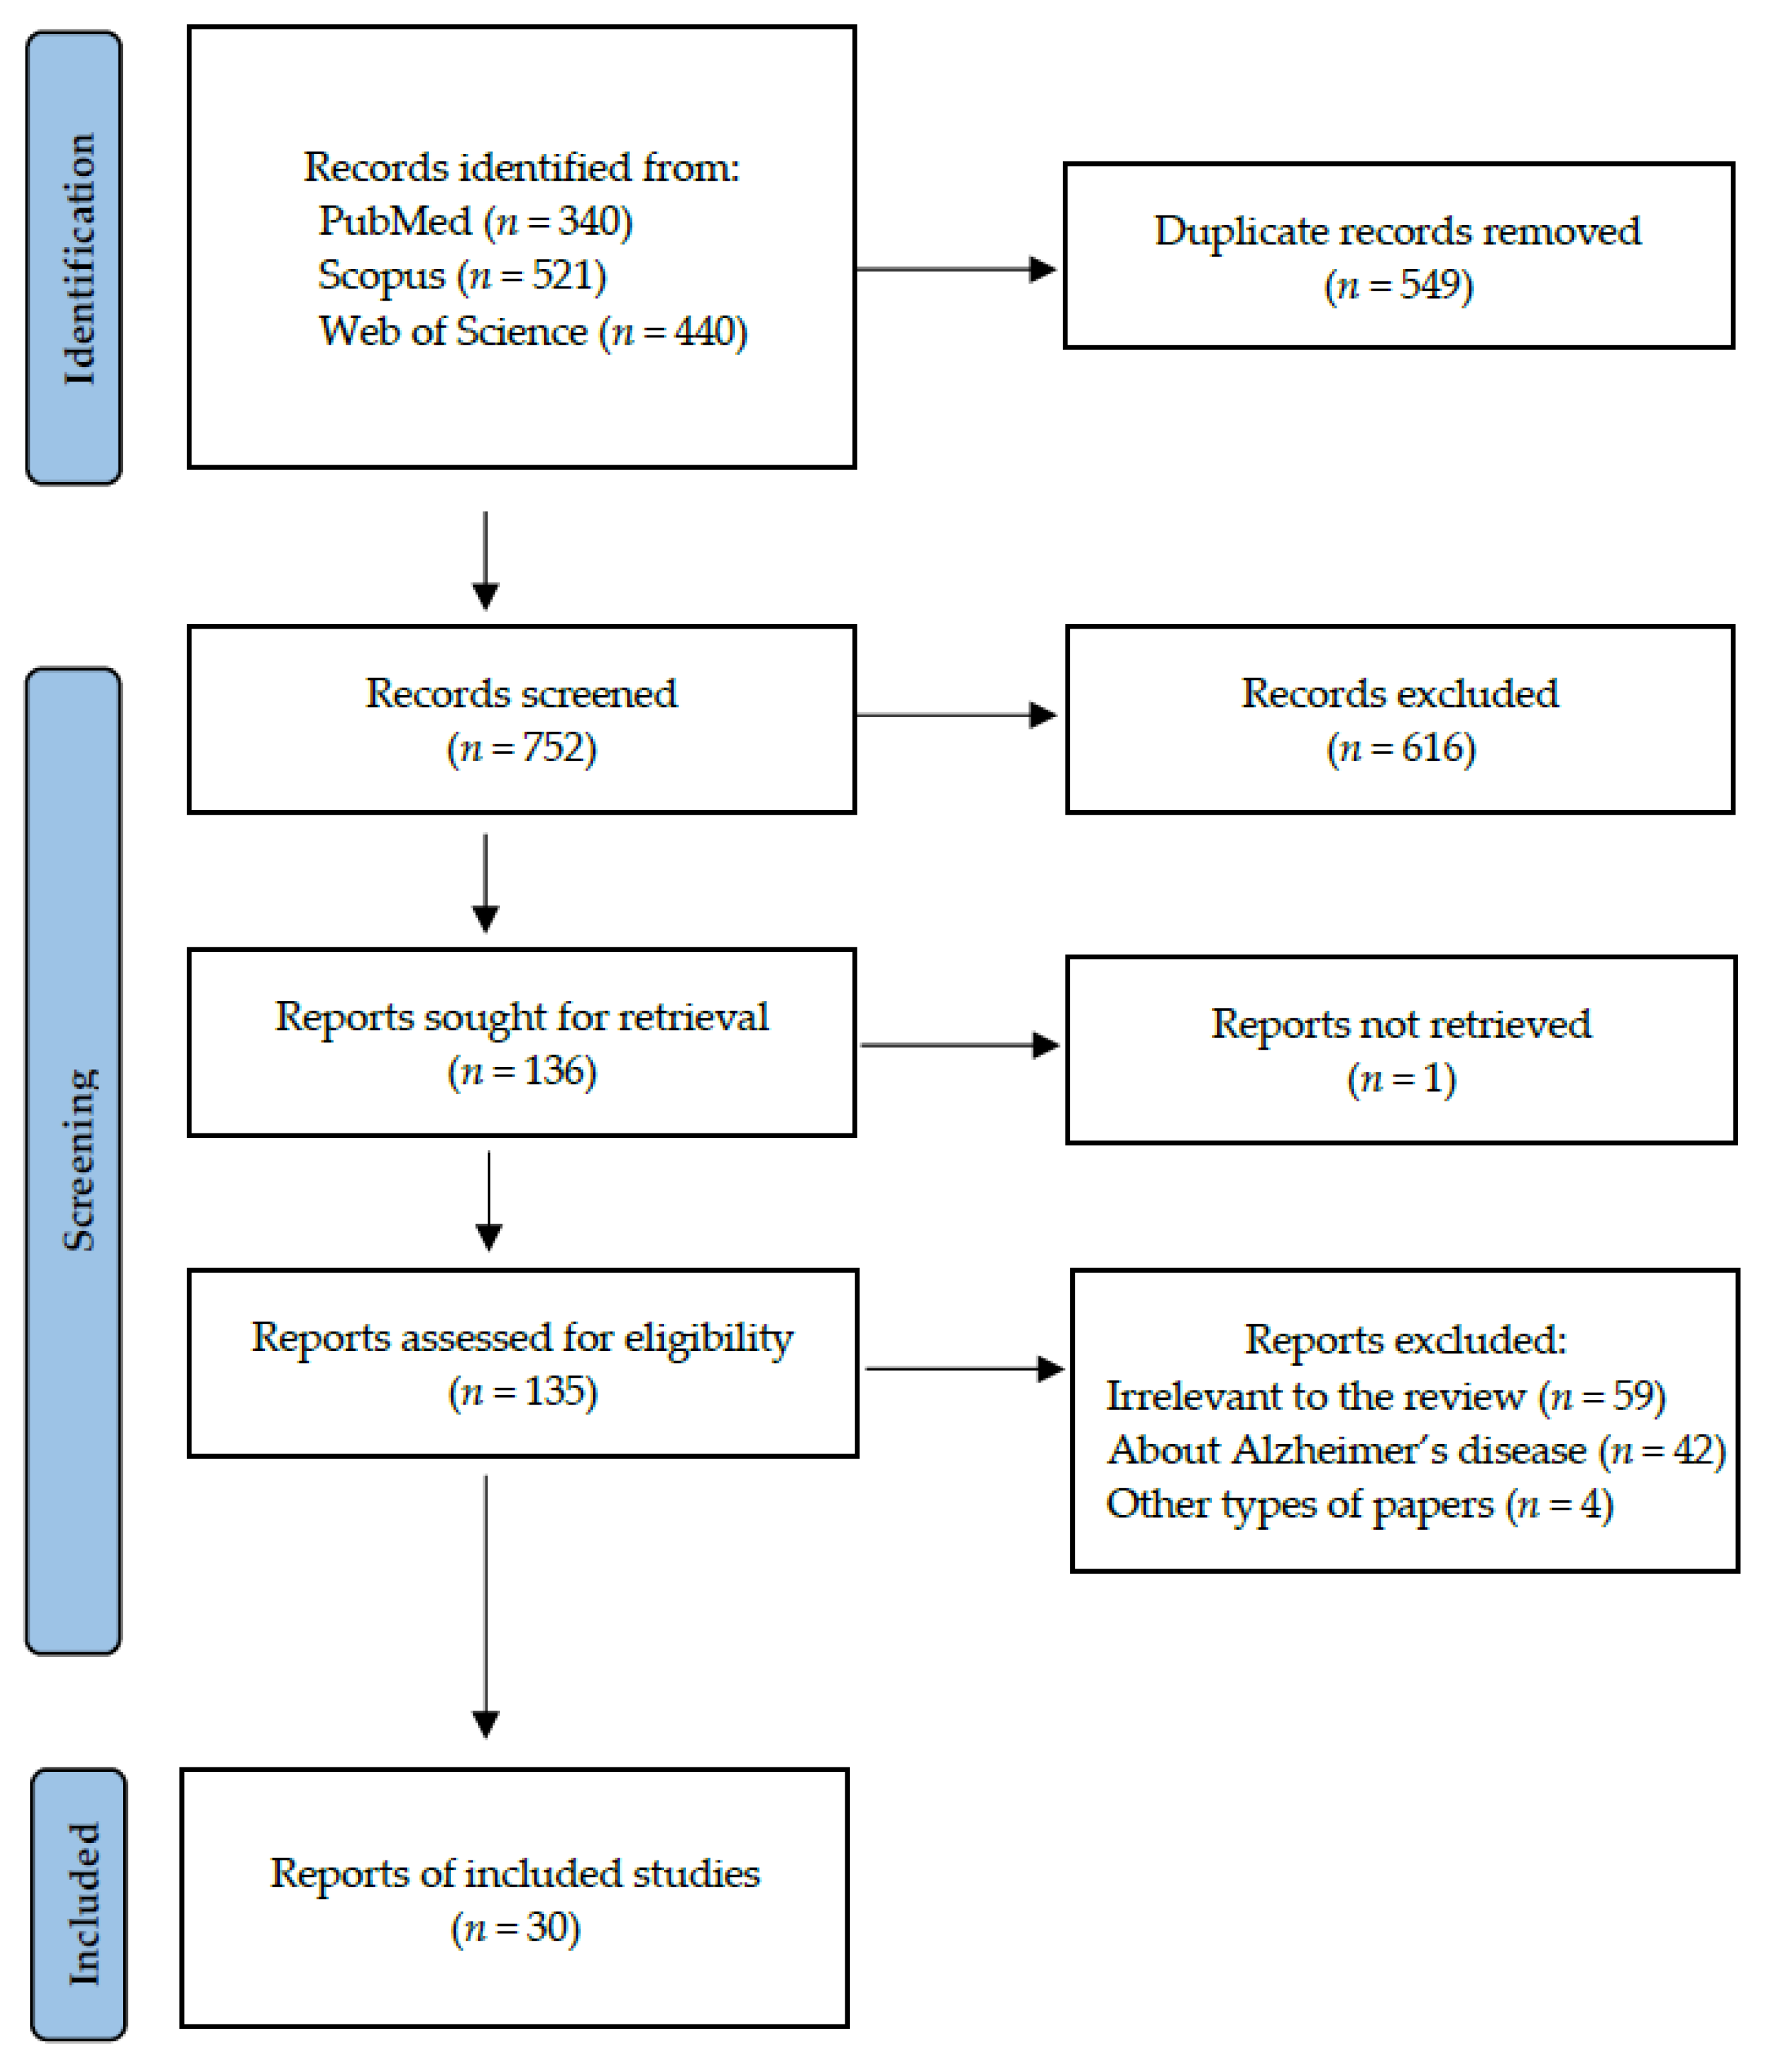
3. Results
4. Discussion
4.1. Alpha-Synuclein
4.2. Heme Oxygenase-1 (HO-1)
4.3. MicroRNA (miRNA) and DNA
4.4. Metabolomic and Proteomic Studies
4.5. DJ-1
4.6. Salivary Extracellular Vesicles (sEV)
4.7. Alzheimer’s Disease (AD)-Related Biomarkers in PD
4.8. Cortisol and Lactoferrin
4.9. Other Proteins
4.10. Other Enzymes
4.11. Study Limitations
5. Conclusions
Supplementary Materials
Author Contributions
Funding
Institutional Review Board Statement
Informed Consent Statement
Data Availability Statement
Conflicts of Interest
References
- Vijiaratnam, N.; Simuni, T.; Bandmann, O.; Morris, H.R.; Foltynie, T. Progress towards Therapies for Disease Modification in Parkinson’s Disease. Lancet Neurol. 2021, 20, 559–572. [Google Scholar] [CrossRef]
- De Miranda, B.R.; Goldman, S.M.; Miller, G.W.; Greenamyre, J.T.; Dorsey, E.R. Preventing Parkinson’s Disease: An Environmental Agenda. J. Parkinsons. Dis. 2022, 12, 45–68. [Google Scholar] [CrossRef] [PubMed]
- Cacabelos, R. Parkinson’s Disease: From Pathogenesis to Pharmacogenomics. Int. J. Mol. Sci. 2017, 18, 551. [Google Scholar] [CrossRef]
- Balestrino, R.; Schapira, A.H.V. Parkinson Disease. Eur. J. Neurol. 2020, 27, 27–42. [Google Scholar] [CrossRef] [PubMed]
- Khan, A.U.; Akram, M.; Daniyal, M.; Zainab, R. Awareness and Current Knowledge of Parkinson’s Disease: A Neurodegenerative Disorder. Int. J. Neurosci. 2019, 129, 55–93. [Google Scholar] [CrossRef]
- Dirkx, M.F.; Bologna, M. The Pathophysiology of Parkinson’s Disease Tremor. J. Neurol. Sci. 2022, 435, 120196. [Google Scholar] [CrossRef] [PubMed]
- Tolosa, E.; Garrido, A.; Scholz, S.W.; Poewe, W. Challenges in the Diagnosis of Parkinson’s Disease. Lancet Neurol. 2021, 20, 385–397. [Google Scholar] [CrossRef]
- Tysnes, O.-B.; Storstein, A. Epidemiology of Parkinson’s Disease. J. Neural. Transm. 2017, 124, 901–905. [Google Scholar] [CrossRef]
- Church, F.C. Treatment Options for Motor and Non-Motor Symptoms of Parkinson’s Disease. Biomolecules 2021, 11, 612. [Google Scholar] [CrossRef]
- Armstrong, M.J.; Okun, M.S. Diagnosis and Treatment of Parkinson Disease: A Review. JAMA 2020, 323, 548–560. [Google Scholar] [CrossRef]
- Ellis, T.D.; Colón-Semenza, C.; DeAngelis, T.R.; Thomas, C.A.; Hilaire, M.-H.S.; Earhart, G.M.; Dibble, L.E. Evidence for Early and Regular Physical Therapy and Exercise in Parkinson’s Disease. Semin. Neurol 2021, 41, 189–205. [Google Scholar] [CrossRef]
- Bloem, B.R.; Okun, M.S.; Klein, C. Parkinson’s Disease. Lancet 2021, 397, 2284–2303. [Google Scholar] [CrossRef]
- Weintraub, D.; Aarsland, D.; Chaudhuri, K.R.; Dobkin, R.D.; Leentjens, A.F.; Rodriguez-Violante, M.; Schrag, A. The Neuropsychiatry of Parkinson’s Disease: Advances and Challenges. Lancet Neurol. 2022, 21, 89–102. [Google Scholar] [CrossRef] [PubMed]
- Postuma, R.B.; Berg, D.; Stern, M.; Poewe, W.; Olanow, C.W.; Oertel, W.; Obeso, J.; Marek, K.; Litvan, I.; Lang, A.E.; et al. MDS Clinical Diagnostic Criteria for Parkinson’s Disease. Mov. Disord. 2015, 30, 1591–1601. [Google Scholar] [CrossRef] [PubMed]
- Postuma, R.B.; Poewe, W.; Litvan, I.; Lewis, S.; Lang, A.E.; Halliday, G.; Goetz, C.G.; Chan, P.; Slow, E.; Seppi, K.; et al. Validation of the MDS Clinical Diagnostic Criteria for Parkinson’s Disease. Mov. Disord. 2018, 33, 1601–1608. [Google Scholar] [CrossRef] [PubMed]
- Kwon, E.H.; Tennagels, S.; Gold, R.; Gerwert, K.; Beyer, L.; Tönges, L. Update on CSF Biomarkers in Parkinson’s Disease. Biomolecules 2022, 12, 329. [Google Scholar] [CrossRef]
- Raghunathan, R.; Turajane, K.; Wong, L.C. Biomarkers in Neurodegenerative Diseases: Proteomics Spotlight on ALS and Parkinson’s Disease. Int. J. Mol. Sci. 2022, 23, 9299. [Google Scholar] [CrossRef] [PubMed]
- Parnetti, L.; Gaetani, L.; Eusebi, P.; Paciotti, S.; Hansson, O.; El-Agnaf, O.; Mollenhauer, B.; Blennow, K.; Calabresi, P. CSF and Blood Biomarkers for Parkinson’s Disease. Lancet Neurol. 2019, 18, 573–586. [Google Scholar] [CrossRef] [PubMed]
- Greabu, M.; Battino, M.; Mohora, M.; Totan, A.; Didilescu, A.; Spinu, T.; Totan, C.; Miricescu, D.; Radulescu, R. Saliva—A Diagnostic Window to the Body, Both in Health and in Disease. J. Med. Life 2009, 2, 124–132. [Google Scholar] [PubMed]
- Chojnowska, S.; Baran, T.; Wilińska, I.; Sienicka, P.; Cabaj-Wiater, I.; Knaś, M. Human Saliva as a Diagnostic Material. Adv. Med. Sci. 2018, 63, 185–191. [Google Scholar] [CrossRef]
- Nijakowski, K.; Rutkowski, R.; Gruszczyński, D.; Witowski, J.; Surdacka, A.; Kanikowska, D. Seasonal Influence on Salivary Myeloperoxidase Diurnal Variations in Young Healthy Subjects: A Preliminary Study. FBL 2024, 29, 10. [Google Scholar] [CrossRef]
- Goldoni, R.; Dolci, C.; Boccalari, E.; Inchingolo, F.; Paghi, A.; Strambini, L.; Galimberti, D.; Tartaglia, G.M. Salivary Biomarkers of Neurodegenerative and Demyelinating Diseases and Biosensors for Their Detection. Ageing. Res. Rev. 2022, 76, 101587. [Google Scholar] [CrossRef]
- Nijakowski, K.; Zdrojewski, J.; Nowak, M.; Gruszczyński, D.; Knoll, F.; Surdacka, A. Salivary Metabolomics for Systemic Cancer Diagnosis: A Systematic Review. Metabolites 2022, 13, 28. [Google Scholar] [CrossRef] [PubMed]
- Nijakowski, K.; Gruszczyński, D.; Kopała, D.; Surdacka, A. Salivary Metabolomics for Oral Squamous Cell Carcinoma Diagnosis: A Systematic Review. Metabolites 2022, 12, 294. [Google Scholar] [CrossRef] [PubMed]
- Nijakowski, K.; Surdacka, A. Salivary Biomarkers for Diagnosis of Inflammatory Bowel Diseases: A Systematic Review. Int. J. Mol. Sci. 2020, 21, 7477. [Google Scholar] [CrossRef]
- Zhang, C.-Z.; Cheng, X.-Q.; Li, J.-Y.; Zhang, P.; Yi, P.; Xu, X.; Zhou, X.-D. Saliva in the Diagnosis of Diseases. Int. J. Oral. Sci. 2016, 8, 133–137. [Google Scholar] [CrossRef] [PubMed]
- Nijakowski, K.; Rutkowski, R.; Eder, P.; Simon, M.; Korybalska, K.; Witowski, J.; Surdacka, A. Potential Salivary Markers for Differential Diagnosis of Crohn’s Disease and Ulcerative Colitis. Life 2021, 11, 943. [Google Scholar] [CrossRef] [PubMed]
- Nijakowski, K.; Owecki, W.; Jankowski, J.; Surdacka, A. Salivary Biomarkers for Alzheimer’s Disease: A Systematic Review with Meta-Analysis. Int. J. Mol. Sci. 2024, 25, 1168. [Google Scholar] [CrossRef] [PubMed]
- Nijakowski, K.; Motylewska, B.; Banasik, E.; Rutkowski, R.; Tsaryk, V.; Łuczak, J.; Korybalska, K.; Witowski, J.; Surdacka, A.; Eder, P. Treatment Regimens and Disease Activity Could Alter Salivary Myeloperoxidase Levels in Patients with Inflammatory Bowel Diseases. Pol. Arch. Intern. Med. 2024, 134, 16596. [Google Scholar] [CrossRef] [PubMed]
- Kharel, S.; Ojha, R.; Bist, A.; Joshi, S.P.; Rauniyar, R.; Yadav, J.K. Salivary Alpha-Synuclein as a Potential Fluid Biomarker in Parkinson’s Disease: A Systematic Review and Meta-Analysis. Aging. Med. 2022, 5, 53–62. [Google Scholar] [CrossRef]
- Jiménez-Jiménez, F.J.; Alonso-Navarro, H.; García-Martín, E.; Santos-García, D.; Martínez-Valbuena, I.; Agúndez, J.A.G. Alpha-Synuclein in Peripheral Tissues as a Possible Marker for Neurological Diseases and Other Medical Conditions. Biomolecules 2023, 13, 1263. [Google Scholar] [CrossRef]
- Page, M.J.; McKenzie, J.; Bossuyt, P.; Boutron, I.; Hoffmann, T.; Mulrow, C.D.; Shamseer, L.; Tetzlaff, J.; Akl, E.; Brennan, S.E.; et al. The PRISMA 2020 Statement: An Updated Guideline for Reporting Systematic Reviews. Int. J. Surg. 2021, 88, 105906. [Google Scholar] [CrossRef] [PubMed]
- Study Quality Assessment Tools|NHLBI, NIH. Available online: https://www.nhlbi.nih.gov/health-topics/study-quality-assessment-tools (accessed on 22 August 2020).
- OCEBM. Levels of Evidence. Available online: https://www.cebm.net/2016/05/ocebm-levels-of-evidence/ (accessed on 22 August 2020).
- Al-Nimer, M.S.M.; Mshatat, S.F.; Abdulla, H.I. Saliva α-Synuclein and A High Extinction Coefficient Protein: A Novel Approach in Assessment Biomarkers of Parkinson’s Disease. N. Am. J. Med. Sci. 2014, 6, 633–637. [Google Scholar] [CrossRef] [PubMed]
- Angius, F.; Mocci, I.; Ercoli, T.; Loy, F.; Fadda, L.; Palmas, M.F.; Cannas, G.; Manzin, A.; Defazio, G.; Carta, A.R. Combined Measure of Salivary Alpha-Synuclein Species as Diagnostic Biomarker for Parkinson’s Disease. J. Neurol. 2023, 270, 5613–5621. [Google Scholar] [CrossRef] [PubMed]
- Cao, Z.; Wu, Y.; Liu, G.; Jiang, Y.; Wang, X.; Wang, Z.; Feng, T. α-Synuclein in Salivary Extracellular Vesicles as a Potential Biomarker of Parkinson’s Disease. Neurosci. Lett. 2019, 696, 114–120. [Google Scholar] [CrossRef] [PubMed]
- Chahine, L.M.; Beach, T.G.; Brumm, M.C.; Adler, C.H.; Coffey, C.S.; Mosovsky, S.; Caspell-Garcia, C.; Serrano, G.E.; Munoz, D.G.; White, C.L., III; et al. In Vivo Distribution of Alpha-Synuclein in Multiple Tissues and Biofluids in Parkinson Disease. Neurology 2020, 95, E1267–E1284. [Google Scholar] [CrossRef] [PubMed]
- Cressatti, M.; Juwara, L.; Galindez, J.M.; Velly, A.M.; Nkurunziza, E.S.; Marier, S.; Canie, O.; Gornistky, M.; Schipper, H.M. Salivary microR-153 and microR-223 Levels as Potential Diagnostic Biomarkers of Idiopathic Parkinson’s Disease. Mov. Disord. 2020, 35, 468–477. [Google Scholar] [CrossRef] [PubMed]
- De Bartolo, M.I.; Vivacqua, G.; Belvisi, D.; Mancinelli, R.; Fabbrini, A.; Manzo, N.; Costanzo, M.; Leodori, G.; Conte, A.; Fabbrini, G.; et al. A Combined Panel of Salivary Biomarkers in de Novo Parkinson’s Disease. Ann. Neurol. 2023, 93, 446–459. [Google Scholar] [CrossRef] [PubMed]
- Fernández-Espejo, E.; Rodríguez de Fonseca, F.; Suárez, J.; Tolosa, E.; Vilas, D.; Aldecoa, I.; Berenguer, J.; Damas-Hermoso, F. Native α-Synuclein, 3-Nitrotyrosine Proteins, and Patterns of Nitro-α-Synuclein-Immunoreactive Inclusions in Saliva and Submandibulary Gland in Parkinson’s Disease. Antioxidants 2021, 10, 715. [Google Scholar] [CrossRef]
- Goldman, J.G.; Andrews, H.; Amara, A.; Naito, A.; Alcalay, R.N.; Shaw, L.M.; Taylor, P.; Xie, T.; Tuite, P.; Henchcliffe, C.; et al. Cerebrospinal Fluid, Plasma, and Saliva in the BioFIND Study: Relationships among Biomarkers and Parkinson’s Disease Features. Mov. Disord. 2018, 33, 282–288. [Google Scholar] [CrossRef]
- Rastogi, S.; Rani, K.; Rai, S.; Singh, R.; Bharti, P.S.; Sharma, V.; Sahu, J.; Kapoor, V.; Vishwakarma, P.; Garg, S.; et al. Fluorescence-Tagged Salivary Small Extracellular Vesicles as a Nanotool in Early Diagnosis of Parkinson’s Disease. BMC. Med. 2023, 21, 335. [Google Scholar] [CrossRef]
- Sabaei, M.; Rahimian, S.; Haj Mohamad Ebrahim Ketabforoush, A.; Rasoolijazi, H.; Zamani, B.; Hajiakhoundi, F.; Soleimani, M.; Shahidi, G.; Faramarzi, M. Salivary Levels of Disease-Related Biomarkers in the Early Stages of Parkinson’s and Alzheimer’s Disease: A Cross-Sectional Study. IBRO. Neurosci. Rep. 2023, 14, 285–292. [Google Scholar] [CrossRef]
- Shaheen, H.; Sobhy, S.; El Mously, S.; Abuomira, M.; Mansour, M. Salivary Alpha-Synuclein (Total and Oligomeric Form): Potential Biomarkers in Parkinson’s Disease. Egypt. J. Neurol. Psychiatry Neurosurg. 2020, 56, 1–6. [Google Scholar] [CrossRef]
- Kang, W.; Chen, W.; Yang, Q.; Zhang, L.; Zhang, L.; Wang, X.; Dong, F.; Zhao, Y.; Chen, S.; Quinn, T.J.; et al. Salivary Total Alpha-Synuclein, Oligomeric Alpha-Synuclein and SNCA Variants in Parkinson’s Disease Patients. Sci. Rep. 2016, 6, 28143. [Google Scholar] [CrossRef]
- Vivacqua, G.; Latorre, A.; Suppa, A.; Nardi, M.; Pietracupa, S.; Mancinelli, R.; Fabbrini, G.; Colosimo, C.; Gaudio, E.; Berardelli, A. Abnormal Salivary Total and Oligomeric Alpha-Synuclein in Parkinson’s Disease. PLoS. ONE 2016, 11, e0151156. [Google Scholar] [CrossRef] [PubMed]
- Vivacqua, G.; Suppa, A.; Mancinelli, R.; Belvisi, D.; Fabbrini, A.; Costanzo, M.; Formica, A.; Onori, P.; Fabbrini, G.; Berardelli, A. Salivary Alpha-Synuclein in the Diagnosis of Parkinson’s Disease and Progressive Supranuclear Palsy. Park. Relat. Disord. 2019, 63, 143–148. [Google Scholar] [CrossRef]
- Bermejo-Pareja, F.; Antequera, D.; Vargas, T.; Molina, J.A.; Carro, E. Saliva Levels of Abeta1-42 as Potential Biomarker of Alzheimer’s Disease: A Pilot Study. BMC. Neurol. 2010, 10, 108. [Google Scholar] [CrossRef] [PubMed]
- Lau, H.-C.; Lee, I.-K.; Ko, P.-W.; Lee, H.-W.; Huh, J.-S.; Cho, W.-J.; Lim, J.-O. Non-Invasive Screening for Alzheimer’s Disease by Sensing Salivary Sugar Using Drosophila Cells Expressing Gustatory Receptor (Gr5a) Immobilized on an Extended Gate Ion-Sensitive Field-Effect Transistor (EG-ISFET) Biosensor. PLoS. ONE 2015, 10, e0117810. [Google Scholar] [CrossRef] [PubMed]
- Carro, E.; Bartolomé, F.; Bermejo-Pareja, F.; Villarejo-Galende, A.; Molina, J.A.; Ortiz, P.; Calero, M.; Rabano, A.; Cantero, J.L.; Orive, G. Early Diagnosis of Mild Cognitive Impairment and Alzheimer’s Disease Based on Salivary Lactoferrin. Alzheimers. Dement. 2017, 8, 131–138. [Google Scholar] [CrossRef] [PubMed]
- Costa, C.M.; Oliveira, G.L.; Fonseca, A.C.S.; de Carvalho Lana, R.; Polese, J.C.; Pernambuco, A.P. Levels of Cortisol and Neurotrophic Factor Brain-Derived in Parkinson’s Disease. Neurosci. Lett. 2019, 708, 134359. [Google Scholar] [CrossRef] [PubMed]
- Fedorova, T.; Knudsen, C.S.; Mouridsen, K.; Nexo, E.; Borghammer, P. Salivary Acetylcholinesterase Activity Is Increased in Parkinson’s Disease: A Potential Marker of Parasympathetic Dysfunction. Park. Dis. 2015, 2015, 156479. [Google Scholar] [CrossRef] [PubMed]
- Fernández-Espejo, E.; Gavito, A.L.; Suárez, J.; Tolosa, E.; Vilas, D.; Aldecoa, I.; Berenguer, J.; Córdoba-Fernández, A.; Damas-Hermoso, F.; Rodríguez de Fonseca, F. Salivary ATP13A2 Is a Potential Marker of Therapy-Induced Motor Complications and Is Expressed by Inclusions in Submandibulary Glands in Parkinson’s Disease. Clin. Park. Relat. Disord. 2022, 7, 100163. [Google Scholar] [CrossRef] [PubMed]
- Galindez, J.M.; Juwara, L.; Cressatti, M.; Gornitsky, M.; Velly, A.M.; Schipper, H.M. Salivary Heme Oxygenase-1: A Potential Biomarker for Central Neurodegeneration. J. Cent. Nerv. Syst. Dis. 2021, 13, 11795735211029114. [Google Scholar] [CrossRef] [PubMed]
- Song, W.; Kothari, V.; Velly, A.M.; Cressatti, M.; Liberman, A.; Gornitsky, M.; Schipper, H.M. Evaluation of Salivary Heme Oxygenase-1 as a Potential Biomarker of Early Parkinson’s Disease. Mov. Disord. 2018, 33, 583–591. [Google Scholar] [CrossRef] [PubMed]
- Kang, W.-Y.; Yang, Q.; Jiang, X.-F.; Chen, W.; Zhang, L.-Y.; Wang, X.-Y.; Zhang, L.-N.; Quinn, T.J.; Liu, J.; Chen, S.-D. Salivary DJ-1 Could Be an Indicator of Parkinson’s Disease Progression. Front. Aging. Neurosci. 2014, 6, 102. [Google Scholar] [CrossRef] [PubMed]
- Masters, J.M.; Noyce, A.J.; Warner, T.T.; Giovannoni, G.; Proctor, G.B. Elevated Salivary Protein in Parkinson’s Disease and Salivary DJ-1 as a Potential Marker of Disease Severity. Park. Relat. Disord. 2015, 21, 1251–1255. [Google Scholar] [CrossRef] [PubMed]
- Contini, C.; Fadda, L.; Lai, G.; Masala, C.; Olianas, A.; Castagnola, M.; Messana, I.; Iavarone, F.; Bizzarro, A.; Masullo, C.; et al. A Top-down Proteomic Approach Reveals a Salivary Protein Profile Able to Classify Parkinson’s Disease with Respect to Alzheimer’s Disease Patients and to Healthy Controls. Proteomics 2023, 2023, e2300202. [Google Scholar] [CrossRef]
- Figura, M.; Sitkiewicz, E.; Świderska, B.; Milanowski, Ł.; Szlufik, S.; Koziorowski, D.; Friedman, A. Proteomic Profile of Saliva in Parkinson’s Disease Patients: A Proof of Concept Study. Brain. Sci. 2021, 11, 661. [Google Scholar] [CrossRef]
- Kumari, S.; Goyal, V.; Kumaran, S.S.; Dwivedi, S.N.; Srivastava, A.; Jagannathan, N.R. Quantitative Metabolomics of Saliva Using Proton NMR Spectroscopy in Patients with Parkinson’s Disease and Healthy Controls. Neurol. Sci. 2020, 41, 1201–1210. [Google Scholar] [CrossRef]
- Chen, Y.; Zheng, J.; Su, L.; Chen, F.; Zhu, R.; Chen, X.; Ye, Q. Increased Salivary microRNAs That Regulate DJ-1 Gene Expression as Potential Markers for Parkinson’s Disease. Front. Aging. Neurosci. 2020, 12, 210. [Google Scholar] [CrossRef]
- Jiang, Y.; Chen, J.; Sun, Y.; Li, F.; Wei, L.; Sun, W.; Deng, J.; Yuan, Y.; Wang, Z. Profiling of Differentially Expressed MicroRNAs in Saliva of Parkinson’s Disease Patients. Front. Neurol. 2021, 12, 738530. [Google Scholar] [CrossRef] [PubMed]
- Chuang, Y.-H.; Paul, K.C.; Bronstein, J.M.; Bordelon, Y.; Horvath, S.; Ritz, B. Parkinson’s Disease Is Associated with DNA Methylation Levels in Human Blood and Saliva. Genome. Med. 2017, 9, 76. [Google Scholar] [CrossRef] [PubMed]
- Burré, J.; Sharma, M.; Südhof, T.C. Cell Biology and Pathophysiology of α-Synuclein. Cold Spring Harb. Perspect. Med. 2018, 8, a024091. [Google Scholar] [CrossRef] [PubMed]
- Yi, S.; Wang, L.; Wang, H.; Ho, M.S.; Zhang, S. Pathogenesis of α-Synuclein in Parkinson’s Disease: From a Neuron-Glia Crosstalk Perspective. Int. J. Mol. Sci. 2022, 23, 14753. [Google Scholar] [CrossRef] [PubMed]
- Vidović, M.; Rikalovic, M.G. Alpha-Synuclein Aggregation Pathway in Parkinson’s Disease: Current Status and Novel Therapeutic Approaches. Cells 2022, 11, 1732. [Google Scholar] [CrossRef] [PubMed]
- Henderson, M.X.; Trojanowski, J.Q.; Lee, V.M.-Y. α-Synuclein Pathology in Parkinson’s Disease and Related α-Synucleinopathies. Neurosci. Lett. 2019, 709, 134316. [Google Scholar] [CrossRef] [PubMed]
- Du, X.-Y.; Xie, X.-X.; Liu, R.-T. The Role of α-Synuclein Oligomers in Parkinson’s Disease. Int. J. Mol. Sci. 2020, 21, 8645. [Google Scholar] [CrossRef]
- Anderson, J.P.; Walker, D.E.; Goldstein, J.M.; de Laat, R.; Banducci, K.; Caccavello, R.J.; Barbour, R.; Huang, J.; Kling, K.; Lee, M.; et al. Phosphorylation of Ser-129 Is the Dominant Pathological Modification of Alpha-Synuclein in Familial and Sporadic Lewy Body Disease. J. Biol. Chem. 2006, 281, 29739–29752. [Google Scholar] [CrossRef]
- Walker, D.G.; Lue, L.-F.; Adler, C.H.; Shill, H.A.; Caviness, J.N.; Sabbagh, M.N.; Akiyama, H.; Serrano, G.E.; Sue, L.I.; Beach, T.G.; et al. Changes in Properties of Serine 129 Phosphorylated α-Synuclein with Progression of Lewy-Type Histopathology in Human Brains. Exp. Neurol. 2013, 240, 190–204. [Google Scholar] [CrossRef]
- Zubelzu, M.; Morera-Herreras, T.; Irastorza, G.; Gómez-Esteban, J.C.; Murueta-Goyena, A. Plasma and Serum Alpha-Synuclein as a Biomarker in Parkinson’s Disease: A Meta-Analysis. Park. Relat. Disord. 2022, 99, 107–115. [Google Scholar] [CrossRef]
- Goetz, C.G.; Poewe, W.; Rascol, O.; Sampaio, C.; Stebbins, G.T.; Counsell, C.; Giladi, N.; Holloway, R.G.; Moore, C.G.; Wenning, G.K.; et al. Movement Disorder Society Task Force Report on the Hoehn and Yahr Staging Scale: Status and Recommendations. Mov. Disord. 2004, 19, 1020–1028. [Google Scholar] [CrossRef] [PubMed]
- Luan, M.; Sun, Y.; Chen, J.; Jiang, Y.; Li, F.; Wei, L.; Sun, W.; Ma, J.; Song, L.; Liu, J.; et al. Diagnostic Value of Salivary Real-Time Quaking-Induced Conversion in Parkinson’s Disease and Multiple System Atrophy. Mov. Disord. 2022, 37, 1059–1063. [Google Scholar] [CrossRef] [PubMed]
- Vivacqua, G.; Mason, M.; De Bartolo, M.I.; Węgrzynowicz, M.; Calò, L.; Belvisi, D.; Suppa, A.; Fabbrini, G.; Berardelli, A.; Spillantini, M. Salivary α-Synuclein RT-QuIC Correlates with Disease Severity in de Novo Parkinson’s Disease. Mov. Disord. 2023, 38, 153–155. [Google Scholar] [CrossRef] [PubMed]
- Schipper, H.M.; Song, W.; Zukor, H.; Hascalovici, J.R.; Zeligman, D. Heme Oxygenase-1 and Neurodegeneration: Expanding Frontiers of Engagement. J. Neurochem. 2009, 110, 469–485. [Google Scholar] [CrossRef] [PubMed]
- Nitti, M.; Piras, S.; Brondolo, L.; Marinari, U.M.; Pronzato, M.A.; Furfaro, A.L. Heme Oxygenase 1 in the Nervous System: Does It Favor Neuronal Cell Survival or Induce Neurodegeneration? Int. J. Mol. Sci. 2018, 19, 2260. [Google Scholar] [CrossRef] [PubMed]
- Wu, Y.-H.; Hsieh, H.-L. Roles of Heme Oxygenase-1 in Neuroinflammation and Brain Disorders. Antioxidants 2022, 11, 923. [Google Scholar] [CrossRef]
- Ayuso, P.; Martínez, C.; Pastor, P.; Lorenzo-Betancor, O.; Luengo, A.; Jiménez-Jiménez, F.J.; Alonso-Navarro, H.; Agúndez, J.A.G.; García-Martín, E. An Association Study between Heme Oxygenase-1 Genetic Variants and Parkinson’s Disease. Front. Cell. Neurosci. 2014, 8, 298. [Google Scholar] [CrossRef]
- Lu, T.X.; Rothenberg, M.E. MicroRNA. J. Allergy. Clin. Immunol 2018, 141, 1202–1207. [Google Scholar] [CrossRef]
- Luo, J.W.; Wang, X.; Yang, Y.; Mao, Q. Role of Micro-RNA (miRNA) in Pathogenesis of Glioblastoma. Eur. Rev. Med. Pharmacol. Sci. 2015, 19, 1630–1639. [Google Scholar]
- Ho, P.T.B.; Clark, I.M.; Le, L.T.T. MicroRNA-Based Diagnosis and Therapy. Int. J. Mol. Sci. 2022, 23, 7167. [Google Scholar] [CrossRef]
- Margaritis, K.; Margioula-Siarkou, G.; Giza, S.; Kotanidou, E.P.; Tsinopoulou, V.R.; Christoforidis, A.; Galli-Tsinopoulou, A. Micro-RNA Implications in Type-1 Diabetes Mellitus: A Review of Literature. Int. J. Mol. Sci. 2021, 22, 12165. [Google Scholar] [CrossRef] [PubMed]
- Long, M.D.; Smiraglia, D.J.; Campbell, M.J. The Genomic Impact of DNA CpG Methylation on Gene Expression; Relationships in Prostate Cancer. Biomolecules 2017, 7, 15. [Google Scholar] [CrossRef] [PubMed]
- Zsindely, N.; Siági, F.; Bodai, L. DNA Methylation in Huntington’s Disease. Int. J. Mol. Sci. 2021, 22, 12736. [Google Scholar] [CrossRef] [PubMed]
- Wishart, D.S. Metabolomics for Investigating Physiological and Pathophysiological Processes. Physiol. Rev. 2019, 99, 1819–1875. [Google Scholar] [CrossRef] [PubMed]
- Duong, V.A.; Lee, H. Bottom-Up Proteomics: Advancements in Sample Preparation. Int. J. Mol. Sci. 2023, 24, 5350. [Google Scholar] [CrossRef] [PubMed]
- Dai, X.; Shen, L. Advances and Trends in Omics Technology Development. Front. Med. 2022, 9, 911861. [Google Scholar] [CrossRef] [PubMed]
- Emamzadeh, F.N.; Surguchov, A. Parkinson’s Disease: Biomarkers, Treatment, and Risk Factors. Front. Neurosci. 2018, 12, 612. [Google Scholar] [CrossRef]
- Hurben, A.K.; Tretyakova, N.Y. Role of Protein Damage Inflicted by Dopamine Metabolites in Parkinson’s Disease: Evidence, Tools, and Outlook. Chem. Res. Toxicol. 2022, 35, 1789–1804. [Google Scholar] [CrossRef]
- Tomkins, J.E.; Manzoni, C. Advances in Protein-Protein Interaction Network Analysis for Parkinson’s Disease. Neurobiol. Dis. 2021, 155, 105395. [Google Scholar] [CrossRef]
- Repici, M.; Giorgini, F. DJ-1 in Parkinson’s Disease: Clinical Insights and Therapeutic Perspectives. J. Clin. Med. 2019, 8, 1377. [Google Scholar] [CrossRef]
- Dolgacheva, L.P.; Berezhnov, A.V.; Fedotova, E.I.; Zinchenko, V.P.; Abramov, A.Y. Role of DJ-1 in the Mechanism of Pathogenesis of Parkinson’s Disease. J. Bioenerg. Biomembr. 2019, 51, 175–188. [Google Scholar] [CrossRef]
- Zhan, C.; Yang, X.; Yin, X.; Hou, J. Exosomes and Other Extracellular Vesicles in Oral and Salivary Gland Cancers. Oral. Dis. 2020, 26, 865–875. [Google Scholar] [CrossRef]
- Nair, S.; Tang, K.D.; Kenny, L.; Punyadeera, C. Salivary Exosomes as Potential Biomarkers in Cancer. Oral. Oncol. 2018, 84, 31–40. [Google Scholar] [CrossRef]
- Han, Y.; Jia, L.; Zheng, Y.; Li, W. Salivary Exosomes: Emerging Roles in Systemic Disease. Int. J. Biol. Sci. 2018, 14, 633–643. [Google Scholar] [CrossRef] [PubMed]
- Sharma, V.; Nikolajeff, F.; Kumar, S. Employing Nanoparticle Tracking Analysis of Salivary Neuronal Exosomes for Early Detection of Neurodegenerative Diseases. Transl. Neurodegener. 2023, 12, 7. [Google Scholar] [CrossRef] [PubMed]
- Molinuevo, J.L.; Ayton, S.; Batrla, R.; Bednar, M.M.; Bittner, T.; Cummings, J.; Fagan, A.M.; Hampel, H.; Mielke, M.M.; Mikulskis, A.; et al. Current State of Alzheimer’s Fluid Biomarkers. Acta. Neuropathol. 2018, 136, 821–853. [Google Scholar] [CrossRef] [PubMed]
- Yong, S.J.; Veerakumarasivam, A.; Lim, W.L.; Chew, J. Neuroprotective Effects of Lactoferrin in Alzheimer’s and Parkinson’s Diseases: A Narrative Review. ACS. Chem. Neurosci. 2023, 14, 1342–1355. [Google Scholar] [CrossRef] [PubMed]
- Eker, F.; Bolat, E.; Pekdemir, B.; Duman, H.; Karav, S. Lactoferrin: Neuroprotection against Parkinson’s Disease and Secondary Molecule for Potential Treatment. Front. Aging. Neurosci. 2023, 15, 1204149. [Google Scholar] [CrossRef] [PubMed]
- Bermejo-Pareja, F.; del Ser, T.; Valentí, M.; de la Fuente, M.; Bartolome, F.; Carro, E. Salivary Lactoferrin as Biomarker for Alzheimer’s Disease: Brain-immunity Interactions. Alzheimers. Dement. 2020, 16, 1196–1204. [Google Scholar] [CrossRef]
- Luthra, N.S.S.; Clow, A.; Corcos, D.M.M. The Interrelated Multifactorial Actions of Cortisol and Klotho: Potential Implications in the Pathogenesis of Parkinson’s Disease. Brain Sci. 2022, 12, 1695. [Google Scholar] [CrossRef]


| Parameter | Inclusion Criteria | Exclusion Criteria |
|---|---|---|
| Population | Patients aged 0–99 years, both genders; sample size: 15 patients or more | sample size: below 15 patients or controls |
| Intervention/Exposure | Parkinson’s Disease | Other diseases, e.g., secondary parkinsonism |
| Comparison | Not exposed control group | Lack of control group |
| Outcomes | Alterations in salivary markers level | Alterations in other markers level (e.g., serum), microbiota |
| Study design | Case–control, cohort, and cross-sectional studies | Literature reviews, case reports, expert opinion, letters to the editor, conference reports |
| Published after 1 January 2008 | Not published in English |
| Author, Year | Setting | Study Group (F/M), Age | Control Group (F/M), Age | Type of Saliva and Method of Collection | Centrifugation and Storing | Method of Marker Determination | Salivary Biomarkers |
|---|---|---|---|---|---|---|---|
| Al-Nimer et al., 2014 [35] | Iraq | PD: 20 (4/16), 64.4 ± 10.6 (66) | 20 (2/18), 65.4 ± 8.2 (64) | unstimulated saliva collected into disposable containers | centrifuged at 3000 rpm for 10 min, stored at −20 °C | ELISA | t-α-syn |
| Angius et al., 2023 [36] | Italy | PD: 15 (5/10), 74.7 ± 7.1 | 23 (11/13), 73.9 ± 6.6 | 3 mL of saliva collected by drooling into a 50 mL vial | immediately placed on ice, centrifuged twice for 15 min at 4 °C (2600× g and 15,000× g, respectively), stored at −80 °C | ELISA | t-α-syn (ns), p-α-syn (ns), o-α-syn |
| Cao et al., 2019 [37] | China | PD: 74 (34/40), 59.62 ± 8.57 | 60 (34/26), 58.75 ± 9.85 | unstimulated saliva collected by drooling between 9 and 11 a.m. | immediately placed on ice, precleared by a low spin at 2600× g for 15 min at 4 °C, and at 15,000× g for 15 min at 4 °C, stored at −80 °C | electrochemiluminescence (ECL) immunoassays | in sEV: t-α-syn, p-α-syn (ns), o-α-syn |
| Chahine et al., 2020 [38] | North America | PD: 59 (18/41), 63.1 ± 8.6 | 21 (12/9), 61.0 ± 6.3 | 5 mL of unstimulated whole saliva | centrifuged at 2000× g for 15 min at 4 °C, stored −80 °C | ELISA | t-α-syn (ns) |
| Cressatti et al., 2020 [39] | Canada | PD: 84 (35/49), 71.39 (1.38) | 83 (44/39), 67.31 (1.04) | whole unstimulated saliva collected by passive drooling | centrifuged at 10,000 rpm for 20 min at 4 °C, stored at −80 °C | ELISA, RT-qPCR | t-α-syn (ns), o-α-syn (ns), HO-1 (ns), miR-153, miR-223, miR-7a (ns), miR-7b (ns) |
| De Bartolo et al., 2023 [40] | Italy | PD: 1st cohort: 80 (25/55), 64.5 ± 9; 2nd cohort: 28 (13/20), 62 ± 11 | 1st cohort: 62 (sex and age matched); 2nd cohort: 28 (sex and age matched) | 3 mL of saliva collected by drooling into a 50 mL vial | immediately placed on ice, centrifuged at 5000× g for 20 min at 4 °C, stored at −80 °C | ELISA | t-α-syn (ns), o-α-syn, t-tau, p-tau (ns), MAP-LC3β, TNF-α |
| Fernández-Espejo et al., 2021 [41] | Spain | PD: 45 (18/27), 61.4 ± 18.5 | 30 (18/12), 59.6 ± 11 | 3 mL of saliva collected into 5 mL polypropylene tubes | centrifuged at 2500 rpm for 10 min, immediately frozen and stored at −80 °C | ELISA | t-α-syn (ns), 3-nitrotyrosine proteins (ns) |
| Goldman et al., 2018 [42] | USA | PD: 115 (43/72), 68.24 (6.40) | 88 (43/45), 68.24 (6.40) | collected in the morning | NR | ELISA | t-α-syn (ns) |
| Rastogi et al., 2023 [43] | India | PD: 70 (NR), 56.2 (30–79); prodromal PD: 8 (NR), 58.25 (52–75) | 26 (NR), 55.0 (40–75) | 2 mL of unstimulated saliva collected from the floor of the mouth | kept on ice, centrifuged at 1700× g for 20 min at 4 °C and at 10,000× g for 20 min at 4 °C, kept at 4 °C for further experiments, stored at −80 °C for longer period | fluorescence (lipid-binding dye-labeled) NTA, antibody-based (CD63 Alexa fluor 488 tagged sEV) NTA, scatter-based NTA, Western Blot, ELISA | sEV, in sEV: t-α-syn, CD9, CD63, flotillin-1, p-α-syn, L1CAM |
| Sabaei et al., 2023 [44] | Iran | PD: 24 (10/14), 61.2 ± 8.7; AD: 24 (10/14), 73.5 ± 9.8 | 22 (13/9), 64.1 ± 9.2 | dental cotton roll placed on the oral side of the cheek, moist rolls located inside the salivary collector tubes | centrifuged at 1500 rpm for 5 min, stored at −80 °C | ELISA | Aβ42, p-tau (ns), t-α-syn |
| Shaheen et al., 2020 [45] | Egypt | PD: 25 (10/15), 60.1 ± 5.6 | 15 (5/10), 60 ± 6.7 | 3 mL of saliva collected by drooling into a 50 mL vial | immediately placed on ice, centrifuged at 2600× g for 15 min at 4 °C and at 15,000× g for 15 min at 4 °C, stored at −80 °C | ELISA | t-α-syn, o-α-syn |
| Kang et al., 2016 [46] | China | PD: 201 (79/122), 63.18 ± 9.67 | 67 (26/41), 61.04 ± 10.01 | unstimulated saliva collected between 9 and 11 a.m. into a 15 mL pre-chilled vial | immediately placed on ice, centrifuged at 2600× g for 15 min at 4 °C, and at 15,000× g for 15 min at 4 °C, stored at −80 °C | Luminex assay | t-α-syn (ns), o-α-syn |
| Vivacqua et al., 2016 [47] | Italy | PD: 60 (29/31), 66.3 ± 8.78 | 40 (18/22), 68.3 ± 7.9 | 3 mL of saliva collected by drooling into a 50 mL vial | immediately placed on ice, centrifuged at 2600× g for 15 min at 4 °C and at 15,000× g for 15 min at 4 °C, stored at −80 °C | ELISA | o-α-syn, t-α-syn |
| Vivacqua et al., 2019 [48] | Italy | PD: 112 (53/59), 69.01 ± 11.16; PSP: 22 (10/12), 68.84 ± 6.16 | 90 (37/53), 62.09 ± 15.08 | 1 mL of saliva collected by drooling into a 50 mL vial | immediately placed on ice, centrifuged at 10,000× g for 10 min at 4 °C, stored at −80 °C | ELISA | o-α-syn, t-α-syn |
| Bermejo-Pareja et al., 2010 [49] | Spain | PD: 51 (25/26); 72.96 (60–93); AD: 70 (49/21), 77.20 (60–91) | 56 (39/17), 74.35 (64–85) | approx. 1 mL of saliva collected at around 1 a.m. in sterile plastic containers previously treated with 2% sodium azide solution | centrifuged at 1500 rpm for 5 min, immediately frozen at −80 °C until used | ELISA | Aβ42 (ns), Aβ40 (ns) |
| Lau et al., 2015 [50] | Korea | PD: 20 (11/9), 73 ± 8.07; AD: 20 (12/8), 72.5 ± 7.68 | 20 (15/5), 66.1 ± 7.79 | 3 mL unstimulated saliva collected by spitting | centrifuged at 1000× g for 15 min, stored at −80 °C | ELISA, EG-ISFET | Aβ42 (not detected), p-tau (ns), t-tau (ns), trehalose (ns) |
| Carro et al., 2017 [51] | Spain | PD: 59 (32/27), 69.5 ± 8.6; AD: 80 (49/31), 76.2 ± 5.33; MCI: 44 (25/19), 75.16 ± 5.13 | 91 (59/32), 73.7 ± 6.88 | 0.5 mL of unstimulated whole saliva collected into sterile plastic containers precoated with 2% sodium azide solution | immediately placed on ice, precleared by a low spin at 600× g for 10 min at 4 °C, stored at −80 °C | ELISA | lactoferrin |
| Costa et al., 2019 [52] | Brazil | PD: 18 (6/12), 68 (62.5–71.5) | 17 (7/10), 62 (60–66) | collected in the morning with a piece of cotton, placed under the tongue | centrifuged, stored at −20 °C | ELISA | cortisol |
| Fedorova et al., 2015 [53] | Denmark | PD: 30 (14/16), 63.7 ± 9.1 | 49 (22/27), 62.7 ± 9.4 | collected by spitting into a pre-weighted test tube, saliva collected during the first 5 min was discarded, saliva obtained during the following 10–50 min was analyzed | immediately placed on ice, centrifuged at 3000 rpm for 30 min, stored at −80 °C | colorimetric method | AChE |
| Fernández-Espejo et al., 2022 [54] | Spain | PD: 64 (31/33), 65.5 ± 11.7 | 32 (14/18), 61.4 ± 10 | 3 mL of saliva collected into 5 mL polypropylene tubes | centrifuged at 2500 rpm for 10 min, immediately frozen and stored at −80 °C | ELISA | ATP13A2 |
| Galindez et al., 2021 [55] | Canada | PD: 75 (18/57), 72.65 ± 11 | 162 (99/63), 62.19 ± 12 | unstimulated whole saliva collected by passive drooling | kept at 4 °C for a maximum of 3 h, centrifuged at 10,000 rpm for 20 min at 4 °C, stored at −80 °C | ELISA | HO-1 |
| Song et al., 2018 [56] | Canada | PD: 58 (28/30), 70.83 ± 7.85 | 59 (28/31), 66.74 ± 7.63 | collected by spitting into sterilized centrifuge tubes | kept at 4 °C for a maximum of 3 h, centrifuged at 10,000× g for 20 min at 4 °C, stored at −80 °C | ELISA | HO-1 |
| Kang et al., 2014 [57] | China | PD: 285 (114/171), 63.34 ± 9.11 | 91 (32/59), 61.59 ± 10.61 | unstimulated saliva collected between 9 and 11 a.m. into a 15 mL pre-chilled vial | kept in the ice, centrifuged at 2600 × g for 15 min at 4 °C, and at 15,000× g for 15 min at 4 °C, stored at −80 °C | Luminex assay | DJ-1 |
| Masters et al., 2015 [58] | UK | PD: 16 (3/13), 61 ± 12 | 22 (11/11), 62 ± 16 | unstimulated whole saliva collected by passive drooling into a pre-weighed sterile 20 mL tube | centrifuged at 16,300 × g for 5 min | quantitative immunoblotting, amylase activity assay, ELISA, periodic-acid Schiff staining of SDS-gels | DJ-1, amylase, mucin (ns), albumin |
| Contini et al., 2023 [59] | Italy | PD: 36 (11/15), 72 ± 7; AD: 35 (23/12), 80 ± 6 | 36 (18/18), 78 ± 6 | unstimulated whole saliva collected between 9 and 12 a.m. with a soft plastic aspirator for less than 1 min, transferred to a plastic tube cooled on ice | centrifuged at 20,000× g for 15 min at 4 °C, stored at −80 °C or immediately analyzed | RP-HPLC-LR-ESI-MS analysis | proteomics |
| Figura et al., 2021 [60] | Poland | PD: 24 (9/15), 61.6 ± 8.2 | 15 (5/9), 60.9 ± 6.7 | collected in the morning using RNA-Pro-Sal kits | immediately frozen at −80 °C | LC-MS/MS mass spectrometry | proteomics |
| Kumari et al., 2020 [61] | India | PD: 76 (17/59), 54.96 ± 7.82 | 37 (23/14), 53 ± 8.57 | 2 mL of unstimulated whole saliva collected by swab (passive drooling) between 9 and 11 a.m. | immediately stored at −80 °C, centrifuged at 2000 × g for 10 min at 4 °C | NMR | metabolomics |
| Chen et al., 2020 [62] | China | PD: 30 (10/20), 63.20 ± 10.17 | 30 (14/16), 59.57 ± 12.83 | collected at a fasting state in the morning | centrifuged at 3000× g for 15 min at 4 °C and at 12,000 × g for 10 min at 4 °C, stored at −80 °C | RT-qPCR | miR-874, miR-145-3p |
| Jiang et al., 2021 [63] | China | PD: 50 (31/19), 63.62 ± 11.65 | 30 (16/14), 59.67 ± 11.18 | 1–3 mL of saliva collected | kept at 4 °C for a maximum of 3 h, centrifuged at 12,000× g for 20 min at 4 °C, stored at −80 °C | RT-qPCR | miR-29a-3p, miR-29c-3p, miR-6085 (ns), miR6724-5p (ns), miR-6893-5p (ns), miR-6756-5p, miR-6892-3p (ns), miR4731-3p (ns) |
| Chuang et al., 2017 [64] | USA | PD: 128 (NR), NR | 131 (sex and age matched | NR | NR | Illumina HumanMethylation450 BeadChip | DNA methylation |
| Study | Most Discriminant Markers | AUC | −95% CI | +95% CI | Sensitivity [%] | Specificity [%] |
|---|---|---|---|---|---|---|
| Cao et al., 2019 [37] | o-α-syn in sEV | 0.941 | 0.896 | 0.985 | 92 | 86 |
| Chen et al., 2020 [62] | miR-874 | 0.727 | - | - | 64.3 | 78.6 |
| miR-145-3p | 0.707 | - | - | 60 | 75 | |
| Cressatti et al., 2020 [39] | miR-153 | 0.79 | 64.5 | 99.2 | 81.8 | 71.4 |
| miR-223 | 0.74 | 59.6 | 93.0 | 72.7 | 71.4 | |
| De Bartolo et al., 2023 [40] | o-α-syn | 0.998 | - | - | 100 | 98.39 |
| MAP-LC3β | 0.924 | - | - | 91.25 | 88.71 | |
| TNF-α | 0.660 | - | - | 61.25 | 90.32 | |
| Figura et al., 2021 [60] | S100A16 | 0.7 | - | - | 91 | 67 |
| ARPC1A | 0.62 | - | - | 40 | 100 | |
| Galindez et al., 2021 [55] | HO-1 | 0.86 | 0.81 | 0.91 | 83 | 75 |
| Jiang et al., 2021 [63] | miR-29a-3p | 0.692 | 0.573 | 0.812 | 79.3 | 51.2 |
| miR-29c-3p | 0.722 | 0.583 | 0.861 | 65.4 | 70.6 | |
| miR-6756-5p | 0.640 | 0.505 | 0.774 | 66.7 | 58.6 | |
| miR-29a-3p and miR-29c-3p (combined) | 0.773 | 0.639 | 0.908 | 66.7 | 83.8 | |
| Kumari et al., 2020 [61] | histidine | 0.72 | 0.61 | 0.80 | 64.00 | 64.86 |
| propionate | 0.71 | 0.60 | 0.80 | 68.42 | 67.57 | |
| tyrosine | 0.69 | 0.59 | 0.79 | 72.00 | 59.46 | |
| isoleucine | 0.69 | 0.58 | 0.78 | 65.79 | 67.57 | |
| acetoin | 0.68 | 0.57 | 0.77 | 63.16 | 62.16 | |
| NAG | 0.67 | 0.56 | 0.76 | 65.79 | 59.46 | |
| acetoacetate | 0.67 | 0.56 | 0.77 | 64.86 | 64.86 | |
| valine | 0.67 | 0.56 | 0.76 | 67.11 | 64.86 | |
| Rastogi et al., 2023 [43] | sEV | 0.967 | - | - | 94.34 | 90.91 |
| t-α-syn in sEV | 0.814 | - | - | 88.24 | 75.00 | |
| Sabaei et al., 2023 [44] | Aβ42 | 0.77 | - | - | 91.7 | 59.1 |
| t-α-syn | 0.68 | - | - | 95.8 | 36.4 | |
| p-tau | 0.64 | - | - | 91.7 | 50.0 | |
| Shaheen et al., 2020 [45] | t-α-syn | 0.823 | - | - | 80.0 | 86.7 |
| o-α-syn | 0.724 | - | - | 76.0 | 60.0 | |
| Song et al., 2018 [56] | HO-1 | 0.76 | 0.63 | 0.90 | 75 | 70 |
| Study | SMD | 95% CI | p-Value | Weight |
|---|---|---|---|---|
| Alpha-synuclein total | ||||
| Al-Nimer et al., 2014 [35] | −0.786 | −1.438 to −0.134 | 7.62 | |
| Angius et al., 2023 [36] | −0.172 | −0.832 to 0.488 | 7.59 | |
| Cao et al., 2019 [37] | −0.024 | −0.366 to 0.317 | 8.99 | |
| Chahine et al., 2020 [38] | 0.025 | −0.476 to 0.526 | 8.31 | |
| De Bartolo et al., 2023 [40] | 0.050 | −0.283 to 0.383 | 9.02 | |
| Fernández-Espejo et al., 2021 [41] | −0.112 | −0.578 to 0.353 | 8.48 | |
| Goldman et al., 2018 [42] | 0.349 | −0.229 to 0.927 | 7.97 | |
| Kang et al., 2016 [46] | −0.027 | −0.303 to 0.250 | 9.22 | |
| Sabaei et al., 2023 [44] | −0.771 | −1.378 to −0.164 | 7.83 | |
| Shaheen et al., 2020 [45] | −1.106 | −1.800 to −0.411 | 7.41 | |
| Vivacqua et al., 2016 [47] | −1.817 | −2.293 to −1.341 | 8.42 | |
| Vivacqua et al., 2019 [48] | −1.203 | −1.505 to −0.900 | 9.13 | |
| Total (random effects) | −0.458 | −0.835 to −0.081 | 0.017 | |
| Alpha-synuclein oligomeric | ||||
| Angius et al., 2023 [36] | 0.879 | 0.189 to 1.568 | 18.49 | |
| De Bartolo et al., 2023 [40] | 1.406 | 1.034 to 1.777 | 21.14 | |
| Shaheen et al., 2020 [45] | 0.772 | 0.101 to 1.443 | 18.66 | |
| Vivacqua et al., 2016 [47] | 2.304 | 1.788 to 2.820 | 19.99 | |
| Vivacqua et al., 2019 [48] | 0.462 | 0.180 to 0.744 | 21.72 | |
| Total (random effects) | 1.165 | 0.488 to 1.841 | 0.001 | |
Disclaimer/Publisher’s Note: The statements, opinions and data contained in all publications are solely those of the individual author(s) and contributor(s) and not of MDPI and/or the editor(s). MDPI and/or the editor(s) disclaim responsibility for any injury to people or property resulting from any ideas, methods, instructions or products referred to in the content. |
© 2024 by the authors. Licensee MDPI, Basel, Switzerland. This article is an open access article distributed under the terms and conditions of the Creative Commons Attribution (CC BY) license (https://creativecommons.org/licenses/by/4.0/).
Share and Cite
Nijakowski, K.; Owecki, W.; Jankowski, J.; Surdacka, A. Salivary Biomarkers for Parkinson’s Disease: A Systematic Review with Meta-Analysis. Cells 2024, 13, 340. https://doi.org/10.3390/cells13040340
Nijakowski K, Owecki W, Jankowski J, Surdacka A. Salivary Biomarkers for Parkinson’s Disease: A Systematic Review with Meta-Analysis. Cells. 2024; 13(4):340. https://doi.org/10.3390/cells13040340
Chicago/Turabian StyleNijakowski, Kacper, Wojciech Owecki, Jakub Jankowski, and Anna Surdacka. 2024. "Salivary Biomarkers for Parkinson’s Disease: A Systematic Review with Meta-Analysis" Cells 13, no. 4: 340. https://doi.org/10.3390/cells13040340
APA StyleNijakowski, K., Owecki, W., Jankowski, J., & Surdacka, A. (2024). Salivary Biomarkers for Parkinson’s Disease: A Systematic Review with Meta-Analysis. Cells, 13(4), 340. https://doi.org/10.3390/cells13040340