
Modifying the Glycocalyx of Melanoma Cells via Metabolic Glycoengineering Using N-Acetyl-d-glucosamine Analogues

 , ,
, , 
Abstract
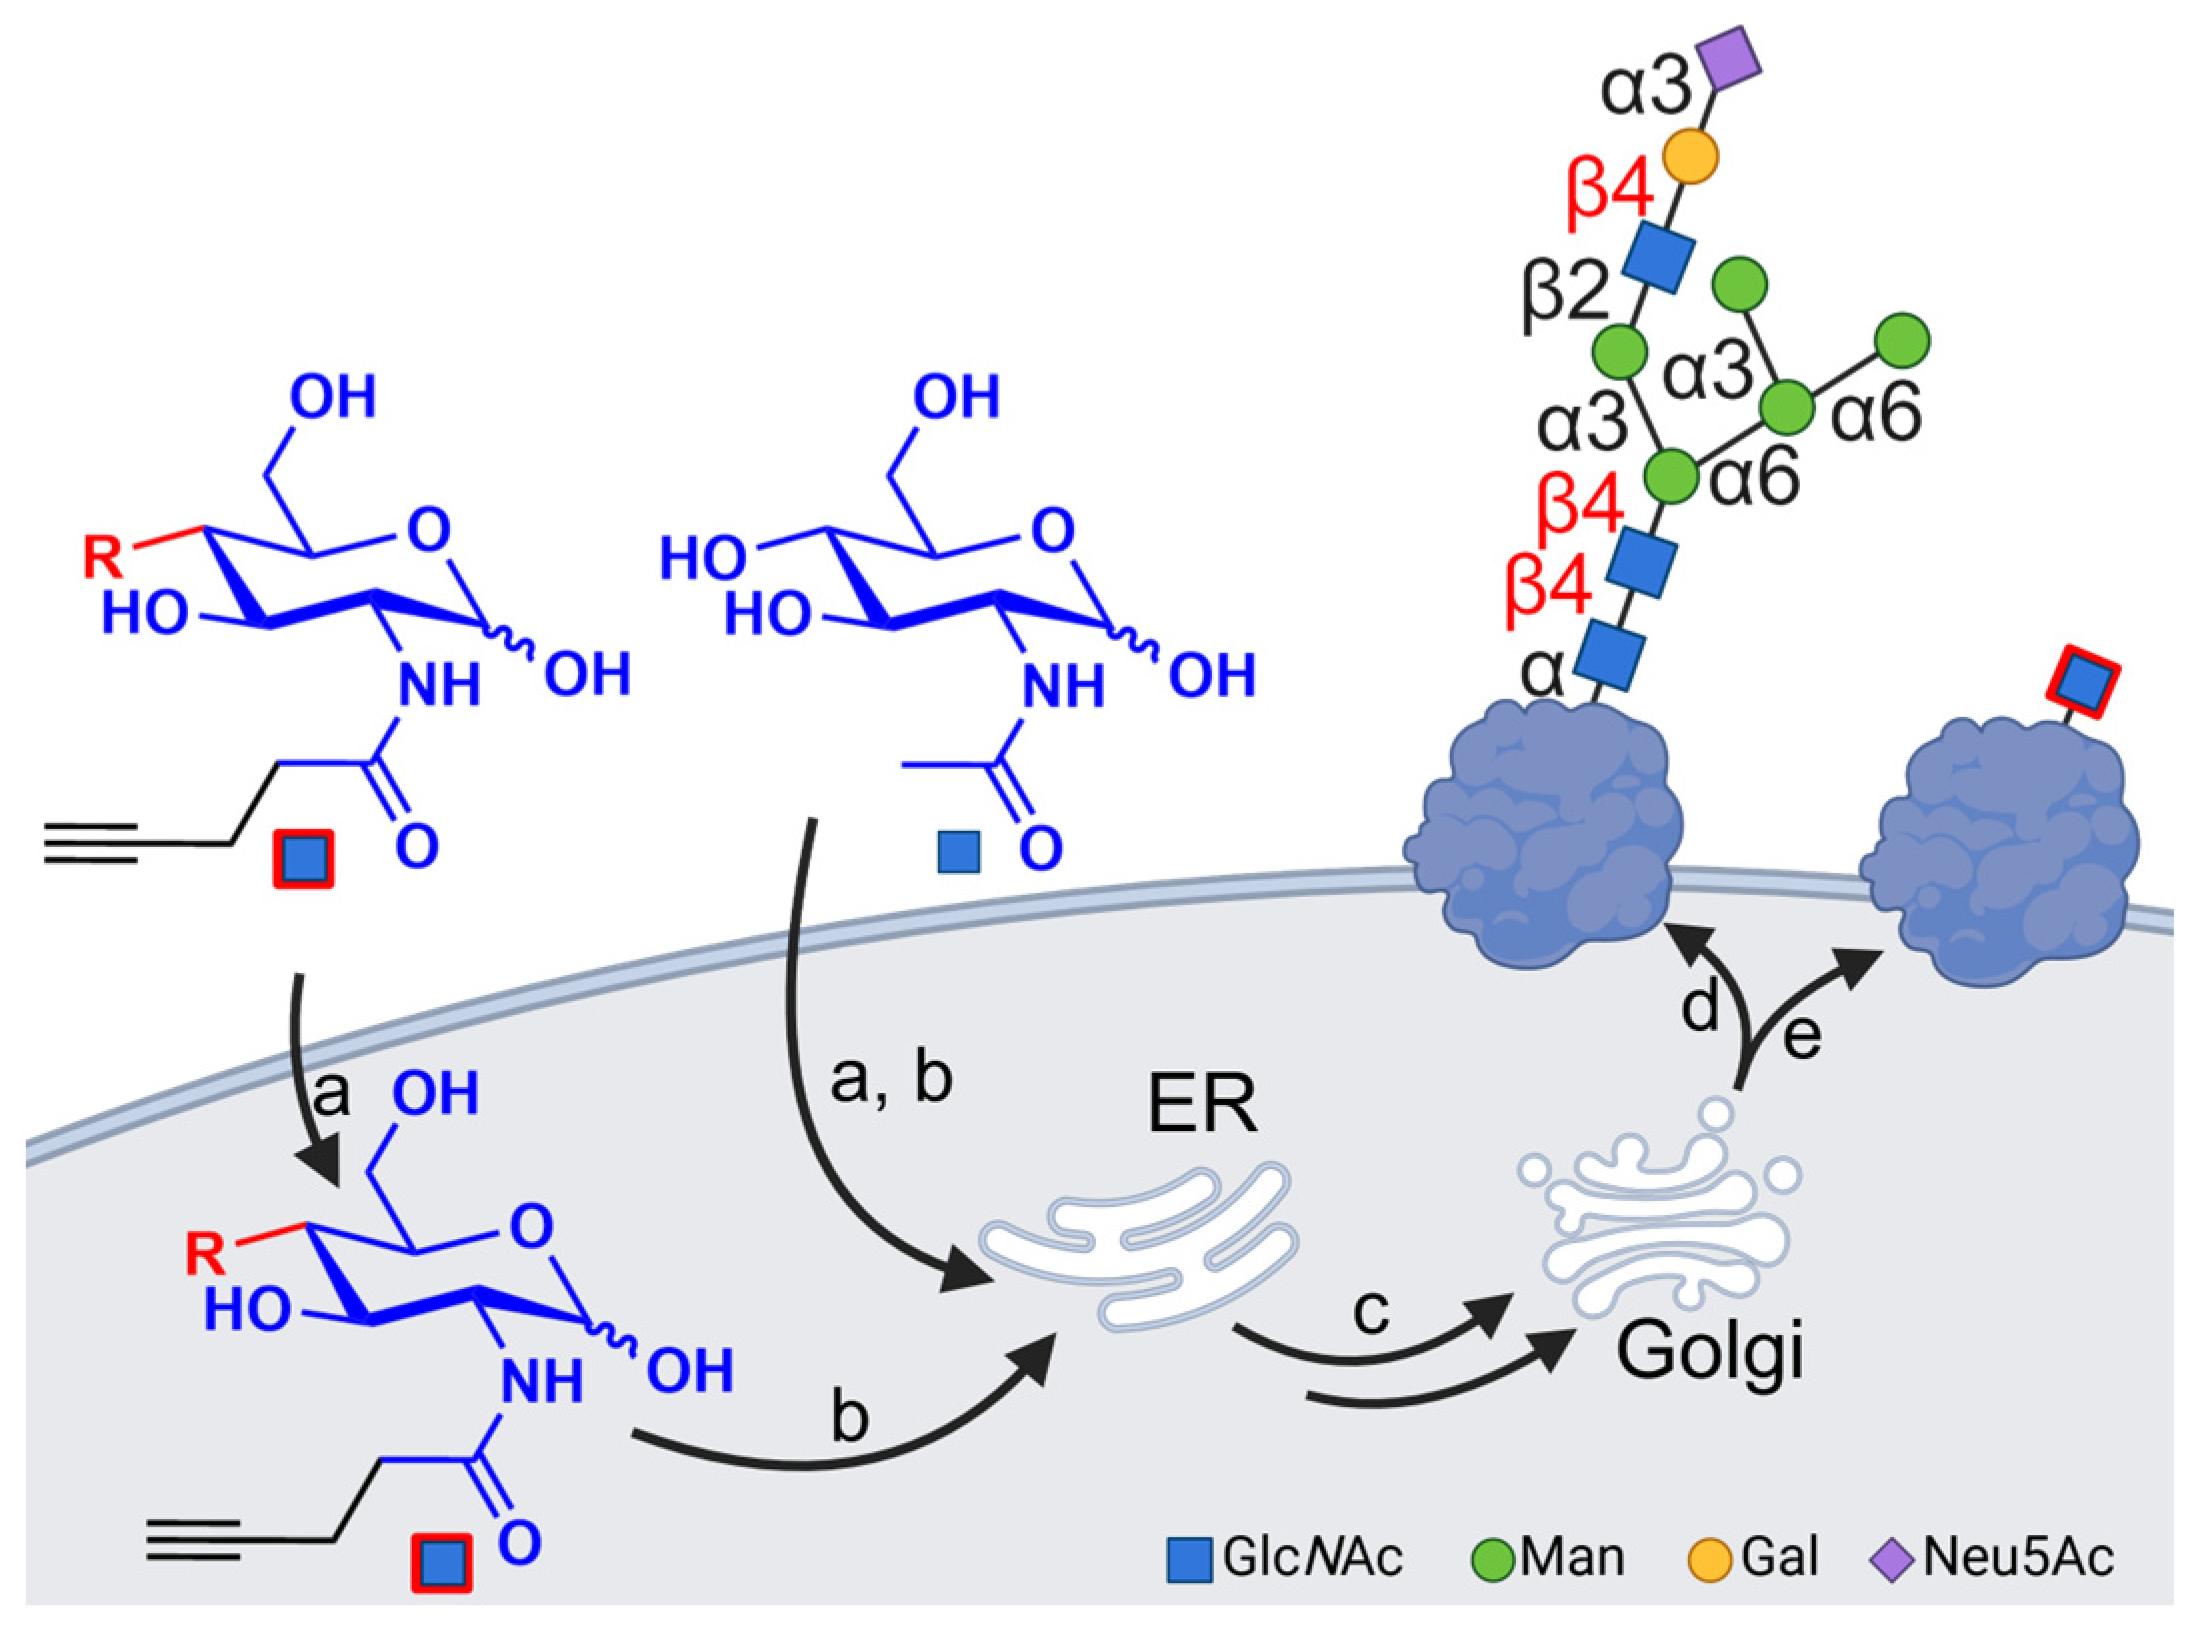
1. Introduction
2. Methods
2.1. Chemicals and Reagents
2.2. Cell Lines
2.3. Analyses of Sugar Incorporation
2.4. Degradation of Sugars in Glycocalyx
2.5. Protein Extraction
2.6. Western Blot
2.7. Precipitation of Glycoproteins
2.8. Silver Staining
2.9. Precipitation Western Blot
2.10. Proliferation Assays
2.11. XTT Assay
2.12. Clonogenic Assay
2.13. Lectin Assay
2.14. Statistical Analysis
3. Results
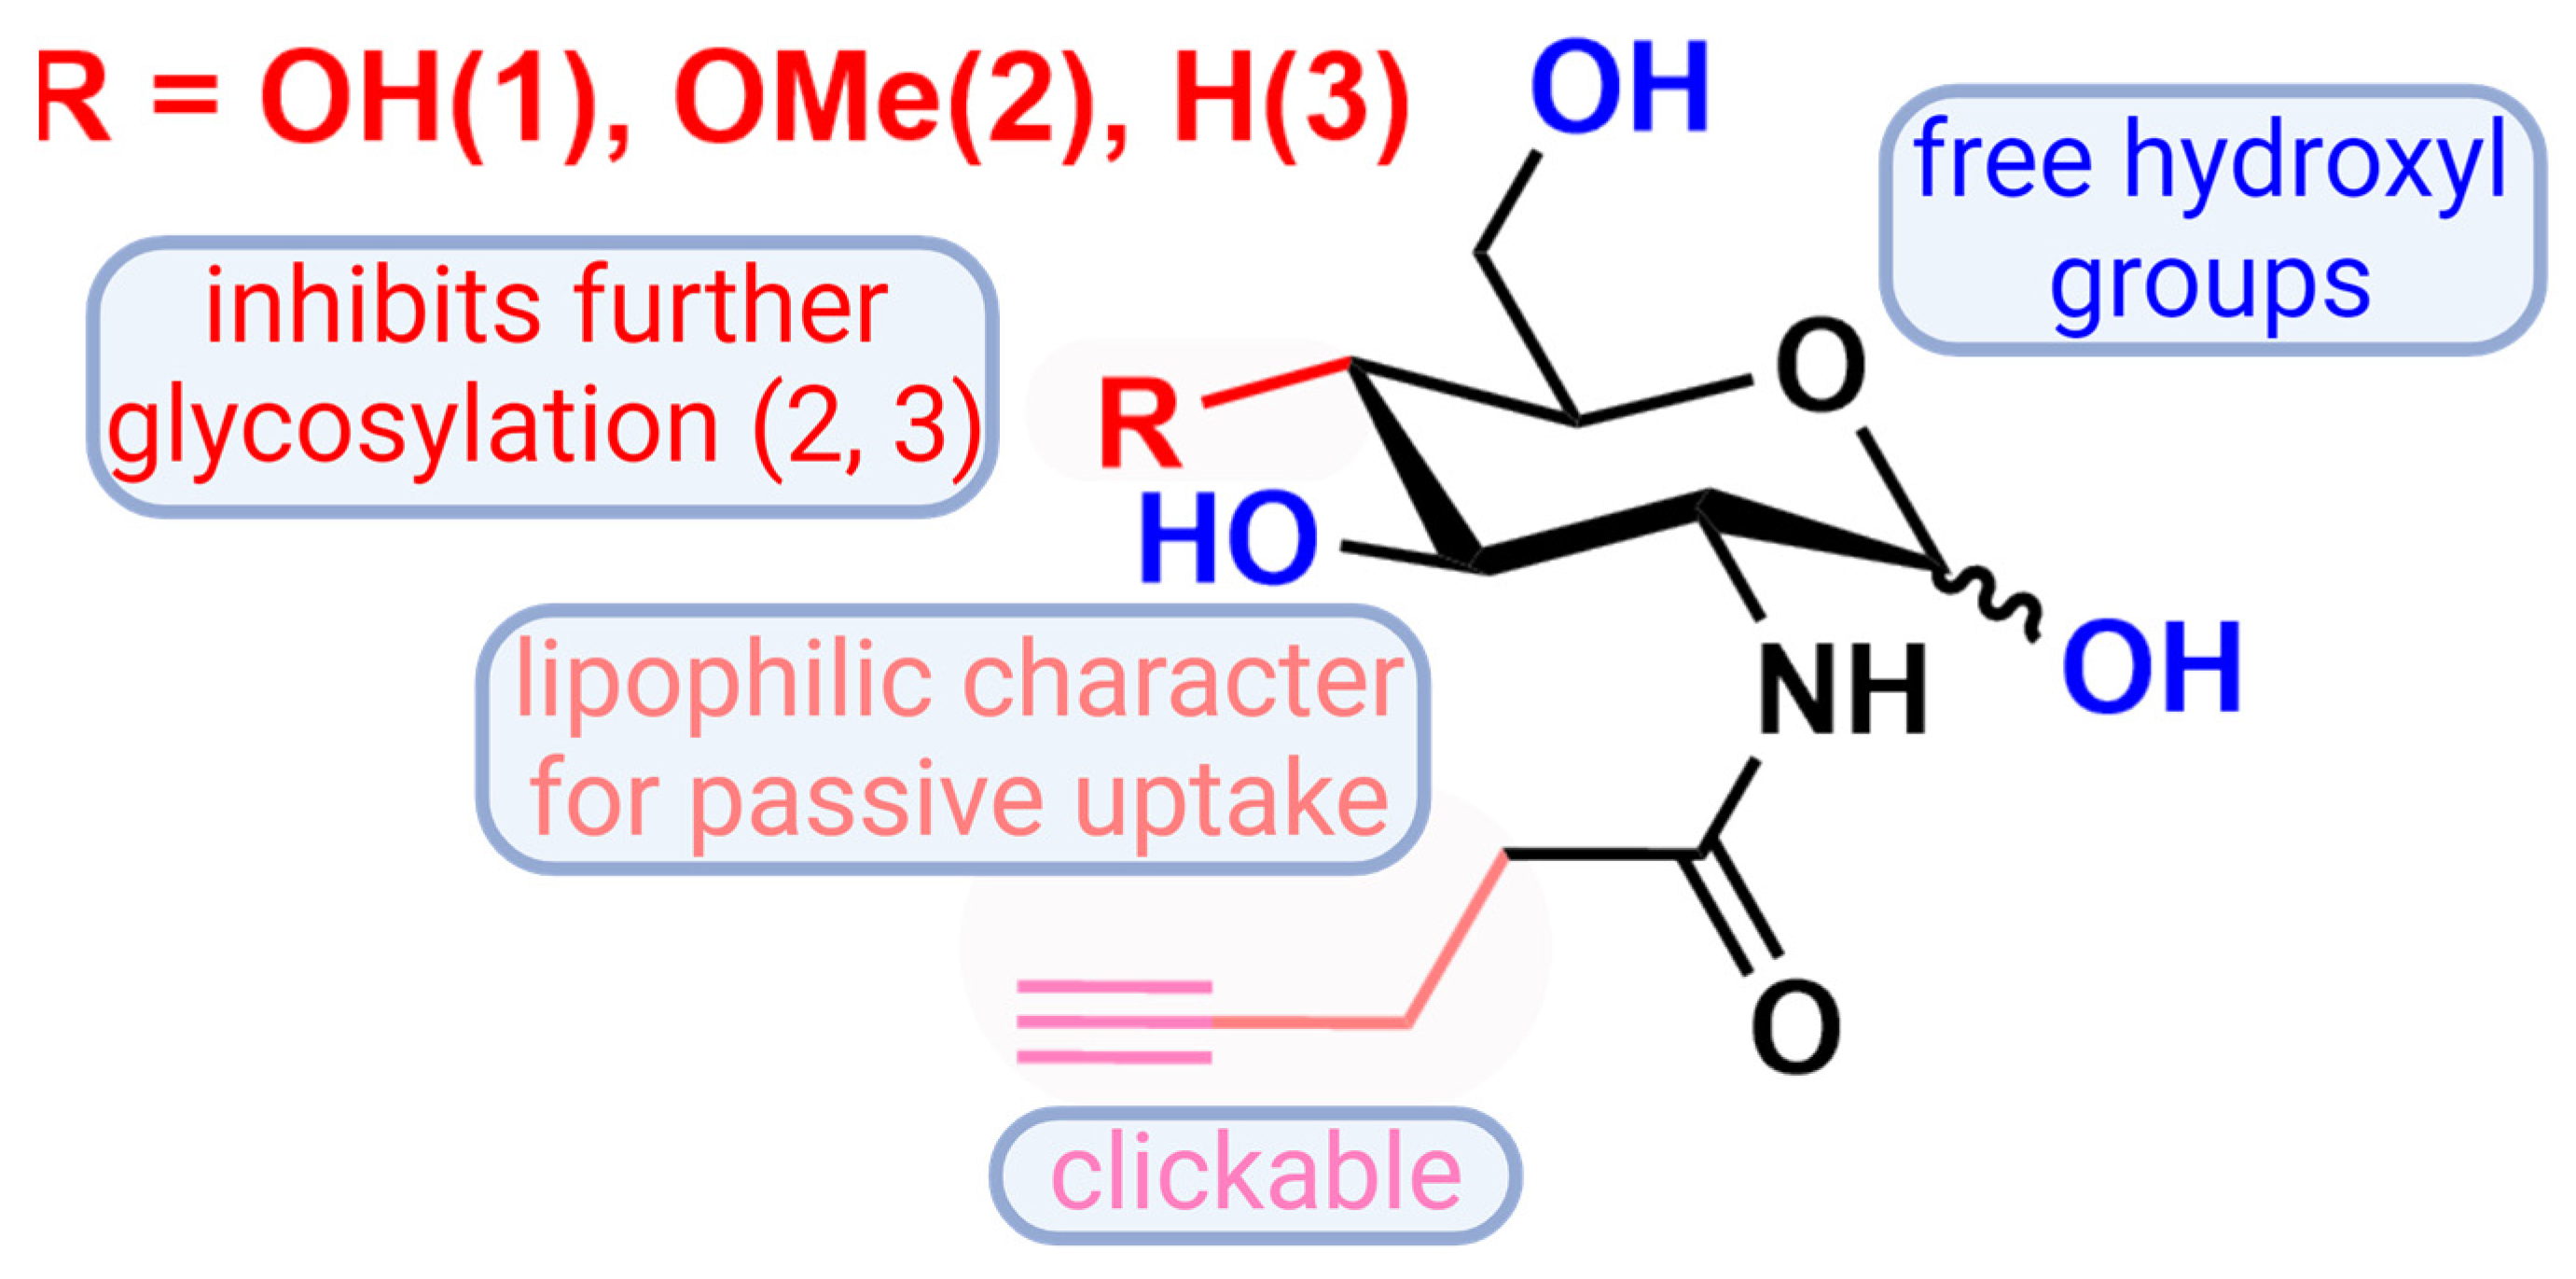
3.1. Synthesis of Artificial Glucosamine Derivatives
3.2. Incorporation of Modified N-Acetylglucosamines in Glycocalyx
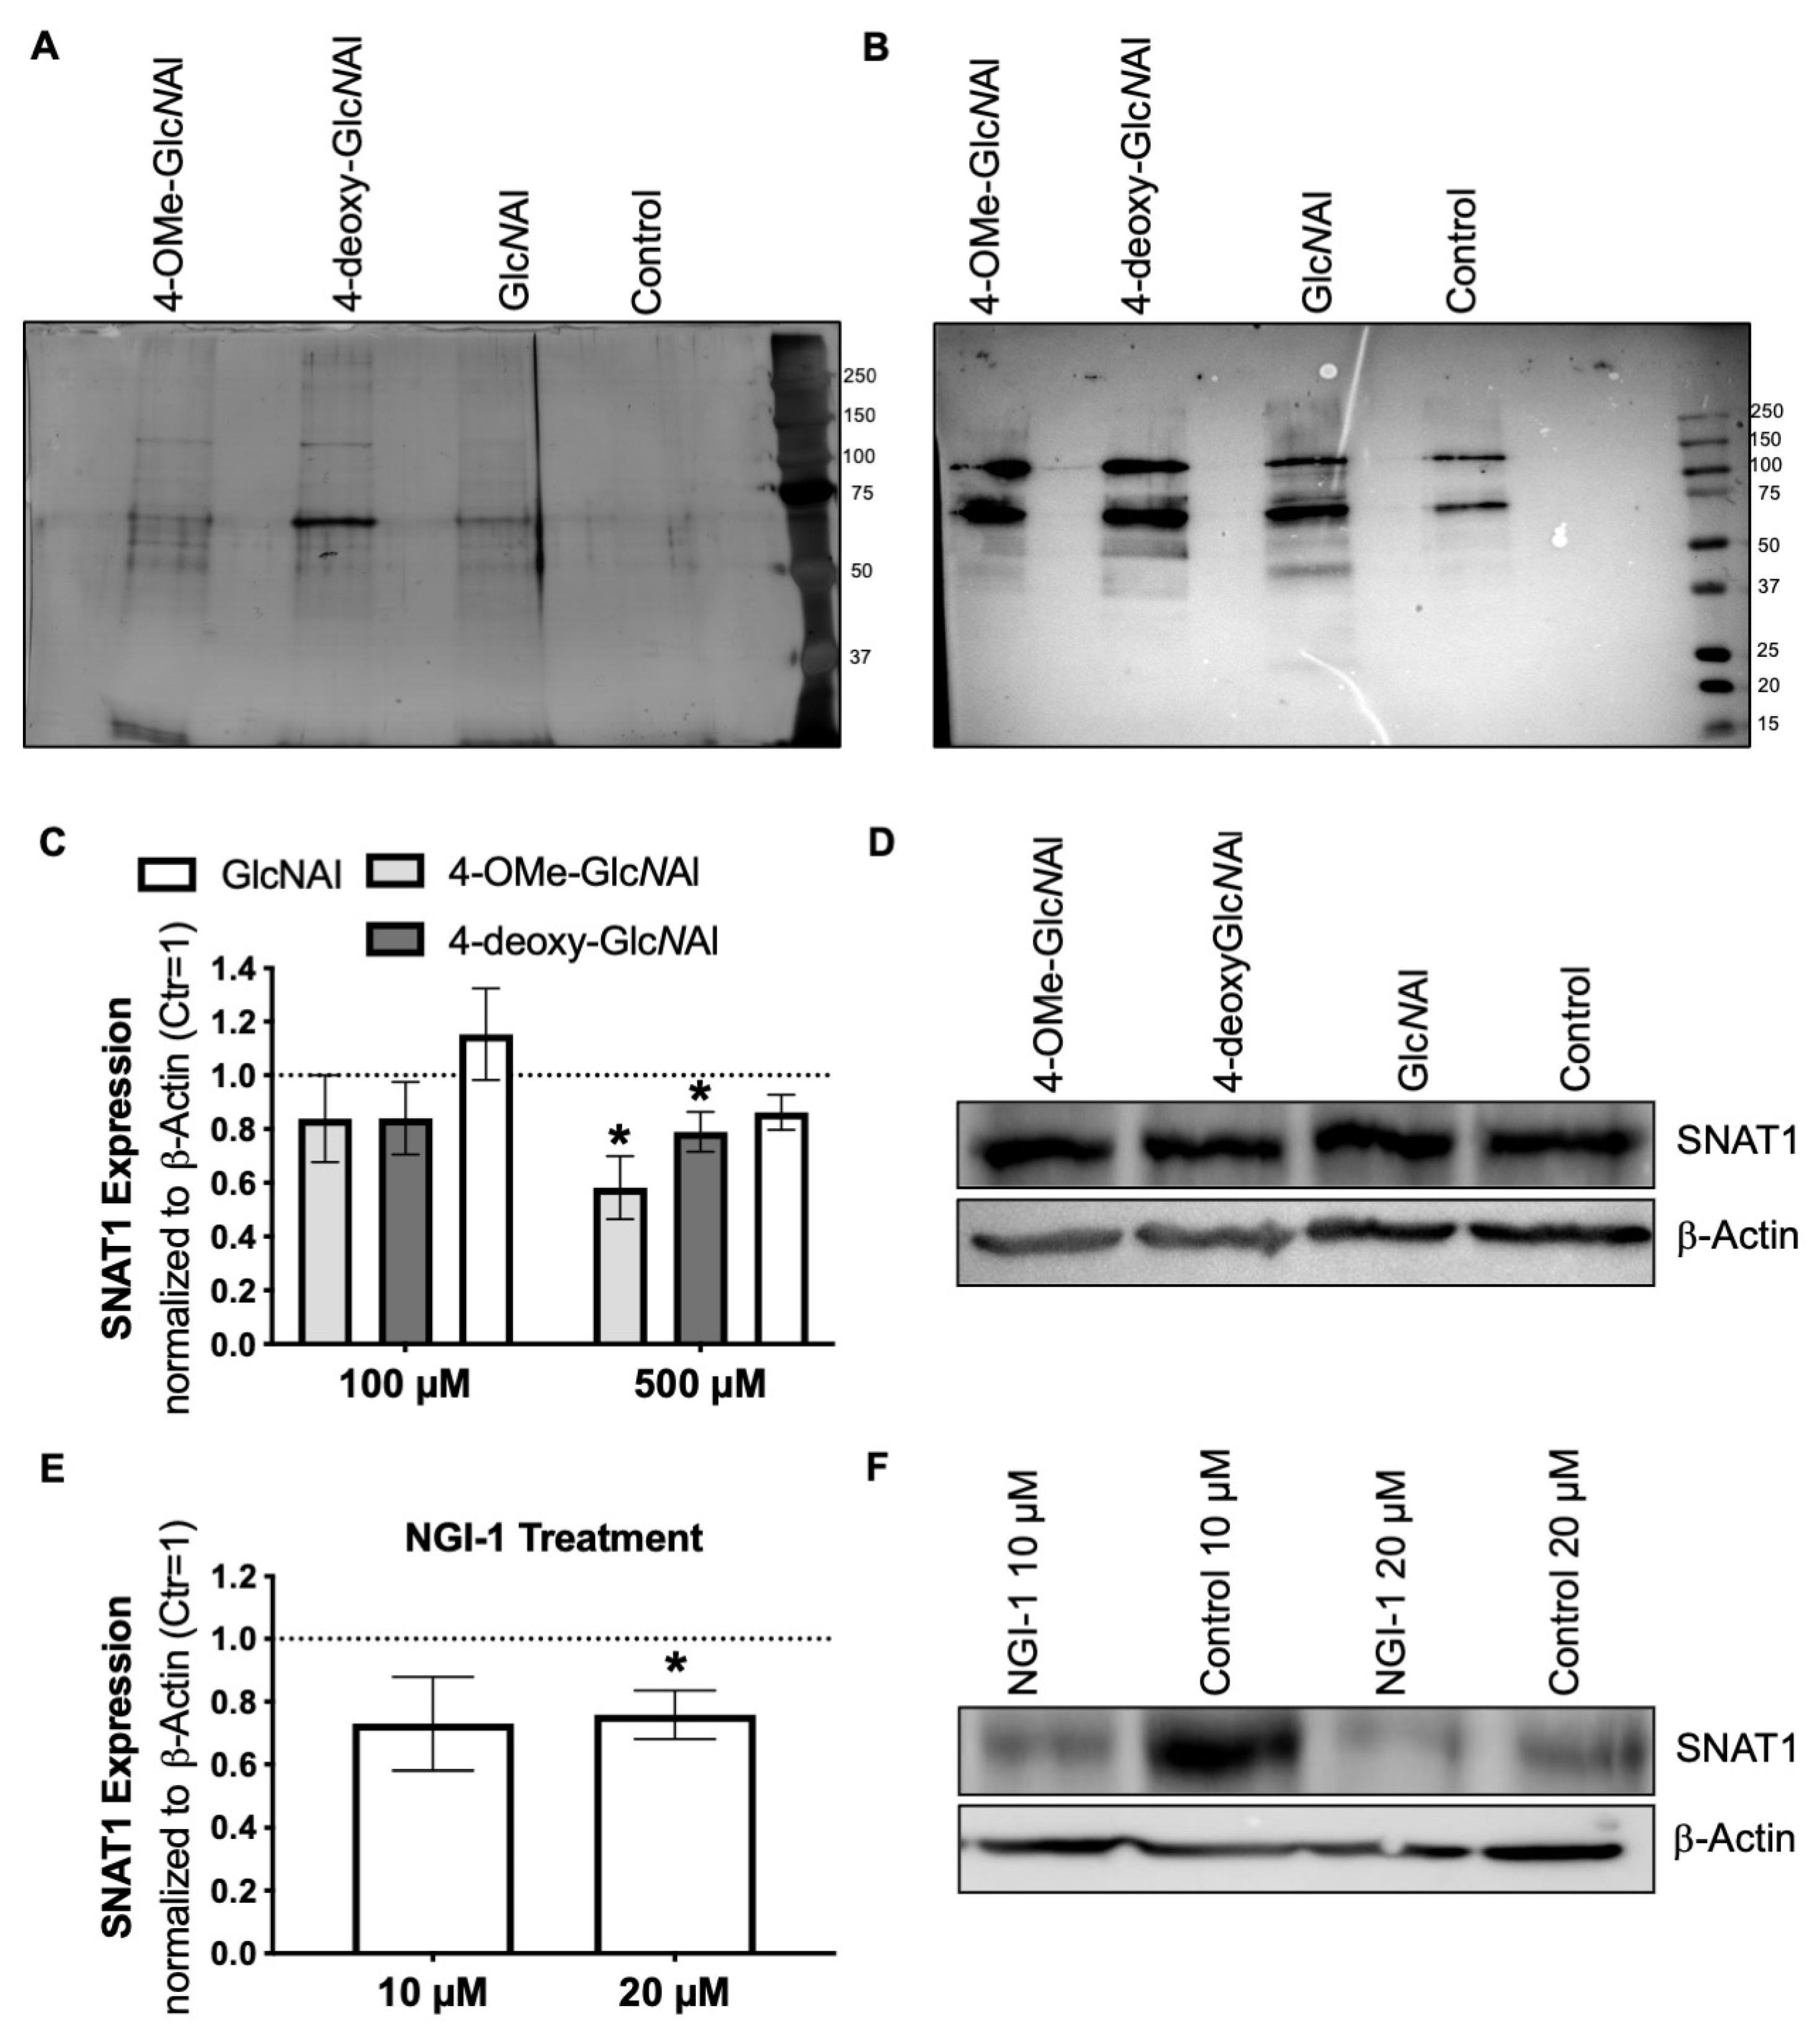
3.3. Changes in Protein Glycosylation
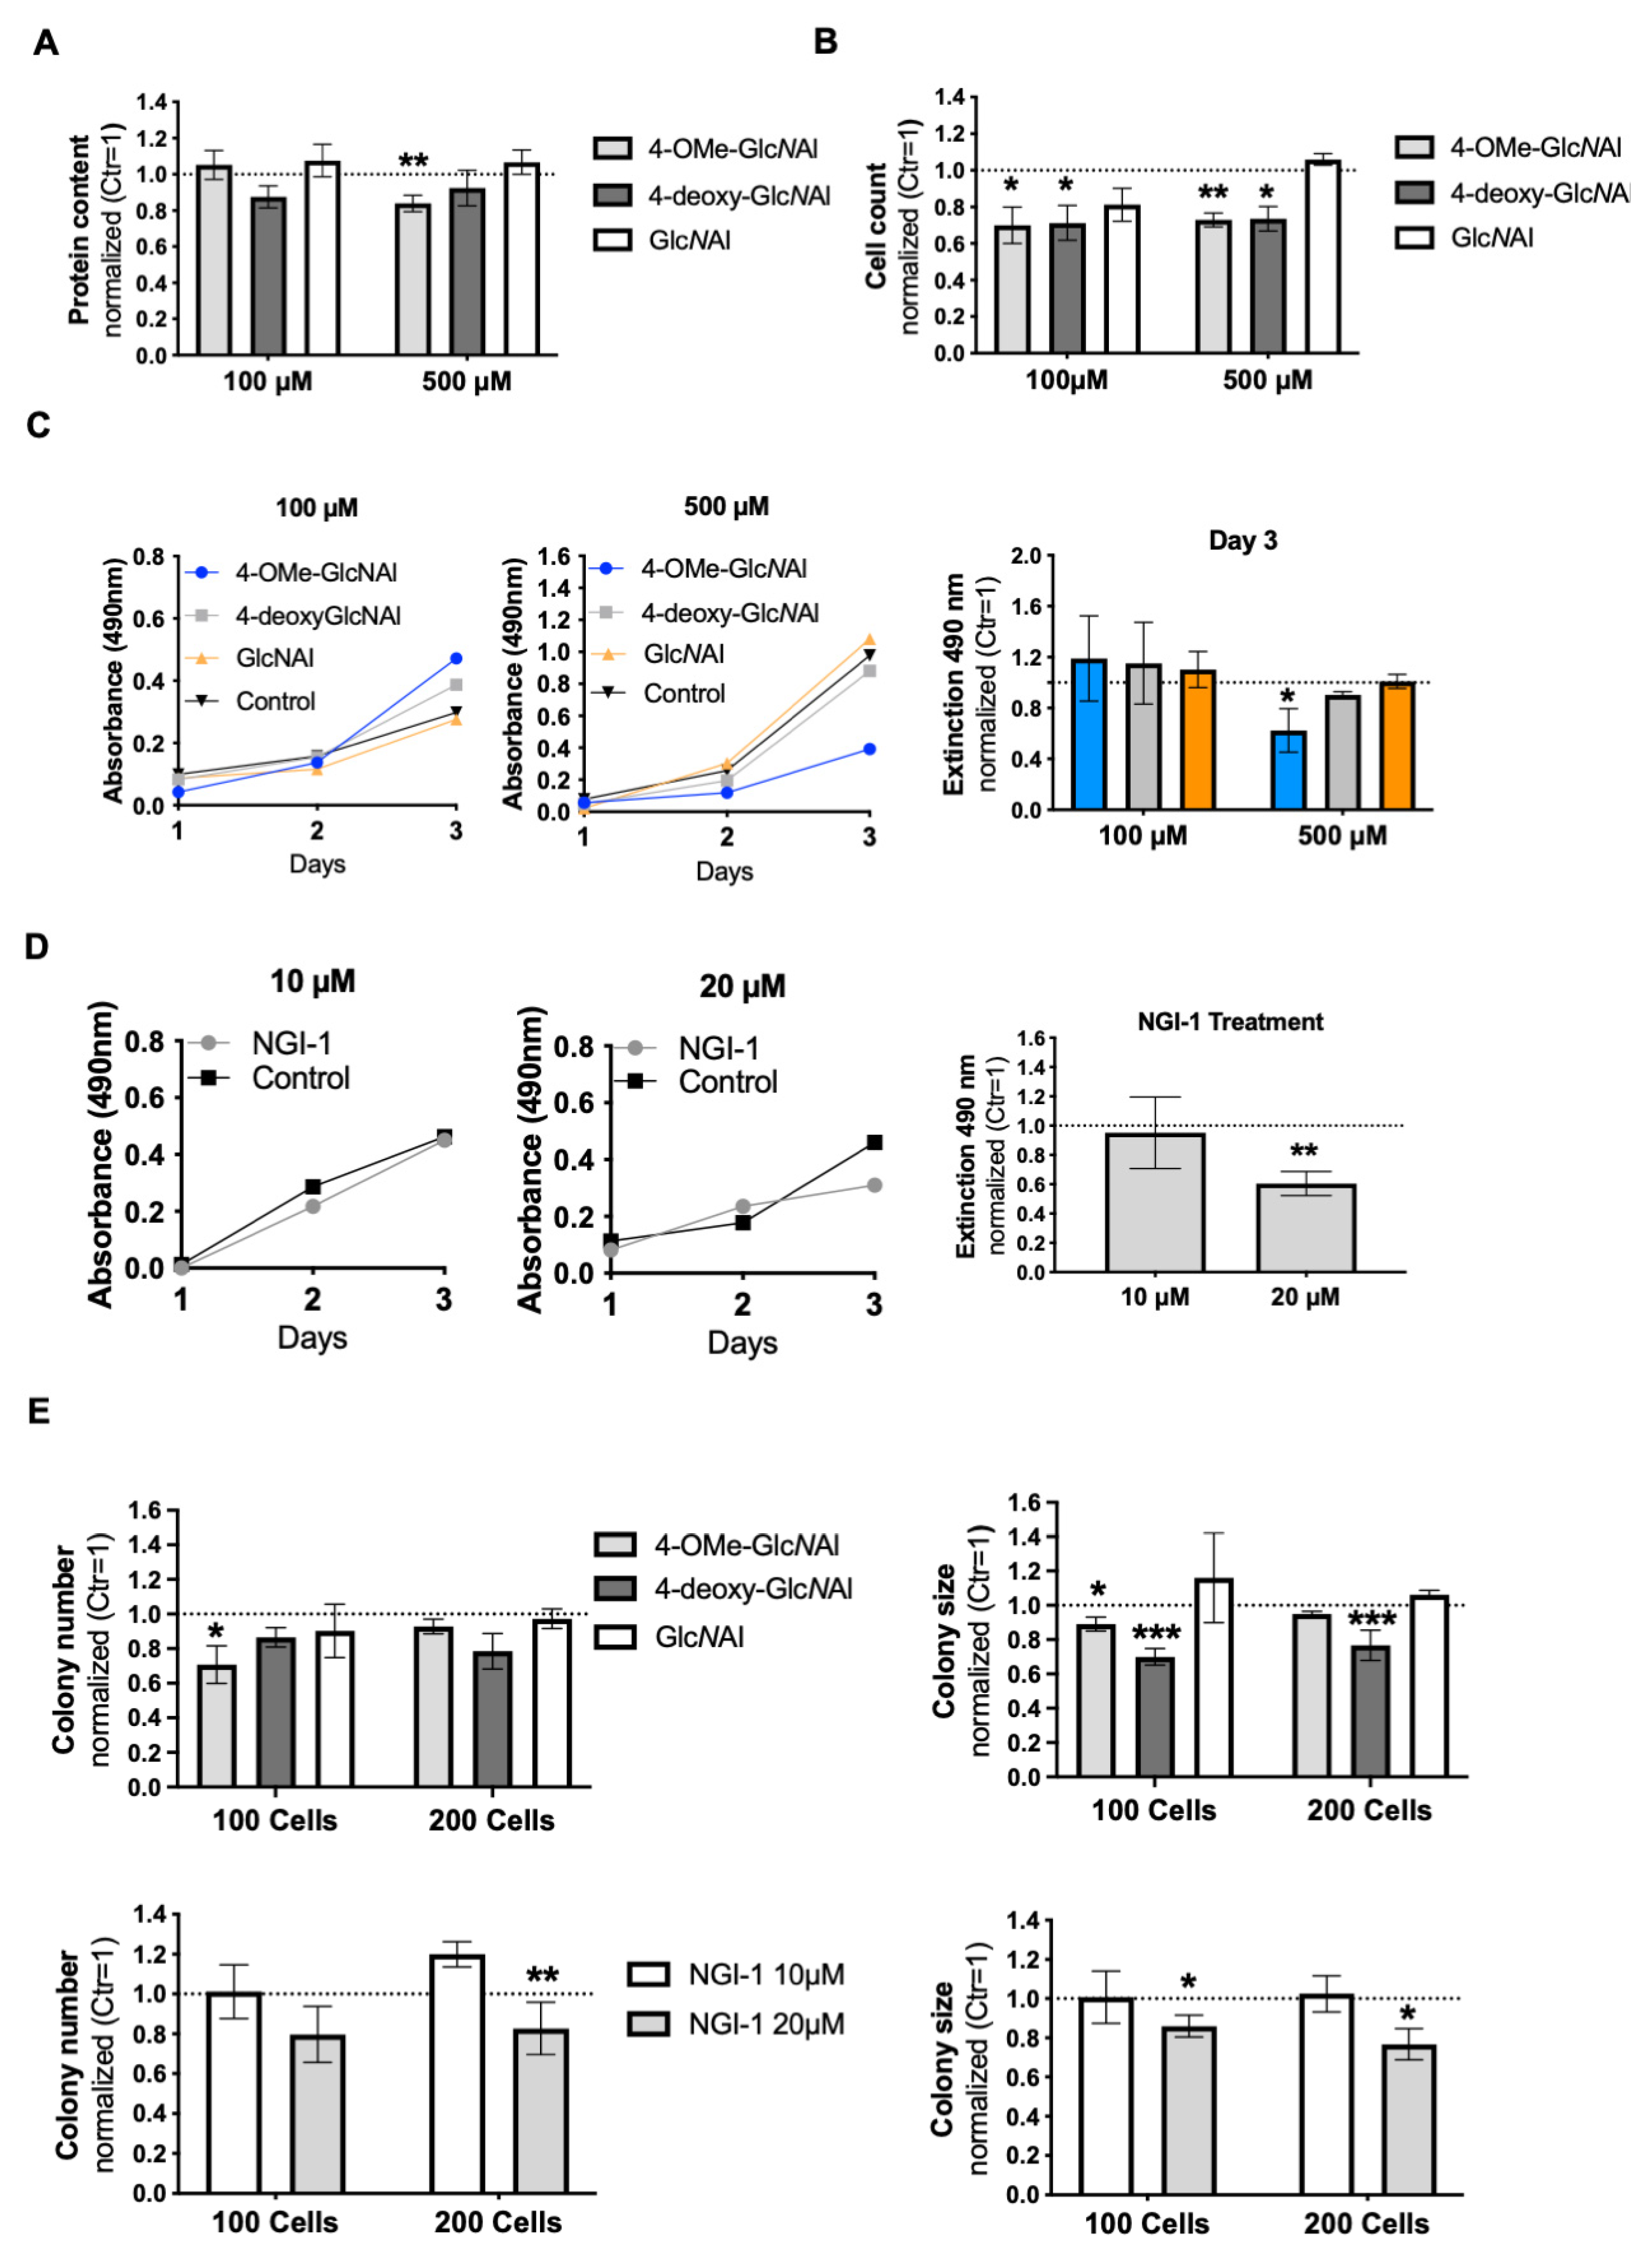
3.4. Effects on Cellular Level
3.5. Assessment of Defined Changes in Glycocalyx Using Modified GlcNAc
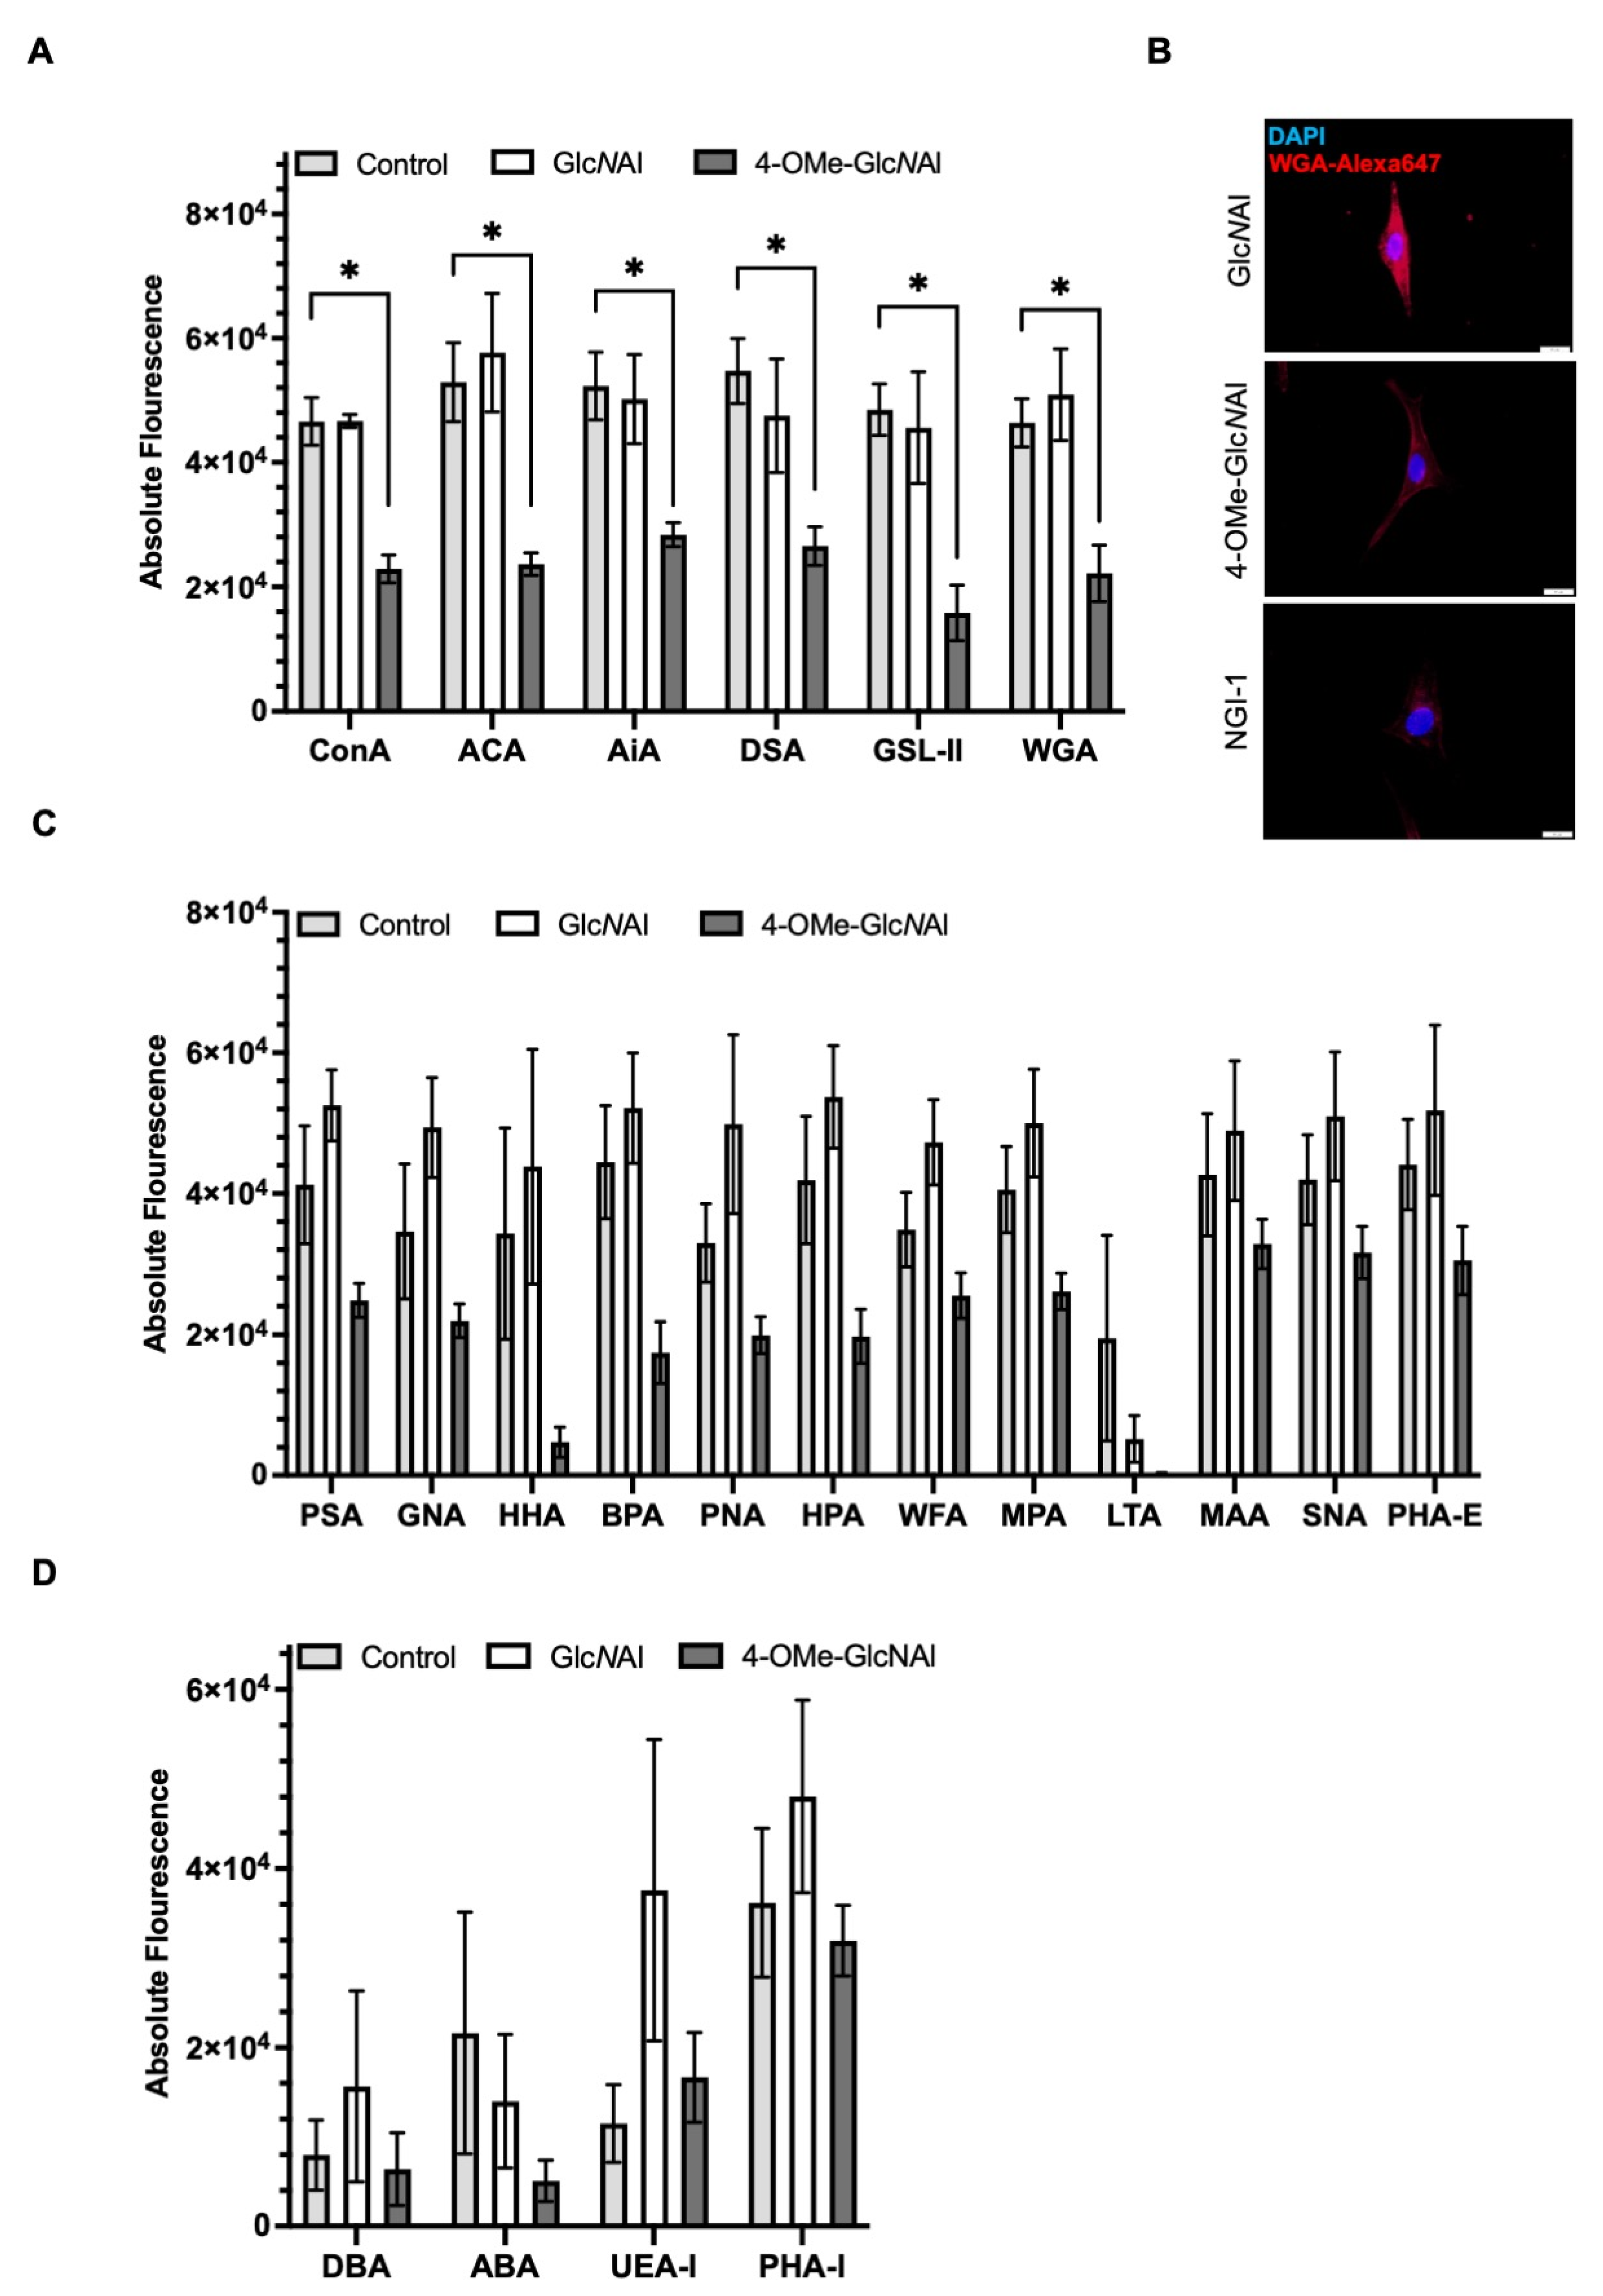
- (a)
- In the first group, 4-OMe-GlcNAl 2 resulted in a significant reduction in the cellular binding affinity to certain lectins. These include ConA, ACA, AiA, DSA, GSL-II, and WGA. Conversely, GlcNAl 1 demonstrated no effect on the binding affinity of these sugars compared to the untreated control (Figure 6A). Performing staining with fluorescence-labeled WGA, which specifically binds to N-acetyl-d-glucosamine, revealed a strong immunofluorescence signal in control-treated cells (GlcNAl 1). Cells treated with 4-OMe-GlcNAl 2 and NGI-1 revealed less to almost no staining, again proving changes in glycocalyx composition after the incorporation of 4-OMe-GlcNAl (Figure 6B).
- (b)
- In the second group, we observed a similar reduction concerning the binding affinity of 4-OMe-GlcNAl 2 compared to GlcNAl 1 and the control for lectins such as PSA, PNA, GNA, HHA, BPA, HPA, WFA, MPA, MAA, SNA, and PHA-E; however, based on the variances, this did not reach statistical significance (Figure 6C).
- (c)
- In a third group with DBA, ABA, UEA-1, and PHA-L, no influence of the two unnatural monosaccharides on the binding affinity was determined (Figure 6D).
4. Discussion
5. Conclusions
Supplementary Materials
Author Contributions
Funding
Institutional Review Board Statement
Informed Consent Statement
Data Availability Statement
Acknowledgments
Conflicts of Interest
References
- Varki, A. (Ed.) Essentials of Glycobiology, 4th ed.; Cold Spring Harbor Laboratory Press: Cold Spring Harbor, NY, USA, 2022. [Google Scholar]
- Constantinou, P.E.; Morgado, M.; Carson, D.D. Transmembrane Mucin Expression and Function in Embryo Implantation and Placentation. Adv. Anat. Embryol. Cell Biol. 2015, 216, 51–68. [Google Scholar] [PubMed]
- Möckl, L. The Emerging Role of the Mammalian Glycocalyx in Functional Membrane Organization and Immune System Regulation. Front. Cell Dev. Biol. 2020, 8, 253. [Google Scholar] [CrossRef]
- Lipowsky, H.H. The endothelial glycocalyx as a barrier to leukocyte adhesion and its mediation by extracellular proteases. Ann. Biomed. Eng. 2012, 40, 840–848. [Google Scholar] [CrossRef] [PubMed]
- Magalhães, A.; Duarte, H.O.; Reis, C.A. Aberrant Glycosylation in Cancer: A Novel Molecular Mechanism Controlling Metastasis. Cancer Cell 2017, 31, 733–735. [Google Scholar] [CrossRef] [PubMed]
- Shurer, C.R.; Colville, M.J.; Gupta, V.K.; Head, S.E.; Kai, F.; Lakins, J.N.; Paszek, M.J. Genetically Encoded Toolbox for Glycocalyx Engineering: Tunable Control of Cell Adhesion, Survival, and Cancer Cell Behaviors. ACS Biomater. Sci. Eng. 2018, 4, 388–399. [Google Scholar] [CrossRef]
- Mulivor, A.W.; Lipowsky, H.H. Role of glycocalyx in leukocyte-endothelial cell adhesion. Am. J. Physiol. Heart Circ. Physiol. 2002, 283, H1282–H1291. [Google Scholar] [CrossRef]
- Fu, B.M.; Tarbell, J.M. Mechano-sensing and transduction by endothelial surface glycocalyx: Composition, structure, and function. Wiley Interdiscip. Rev. Syst. Biol. Med. 2013, 5, 381–390. [Google Scholar] [CrossRef]
- Tarbell, J.M.; Simon, S.I.; Curry, F.-R.E. Mechanosensing at the vascular interface. Annu. Rev. Biomed. Eng. 2014, 16, 505–532. [Google Scholar] [CrossRef]
- Jandus, C.; Boligan, K.F.; Chijioke, O.; Liu, H.; Dahlhaus, M.; Démoulins, T.; Schneider, C.; Wehrli, M.; Hunger, R.E.; Baerlocher, G.M.; et al. Interactions between Siglec-7/9 receptors and ligands influence NK cell-dependent tumor immunosurveillance. J. Clin. Investig. 2014, 124, 1810–1820. [Google Scholar] [CrossRef]
- D’Addio, M.; Frey, J.; Otto, V.I. The manifold roles of sialic acid for the biological functions of endothelial glycoproteins. Glycobiology 2020, 30, 490–499. [Google Scholar] [CrossRef]
- Saginala, K.; Barsouk, A.; Aluru, J.S.; Rawla, P.; Barsouk, A. Epidemiology of Melanoma. Med. Sci. 2021, 9, 63. [Google Scholar] [CrossRef] [PubMed]
- Schatton, T.; Murphy, G.F.; Frank, N.Y.; Yamaura, K.; Waaga-Gasser, A.M.; Gasser, M.; Zhan, Q.; Jordan, S.; Duncan, L.M.; Weishaupt, C.; et al. Identification of cells initiating human melanomas. Nature 2008, 451, 345–349. [Google Scholar] [CrossRef] [PubMed]
- Balch, C.M.; Gershenwald, J.E.; Soong, S.-J.; Thompson, J.F.; Atkins, M.B.; Byrd, D.R.; Buzaid, A.C.; Cochran, A.J.; Coit, D.G.; Ding, S.; et al. Final version of 2009 AJCC melanoma staging and classification. J. Clin. Oncol. 2009, 27, 6199–6206. [Google Scholar] [CrossRef] [PubMed]
- Wilson, M.A.; Schuchter, L.M. Chemotherapy for Melanoma. Cancer Treat. Res. 2016, 167, 209–229. [Google Scholar]
- Tawbi, H.A.; Buch, S.C. Chemotherapy resistance abrogation in metastatic melanoma. Clin. Adv. Hematol. Oncol. 2010, 8, 259–266. [Google Scholar]
- Sweeney, J.G.; Liang, J.; Antonopoulos, A.; Giovannone, N.; Kang, S.; Mondala, T.S.; Head, S.R.; King, S.L.; Tani, Y.; Brackett, D.; et al. Loss of GCNT2/I-branched glycans enhances melanoma growth and survival. Nat. Commun. 2018, 9, 3368. [Google Scholar] [CrossRef]
- Sumardika, I.W.; Youyi, C.; Kondo, E.; Inoue, Y.; Ruma, I.M.W.; Murata, H.; Kinoshita, R.; Yamamoto, K.-I.; Tomida, S.; Shien, K.; et al. β-1,3-Galactosyl-O-Glycosyl-Glycoprotein β-1,6-N-Acetylglucosaminyltransferase 3 Increases MCAM Stability, Which Enhances S100A8/A9-Mediated Cancer Motility. Oncol. Res. 2018, 26, 431–444. [Google Scholar] [CrossRef]
- Thies, A.; Moll, I.; Berger, J.; Schumacher, U. Lectin binding to cutaneous malignant melanoma: HPA is associated with metastasis formation. Br. J. Cancer 2001, 84, 819–823. [Google Scholar] [CrossRef]
- Laidler, P.; Lityńska, A.; Hoja-Łukowicz, D.; Łabedz, M.; Przybyło, M.; Ciołczyk-Wierzbicka, D.; Pocheć, E.; Trebacz, E.; Kremser, E. Characterization of glycosylation and adherent properties of melanoma cell lines. Cancer Immunol. Immunother. 2006, 55, 112–118. [Google Scholar] [CrossRef]
- Kremser, M.E.; Przybyło, M.; Hoja-Łukowicz, D.; Pocheć, E.; Amoresano, A.; Carpentieri, A.; Bubka, M.; Lityńska, A. Characterisation of alpha3beta1 and alpha(v)beta3 integrin N-oligosaccharides in metastatic melanoma WM9 and WM239 cell lines. Biochim. Biophys. Acta 2008, 1780, 1421–1431. [Google Scholar] [CrossRef]
- Pietrobono, S.; Anichini, G.; Sala, C.; Manetti, F.; Almada, L.L.; Pepe, S.; Carr, R.M.; Paradise, B.D.; Sarkaria, J.N.; Davila, J.I.; et al. Stecca BST3GAL1 is a target of the SOX2-GLI1 transcriptional complex promotes melanoma metastasis through AXL. Nat. Commun. 2020, 11, 5865. [Google Scholar] [CrossRef] [PubMed]
- More, S.K.; Srinivasan, N.; Budnar, S.; Bane, S.M.; Upadhya, A.; Thorat, R.A.; Ingle, A.D.; Chiplunkar, S.V.; Kalraiya, R.D. N-glycans and metastasis in galectin-3 transgenic mice. Biochem. Biophys. Res. Commun. 2015, 460, 302–307. [Google Scholar] [CrossRef] [PubMed]
- Schulz, M.A.; Tian, W.; Mao, Y.; van Coillie, J.; Sun, L.; Larsen, J.S.; Chen, Y.-H.; Kristensen, C.; Vakhrushev, S.Y.; Clausen, H.; et al. Glycoengineering design options for IgG1 in CHO cells using precise gene editing. Glycobiology 2018, 28, 542–549. [Google Scholar] [CrossRef]
- Flynn, R.A.; Pedram, K.; Malaker, S.A.; Batista, P.J.; Smith, B.A.H.; Johnson, A.G.; George, B.M.; Majzoub, K.; Villalta, P.W.; Carette, J.E.; et al. Small RNAs are modified with N-glycans and displayed on the surface of living cells. Cell 2021, 184, 3109–3124.e22. [Google Scholar] [CrossRef]
- Agard, N.J.; Prescher, J.A.; Bertozzi, C.R. A strain-promoted 3 + 2 azide-alkyne cycloaddition for covalent modification of biomolecules in living systems. J. Am. Chem. Soc. 2004, 126, 15046–15047. [Google Scholar] [CrossRef]
- Saxon, E.; Bertozzi, C.R. Cell surface engineering by a modified Staudinger reaction. Science 2000, 287, 2007–2010. [Google Scholar] [CrossRef]
- Chang, M.M.; Gaidukov, L.; Jung, G.; Tseng, W.A.; Scarcelli, J.J.; Cornell, R.; Marshall, J.K.; Lyles, J.L.; Sakorafas, P.; Chu, A.-H.A.; et al. Small-molecule control of antibody N-glycosylation in engineered mammalian cells. Nat. Chem. Biol. 2019, 15, 730–736. [Google Scholar] [CrossRef]
- Nakamura-Tsuruta, S.; Kominami, J.; Kamei, M.; Koyama, Y.; Suzuki, T.; Isemura, M.; Hirabayashi, J. Comparative analysis by frontal affinity chromatography of oligosaccharide specificity of GlcNAc-binding lectins, Griffonia simplicifolia lectin-II (GSL-II) and Boletopsis leucomelas lectin (BLL). J. Biochem. 2006, 140, 285–291. [Google Scholar] [CrossRef]
- Dafik, L.; D’Alarcao, M.; Kumar, K. Modulation of cellular adhesion by glycoengineering. J. Med. Chem. 2010, 53, 4277–4284. [Google Scholar] [CrossRef]
- Shimoda, A.; Miura, R.; Tateno, H.; Seo, N.; Shiku, H.; Sawada, S.-I.; Sasaki, Y.; Akiyoshi, K. Assessment of Surface Glycan Diversity on Extracellular Vesicles by Lectin Microarray and Glycoengineering Strategies for Drug Delivery Applications. Small Methods 2022, 6, e2100785. [Google Scholar] [CrossRef]
- Dube, D.H.; Bertozzi, C.R. Glycans in cancer and inflammation—Potential for therapeutics and diagnostics. Nat. Rev. Drug Discov. 2005, 4, 477–488. [Google Scholar] [CrossRef] [PubMed]
- Layek, B.; Sadhukha, T.; Prabha, S. Glycoengineered mesenchymal stem cells as an enabling platform for two-step targeting of solid tumors. Biomaterials 2016, 88, 97–109. [Google Scholar] [CrossRef] [PubMed]
- Homann, A.; Qamar, R.-U.; Serim, S.; Dersch, P.; Seibel, J. Bioorthogonal metabolic glycoengineering of human larynx carcinoma (HEp-2) cells targeting sialic acid. Beilstein J. Org. Chem. 2010, 6, 24. [Google Scholar] [CrossRef]
- Mut, J.; Altmann, S.; Reising, S.; Meißner-Weigl, J.; Driessen, M.D.; Ebert, R.; Seibel, J. SiaNAl can be efficiently incorporated in glycoproteins of human mesenchymal stromal cells by metabolic glycoengineering. ACS Biomater. Sci. Eng. 2024, 10, 139–148. [Google Scholar] [CrossRef]
- Altmann, S.; Mut, J.; Wolf, N.; Meißner-Weigl, J.; Rudert, M.; Jakob, F.; Gutmann, M.; Lühmann, T.; Seibel, J.; Ebert, R. Metabolic Glycoengineering in hMSC-TERT as a Model for Skeletal Precursors by Using Modified Azide/Alkyne Monosaccharides. Int. J. Mol. Sci. 2021, 22, 2820. [Google Scholar] [CrossRef]
- Fiehn, T.; Goddard, R.; Seidel, R.W.; Kubik, S. A cyclopeptide-derived molecular cage for sulfate ions that closes with a click. Chem. A Eur. J. 2010, 16, 7241–7255. [Google Scholar] [CrossRef]
- Zimmermann, T.; Staebler, S.; Taudte, R.V.; Ünüvar, S.; Grösch, S.; Arndt, S.; Karrer, S.; Fromm, M.F.; Bosserhoff, A.-K. Cold Atmospheric Plasma Triggers Apoptosis via the Unfolded Protein Response in Melanoma Cells. Cancers 2023, 15, 1064. [Google Scholar] [CrossRef]
- Kluge, V.; Kappelmann-Fenzl, M.; Fischer, S.; Zimmermann, T.; Pommer, M.; Kuphal, S.; Bosserhoff, A.-K. Alternative Wnt-signaling axis leads to a break of oncogene-induced senescence. Cell Death Dis. 2024, 15, 166. [Google Scholar] [CrossRef]
- Pommer, M.; Kuphal, S.; Bosserhoff, A.K. Amphiregulin Regulates Melanocytic Senescence. Cells 2021, 10, 326. [Google Scholar] [CrossRef]
- Böhme-Schäfer, I.; Lörentz, S.; Bosserhoff, A.K. Role of Amino Acid Transporter SNAT1/SLC38A1 in Human Melanoma. Cancers 2022, 14, 2151. [Google Scholar] [CrossRef]
- Arndt, S.; Melle, C.; Mondal, K.; Klein, G.; von Eggeling, F.; Bosserhoff, A.-K. Interactions of TANGO and leukocyte integrin CD11c/CD18 regulate the migration of human monocytes. J. Leukoc. Biol. 2007, 82, 1466–1472. [Google Scholar] [CrossRef] [PubMed]
- Kersten, V.; Seitz, T.; Sommer, J.; Thasler, W.E.; Bosserhoff, A.; Hellerbrand, C. Bone Morphogenetic Protein 13 Has Protumorigenic Effects on Hepatocellular Carcinoma Cells In Vitro. Int. J. Mol. Sci. 2023, 24, 11059. [Google Scholar] [CrossRef]
- Franken, N.A.P.; Rodermond, H.M.; Stap, J.; Haveman, J.; van Bree, C. Clonogenic assay of cells in vitro. Nat. Protoc. 2006, 1, 2315–2319. [Google Scholar] [CrossRef]
- Sosa Cuevas, E.; Roubinet, B.; Mouret, S.; Thépaut, M.; de Fraipont, F.; Charles, J.; Fieschi, F.; Landemarre, L.; Chaperot, L.; Aspord, C. The melanoma tumor glyco-code impacts human dendritic cells’ functionality and dictates clinical outcomes. Front. Immunol. 2023, 14, 1120434. [Google Scholar] [CrossRef]
- Qin, W.; Qin, K.; Fan, X.; Peng, L.; Hong, W.; Zhu, Y.; Lv, P.; Du, Y.; Huang, R.; Han, M.; et al. Artificial Cysteine S-Glycosylation Induced by Per-O-Acetylated Unnatural Monosaccharides during Metabolic Glycan Labeling. Angew. Chem. Int. Ed. Engl. 2018, 57, 1817–1820. [Google Scholar] [CrossRef]
- Rostovtsev, V.V.; Green, L.G.; Fokin, V.V.; Sharpless, K.B. A Stepwise Huisgen Cycloaddition Process: Copper(I)-Catalyzed Regioselective “Ligation” of Azides and Terminal Alkynes. Angew. Chem. Int. Ed. 2002, 41, 2596–2599. [Google Scholar] [CrossRef]
- Tornøe, C.W.; Christensen, C.; Meldal, M. Peptidotriazoles on solid phase: 1,2,3-triazoles by regiospecific copper(I)-catalyzed 1,3-dipolar cycloadditions of terminal alkynes to azides. J. Org. Chem. 2002, 67, 3057–3064. [Google Scholar] [CrossRef]
- van Wijk, X.M.R.; Oosterhof, A.; van den Broek, S.A.M.W.; Griffioen, A.W.; Dam GB ten Rutjes, F.P.J.T.; van Delft, F.L.; van Kuppevelt, T.H. A 4-deoxy analogue of N-acetyl-D-glucosamine inhibits heparan sulphate expression and growth factor binding in vitro. Exp. Cell Res. 2010, 316, 2504–2512. [Google Scholar] [CrossRef]
- van Wijk, X.M.; Thijssen, V.L.; Lawrence, R.; van den Broek, S.A.; Dona, M.; Naidu, N.; Oosterhof, A.; van de Westerlo, E.M.; Kusters, L.J.; Khaled, Y.; et al. Interfering with UDP-GlcNAc metabolism and heparan sulfate expression using a sugar analogue reduces angiogenesis. ACS Chem. Biol. 2013, 8, 2331–2338. [Google Scholar] [CrossRef]
- Wu, H.; Shajahan, A.; Yang, J.-Y.; Capota, E.; Wands, A.M.; Arthur, C.M.; Stowell, S.R.; Moremen, K.W.; Azadi, P.; Kohler, J.J. A photo-cross-linking GlcNAc analog enables covalent capture of N-linked glycoprotein-binding partners on the cell surface. Cell Chem. Biol. 2022, 29, 84–97.e8. [Google Scholar] [CrossRef]
- Ma, X.; Liu, P.; Yan, H.; Sun, H.; Liu, X.; Zhou, F.; Li, L.; Chen, Y.; Muthana, M.M.; Chen, X.; et al. Substrate specificity provides insights into the sugar donor recognition mechanism of O-GlcNAc transferase (OGT). PLoS ONE 2013, 8, e63452. [Google Scholar] [CrossRef] [PubMed]
- Hahn, R.G.; Patel, V.; Dull, R.O. Human glycocalyx shedding: Systematic review and critical appraisal. Acta Anaesthesiol. Scand. 2021, 65, 590–606. [Google Scholar] [CrossRef] [PubMed]
- Qin, K.; Zhang, H.; Zhao, Z.; Chen, X. Protein S-Glyco-Modification through an Elimination-Addition Mechanism. J. Am. Chem. Soc. 2020, 142, 9382–9388. [Google Scholar] [CrossRef] [PubMed]
- Pedowitz, N.J.; Jackson, E.G.; Overhulse, J.M.; McKenna, C.E.; Kohler, J.J.; Pratt, M.R. Anomeric Fatty Acid Functionalization Prevents Nonenzymatic S-Glycosylation by Monosaccharide Metabolic Chemical Reporters. ACS Chem. Biol. 2021, 16, 1924–1929. [Google Scholar] [CrossRef]
- Taniguchi, N. A sugar-coated switch for cellular growth and arrest. Nat. Chem. Biol. 2007, 3, 307–309. [Google Scholar] [CrossRef]
- Boscher, C.; Dennis, J.W.; Nabi, I.R. Glycosylation, galectins and cellular signaling. Curr. Opin. Cell Biol. 2011, 23, 383–392. [Google Scholar] [CrossRef]
- Lau, K.S.; Partridge, E.A.; Grigorian, A.; Silvescu, C.I.; Reinhold, V.N.; Demetriou, M.; Dennis, J.W. Complex N-glycan number and degree of branching cooperate to regulate cell proliferation and differentiation. Cell 2007, 129, 123–134. [Google Scholar] [CrossRef]
- Baro, M.; Lopez Sambrooks, C.; Quijano, A.; Saltzman, W.M.; Contessa, J. Oligosaccharyltransferase Inhibition Reduces Receptor Tyrosine Kinase Activation and Enhances Glioma Radiosensitivity. Clin. Cancer Res. 2019, 25, 784–795. [Google Scholar] [CrossRef]
- Rouhanifard, S.H.; Lopez Aguilar, A.; Meng, L.; Moremen, K.W.; Wu, P. Engineered Glycocalyx Regulates Stem Cell Proliferation in Murine Crypt Organoids. Cell Chem. Biol. 2018, 25, 439–446.e5. [Google Scholar] [CrossRef]
- Bojar, D.; Meche, L.; Meng, G.; Eng, W.; Smith, D.F.; Cummings, R.D.; Mahal, L.K. A Useful Guide to Lectin Binding: Machine-Learning Directed Annotation of 57 Unique Lectin Specificities. ACS Chem. Biol. 2022, 17, 2993–3012. [Google Scholar] [CrossRef]
- Trowbridge, I.S. Isolation and Chemical Characterization of a Mitogenic Lectin from Pisum sativum. J. Biol. Chem. 1974, 249, 6004–6012. [Google Scholar] [CrossRef] [PubMed]
- Shibuya, N.; Goldstein, I.J.; van Damme, E.J.; Peumans, W.J. Binding properties of a mannose-specific lectin from the snowdrop (Galanthus nivalis) bulb. J. Biol. Chem. 1988, 263, 728–734. [Google Scholar] [CrossRef] [PubMed]
- Brewer, C.F.; Bhattacharyya, L. Specificity of concanavalin A binding to asparagine-linked glycopeptides. A nuclear magnetic relaxation dispersion study. J. Biol. Chem. 1986, 261, 7306–7310. [Google Scholar] [CrossRef] [PubMed]
- Kuphal, S.; Bauer, R.; Bosserhoff, A.-K. Integrin signaling in malignant melanoma. Cancer Metastasis Rev. 2005, 24, 195–222. [Google Scholar] [CrossRef]
- Desgrosellier, J.S.; Cheresh, D.A. Integrins in cancer: Biological implications and therapeutic opportunities. Nat. Rev. Cancer 2010, 10, 9–22. [Google Scholar] [CrossRef]
- Pocheć, E.; Bubka, M.; Rydlewska, M.; Janik, M.; Pokrywka, M.; Lityńska, A. Aberrant glycosylation of αvβ3 integrin is associated with melanoma progression. Anticancer Res. 2015, 35, 2093–2103. [Google Scholar]
- Johnson, J.P. Cell adhesion molecules in the development and progression of malignant melanoma. Cancer Metastasis Rev. 1999, 18, 345–357. [Google Scholar] [CrossRef]
- Zaro, B.W.; Yang, Y.-Y.; Hang, H.C.; Pratt, M.R. Chemical reporters for fluorescent detection and identification of O-GlcNAc-modified proteins reveal glycosylation of the ubiquitin ligase NEDD4-1. Proc. Natl. Acad. Sci. USA 2011, 108, 8146–8151. [Google Scholar] [CrossRef]
- Ozcan, S.; Barkauskas, D.A.; Renee Ruhaak, L.; Torres, J.; Cooke, C.L.; An, H.J.; Hua, S.; Williams, C.C.; Dimapasoc, L.M.; Han Kim, J.; et al. Serum glycan signatures of gastric cancer. Cancer Prev. Res. 2014, 7, 226–235. [Google Scholar] [CrossRef]
- de Leoz, M.L.A.; Young, L.J.T.; An, H.J.; Kronewitter, S.R.; Kim, J.; Miyamoto, S.; Borowsky, A.D.; Chew, H.K.; Lebrilla, C.B. High-mannose glycans are elevated during breast cancer progression. Mol. Cell Proteom. 2011, 10, M110.002717. [Google Scholar] [CrossRef]
- Kinoshita, M.; Mitsui, Y.; Kakoi, N.; Yamada, K.; Hayakawa, T.; Kakehi, K. Common glycoproteins expressing polylactosamine-type glycans on matched patient primary and metastatic melanoma cells show different glycan profiles. J. Proteome Res. 2014, 13, 1021–1033. [Google Scholar] [CrossRef] [PubMed]
- Mitchell, M.J.; King, M.R. Physical biology in cancer. 3. The role of cell glycocalyx in vascular transport of circulating tumor cells. Am. J. Physiol. Cell Physiol. 2014, 306, C89–C97. [Google Scholar] [CrossRef]


Disclaimer/Publisher’s Note: The statements, opinions and data contained in all publications are solely those of the individual author(s) and contributor(s) and not of MDPI and/or the editor(s). MDPI and/or the editor(s) disclaim responsibility for any injury to people or property resulting from any ideas, methods, instructions or products referred to in the content. |
© 2024 by the authors. Licensee MDPI, Basel, Switzerland. This article is an open access article distributed under the terms and conditions of the Creative Commons Attribution (CC BY) license (https://creativecommons.org/licenses/by/4.0/).
Share and Cite
Harris, D.; Groß, M.; Staebler, S.; Ebert, R.; Seibel, J.; Boßerhoff, A.K. Modifying the Glycocalyx of Melanoma Cells via Metabolic Glycoengineering Using N-Acetyl-d-glucosamine Analogues. Cells 2024, 13, 1831. https://doi.org/10.3390/cells13221831
Harris D, Groß M, Staebler S, Ebert R, Seibel J, Boßerhoff AK. Modifying the Glycocalyx of Melanoma Cells via Metabolic Glycoengineering Using N-Acetyl-d-glucosamine Analogues. Cells. 2024; 13(22):1831. https://doi.org/10.3390/cells13221831
Chicago/Turabian StyleHarris, David, Marcel Groß, Sebastian Staebler, Regina Ebert, Jürgen Seibel, and Anja Katrin Boßerhoff. 2024. "Modifying the Glycocalyx of Melanoma Cells via Metabolic Glycoengineering Using N-Acetyl-d-glucosamine Analogues" Cells 13, no. 22: 1831. https://doi.org/10.3390/cells13221831
APA StyleHarris, D., Groß, M., Staebler, S., Ebert, R., Seibel, J., & Boßerhoff, A. K. (2024). Modifying the Glycocalyx of Melanoma Cells via Metabolic Glycoengineering Using N-Acetyl-d-glucosamine Analogues. Cells, 13(22), 1831. https://doi.org/10.3390/cells13221831