
Suitability of Ex Vivo-Expanded Microtic Perichondrocytes for Auricular Reconstruction

 , , and
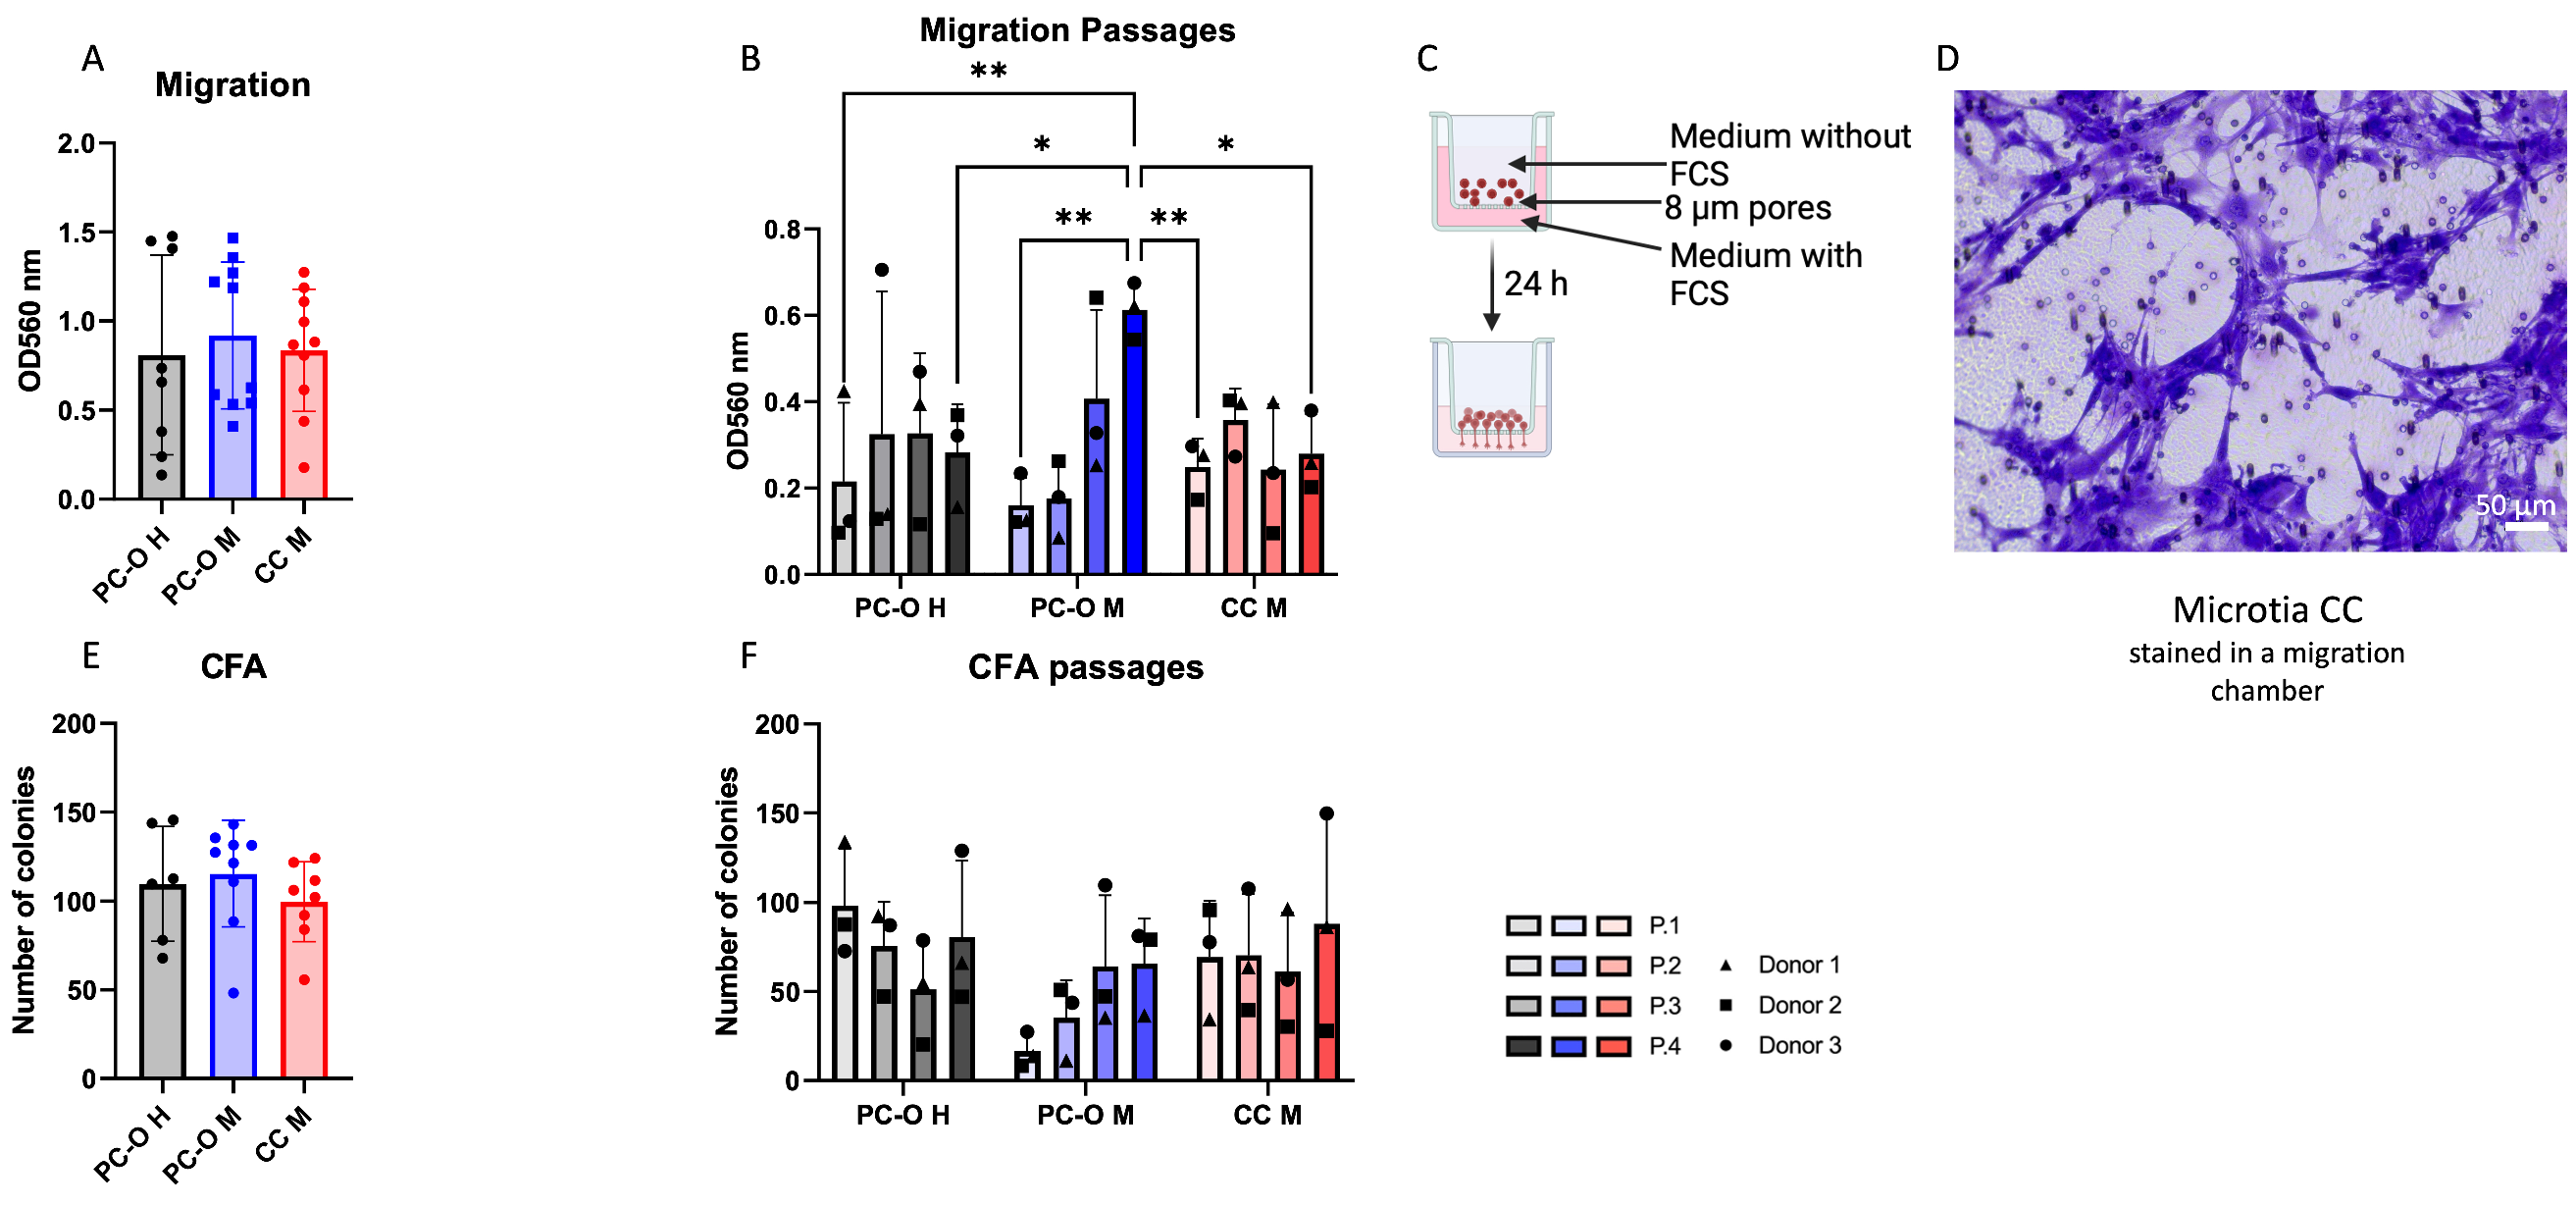
Abstract
1. Introduction
2. Materials and Methods
2.1. Cell Isolation and Expansion
2.2. Colony Formation Assay
2.3. Migration Assay
2.4. Flow Cytometry
2.5. Quantitave Reverse Transcription Polymerase Chain Reaction (RT-qPCR)
2.6. Three-Dimensional Culture
2.6.1. Spheroids
2.6.2. Hyaluronan Transglutaminase Alginate (HATG-Alg) Constructs
2.7. Histological and Immunohistochemical Analysis
2.8. Statistical Analysis
3. Results
3.1. Migration and Colony-Forming Capacity of Perichondrocytes from Microtia Patients
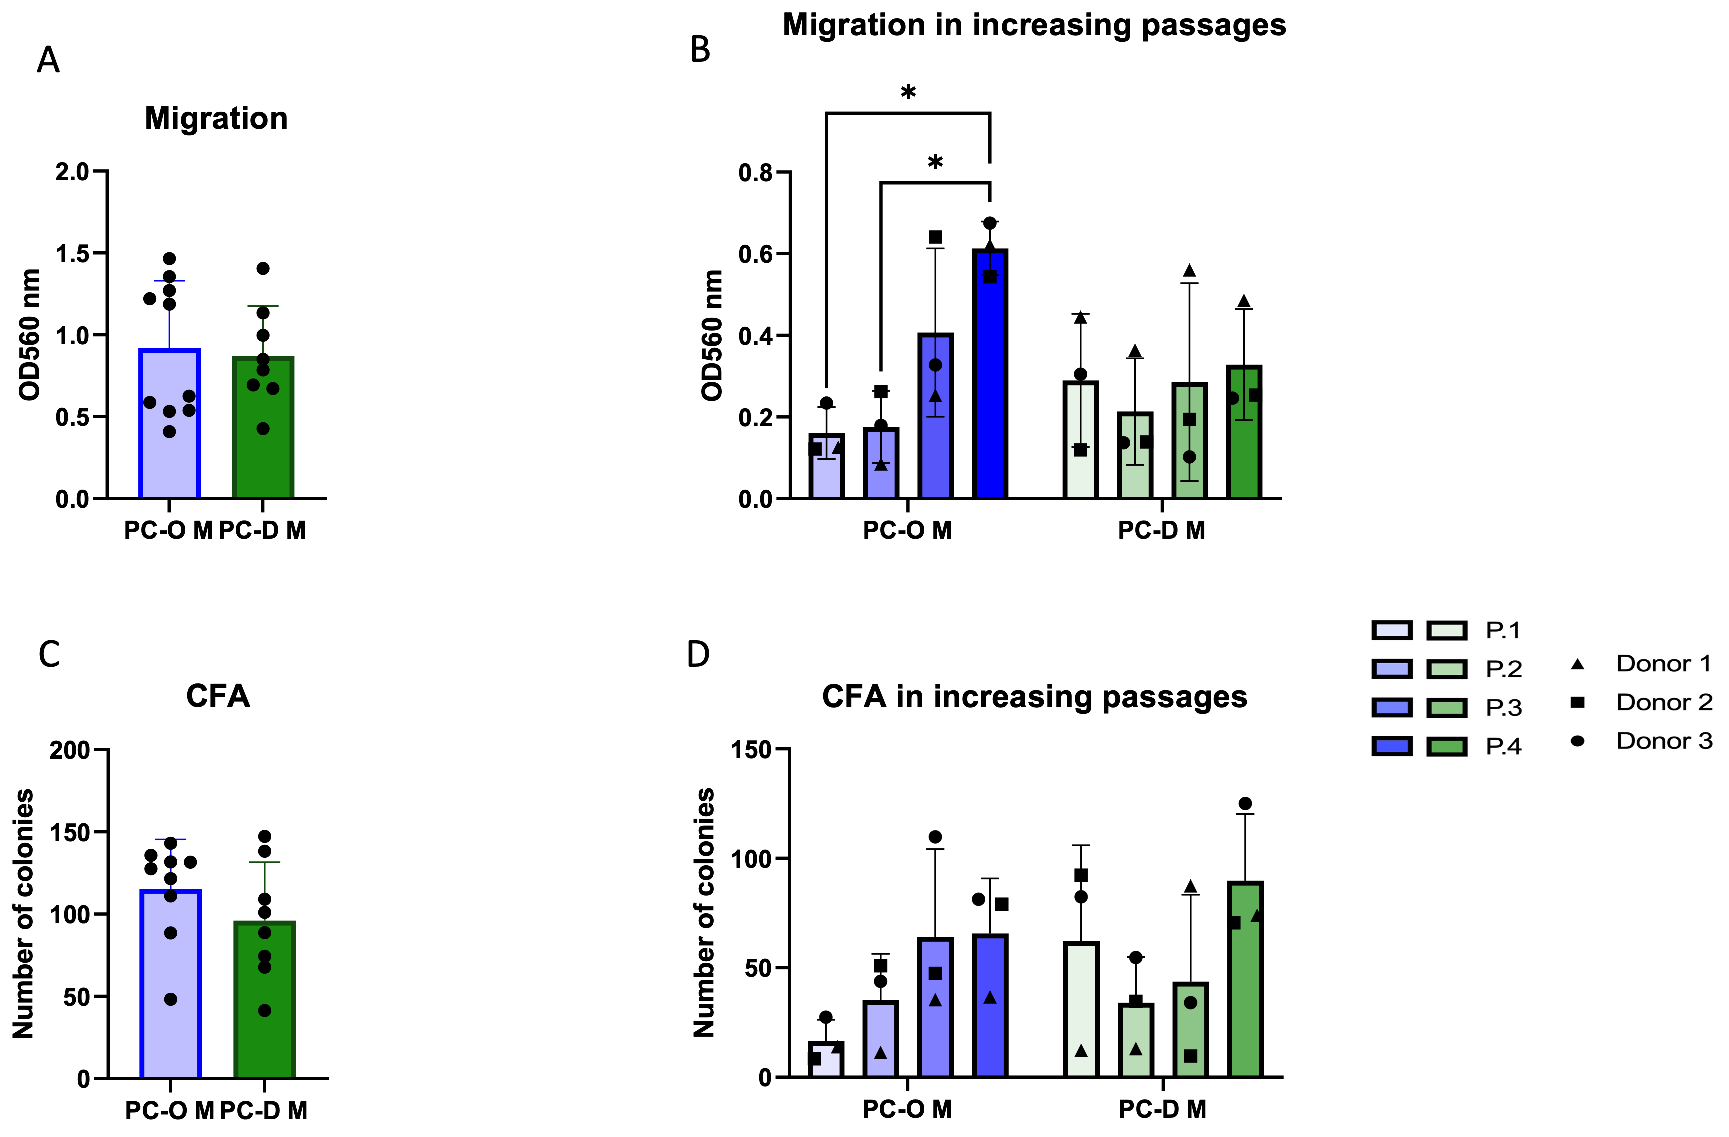
3.2. Influence of the Isolation Method on Migration and Colony-Forming Capacity of Microtia Perichondrocytes
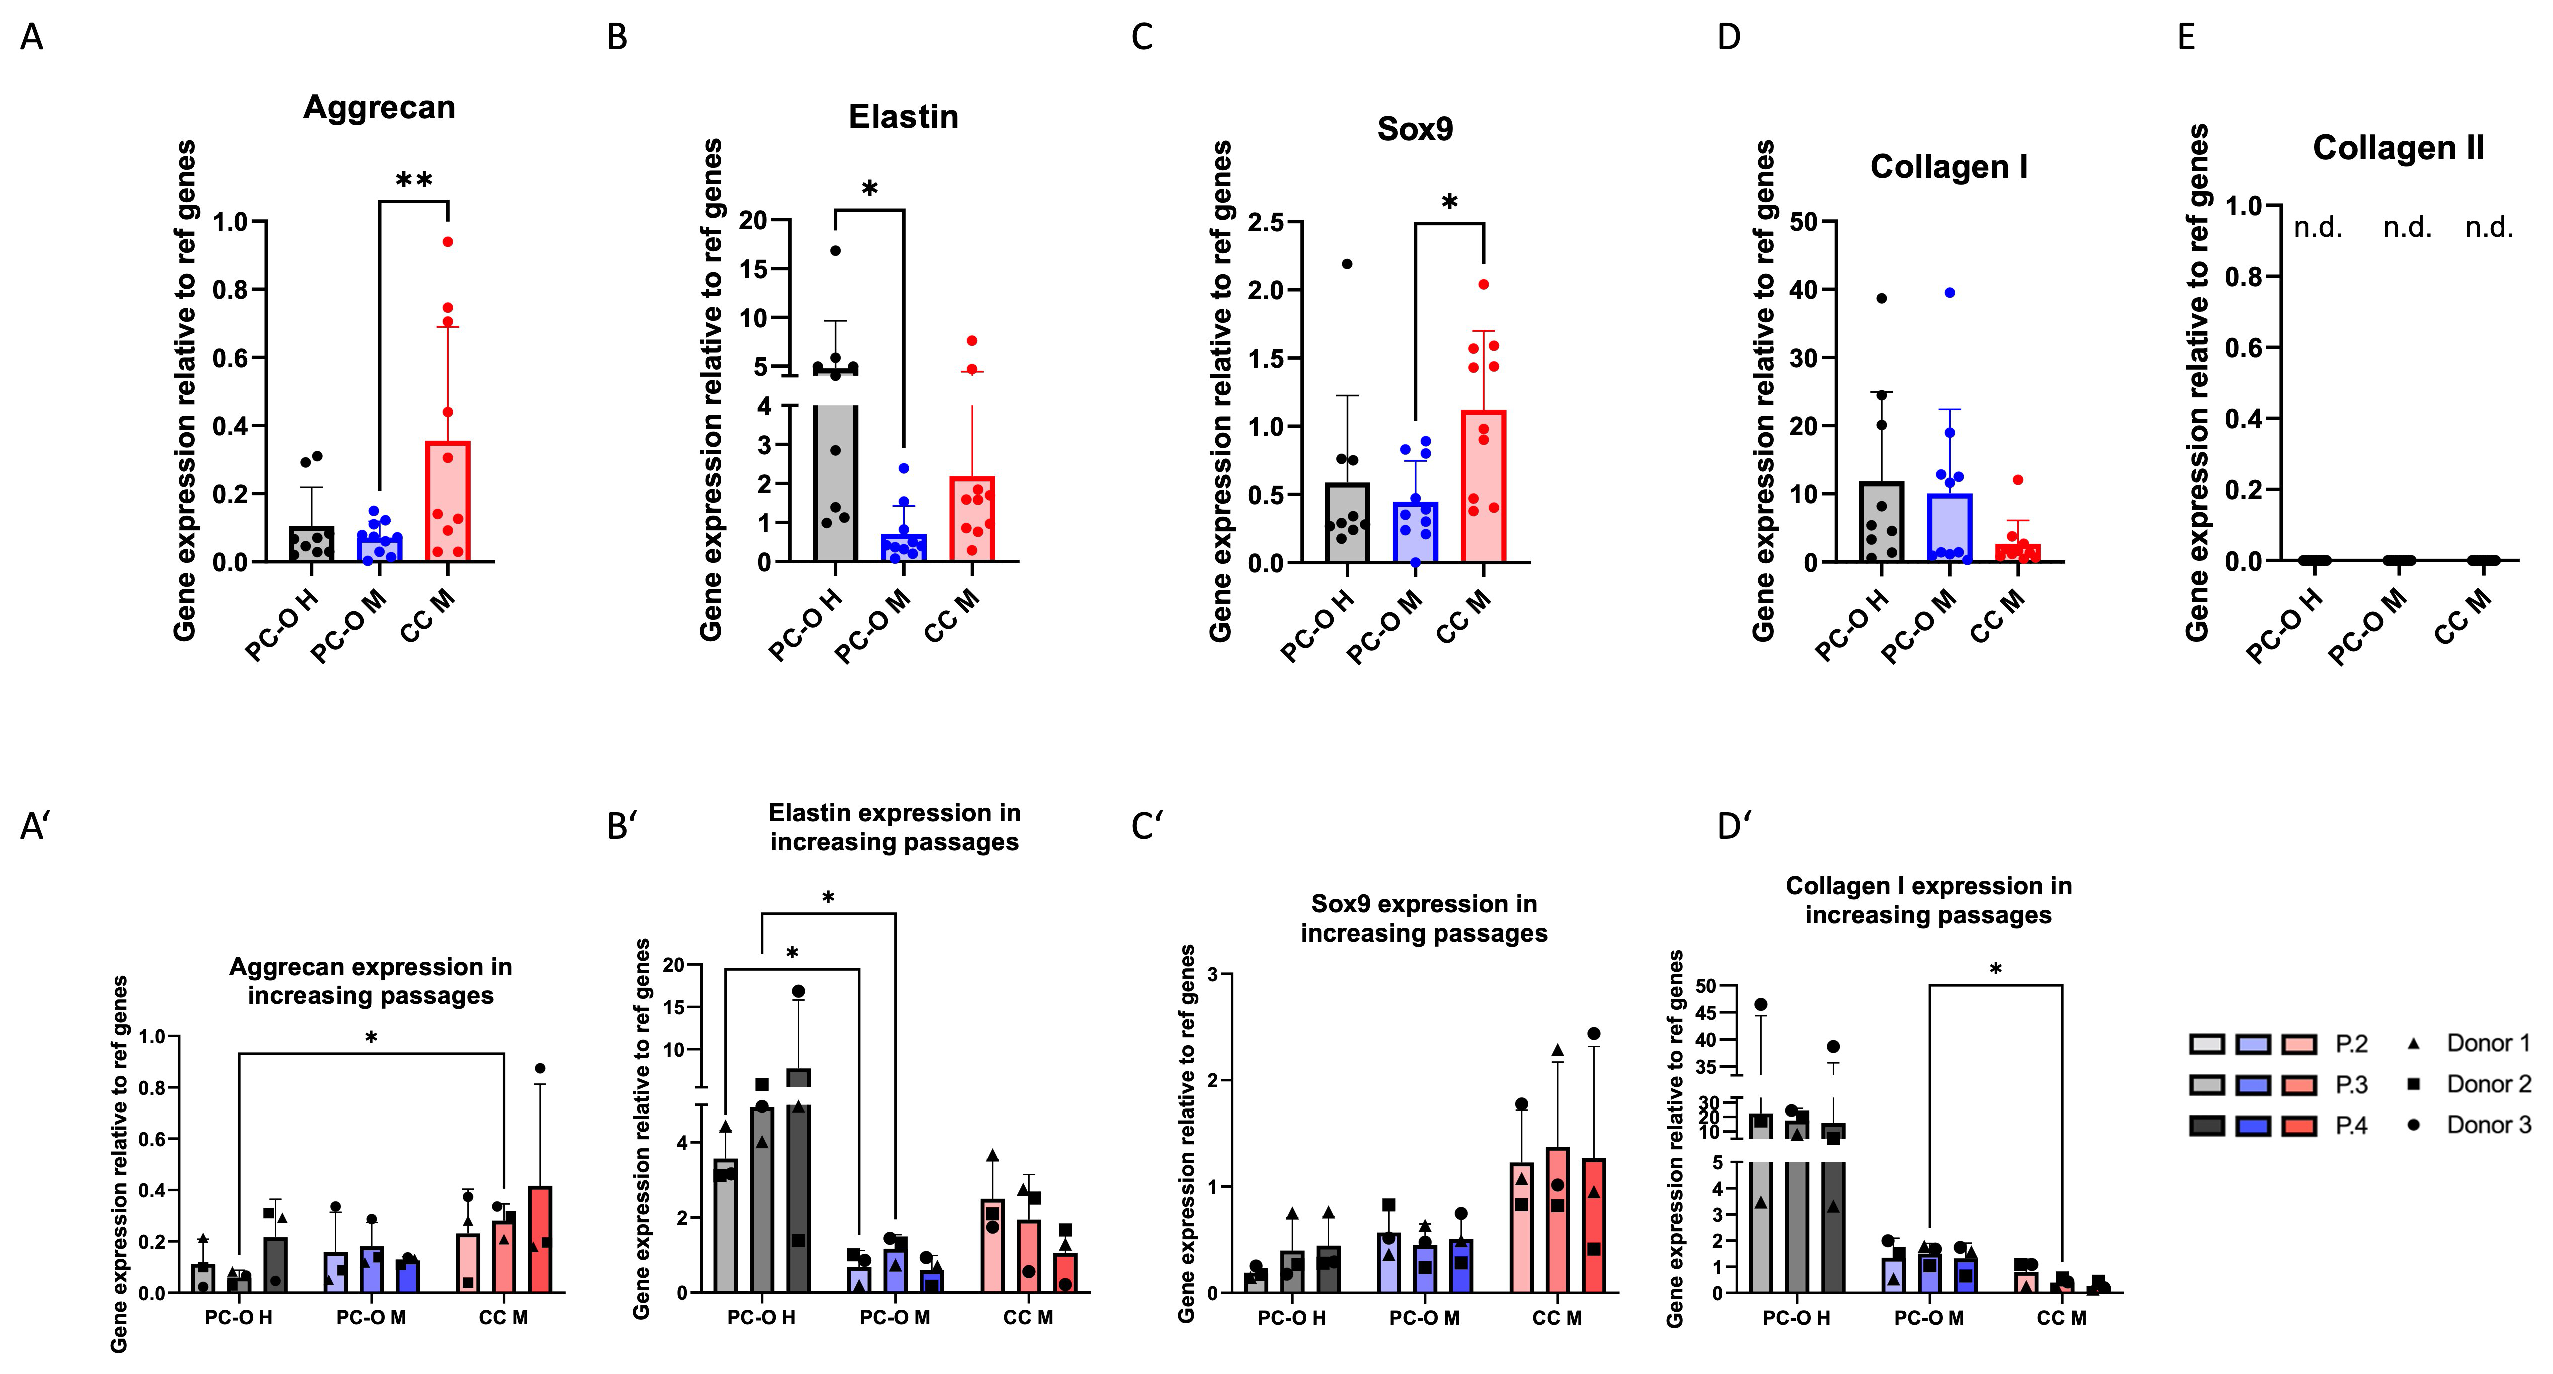
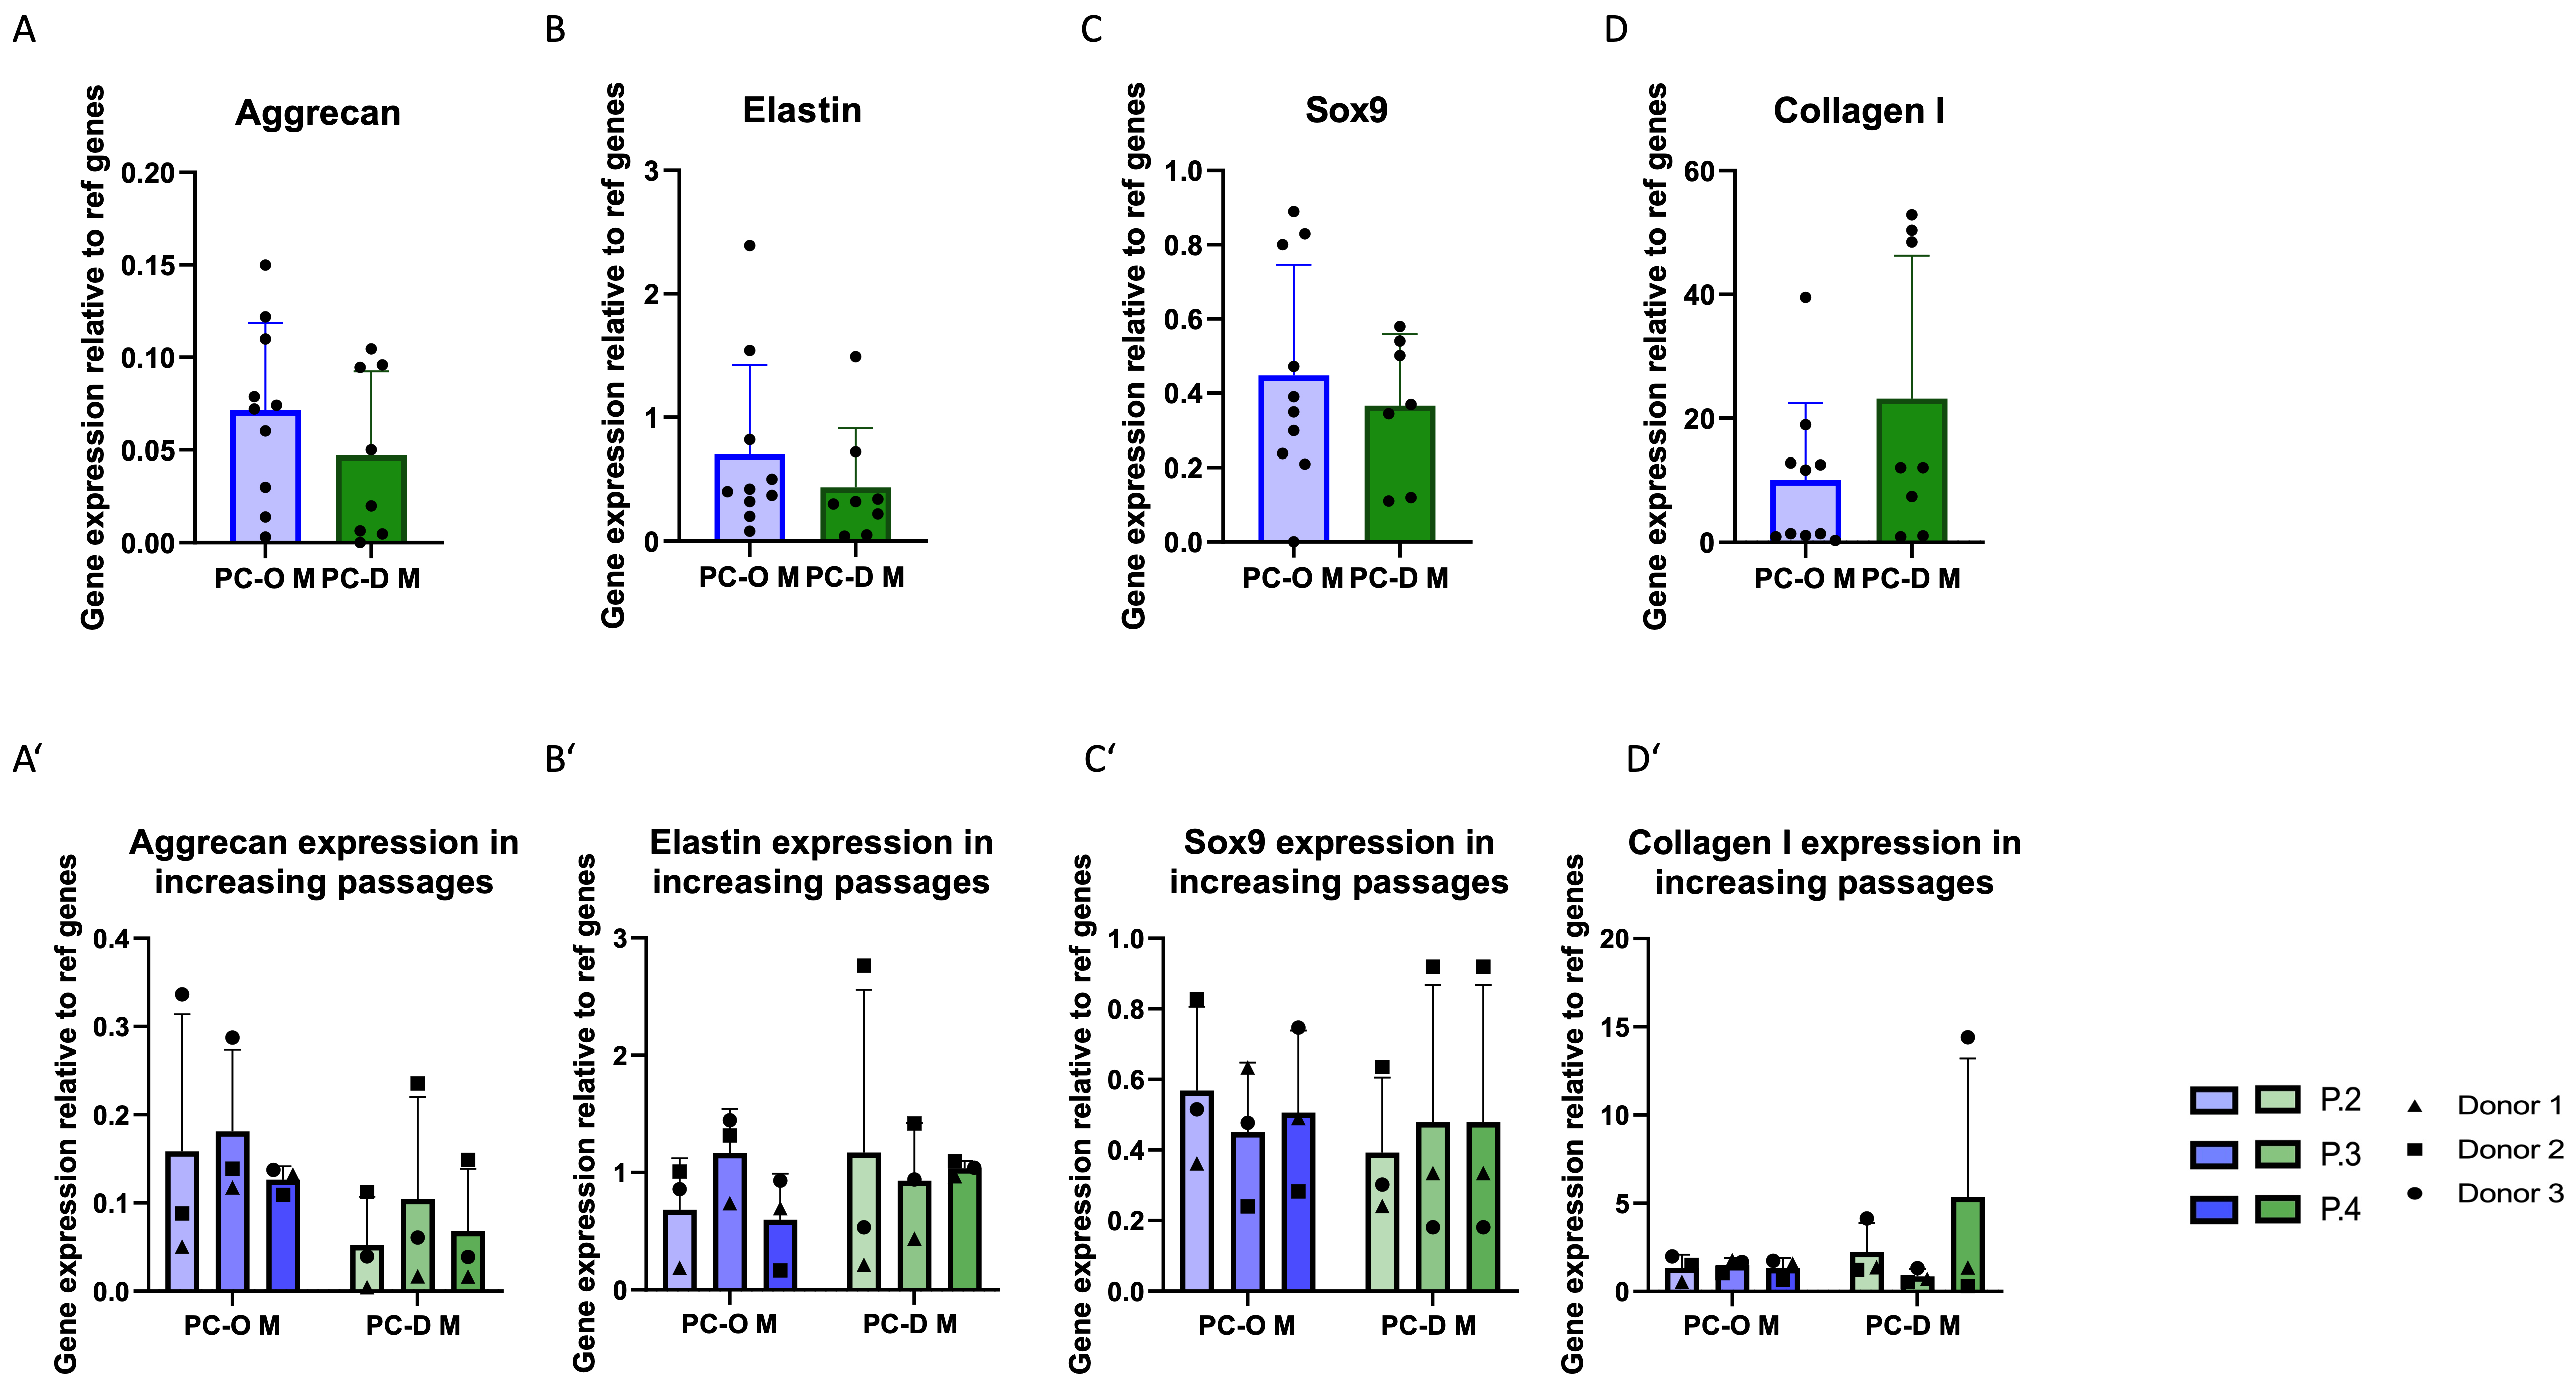
3.3. Cartilage-Related Gene Expression in 2D Culture
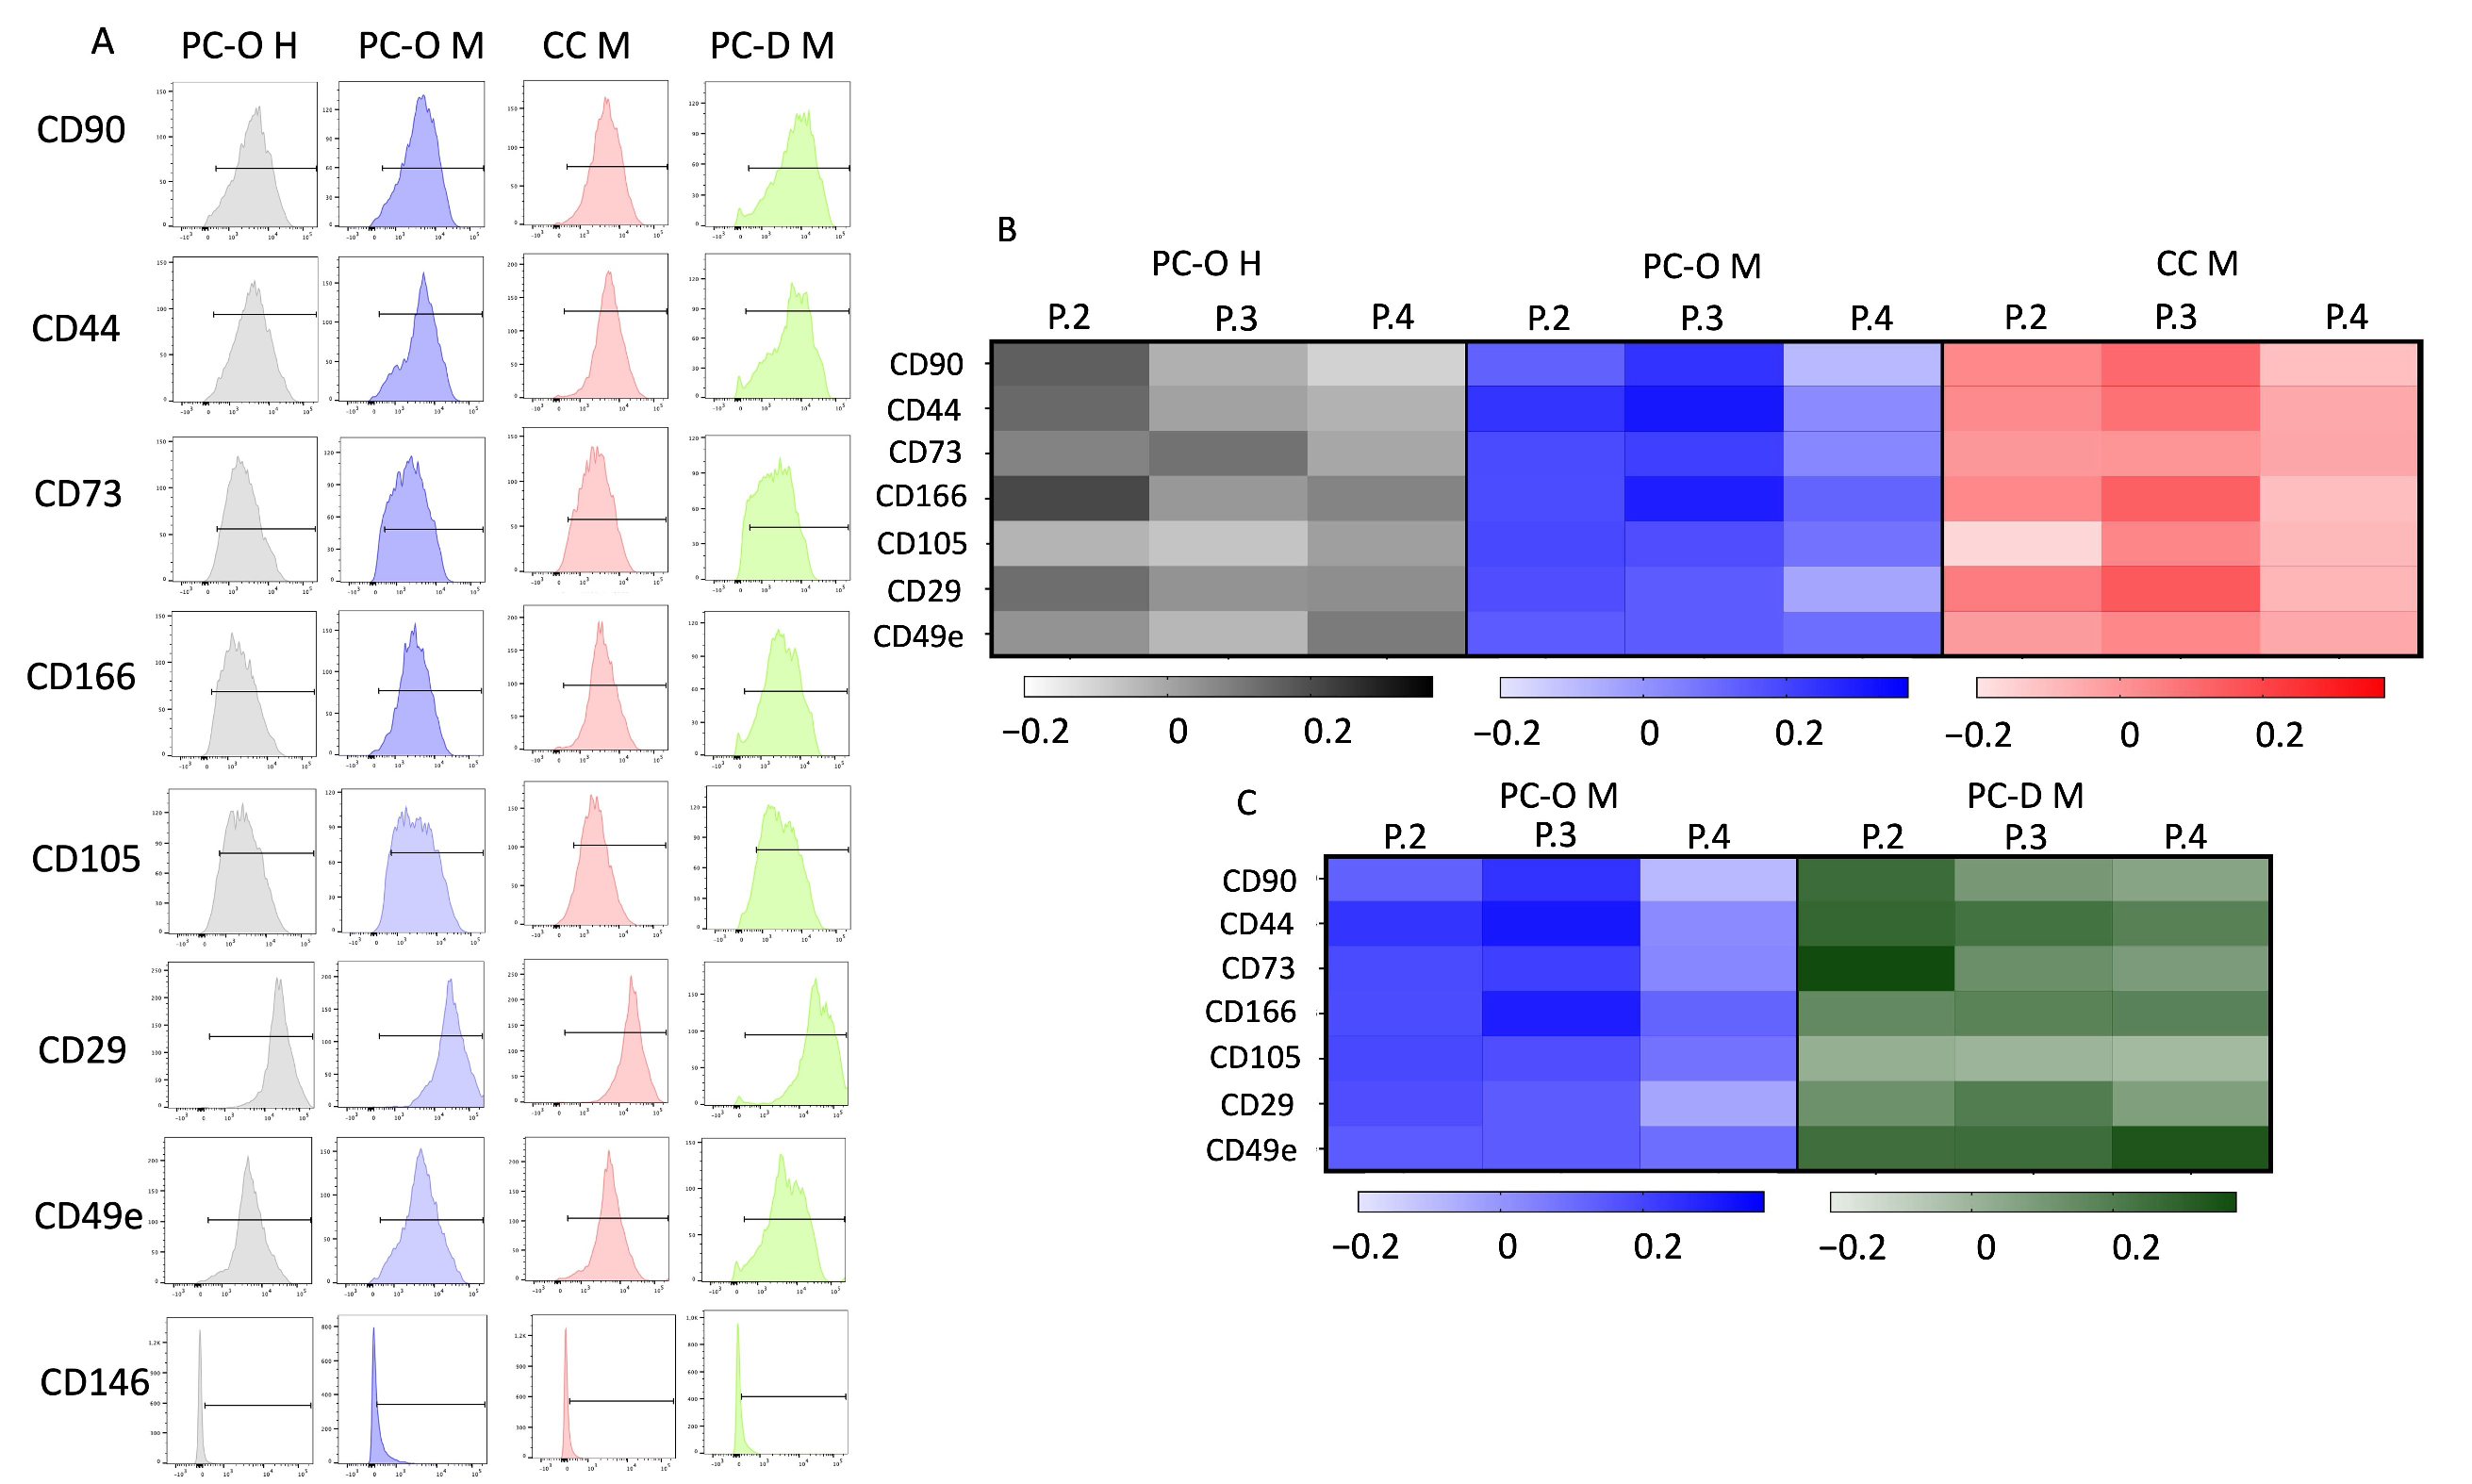
3.4. Surface Marker Profile of Different Cell Types Is Similar in Flow Cytometry
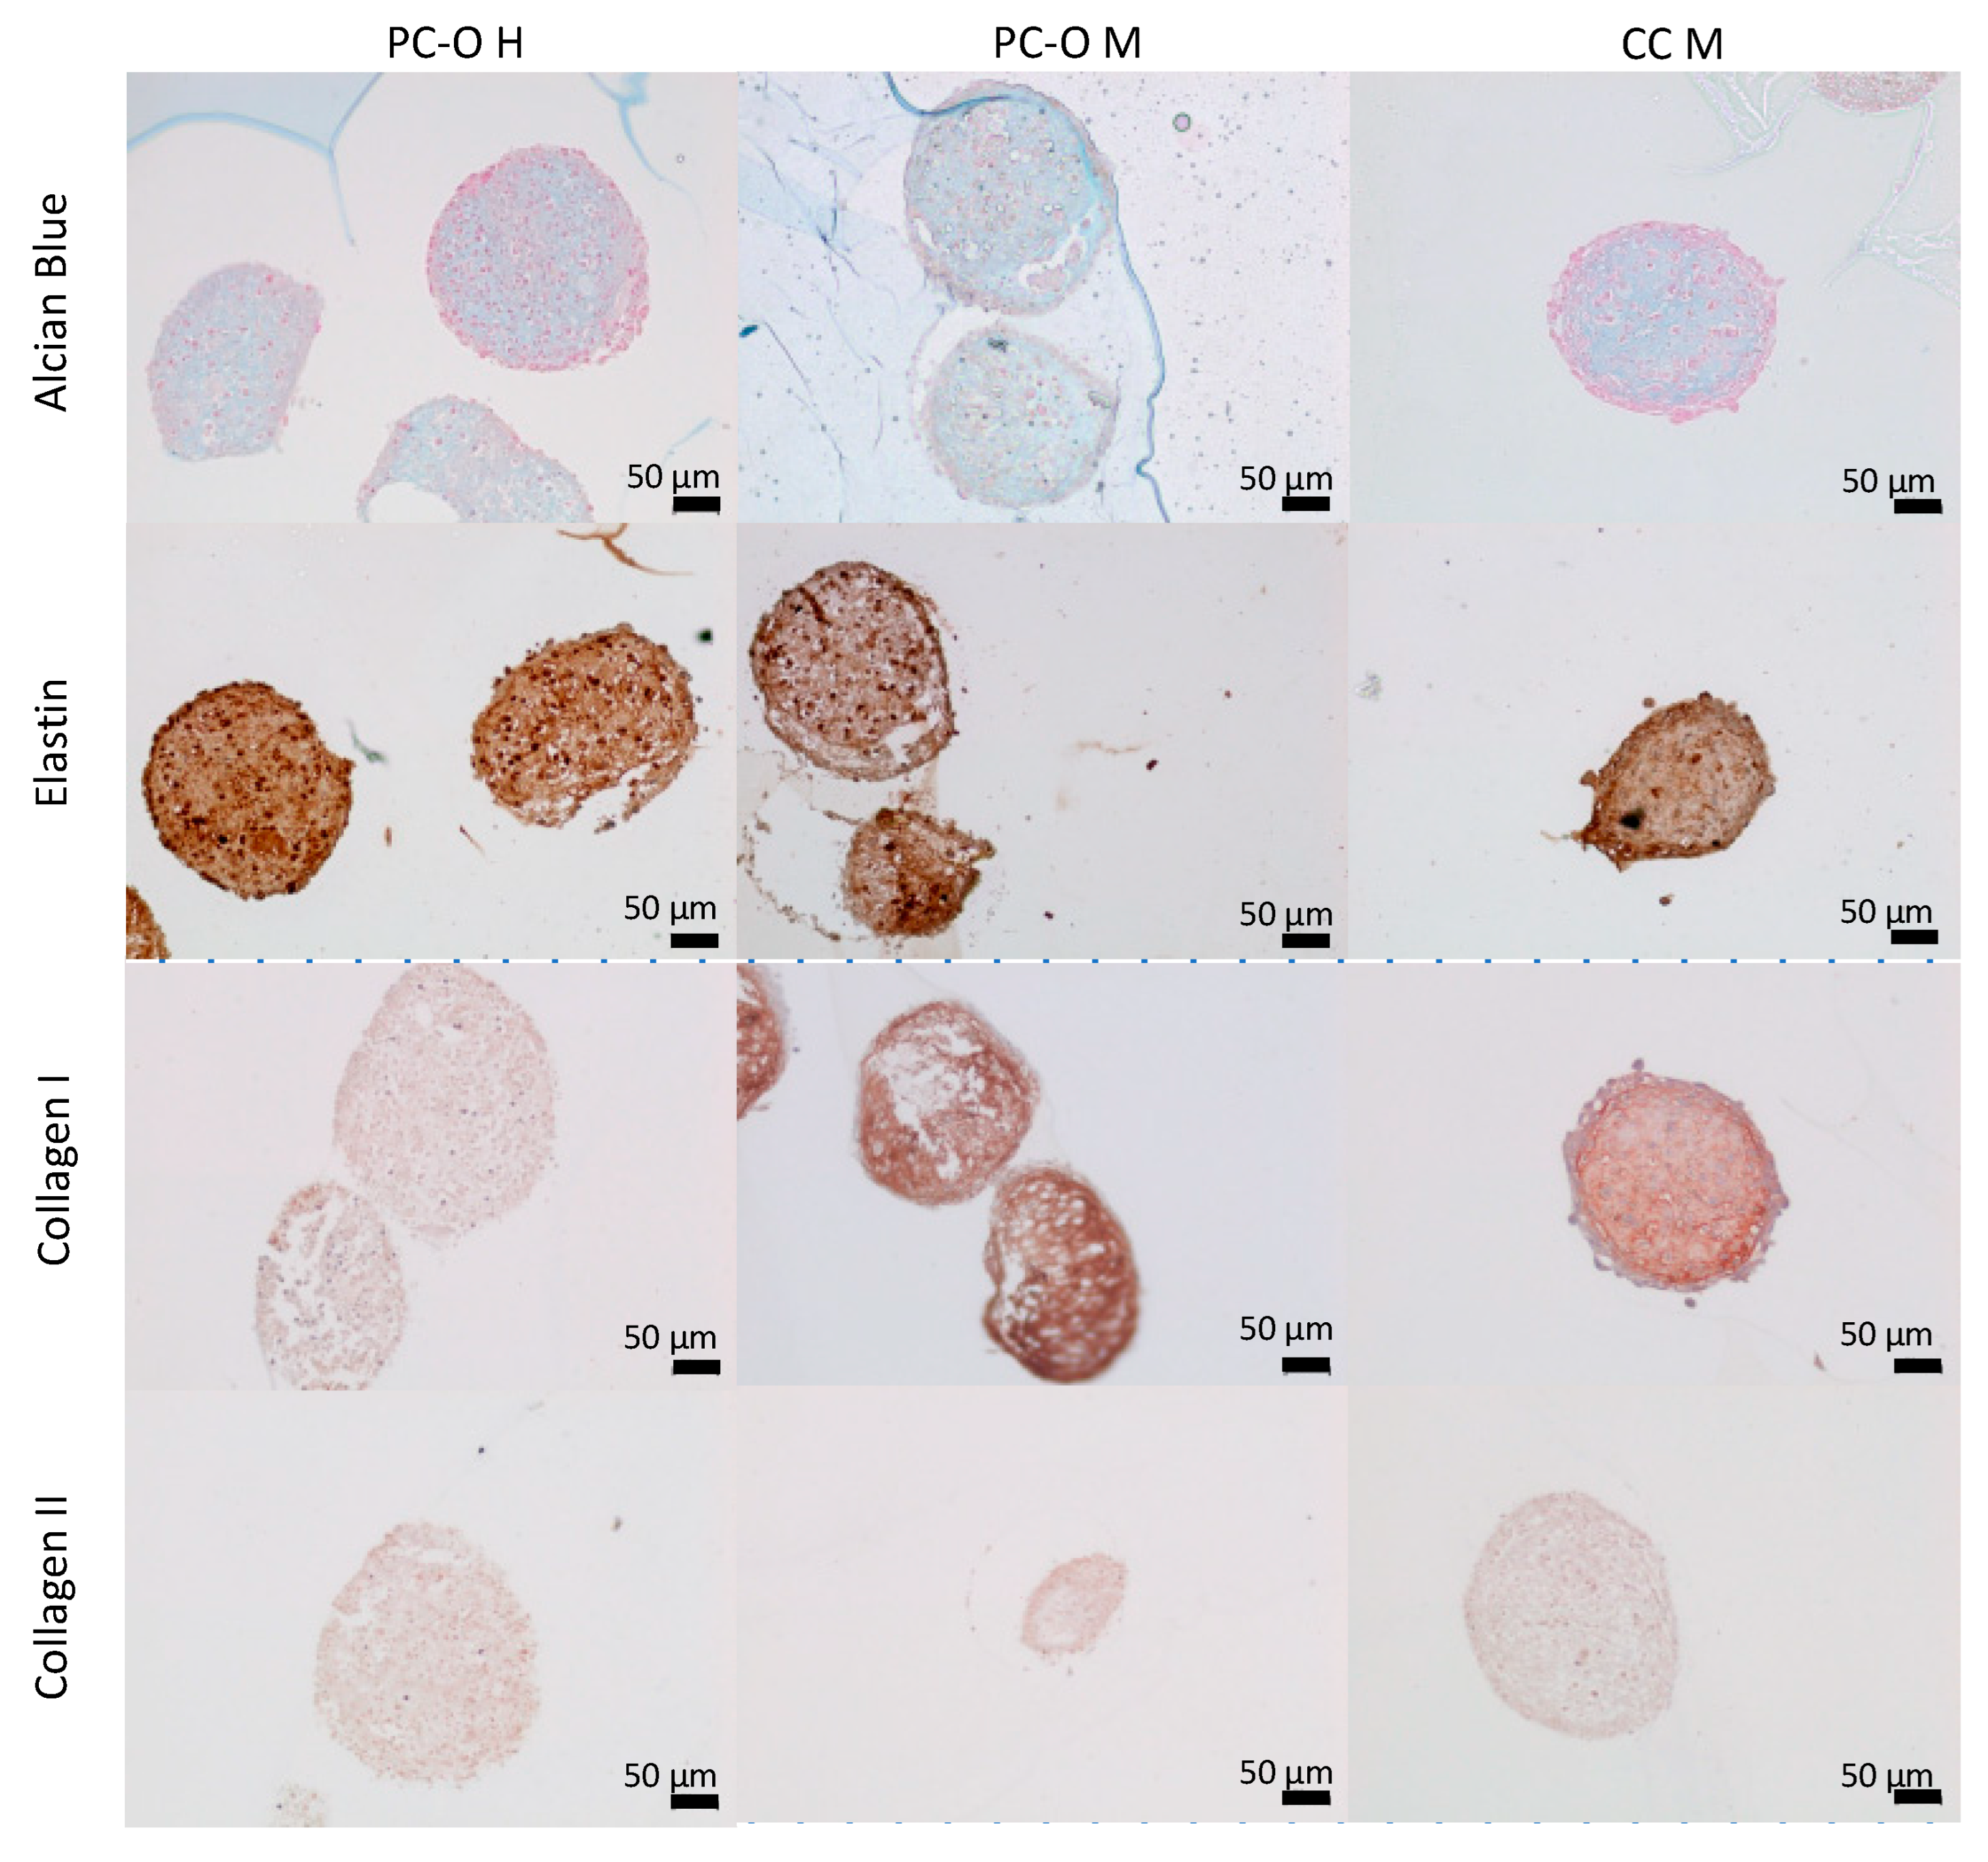
3.5. Matrix Production within 3D Spheroids
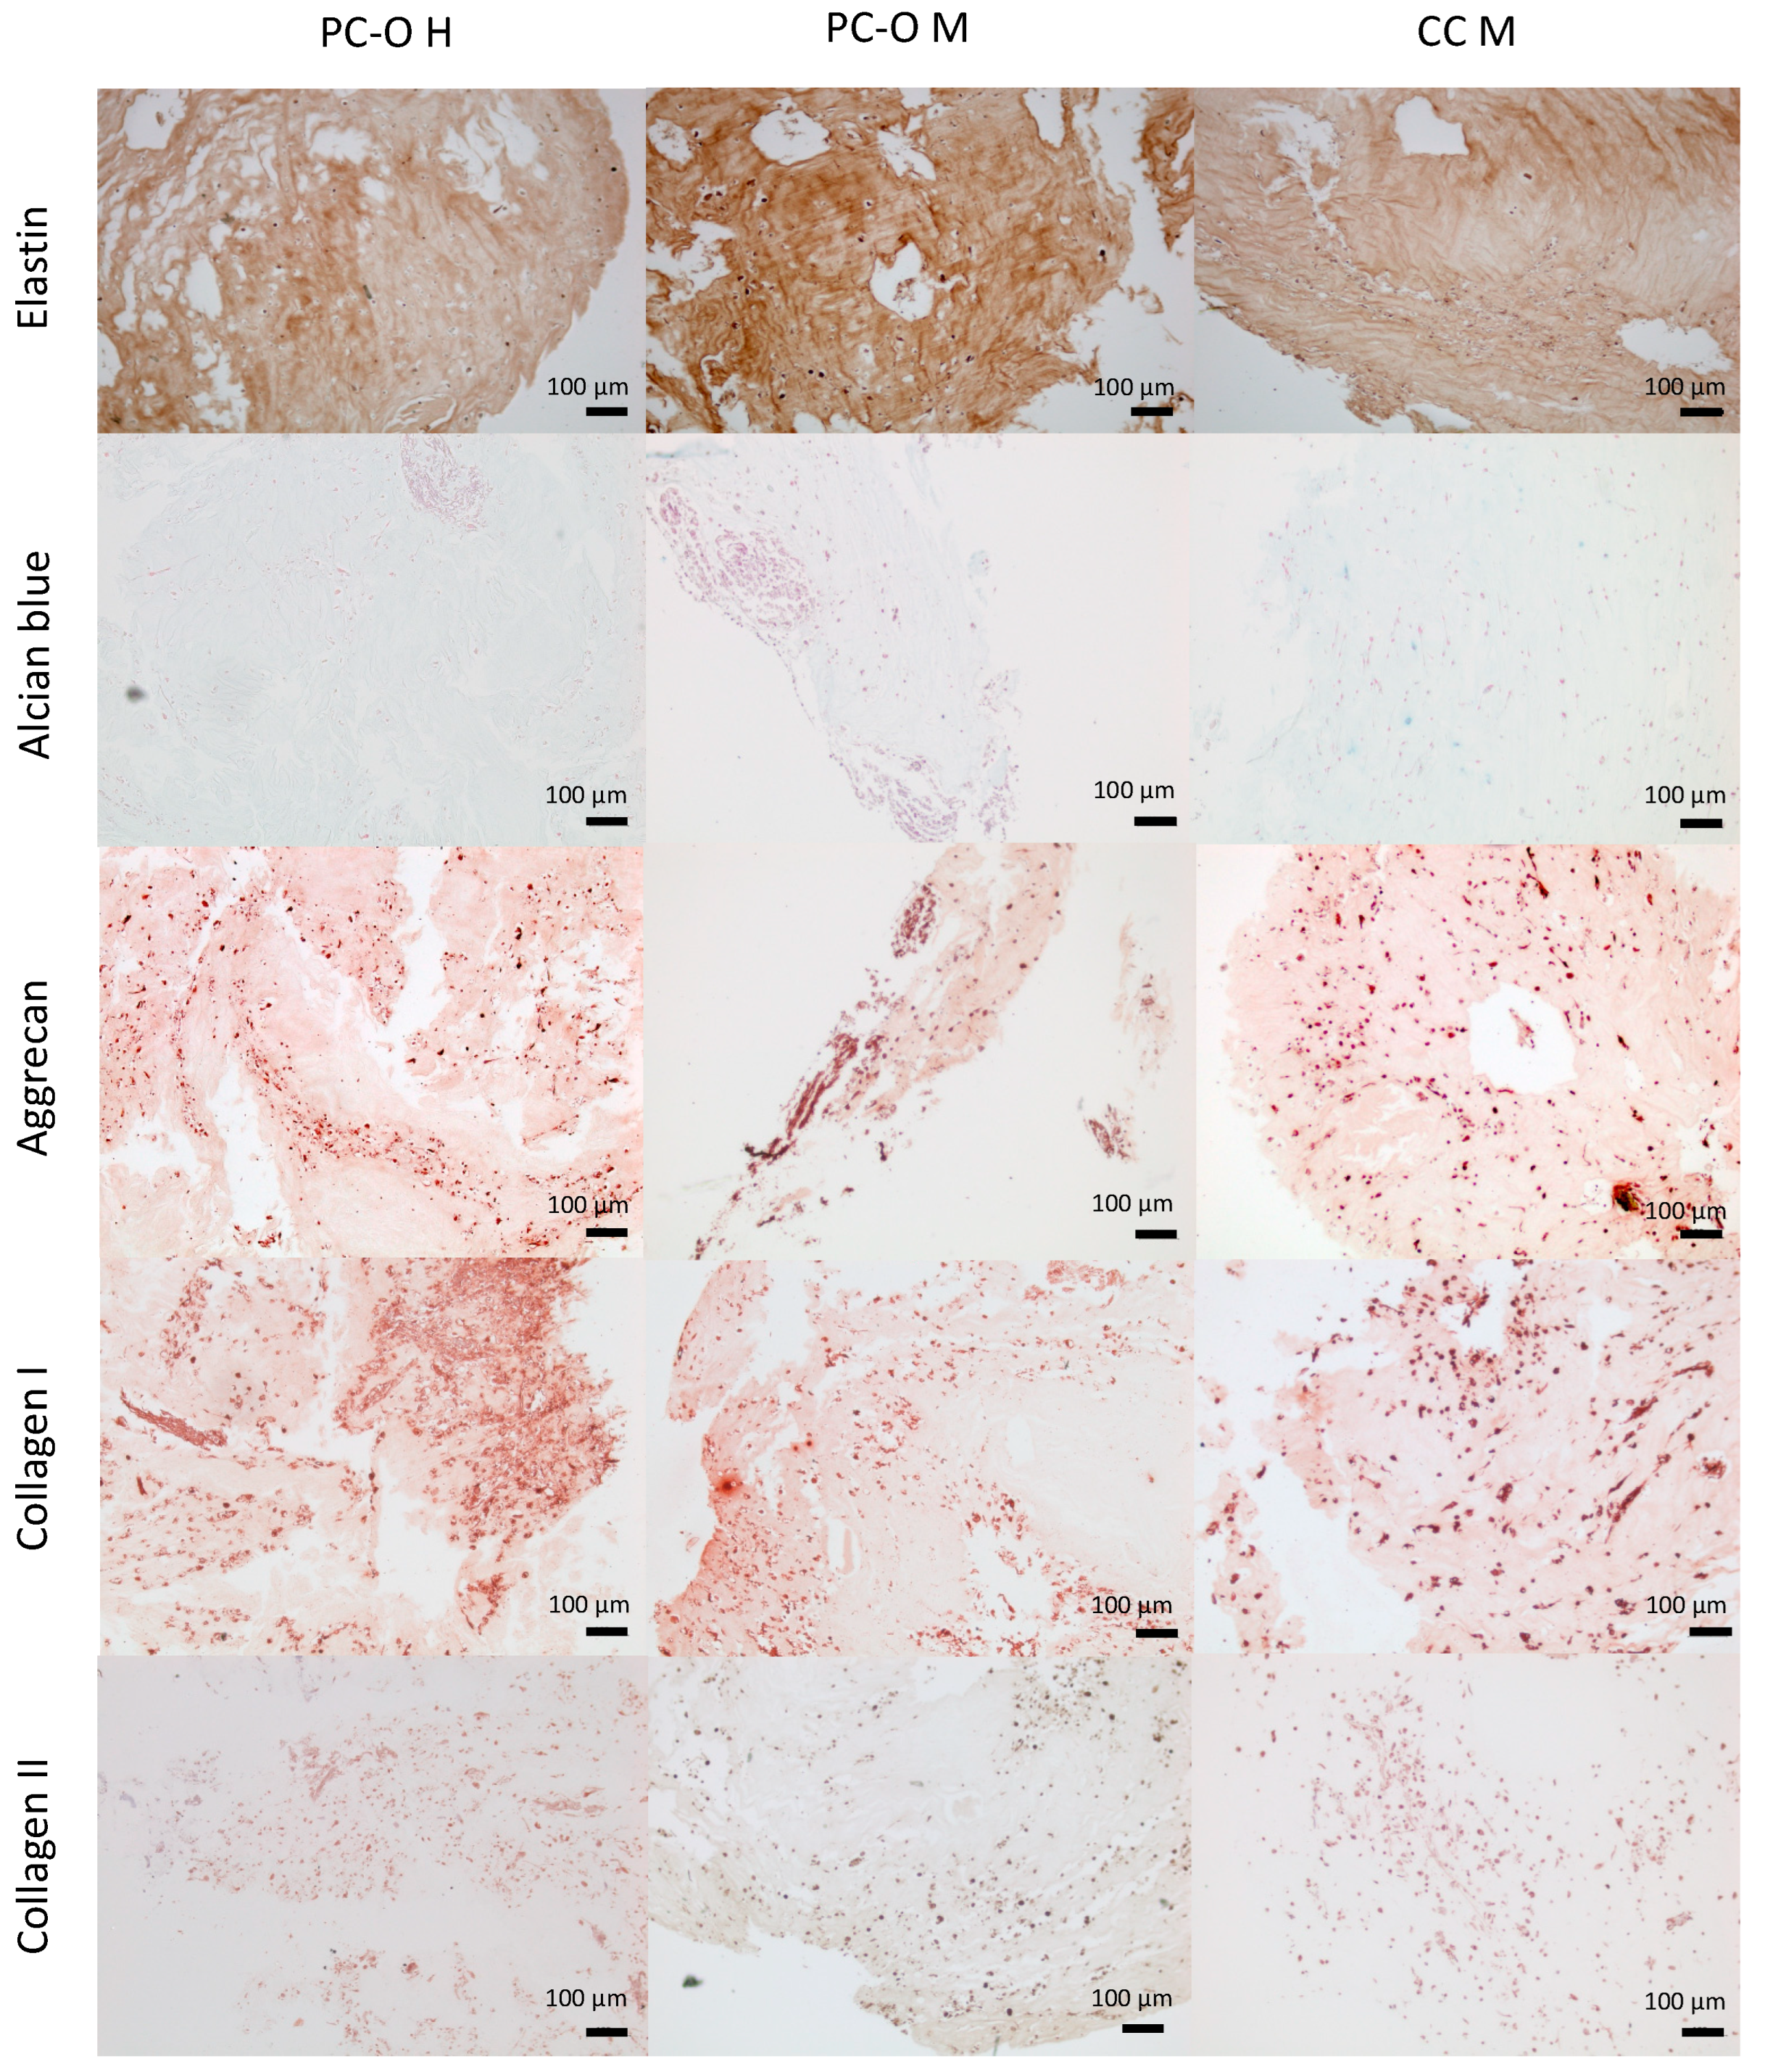
3.6. Formation of Chondrogenic Matrix in HATG-Alg Hydrogels
4. Discussion
5. Conclusions
Supplementary Materials
Author Contributions
Funding
Institutional Review Board Statement
Informed Consent Statement
Data Availability Statement
Acknowledgments
Conflicts of Interest
References
- Luquetti, D.V.; Leoncini, E.; Mastroiacovo, P. Microtia-Anotia: A Global Review of Prevalence Rates. Birth Defects Res. A Clin. Mol. Teratol. 2011, 91, 813–822. [Google Scholar] [CrossRef] [PubMed]
- Mastroiacovo, P.; Corchia, C.; Botto, L.D.; Lanni, R.; Zampino, G.; Fusco, D. Epidemiology and Genetics of Microtia-Anotia: A Registry Based Study on over One Million Births. J. Med. Genet. 1995, 32, 453–457. [Google Scholar] [CrossRef] [PubMed]
- Luquetti, D.V.; Heike, C.L.; Hing, A.V.; Cunningham, M.L.; Cox, T.C. Microtia: Epidemiology and Genetics. Am. J. Med. Genet. A 2012, 158A, 124–139. [Google Scholar] [CrossRef] [PubMed]
- Baluch, N.; Nagata, S.; Park, C.; Wilkes, G.H.; Reinisch, J.; Kasrai, L.; Fisher, D. Auricular Reconstruction for Microtia: A Review of Available Methods. Plast. Surg. 2014, 22, 39–43. [Google Scholar] [CrossRef]
- Jiamei, D.; Jiake, C.; Hongxing, Z.; Wanhou, G.; Yan, W.; Gaifen, L. An Investigation of Psychological Profiles and Risk Factors in Congenital Microtia Patients. J. Plast. Reconstr. Aesthetic Surg. 2008, 61, S37–S43. [Google Scholar] [CrossRef]
- Nagata, S. Modification of the Stages in Total Reconstruction of the Auricle: Part I. Grafting the Three-Dimensional Costal Cartilage Framework for Lobule-Type Microtia. Plast. Reconstr. Surg. 1994, 93, 221–230. [Google Scholar] [CrossRef]
- Nagata, S. Modification of the Stages in Total Reconstruction of the Auricle: Part II. Grafting the Three-Dimensional Costal Cartilage Framework for Concha-Type Microtia. Plast. Reconstr. Surg. 1994, 93, 231–242. [Google Scholar] [CrossRef]
- Nagata, S. Modification of the Stages in Total Reconstruction of the Auricle: Part III. Grafting the Three-Dimensional Costal Cartilage Framework for Small Concha-Type Microtia. Plast. Reconstr. Surg. 1994, 93, 243–253. [Google Scholar] [CrossRef]
- Nagata, S. Modification of the Stages in Total Reconstruction of the Auricle: Part IV. Ear Elevation for the Constructed Auricle. Plast. Reconstr. Surg. 1994, 93, 254–266; discussion 267–268. [Google Scholar] [CrossRef]
- Kamil, S.H.; Vacanti, M.P.; Vacanti, C.A.; Eavey, R.D. Microtia Chondrocytes as a Donor Source for Tissue-Engineered Cartilage. Laryngoscope 2004, 114, 2187–2190. [Google Scholar] [CrossRef]
- Jessop, Z.M.; Javed, M.; Otto, I.A.; Combellack, E.J.; Morgan, S.; Breugem, C.C.; Archer, C.W.; Khan, I.M.; Lineaweaver, W.C.; Kon, M.; et al. Combining Regenerative Medicine Strategies to Provide Durable Reconstructive Options: Auricular Cartilage Tissue Engineering. Stem Cell Res. Ther. 2016, 7, 19. [Google Scholar] [CrossRef]
- Bichara, D.A.; O’Sullivan, N.A.; Pomerantseva, I.; Zhao, X.; Sundback, C.A.; Vacanti, J.P.; Randolph, M.A. The Tissue-Engineered Auricle: Past, Present, and Future. Tissue Eng. Part B Rev. 2012, 18, 51–61. [Google Scholar] [CrossRef] [PubMed]
- Kusuhara, H.; Isogai, N.; Enjo, M.; Otani, H.; Ikada, Y.; Jacquet, R.; Lowder, E.; Landis, W.J. Tissue Engineering a Model for the Human Ear: Assessment of Size, Shape, Morphology, and Gene Expression Following Seeding of Different Chondrocytes. Wound Repair Regen. 2009, 17, 136–146. [Google Scholar] [CrossRef] [PubMed]
- Otto, I.A.; Bernal, P.N.; Rikkers, M.; van Rijen, M.H.P.; Mensinga, A.; Kon, M.; Breugem, C.C.; Levato, R.; Malda, J. Human Adult, Pediatric and Microtia Auricular Cartilage Harbor Fibronectin-Adhering Progenitor Cells with Regenerative Ear Reconstruction Potential. iScience 2022, 25, 104979. [Google Scholar] [CrossRef] [PubMed]
- Cenzi, R.; Burlini, D.; Arduin, L.; Zollino, I.; Guidi, R.; Carinci, F. Mandibular Condyle Fractures: Evaluation of the Strasbourg Osteosynthesis Research Group Classification. J. Craniofacial Surg. 2009, 20, 24–28. [Google Scholar] [CrossRef] [PubMed]
- Hospodiuk, M.; Dey, M.; Sosnoski, D.; Ozbolat, I.T. The Bioink: A Comprehensive Review on Bioprintable Materials. Biotechnol. Adv. 2017, 35, 217–239. [Google Scholar] [CrossRef] [PubMed]
- Ozbolat, I.T.; Peng, W.; Ozbolat, V. Application Areas of 3D Bioprinting. Drug Discov. Today 2016, 21, 1257–1271. [Google Scholar] [CrossRef]
- Naveau, A.; Smirani, R.; Catros, S.; De Oliveira, H.; Fricain, J.-C.; Devillard, R. A Bibliometric Study to Assess Bioprinting Evolution. Appl. Sci. 2017, 7, 1331. [Google Scholar] [CrossRef]
- Wang, C.; Varshney, R.R.; Wang, D.A. Therapeutic Cell Delivery and Fate Control in Hydrogels and Hydrogel Hybrids. Adv. Drug Deliv. Rev. 2010, 62, 699–710. [Google Scholar] [CrossRef]
- Yanaga, H.; Imai, K.; Fujimoto, T.; Yanaga, K. Generating Ears from Cultured Autologous Auricular Chondrocytes by Using Two-Stage Implantation in Treatment of Microtia. Plast. Reconstr. Surg. 2009, 124, 817–825. [Google Scholar] [CrossRef]
- Mannoor, M.S.; Jiang, Z.; James, T.; Kong, Y.L.; Malatesta, K.A.; Soboyejo, W.O.; Verma, N.; Gracias, D.H.; McAlpine, M.C. 3D Printed Bionic Ears. Nano Lett. 2013, 13, 2634–2639. [Google Scholar] [CrossRef] [PubMed]
- Reiffel, A.J.; Kafka, C.; Hernandez, K.A.; Popa, S.; Perez, J.L.; Zhou, S.; Pramanik, S.; Brown, B.N.; Ryu, W.S.; Bonassar, L.J.; et al. High-Fidelity Tissue Engineering of Patient-Specific Auricles for Reconstruction of Pediatric Microtia and Other Auricular Deformities. PLoS ONE 2013, 8, e56506. [Google Scholar] [CrossRef] [PubMed]
- Bichara, D.A.; Pomerantseva, I.; Zhao, X.; Zhou, L.; Kulig, K.M.; Tseng, A.; Kimura, A.M.; Johnson, M.A.; Vacanti, J.P.; Randolph, M.A.; et al. Successful Creation of Tissue-Engineered Autologous Auricular Cartilage in an Immunocompetent Large Animal Model. Tissue Eng. Part A 2014, 20, 303–312. [Google Scholar] [CrossRef] [PubMed]
- Zopf, D.A.; Mitsak, A.G.; Flanagan, C.L.; Wheeler, M.; Green, G.E.; Hollister, S.J. Computer Aided-Designed, 3-Dimensionally Printed Porous Tissue Bioscaffolds for Craniofacial Soft Tissue Reconstruction. Otolaryngol.-Head Neck Surg. 2015, 152, 57–62. [Google Scholar] [CrossRef] [PubMed]
- Zopf, D.A.; Flanagan, C.L.; Mitsak, A.G.; Brennan, J.R.; Hollister, S.J. Pore Architecture Effects on Chondrogenic Potential of Patient-Specific 3-Dimensionally Printed Porous Tissue Bioscaffolds for Auricular Tissue Engineering. Int. J. Pediatr. Otorhinolaryngol. 2018, 114, 170–174. [Google Scholar] [CrossRef]
- Zhou, G.; Jiang, H.; Yin, Z.; Liu, Y.; Zhang, Q.; Zhang, C.; Pan, B.; Zhou, J.; Zhou, X.; Sun, H.; et al. In Vitro Regeneration of Patient-Specific Ear-Shaped Cartilage and Its First Clinical Application for Auricular Reconstruction. EBioMedicine 2018, 28, 287–302. [Google Scholar] [CrossRef]
- Liao, J.; Chen, Y.; Chen, J.; He, B.; Qian, L.; Xu, J.; Wang, A.; Li, Q.; Xie, H.; Zhou, J. Auricle Shaping Using 3D Printing and Autologous Diced Cartilage. Laryngoscope 2019, 129, 2467–2474. [Google Scholar] [CrossRef]
- Cohen, B.P.; Bernstein, J.L.; Morrison, K.A.; Spector, J.A.; Bonassar, L.J. Tissue Engineering the Human Auricle by Auricular Chondrocyte-Mesenchymal Stem Cell Co-Implantation. PLoS ONE 2018, 13, e02356. [Google Scholar] [CrossRef]
- Hsieh-Bonassera, N.D.; Wu, I.; Lin, J.K.; Schumacher, B.L.; Chen, A.C.; Masuda, K.; Bugbee, W.D.; Sah, R.L. Expansion and Redifferentiation of Chondrocytes from Osteoarthritic Cartilage: Cells for Human Cartilage Tissue Engineering. Tissue Eng. Part A. 2009, 15, 3513–3523. [Google Scholar] [CrossRef]
- Shin, H.; Nam Lee, M.; Seung Choung, J.; Kim, S.; Hyune Choi, B.; Noh, M.; Shin, J.H. Focal Adhesion Assembly Induces Phenotypic Changes and Dedifferentiation in Chondrocytes. J. Cell. Physiol. 2016, 231, 1822–1831. [Google Scholar] [CrossRef]
- He, A.; Ye, A.; Song, N.; Liu, N.; Zhou, G.; Liu, Y.; Ye, X. Phenotypic Redifferentiation of Dedifferentiated Microtia Chondrocytes through a Three-Dimensional Chondrogenic Culture System. Am. J. Transl. Res. 2020, 12, 2903. [Google Scholar] [PubMed]
- Pomerantseva, I.; Bichara, D.A.; Tseng, A.; Cronce, M.J.; Cervantes, T.M.; Kimura, A.M.; Neville, C.M.; Roscioli, N.; Vacanti, J.P.; Randolph, M.A.; et al. Ear-Shaped Stable Auricular Cartilage Engineered from Extensively Expanded Chondrocytes in an Immunocompetent Experimental Animal Model. Tissue Eng. Part A 2016, 22, 197–207. [Google Scholar] [CrossRef] [PubMed]
- Otto, I.A.; Levato, R.; Webb, W.R.; Khan, I.M.; Breugem, C.C.; Malda, J. Progenitor Cells in Auricular Cartilage Demonstrate Cartilage-Forming Capacity in 3D Hydrogel Culture. Eur. Cell Mater. 2018, 35, 132–150. [Google Scholar] [CrossRef] [PubMed]
- Saadeh, P.B.; Brent, B.; Mehrara, B.J.; Steinbrech, D.S.; Ting, V.; Gittes, G.K.; Longaker, M.T. Human Cartilage Engineering: Chondrocyte Extraction, Proliferation, and Characterization for Construct Development. Ann. Plast. Surg. 1999, 42, 509–513. [Google Scholar] [CrossRef] [PubMed]
- Gvaramia, D.; Kern, J.; Jakob, Y.; Zenobi-Wong, M.; Rotter, N. Regenerative Potential of Perichondrium: A Tissue Engineering Perspective. Tissue Eng. Part. B Rev. 2021, 28, 531–541. [Google Scholar] [CrossRef]
- Kobayashia, S.; Takebe, T.; Inui, M.; Iwai, S.; Kan, H.; Zheng, Y.W.; Maegawa, J.; Taniguchi, H. Reconstruction of Human Elastic Cartilage by a CD44 + CD90 + Stem Cell in the Ear Perichondrium. Proc. Natl. Acad. Sci. USA 2011, 108, 14479–14484. [Google Scholar] [CrossRef]
- Kobayashi, S.; Takebe, T.; Zheng, Y.W.; Mizuno, M.; Yabuki, Y.; Maegawa, J.; Taniguchi, H. Presence of Cartilage Stem/Progenitor Cells in Adult Mice Auricular Perichondrium. PLoS ONE 2011, 6, e26393. [Google Scholar] [CrossRef]
- Kagimoto, S.; Takebe, T.; Kobayashi, S.; Yabuki, Y.; Hori, A.; Hirotomi, K.; Mikami, T.; Uemura, T.; Maegawa, J.; Taniguchi, H. Autotransplantation of Monkey Ear Perichondrium-Derived Progenitor Cells for Cartilage Reconstruction. Cell Transplant. 2016, 25, 951–962. [Google Scholar] [CrossRef]
- Oba, T.; Okamoto, S.; Ueno, Y.; Matsuo, M.; Tadokoro, T.; Kobayashi, S.; Yasumura, K.; Kagimoto, S.; Inaba, Y.; Taniguchi, H. In Vitro Elastic Cartilage Reconstruction Using Human Auricular Perichondrial Chondroprogenitor Cell–Derived Micro 3D Spheroids. J. Tissue Eng. 2022, 13, 20417314221143484. [Google Scholar] [CrossRef]
- Zhang, L.; He, A.; Yin, Z.; Yu, Z.; Luo, X.; Liu, W.; Zhang, W.; Cao, Y.; Liu, Y.; Zhou, G. Regeneration of Human-Ear-Shaped Cartilage by Co-Culturing Human Microtia Chondrocytes with BMSCs. Biomaterials 2014, 35, 4878–4887. [Google Scholar] [CrossRef]
- Gu, Y.; Kang, N.; Dong, P.; Liu, X.; Wang, Q.; Fu, X.; Yan, L.; Jiang, H.; Cao, Y.; Xiao, R. Chondrocytes from Congenital Microtia Possess an Inferior Capacity for in Vivo Cartilage Regeneration to Healthy Ear Chondrocytes. J. Tissue Eng. Regen. Med. 2018, 12, e1737–e1746. [Google Scholar] [CrossRef] [PubMed]
- Zucchelli, E.; Birchall, M.; Bulstrode, N.W.; Ferretti, P. Modeling Normal and Pathological Ear Cartilage in Vitro Using Somatic Stem Cells in Three-Dimensional Culture. Front. Cell Dev. Biol. 2020, 8, 666. [Google Scholar] [CrossRef] [PubMed]
- Takebe, T.; Kobayashi, S.; Kan, H.; Suzuki, H.; Yabuki, Y.; Mizuno, M.; Adegawa, T.; Yoshioka, T.; Tanaka, J.; Maegawa, J.; et al. Human Elastic Cartilage Engineering from Cartilage Progenitor Cells Using Rotating Wall Vessel Bioreactor. Transplant. Proc. 2012, 44, 1158–1161. [Google Scholar] [CrossRef] [PubMed]
- Jessop, Z.M.; Manivannan, S.; Zhang, Y.; Thornton, C.A.; Narayan, R.; Whitaker, I.S. Tissue Specific Stem/Progenitor Cells for Cartilage Tissue Engineering: A Systematic Review of the Literature. Appl. Phys. Rev. 2019, 6, 031301. [Google Scholar] [CrossRef]
- Elsaesser, A.F.; Schwarz, S.; Joos, H.; Koerber, L.; Brenner, R.E.; Rotter, N. Characterization of a Migrative Subpopulation of Adult Human Nasoseptal Chondrocytes with Progenitor Cell Features and Their Potential for in Vivo Cartilage Regeneration Strategies. Cell Biosci. 2016, 6, 11. [Google Scholar] [CrossRef] [PubMed]
- Jessop, Z.M.; Al-Sabah, A.; Simoes, I.N.; Burnell, S.E.A.; Pieper, I.L.; Thornton, C.A.; Whitaker, I.S. Isolation and Characterisation of Nasoseptal Cartilage Stem/Progenitor Cells and Their Role in the Chondrogenic Niche. Stem Cell Res. Ther. 2020, 11, 177. [Google Scholar] [CrossRef] [PubMed]
- Fisch, P.; Broguiere, N.; Finkielsztein, S.; Linder, T.; Zenobi-Wong, M. Bioprinting of Cartilaginous Auricular Constructs Utilizing an Enzymatically Crosslinkable Bioink. Adv. Funct. Mater. 2021, 31, 2008261. [Google Scholar] [CrossRef]
- Jiang, Y.; Tuan, R.S. Origin and Function of Cartilage Stem/Progenitor Cells in Osteoarthritis. Nat. Rev. Rheumatol. 2015, 11, 206–212. [Google Scholar] [CrossRef]
- Isogai, N.; Asamura, S.; Higashi, T.; Ikada, Y.; Morita, S.; Hillyer, J.; Jacquet, R.; Landis, W.J. Tissue Engineering of an Auricular Cartilage Model Utilizing Cultured Chondrocyte-Poly (L-Lactide-Epsiloncaprolactone) Scaffolds. Tissue Eng. 2004, 10, 673–687. [Google Scholar] [CrossRef]
- Isogai, N.; Kusuhara, H.; Ikada, Y.; Ohtani, H.; Jacquet, R.; Hillyer, J.; Lowder, E.; Landis, W.J. Comparison of Different Chondrocytes for Use in Tissue Engineering of Cartilage Model. Structures. Tissue Eng. 2006, 12, 691–703. [Google Scholar] [CrossRef]
- Tay, A.G.; Farhadi, J.; Suetterlin, R.; Pierer, G.; Heberer, M.; Martin, I. Cell Yield, Proliferation, and Postexpansion Differentiation Capacity of Human Ear, Nasal, and Rib Chondrocytes. Tissue Eng. 2004, 10, 762–770. [Google Scholar] [CrossRef]
- Gavénis, K.; Schmidt-Rohlfing, B.; Mueller-Rath, R.; Andereya, S.; Schneider, U. In Vitro Comparison of Six Different Matrix Systems for the Cultivation of Human Chondrocytes. Vitr. Cell. Dev. Biol.-Anim. 2006, 42, 159–167. [Google Scholar] [CrossRef] [PubMed]
- Asawa, Y.; Ogasawara, T.; Takahashi, T.; Yamaoka, H.; Nishizawa, S.; Matsudaira, K.; Mori, Y.; Takato, T.; Hoshi, K. Aptitude of Auricular and Nasoseptal Chondrocytes Cultured under a Monolayer or Three-Dimensional Condition for Cartilage Tissue Engineering. Tissue Eng. Part A 2009, 15, 1109–1118. [Google Scholar] [CrossRef] [PubMed]
- Hellingman, C.A.; Verwiel, E.T.P.; Slagt, I.; Koevoet, W.; Poublon, R.M.L.; Nolst-Trenité, G.J.; de Jong, R.J.B.; Jahr, H.; van Osch, G.J.V.M. Differences in Cartilage-Forming Capacity of Expanded Human Chondrocytes from Ear and Nose and Their Gene Expression Profiles. Cell Transplant. 2011, 20, 925–940. [Google Scholar] [CrossRef] [PubMed]
- Togo, T.; Utani, A.; Naitoh, M.; Ohta, M.; Tsuji, Y.; Morikawa, N.; Nakamura, M.; Suzuki, S. Identification of Cartilage Progenitor Cells in the Adult Ear Perichondrium: Utilization for Cartilage Reconstruction. Lab. Investig. 2006, 86, 445–457. [Google Scholar] [CrossRef] [PubMed]
- Guasti, L.; Prasongchean, W.; Kleftouris, G.; Mukherjee, S.; Thrasher, A.J.; Bulstrode, N.W.; Ferretti, P. High Plasticity of Pediatric Adipose Tissue-Derived Stem Cells: Too Much for Selective Skeletogenic Differentiation? Stem Cells Transl. Med. 2012, 1, 384–395. [Google Scholar] [CrossRef]
- Sun, Z.; Khlusov, I.A.; Evdokimov, K.E.; Konishchev, M.E.; Kuzmin, O.S.; Khaziakhmatova, O.G.; Malashchenko, V.V.; Litvinova, L.S.; Rutkowski, S.; Frueh, J.; et al. Nitrogen-Doped Titanium Dioxide Films Fabricated via Magnetron Sputtering for Vascular Stent Biocompatibility Improvement. J. Colloid. Interface Sci. 2022, 626, 101–112. [Google Scholar] [CrossRef]
- Friedl, P.; Wolf, K. Plasticity of Cell Migration: A Multiscale Tuning Model. J. Cell Biol. 2010, 188, 11–19. [Google Scholar] [CrossRef]
- Wang, J.H.-C.; Thampatty, B.P. An Introductory Review of Cell Mechanobiology. Biomech. Model. Mechanobiol. 2006, 5, 1–16. [Google Scholar] [CrossRef]
- Wang, Y.; Sul, H.S. Pref-1 Regulates Mesenchymal Cell Commitment and Differentiation through Sox9. Cell Metab. 2009, 9, 287–302. [Google Scholar] [CrossRef]
- Ishak, M.F.; Chua, K.H.; Asma, A.; Saim, L.; Aminuddin, B.S.; Ruszymah, B.H.I.; Goh, B.S. Stem Cell Genes Are Poorly Expressed in Chondrocytes from Microtic Cartilage. Int. J. Pediatr. Otorhinolaryngol. 2011, 75, 835–840. [Google Scholar] [CrossRef] [PubMed]
- Ciorba, A.; Martini, A. Tissue Engineering and Cartilage Regeneration for Auricular Reconstruction. Int. J. Pediatr. Otorhinolaryngol. 2006, 70, 1507–1515. [Google Scholar] [CrossRef] [PubMed]
- Xue, K.; Zhang, X.; Qi, L.; Zhou, J.; Liu, K. Isolation, Identification, and Comparison of Cartilage Stem Progenitor/Cells from Auricular Cartilage and Perichondrium. Am. J. Transl. Res. 2016, 8, 732–741. [Google Scholar] [PubMed]
- Jiang, Y.; Cai, Y.; Zhang, W.; Yin, Z.; Hu, C.; Tong, T.; Lu, P.; Zhang, S.; Neculai, D.; Tuan, R.S.; et al. Human Cartilage-Derived Progenitor Cells from Committed Chondrocytes for Efficient Cartilage Repair and Regeneration. Stem Cells Transl. Med. 2016, 5, 733–744. [Google Scholar] [CrossRef]
- Park, H.; Kim, P.H.; Hwang, T.; Kwon, O.J.; Park, T.J.; Choi, S.W.; Yun, C.O.; Kim, J.H. Fabrication of Cross-Linked Alginate Beads Using Electrospraying for Adenovirus Delivery. Int. J. Pharm. 2012, 427, 417–425. [Google Scholar] [CrossRef]
- Dovedytis, M.; Liu, Z.J.; Bartlett, S. Hyaluronic Acid and Its Biomedical Applications: A Review. Eng. Regen. 2020, 1, 102–113. [Google Scholar] [CrossRef]
- Zhou, L.; Ding, R.; Li, B.; Han, H.; Wang, H.; Wang, G.; Xu, B.; Zhai, S.; Wu, W. Cartilage Engineering Using Chondrocyte Cell Sheets and Its Application in Reconstruction of Microtia. Int. J. Clin. Exp. Pathol. 2015, 8, 73. [Google Scholar]


Disclaimer/Publisher’s Note: The statements, opinions and data contained in all publications are solely those of the individual author(s) and contributor(s) and not of MDPI and/or the editor(s). MDPI and/or the editor(s) disclaim responsibility for any injury to people or property resulting from any ideas, methods, instructions or products referred to in the content. |
© 2024 by the authors. Licensee MDPI, Basel, Switzerland. This article is an open access article distributed under the terms and conditions of the Creative Commons Attribution (CC BY) license (https://creativecommons.org/licenses/by/4.0/).
Share and Cite
Jakob, Y.; Kern, J.; Gvaramia, D.; Fisch, P.; Magritz, R.; Reutter, S.; Rotter, N. Suitability of Ex Vivo-Expanded Microtic Perichondrocytes for Auricular Reconstruction. Cells 2024, 13, 141. https://doi.org/10.3390/cells13020141
Jakob Y, Kern J, Gvaramia D, Fisch P, Magritz R, Reutter S, Rotter N. Suitability of Ex Vivo-Expanded Microtic Perichondrocytes for Auricular Reconstruction. Cells. 2024; 13(2):141. https://doi.org/10.3390/cells13020141
Chicago/Turabian StyleJakob, Yvonne, Johann Kern, David Gvaramia, Philipp Fisch, Ralph Magritz, Sven Reutter, and Nicole Rotter. 2024. "Suitability of Ex Vivo-Expanded Microtic Perichondrocytes for Auricular Reconstruction" Cells 13, no. 2: 141. https://doi.org/10.3390/cells13020141
APA StyleJakob, Y., Kern, J., Gvaramia, D., Fisch, P., Magritz, R., Reutter, S., & Rotter, N. (2024). Suitability of Ex Vivo-Expanded Microtic Perichondrocytes for Auricular Reconstruction. Cells, 13(2), 141. https://doi.org/10.3390/cells13020141