
Osteogenic Differentiation of Human Gingival Fibroblasts Inhibits Osteoclast Formation

 , ,
, ,  , , and
Abstract

1. Introduction
2. Materials and Methods
2.1. Cell Preparation
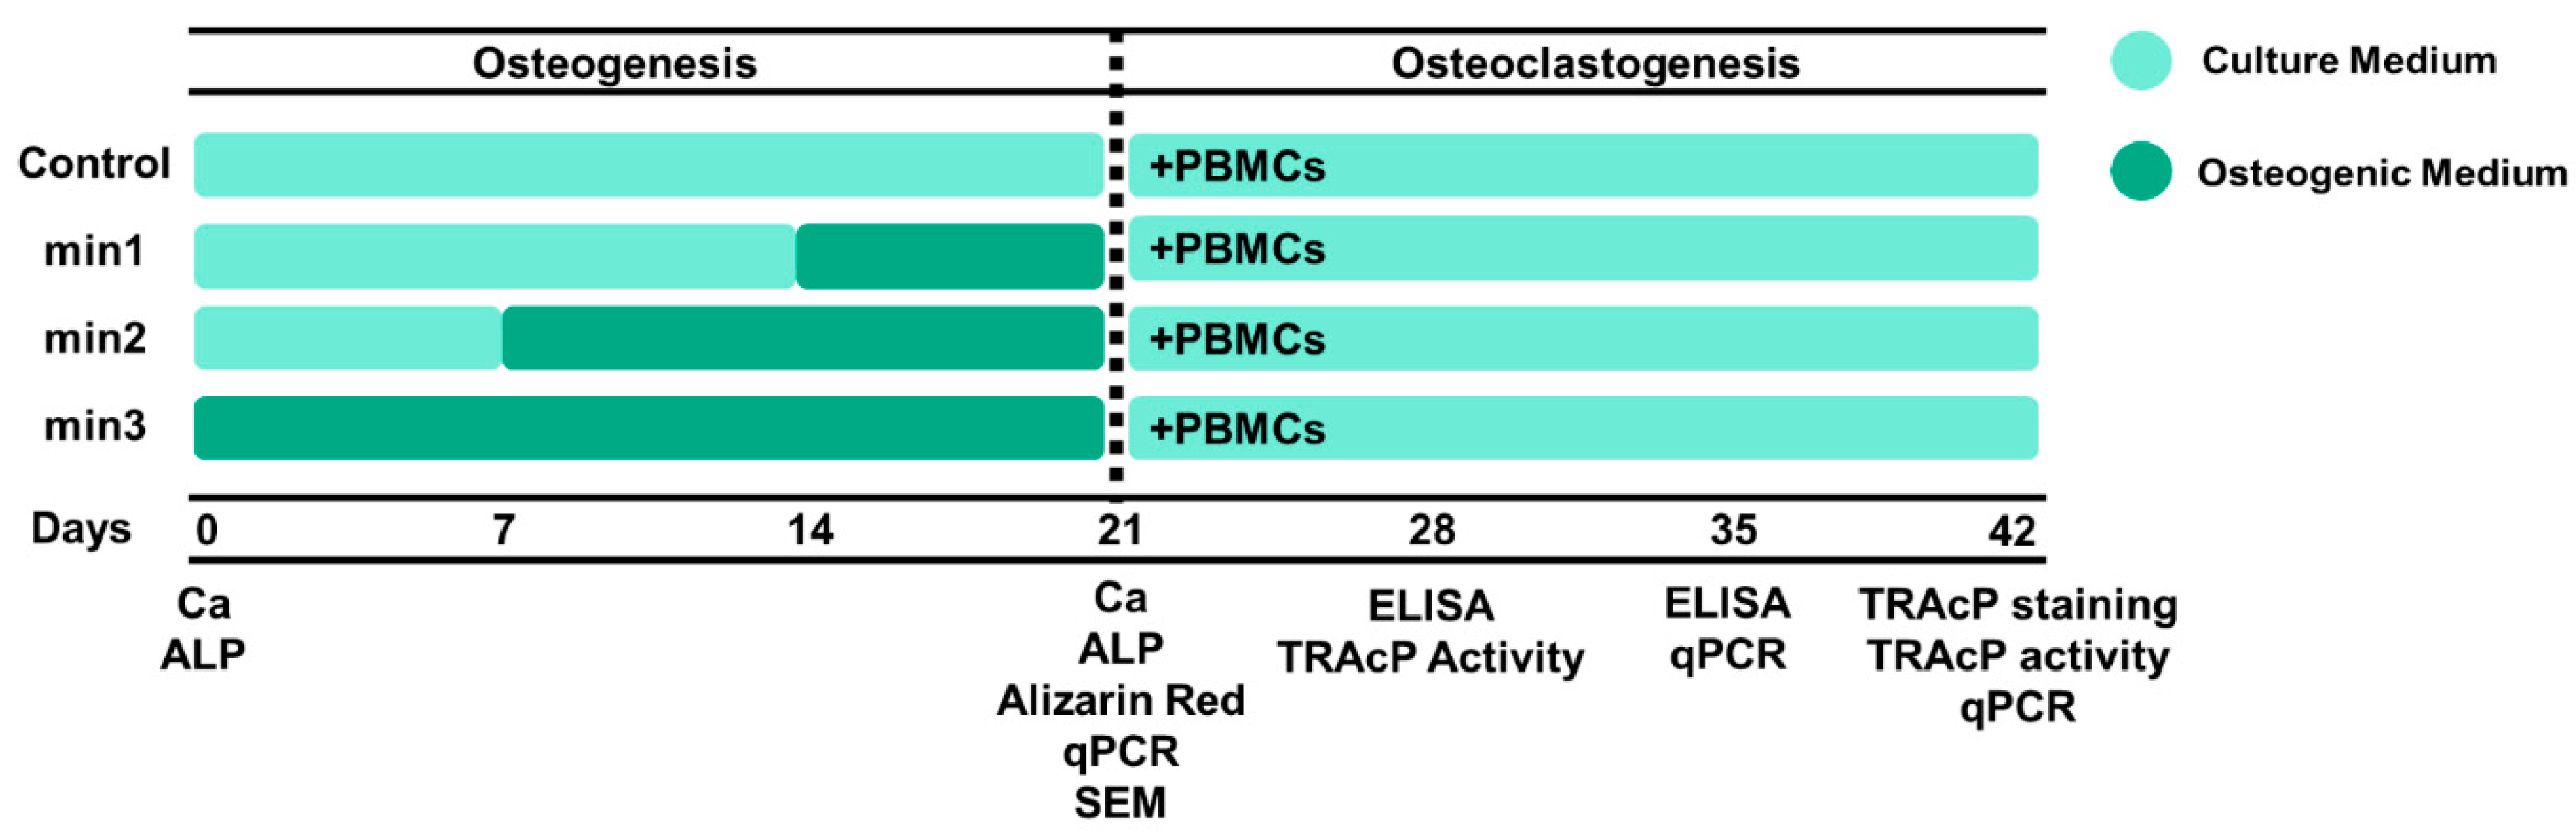
2.2. Osteogenesis
2.3. ALP Activity
2.4. Calcium Concentration
2.5. Alizarin Red Staining
2.6. Scanning Electron Microscopy (SEM)
2.7. Osteoclastogenesis
2.8. TRAcP Activity and Staining
2.9. ELISA
2.10. qPCR
2.11. Statistical Analysis
3. Results
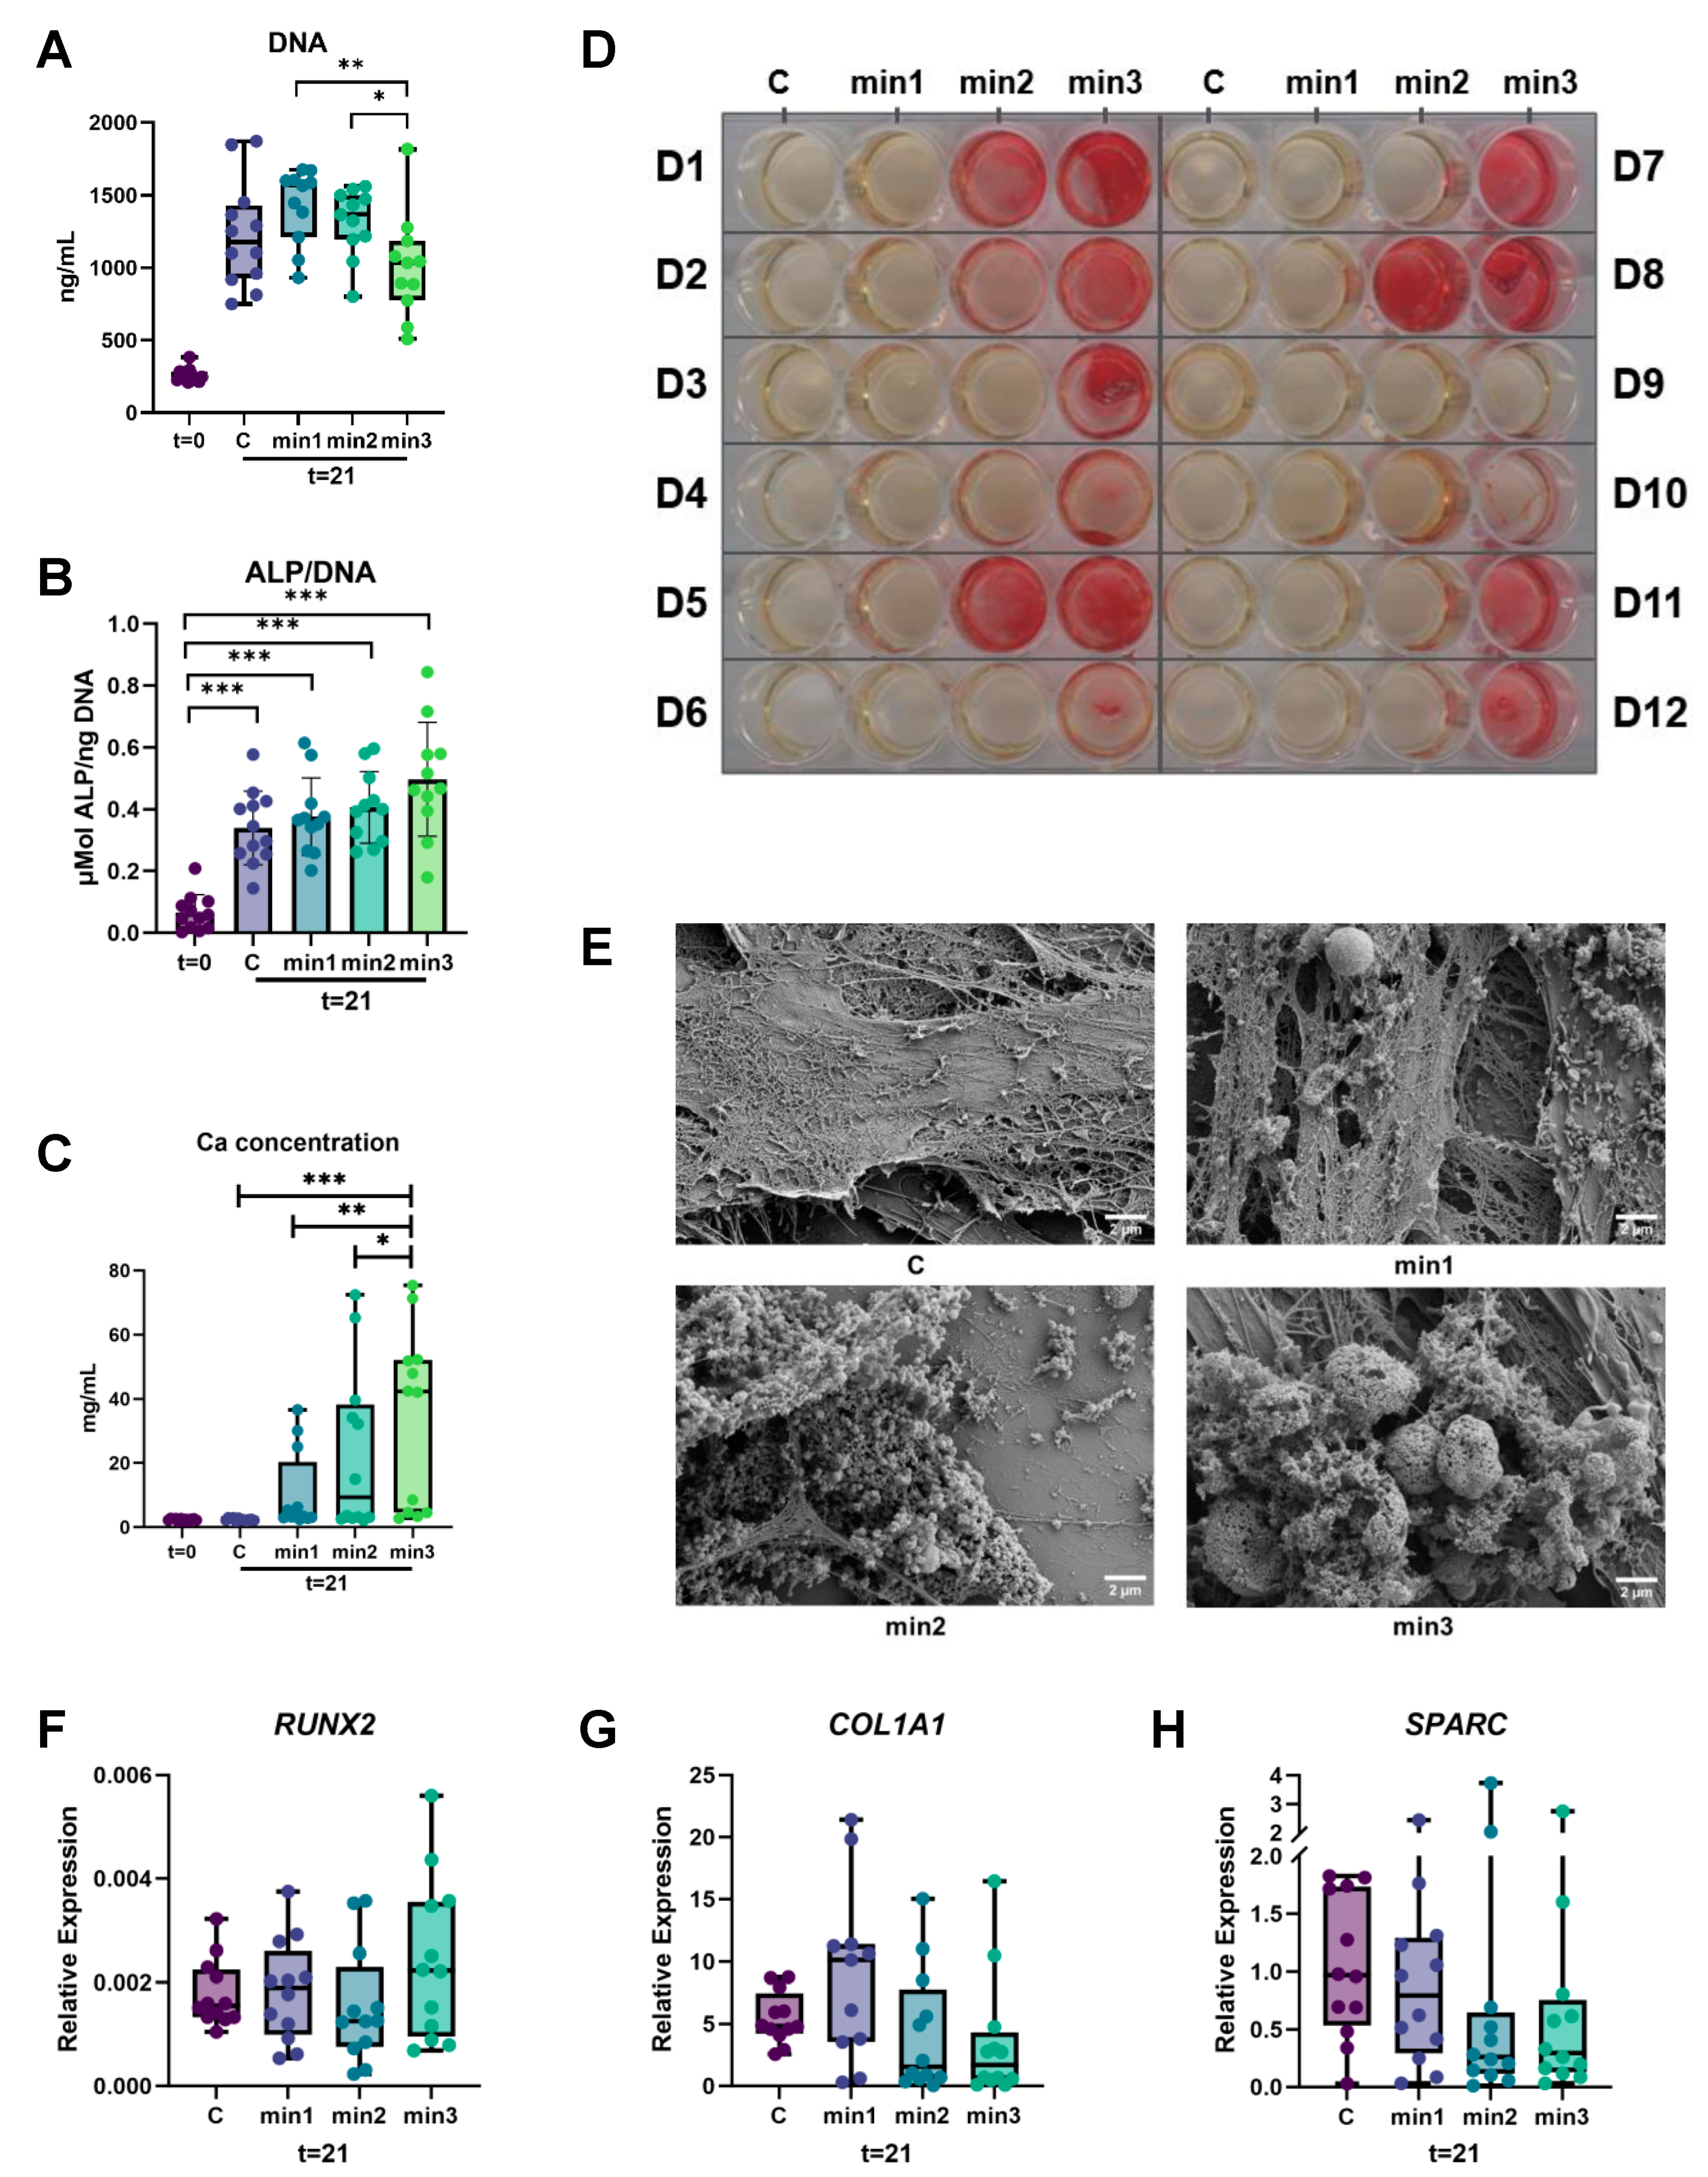
3.1. Osteogenesis
3.1.1. ALP Activity Is Higher after Three Weeks of Culture
3.1.2. Higher Calcium Deposition in Cultures That Were Exposed Longer to Osteogenic Medium
3.1.3. Mineralization Size Increases over Time
3.1.4. Expression of Genes Associated with Osteogenesis
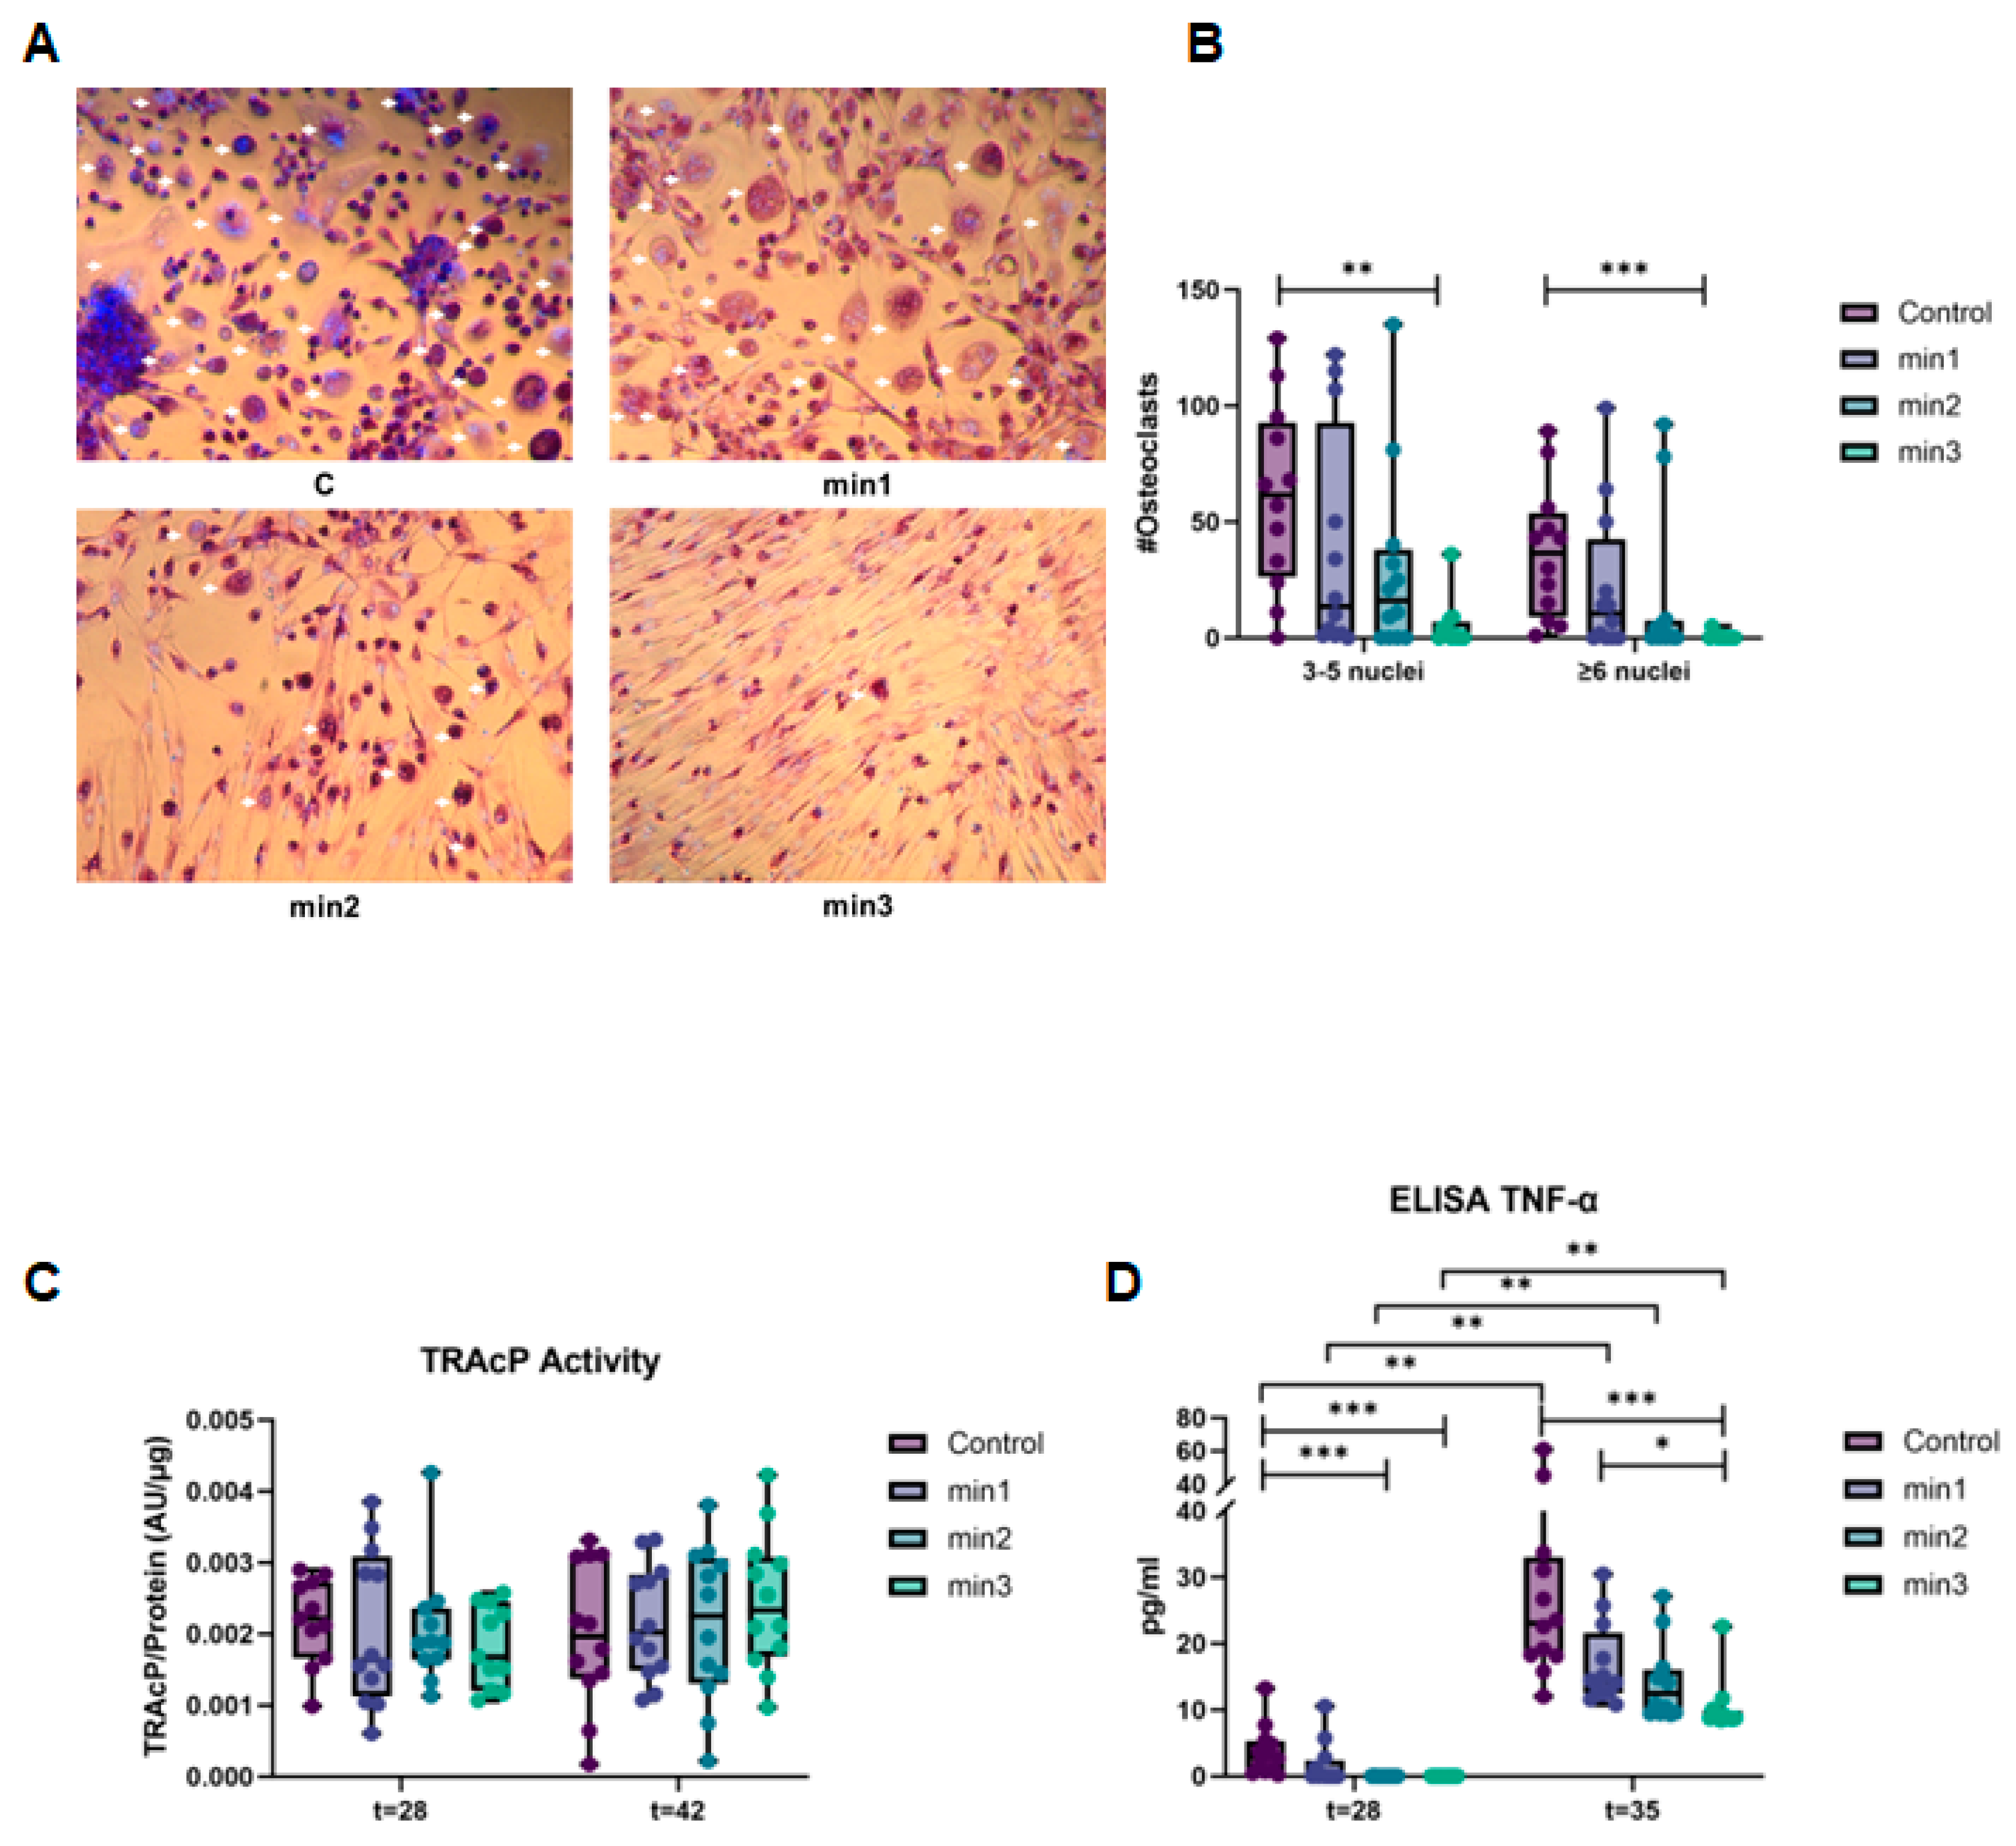
3.2. Osteoclastogenesis
3.2.1. Osteogenic Differentiation of GF Inhibits Osteoclast Formation
3.2.2. Expression of Genes Associated with Osteoclastogenesis
4. Discussion
5. Conclusions
Author Contributions
Funding
Institutional Review Board Statement
Informed Consent Statement
Data Availability Statement
Acknowledgments
Conflicts of Interest
References
- Cochran, D.L. Inflammation and bone loss in periodontal disease. J. Periodontol. 2008, 79, 1569–1576. [Google Scholar] [CrossRef] [PubMed]
- Liu, R.; Bal, H.S.; Desta, T.; Krothapalli, N.; Alyassi, M.; Luan, Q.; Graves, D.T. Diabetes enhances periodontal bone loss through enhanced resorption and diminished bone formation. J. Dent. Res. 2006, 85, 510–514. [Google Scholar] [CrossRef]
- Nguyen, L.; Dewhirst, F.E.; Hauschka, P.V.; Stashenko, P. Interleukin-1 beta stimulates bone resorption and inhibits bone formation in vivo. Lymphokine Cytokine Res. 1991, 10, 15–21. [Google Scholar] [PubMed]
- Boyle, W.J.; Simonet, W.S.; Lacey, D.L. Osteoclast differentiation and activation. Nature 2003, 423, 337–342. [Google Scholar] [CrossRef]
- de Vries, T.J.; Schoenmaker, T.; Wattanaroonwong, N.; van den Hoonaard, M.; Nieuwenhuijse, A.; Beertsen, W.; Everts, V. Gingival fibroblasts are better at inhibiting osteoclast formation than periodontal ligament fibroblasts. J. Cell. Biochem. 2006, 98, 370–382. [Google Scholar] [CrossRef]
- Hakkinen, L.; Larjava, H.; Fournier, B.P. Distinct phenotype and therapeutic potential of gingival fibroblasts. Cytotherapy 2014, 16, 1171–1186. [Google Scholar] [CrossRef]
- Wielento, A.; Lagosz-Cwik, K.B.; Potempa, J.; Grabiec, A.M. The Role of Gingival Fibroblasts in the Pathogenesis of Periodontitis. J. Dent. Res. 2023, 102, 489–496. [Google Scholar] [CrossRef]
- Moonen, C.G.J.; Alders, S.T.; Bontkes, H.J.; Schoenmaker, T.; Nicu, E.A.; Loos, B.G.; de Vries, T.J. Survival, Retention, and Selective Proliferation of Lymphocytes Is Mediated by Gingival Fibroblasts. Front. Immunol. 2018, 9, 1725. [Google Scholar] [CrossRef] [PubMed]
- Baek, K.J.; Choi, Y.; Ji, S. Gingival fibroblasts from periodontitis patients exhibit inflammatory characteristics in vitro. Arch. Oral. Biol. 2013, 58, 1282–1292. [Google Scholar] [CrossRef]
- Van Linthout, S.; Miteva, K.; Tschope, C. Crosstalk between fibroblasts and inflammatory cells. Cardiovasc. Res. 2014, 102, 258–269. [Google Scholar] [CrossRef]
- Ujiie, Y.; Karakida, T.; Yamakoshi, Y.; Ohshima, T.; Gomi, K.; Oida, S. Interleukin-4 released from human gingival fibroblasts reduces osteoclastogenesis. Arch. Oral. Biol. 2016, 72, 187–193. [Google Scholar] [CrossRef]
- Belibasakis, G.N.; Bostanci, N.; Hashim, A.; Johansson, A.; Aduse-Opoku, J.; Curtis, M.A.; Hughes, F.J. Regulation of RANKL and OPG gene expression in human gingival fibroblasts and periodontal ligament cells by Porphyromonas gingivalis: A putative role of the Arg-gingipains. Microb. Pathog. 2007, 43, 46–53. [Google Scholar] [CrossRef]
- Buckley, C.D.; Pilling, D.; Lord, J.M.; Akbar, A.N.; Scheel-Toellner, D.; Salmon, M. Fibroblasts regulate the switch from acute resolving to chronic persistent inflammation. Trends Immunol. 2001, 22, 199–204. [Google Scholar] [CrossRef]
- Claeys, L.; Bravenboer, N.; Eekhoff, E.M.W.; Micha, D. Human Fibroblasts as a Model for the Study of Bone Disorders. Front. Endocrinol. 2020, 11, 394. [Google Scholar] [CrossRef]
- Cho, Y.; Kim, B.; Bae, H.; Kim, W.; Baek, J.; Woo, K.; Lee, G.; Seol, Y.; Lee, Y.; Ku, Y.; et al. Direct Gingival Fibroblast/Osteoblast Transdifferentiation via Epigenetics. J. Dent. Res. 2017, 96, 555–561. [Google Scholar] [CrossRef]
- Lowry, O.H. Micromethods for the Assay of Enzymes. Methods Enzymol. 1957, 4, 366–381. [Google Scholar] [CrossRef]
- Ruppeka-Rupeika, E.; Hogervorst, J.; Wouters, F.; Schoenmaker, T.; Forouzanfar, T.; de Vries, T.J. Osteogenic and osteoclastogenic potential of jaw bone-derived cells-A case study. J. Cell. Biochem. 2018, 119, 5391–5401. [Google Scholar] [CrossRef]
- Ljusberg, J.; Ek-Rylander, B.; Andersson, G. Tartrate-resistant purple acid phosphatase is synthesized as a latent proenzyme and activated by cysteine proteinases. Biochem. J. 1999, 343 Pt 1, 63–69. [Google Scholar] [CrossRef]
- Kim, N.; Kadono, Y.; Takami, M.; Lee, J.; Lee, S.H.; Okada, F.; Kim, J.H.; Kobayashi, T.; Odgren, P.R.; Nakano, H.; et al. Osteoclast differentiation independent of the TRANCE-RANK-TRAF6 axis. J. Exp. Med. 2005, 202, 589–595. [Google Scholar] [CrossRef]
- Delaisse, J.M.; Andersen, T.L.; Engsig, M.T.; Henriksen, K.; Troen, T.; Blavier, L. Matrix metalloproteinases (MMP) and cathepsin K contribute differently to osteoclastic activities. Microsc. Res. Tech. 2003, 61, 504–513. [Google Scholar] [CrossRef]
- de Vries, T.J.; Schoenmaker, T.; Micha, D.; Hogervorst, J.; Bouskla, S.; Forouzanfar, T.; Pals, G.; Netelenbos, C.; Eekhoff, E.M.W.; Bravenboer, N. Periodontal ligament fibroblasts as a cell model to study osteogenesis and osteoclastogenesis in fibrodysplasia ossificans progressiva. Bone 2018, 109, 168–177. [Google Scholar] [CrossRef]
- Daci, E.; Everts, V.; Torrekens, S.; Van Herck, E.; Tigchelaar-Gutterr, W.; Bouillon, R.; Carmeliet, G. Increased bone formation in mice lacking plasminogen activators. J. Bone Miner. Res. 2003, 18, 1167–1176. [Google Scholar] [CrossRef]
- Everts, V.; Daci, E.; Tigchelaar-Gutter, W.; Hoeben, K.A.; Torrekens, S.; Carmeliet, G.; Beertsen, W. Plasminogen activators are involved in the degradation of bone by osteoclasts. Bone 2008, 43, 915–920. [Google Scholar] [CrossRef]
- Kanno, Y.; Ishisaki, A.; Kawashita, E.; Chosa, N.; Nakajima, K.; Nishihara, T.; Toyoshima, K.; Okada, K.; Ueshima, S.; Matsushita, K.; et al. Plasminogen/plasmin modulates bone metabolism by regulating the osteoblast and osteoclast function. J. Biol. Chem. 2011, 286, 8952–8960. [Google Scholar] [CrossRef]
- Alfonso Garcia, S.L.; Parada-Sanchez, M.T.; Arboleda Toro, D. The phenotype of gingival fibroblasts and their potential use in advanced therapies. Eur. J. Cell Biol. 2020, 99, 151123. [Google Scholar] [CrossRef]
- Florencio-Silva, R.; Sasso, G.R.; Sasso-Cerri, E.; Simoes, M.J.; Cerri, P.S. Biology of Bone Tissue: Structure, Function, and Factors That Influence Bone Cells. Biomed. Res. Int. 2015, 2015, 421746. [Google Scholar] [CrossRef]
- Monterubbianesi, R.; Bencun, M.; Pagella, P.; Woloszyk, A.; Orsini, G.; Mitsiadis, T.A. A comparative in vitro study of the osteogenic and adipogenic potential of human dental pulp stem cells, gingival fibroblasts and foreskin fibroblasts. Sci. Rep. 2019, 9, 1761. [Google Scholar] [CrossRef]
- Bruderer, M.; Richards, R.G.; Alini, M.; Stoddart, M.J. Role and regulation of RUNX2 in osteogenesis. Eur. Cell Mater. 2014, 28, 269–286. [Google Scholar] [CrossRef]
- Kim, J.M.; Lin, C.; Stavre, Z.; Greenblatt, M.B.; Shim, J.H. Osteoblast-Osteoclast Communication and Bone Homeostasis. Cells 2020, 9, 2073. [Google Scholar] [CrossRef]
- Halleen, J.M.; Tiitinen, S.L.; Ylipahkala, H.; Fagerlund, K.M.; Vaananen, H.K. Tartrate-resistant acid phosphatase 5b (TRACP 5b) as a marker of bone resorption. Clin. Lab. 2006, 52, 499–509. [Google Scholar]
- Hodge, J.M.; Kirkland, M.A.; Nicholson, G.C. Multiple roles of M-CSF in human osteoclastogenesis. J. Cell. Biochem. 2007, 102, 759–768. [Google Scholar] [CrossRef]
- Roodman, G.D. Cell biology of the osteoclast. Exp. Hematol. 1999, 27, 1229–1241. [Google Scholar] [CrossRef]
- Sokos, D.; Everts, V.; de Vries, T.J. Role of periodontal ligament fibroblasts in osteoclastogenesis: A review. J. Periodontal. Res. 2015, 50, 152–159. [Google Scholar] [CrossRef]
- Lerner, U.H. Osteoclast formation and resorption. Matrix Biol. 2000, 19, 107–120. [Google Scholar] [CrossRef]
- Bloemen, V.; de Vries, T.J.; Schoenmaker, T.; Everts, V. Intercellular adhesion molecule-1 clusters during osteoclastogenesis. Biochem. Biophys. Res. Commun. 2009, 385, 640–645. [Google Scholar] [CrossRef]
- Sprangers, S.; Schoenmaker, T.; Cao, Y.; Everts, V.; de Vries, T.J. Integrin alphaMbeta2 is differently expressed by subsets of human osteoclast precursors and mediates adhesion of classical monocytes to bone. Exp. Cell Res. 2017, 350, 161–168. [Google Scholar] [CrossRef]
- Khoswanto, C. Role of matrix metalloproteinases in bone regeneration: Narrative review. J. Oral Biol. Craniofac. Res. 2023, 13, 539–543. [Google Scholar] [CrossRef]
- Ota, K.; Quint, P.; Ruan, M.; Pederson, L.; Westendorf, J.J.; Khosla, S.; Oursler, M.J. TGF-beta induces Wnt10b in osteoclasts from female mice to enhance coupling to osteoblasts. Endocrinology 2013, 154, 3745–3752. [Google Scholar] [CrossRef]
- Chiu, Y.H.; Ritchlin, C.T. DC-STAMP: A Key Regulator in Osteoclast Differentiation. J. Cell. Physiol. 2016, 231, 2402–2407. [Google Scholar] [CrossRef]
- Yagi, M.; Miyamoto, T.; Sawatani, Y.; Iwamoto, K.; Hosogane, N.; Fujita, N.; Morita, K.; Ninomiya, K.; Suzuki, T.; Miyamoto, K.; et al. DC-STAMP is essential for cell-cell fusion in osteoclasts and foreign body giant cells. J. Exp. Med. 2005, 202, 345–351. [Google Scholar] [CrossRef]
- Okada, K.; Nishioka, M.; Kaji, H. Roles of fibrinolytic factors in the alterations in bone marrow hematopoietic stem/progenitor cells during bone repair. Inflamm. Regen. 2020, 40, 22. [Google Scholar] [CrossRef] [PubMed]
- Wyganowska-Swiatkowska, M.; Surdacka, A.; Skrzypczak-Jankun, E.; Jankun, J. The plasminogen activation system in periodontal tissue (Review). Int J. Mol. Med. 2014, 33, 763–768. [Google Scholar] [CrossRef] [PubMed]
- Yee, J.A.; Yan, L.; Dominguez, J.C.; Allan, E.H.; Martin, T.J. Plasminogen-dependent activation of latent transforming growth factor beta (TGF beta) by growing cultures of osteoblast-like cells. J. Cell. Physiol. 1993, 157, 528–534. [Google Scholar] [CrossRef] [PubMed]
- Daci, E.; Udagawa, N.; Martin, T.J.; Bouillon, R.; Carmeliet, G. The role of the plasminogen system in bone resorption in vitro. J. Bone Miner. Res. 1999, 14, 946–952. [Google Scholar] [CrossRef] [PubMed]
- Sulniute, R.; Lindh, T.; Wilczynska, M.; Li, J.; Ny, T. Plasmin is essential in preventing periodontitis in mice. Am. J. Pathol. 2011, 179, 819–828. [Google Scholar] [CrossRef] [PubMed]
- Alford, A.I.; Kozloff, K.M.; Hankenson, K.D. Extracellular matrix networks in bone remodeling. Int. J. Biochem. Cell Biol. 2015, 65, 20–31. [Google Scholar] [CrossRef] [PubMed]
- Hwang, M.P.; Subbiah, R.; Kim, I.G.; Lee, K.E.; Park, J.; Kim, S.H.; Park, K. Approximating bone ECM: Crosslinking directs individual and coupled osteoblast/osteoclast behavior. Biomaterials 2016, 103, 22–32. [Google Scholar] [CrossRef]


| Gene | Sequence 5′-3′ | Amplicon Length (bp) | Ensembl Gene ID |
|---|---|---|---|
| β2M | AAgATTCAggTTTACTCACgTC | 293 | ENSG00000166710 |
| TgATgCTgCTTACATgTCTCg | |||
| Osteogenesis | |||
| RUNX2 | ATgCTTCATCgCCTCAC | 156 | ENSG00000124813 |
| ACTgCTTgCAgCCTTAAAT | |||
| COL1A1 | TCCAACgAgATCgAgATCC | 190 | ENSG00000108821 |
| AAgCCgAATTCCTggTCT | |||
| SPARC | TACATCgggCCTTgCAAATAC | 100 | ENST00000231061 |
| AgggTgACCAggACgTTCTTg | |||
| Osteoclastogenesis | |||
| TNFSF11 | CATCCCATCTggTTCCCATAA | 60 | ENSG00000120659 |
| gCCCAACCCCgATCATg | |||
| TNFRSF11B | CTgCgCgCTCgTgTTTC | 100 | ENSG00000164761 |
| ACAgCTgATgAgAggTTTCTTCgT | |||
| ICAM1 | TgAgCAATgTgCAAgAAgATAgC | 104 | ENSG00000090339 |
| CCCgTTCTggAgTCCAgTACA | |||
| CSF1 | CCgAggAggTgTCggAgTAC | 100 | ENSG00000184371 |
| AATTTggCACgAggTCTCCAT | |||
| MMP2 | |||
| TGFB1 | CACCCgCgTgCTAATggT | ||
| CTCggAgCTCTgATgTgTTgAA | |||
| DCSTAMP | ATTTTCTCAgTgAgCAAgCAgTTTC | 101 | ENSG0000016493 |
| AgAATCATggATAATATCTTgAgTTCCTT | |||
| ACP5 | CACAATCTgCAgTACCTgCAAgAT | 128 | ENSG00000102575 |
| CCCATAgTggAAgCgCAgATA | |||
| Fibrinolysis | |||
| PLAT | CggACTggACggAgTgTgA | 104 | ENSG00000104368 |
| TggATgggTACAgTCTgACATgA | |||
| PLAU | TggAACTCTgCCACTgTCCTT | 100 | ENSG00000122861 |
| TTgTCTgggTTCCTgCAgTAATT | |||
| PLAUR | ATCggACTggCTTgAAgATCA | 101 | ENSG00000011422 |
| ggCTTCgggAATAggTgACA |
Disclaimer/Publisher’s Note: The statements, opinions and data contained in all publications are solely those of the individual author(s) and contributor(s) and not of MDPI and/or the editor(s). MDPI and/or the editor(s) disclaim responsibility for any injury to people or property resulting from any ideas, methods, instructions or products referred to in the content. |
© 2024 by the authors. Licensee MDPI, Basel, Switzerland. This article is an open access article distributed under the terms and conditions of the Creative Commons Attribution (CC BY) license (https://creativecommons.org/licenses/by/4.0/).
Share and Cite
Ceylan, M.; Schoenmaker, T.; Hogervorst, J.M.A.; Jansen, I.D.C.; Schimmel, I.M.; Prins, C.M.; Laine, M.L.; de Vries, T.J. Osteogenic Differentiation of Human Gingival Fibroblasts Inhibits Osteoclast Formation. Cells 2024, 13, 1090. https://doi.org/10.3390/cells13131090
Ceylan M, Schoenmaker T, Hogervorst JMA, Jansen IDC, Schimmel IM, Prins CM, Laine ML, de Vries TJ. Osteogenic Differentiation of Human Gingival Fibroblasts Inhibits Osteoclast Formation. Cells. 2024; 13(13):1090. https://doi.org/10.3390/cells13131090
Chicago/Turabian StyleCeylan, Merve, Ton Schoenmaker, Jolanda M. A. Hogervorst, Ineke D. C. Jansen, Irene M. Schimmel, Caya M. Prins, Marja L. Laine, and Teun J. de Vries. 2024. "Osteogenic Differentiation of Human Gingival Fibroblasts Inhibits Osteoclast Formation" Cells 13, no. 13: 1090. https://doi.org/10.3390/cells13131090
APA StyleCeylan, M., Schoenmaker, T., Hogervorst, J. M. A., Jansen, I. D. C., Schimmel, I. M., Prins, C. M., Laine, M. L., & de Vries, T. J. (2024). Osteogenic Differentiation of Human Gingival Fibroblasts Inhibits Osteoclast Formation. Cells, 13(13), 1090. https://doi.org/10.3390/cells13131090