
Fluid and Bubble Flow Detach Adherent Cancer Cells to Form Spheroids on a Random Positioning Machine

 ,
,  ,
,  ,
,  , , ,
, , , 

Abstract
:1. Introduction
2. Materials and Methods
2.1. Cell Lines and Cell Culture
2.2. Rotating Cell Cultures
2.3. Orbital Shaker Cell Cultures (FTC-133)
2.4. Flow Channel Cell Cultures (FTC-133)
2.5. Serum Starvation and Pharmaceutical Treatment (FTC-133)
2.6. Phase Contrast Microscopy
2.7. Cell Tracking and Migration Analysis (FTC-133)
2.8. Immunofluorescence Microscopy (FTC-133)
2.9. Immunofluorescence Analysis
2.10. mRNA Isolation and Quantitative Real-Time PCR (FTC-133)
2.11. Statistical Analysis
3. Results
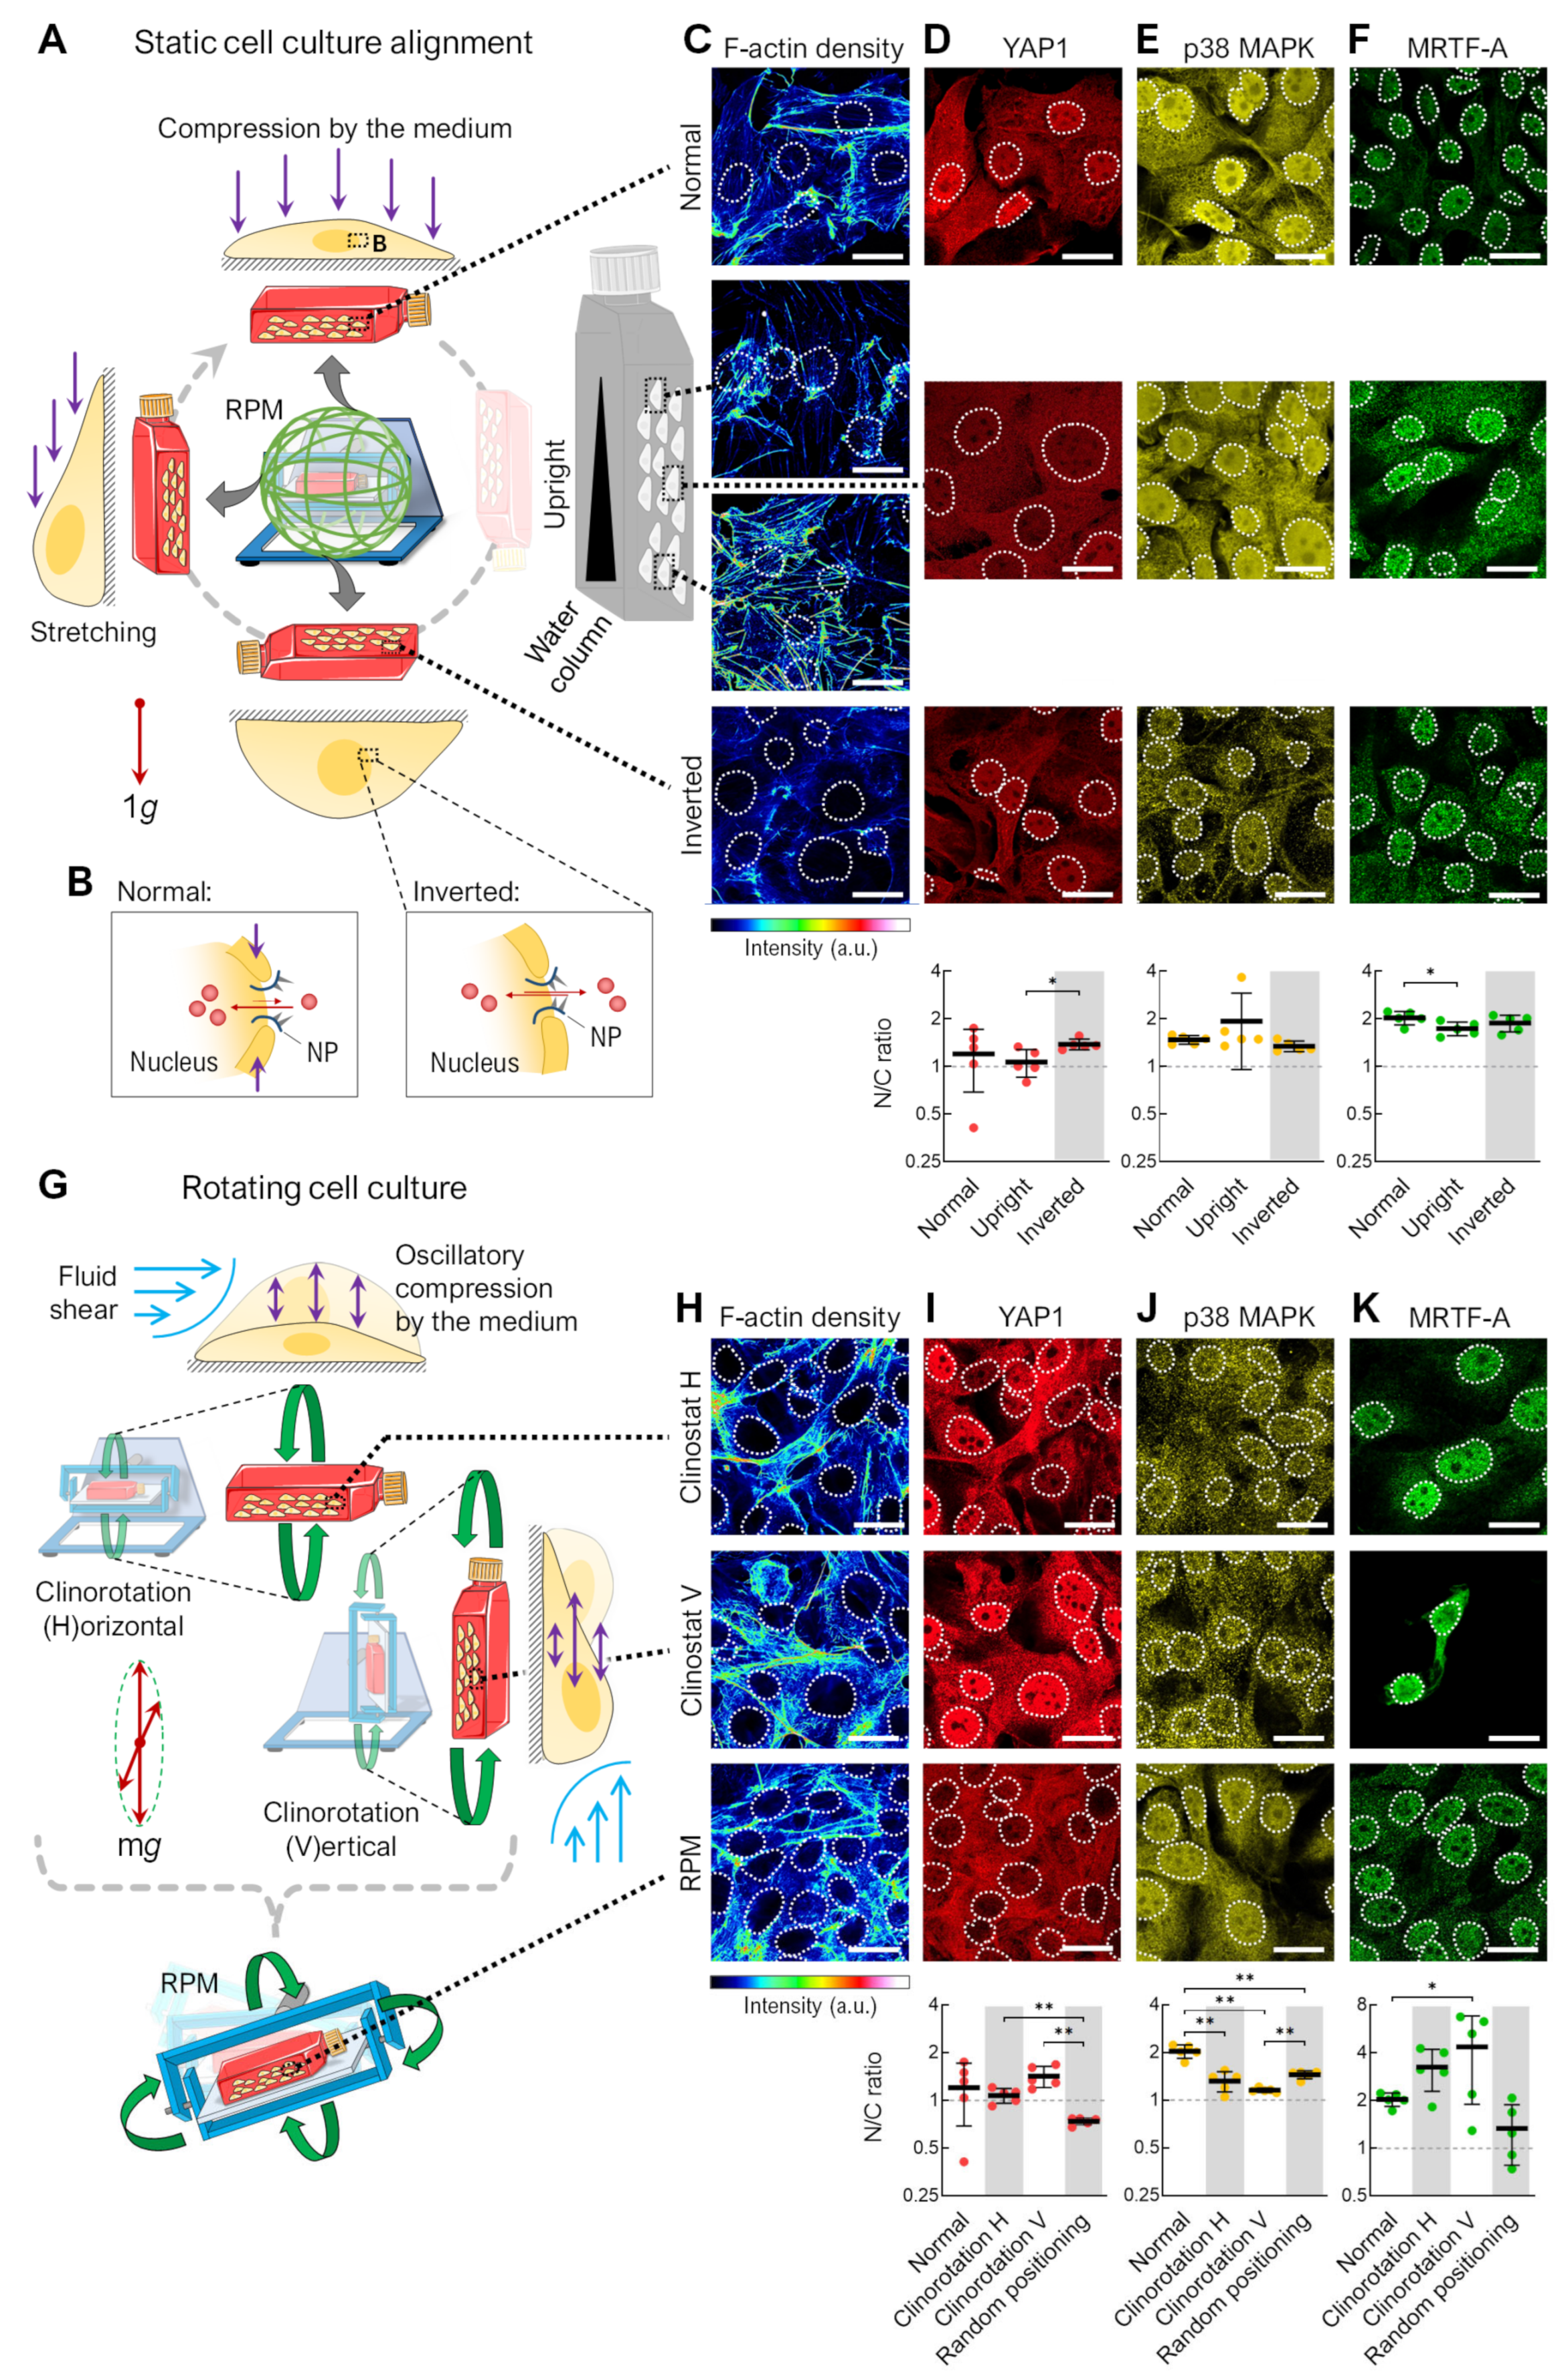
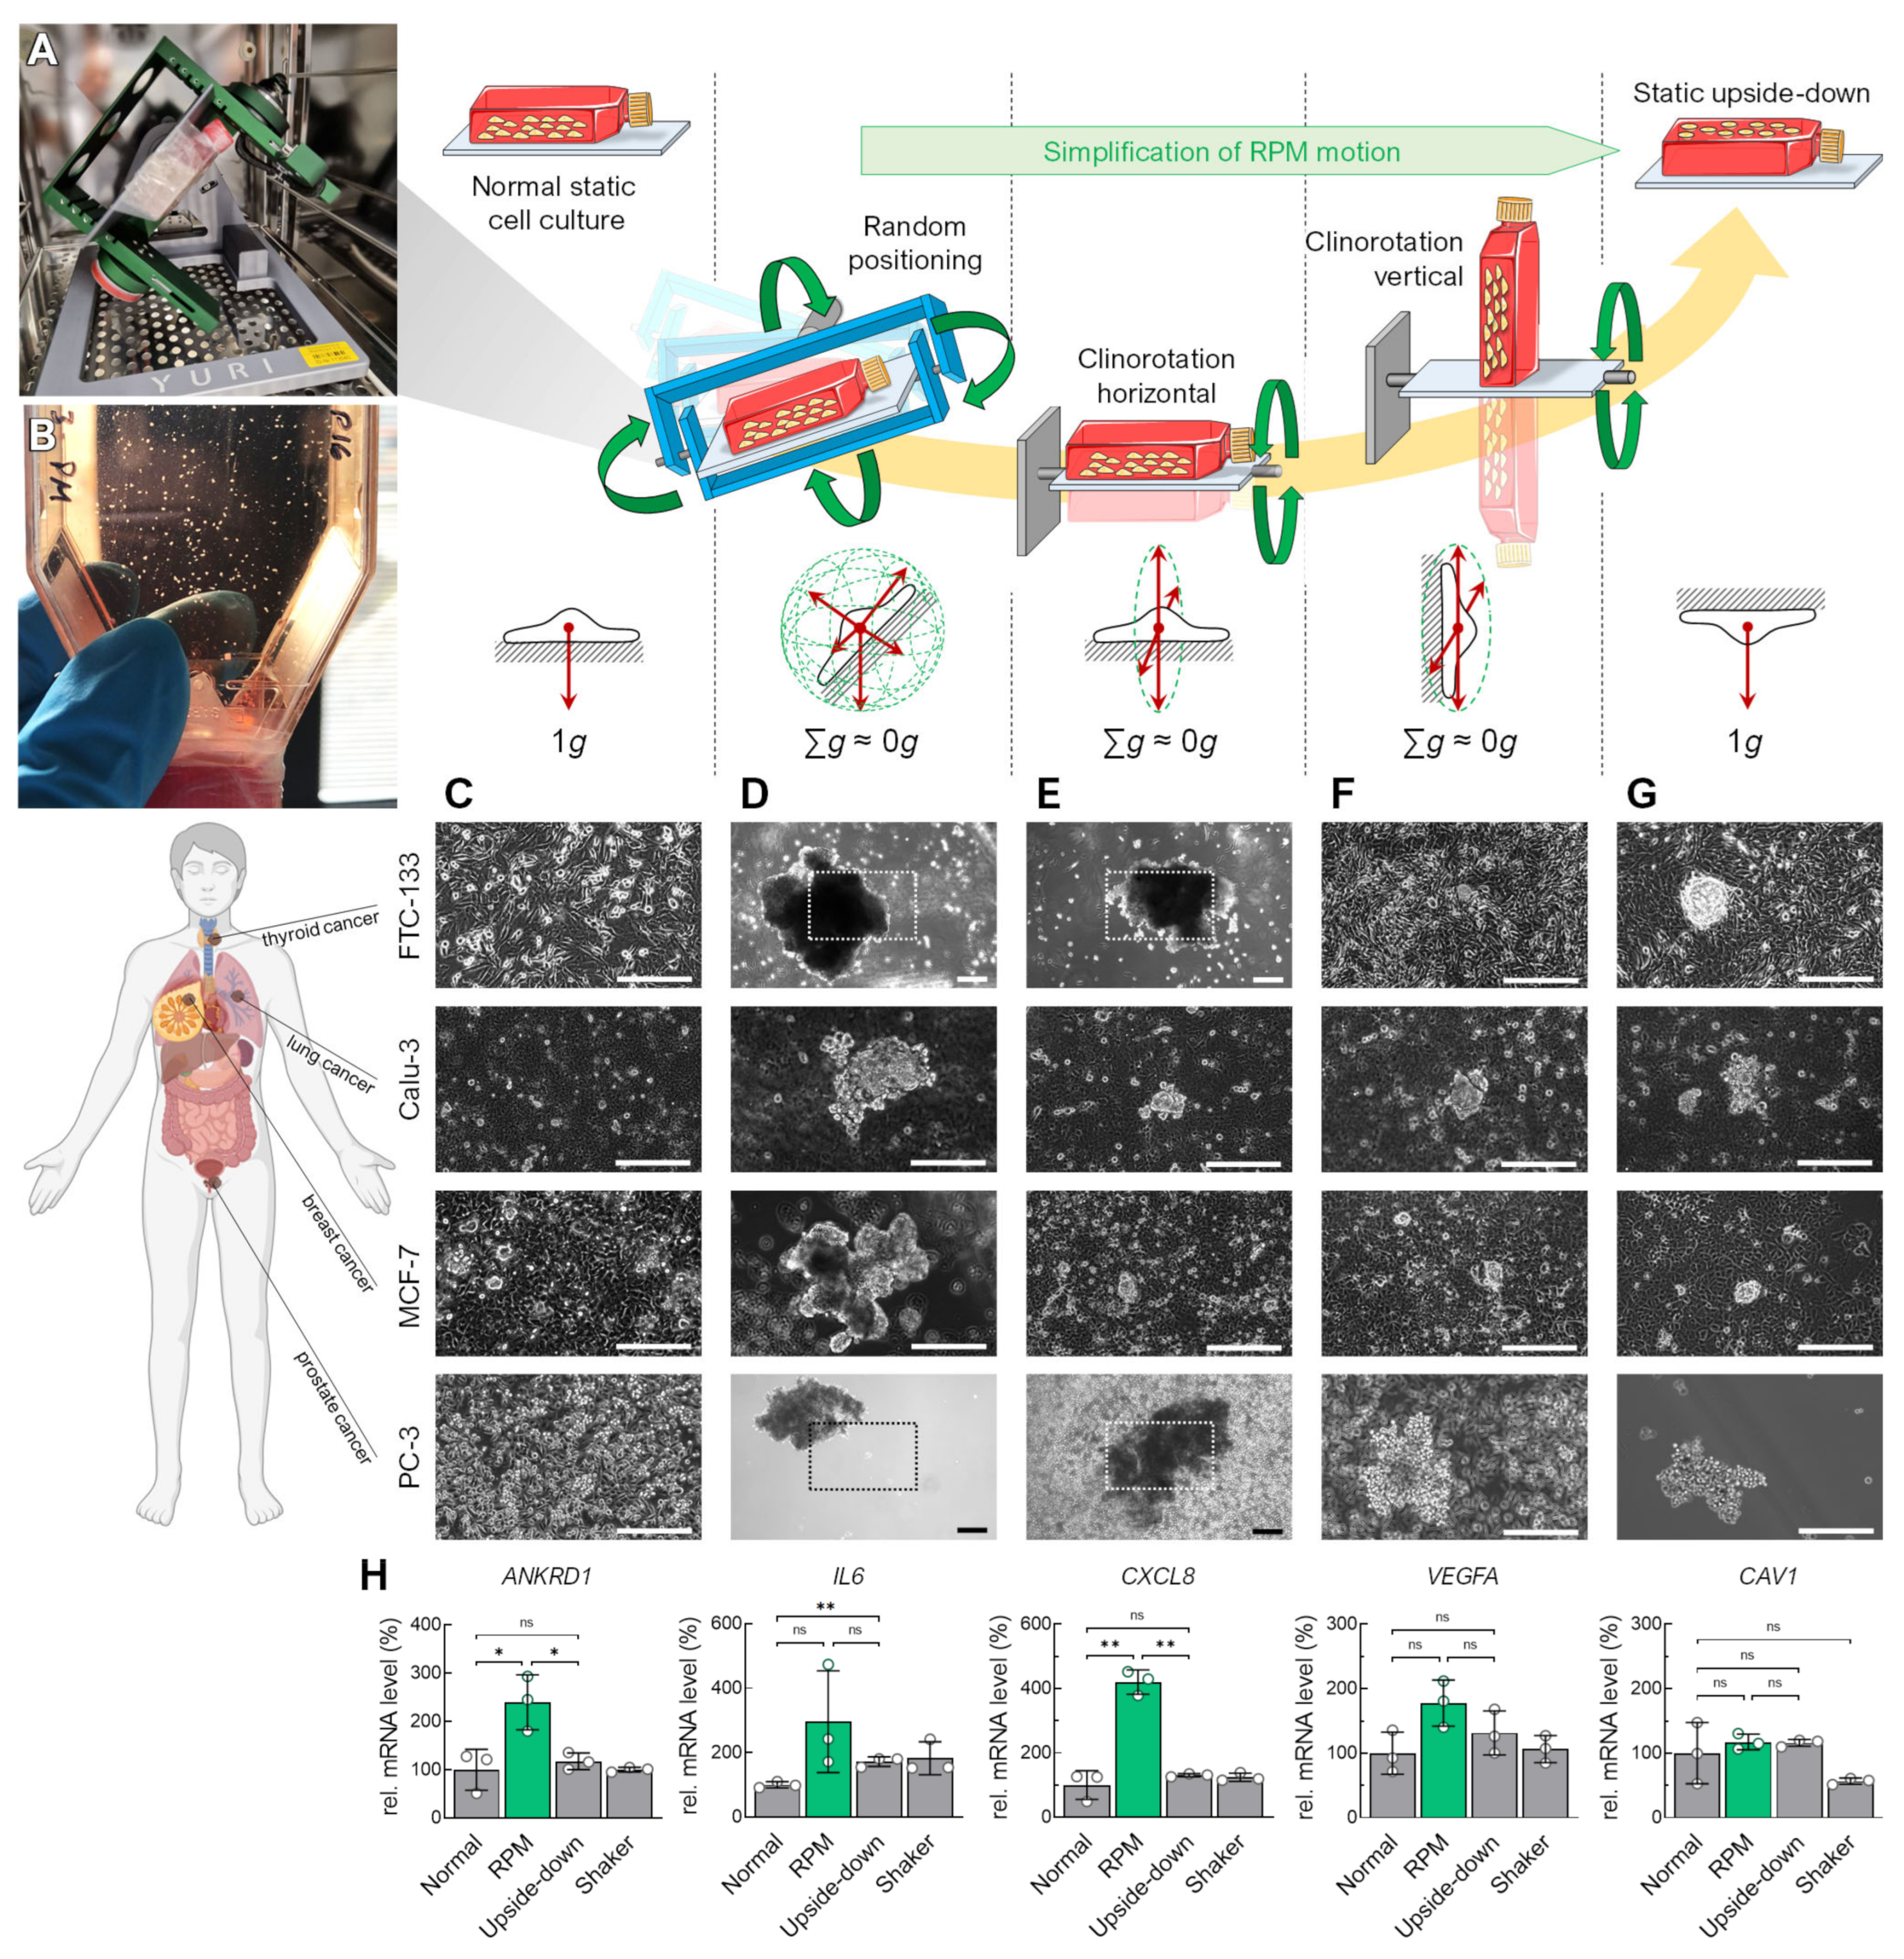
3.1. Alteration of the Gravity Vector
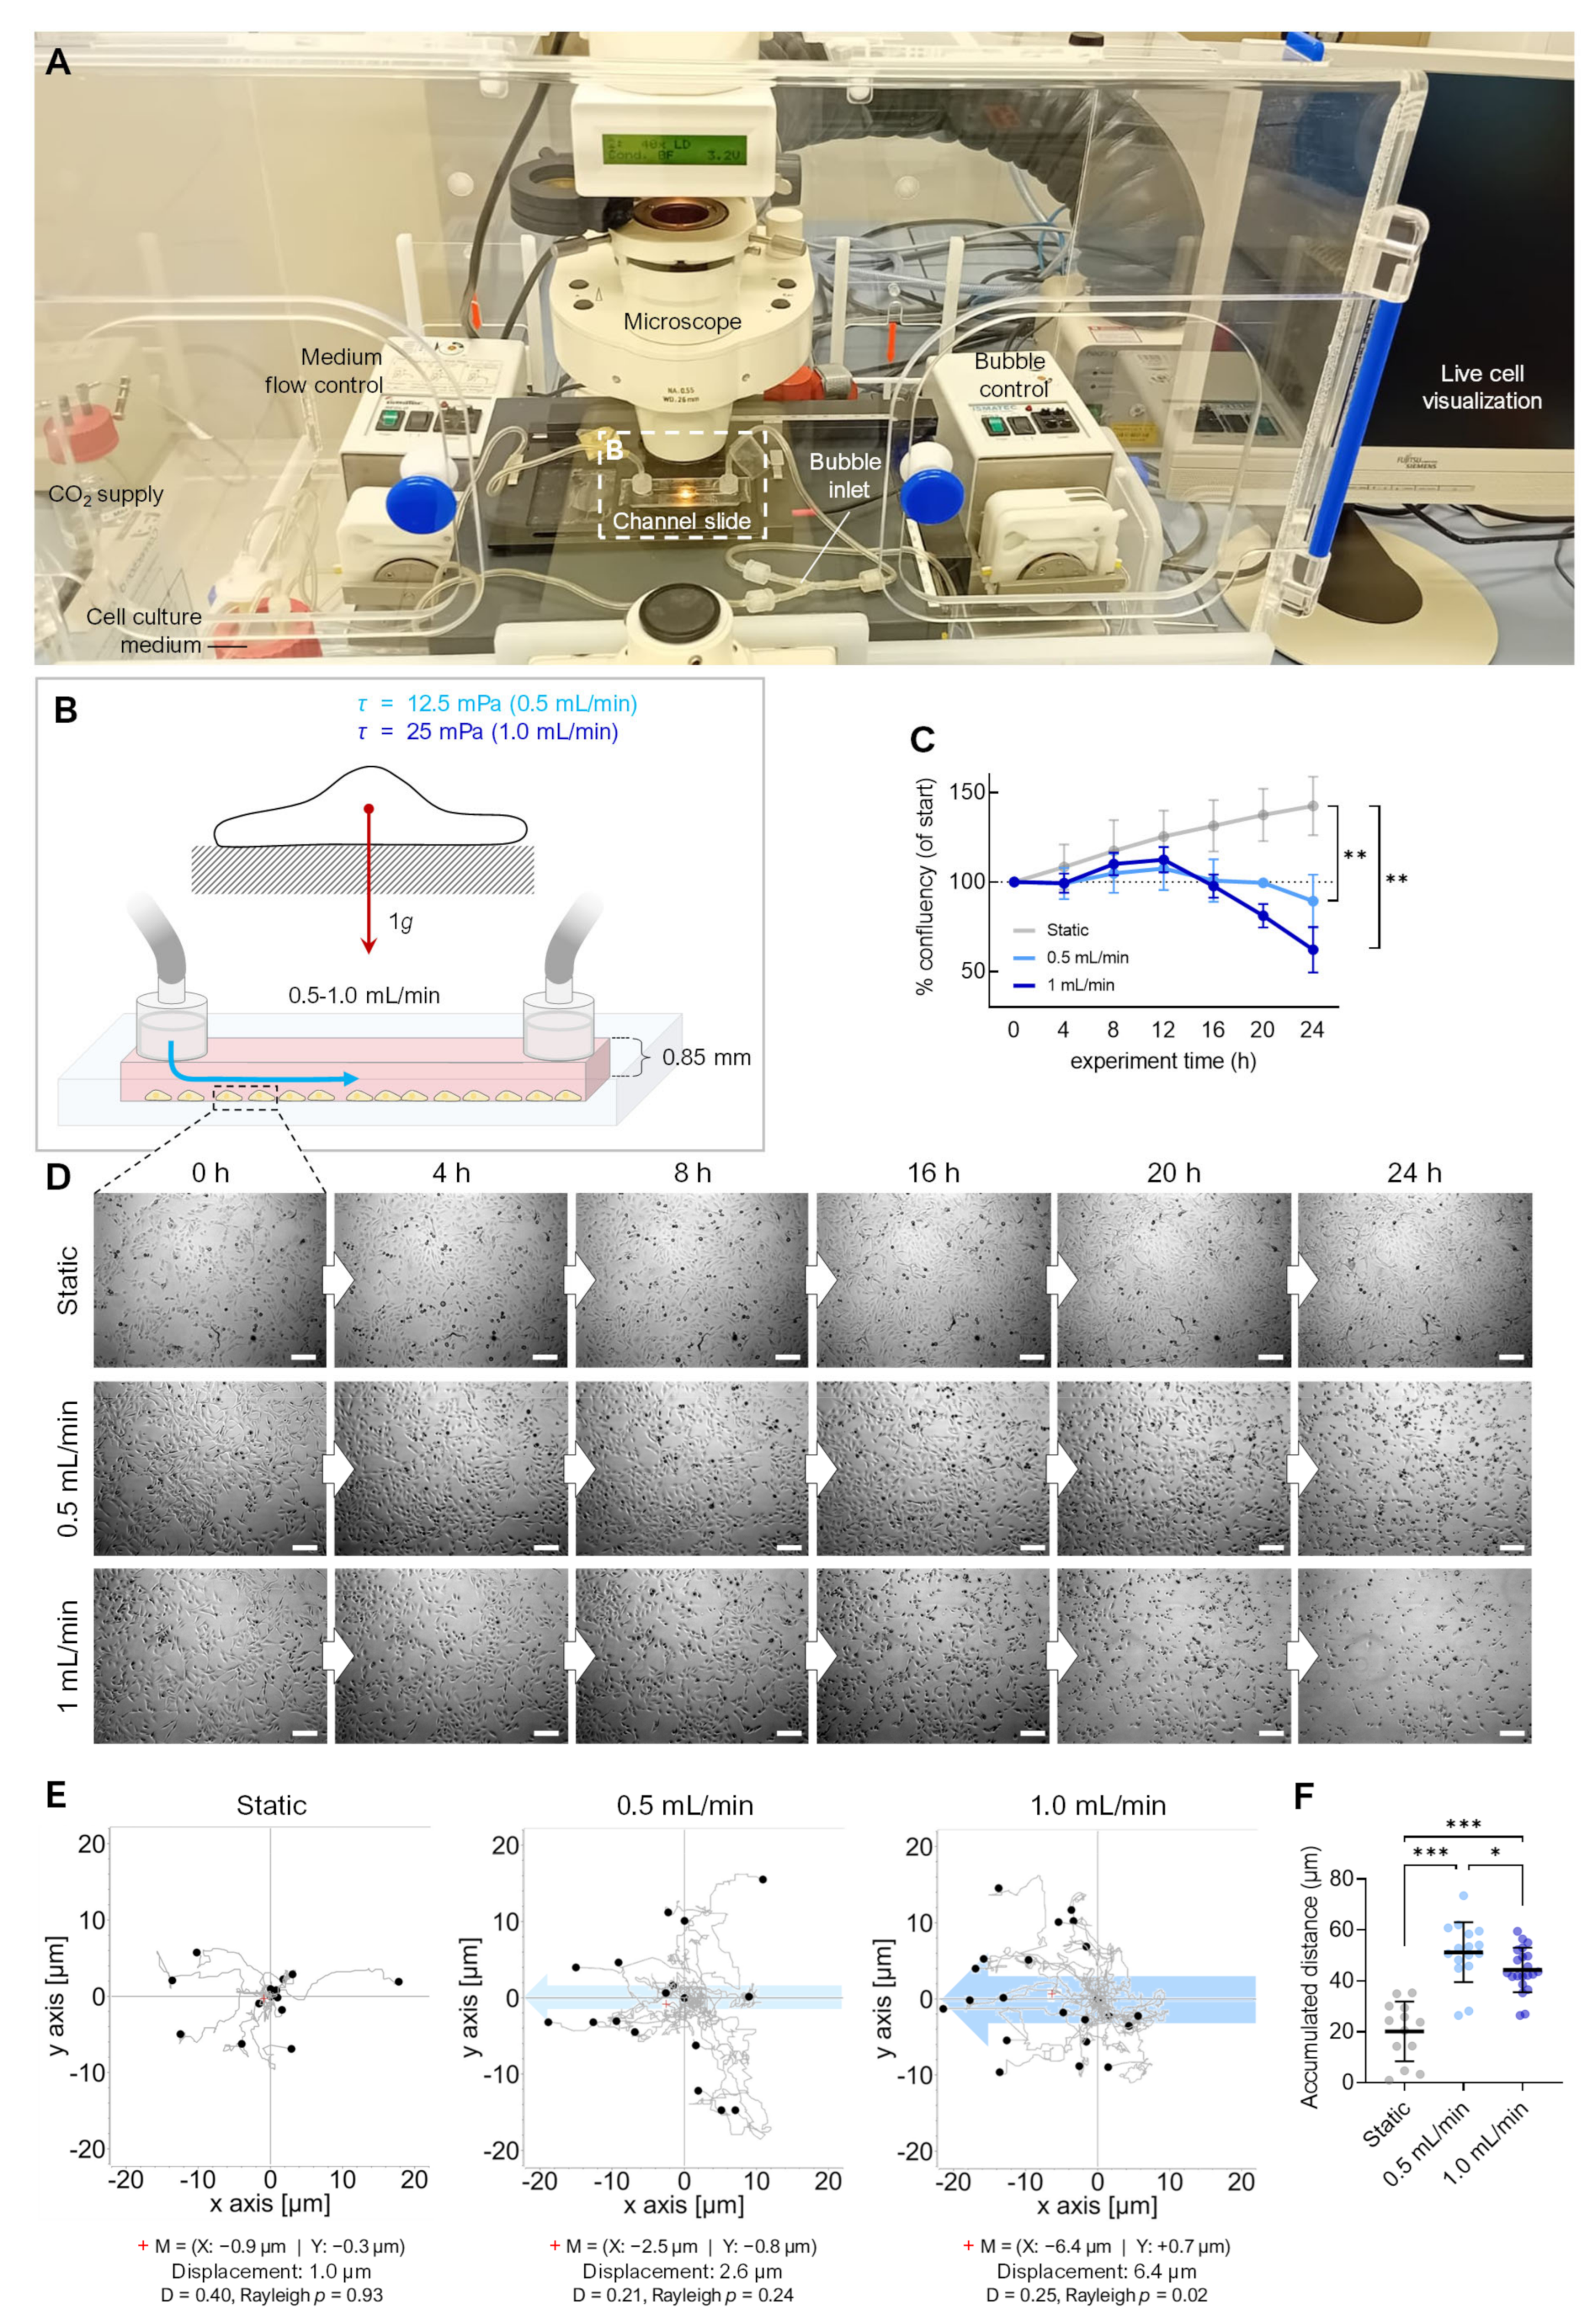
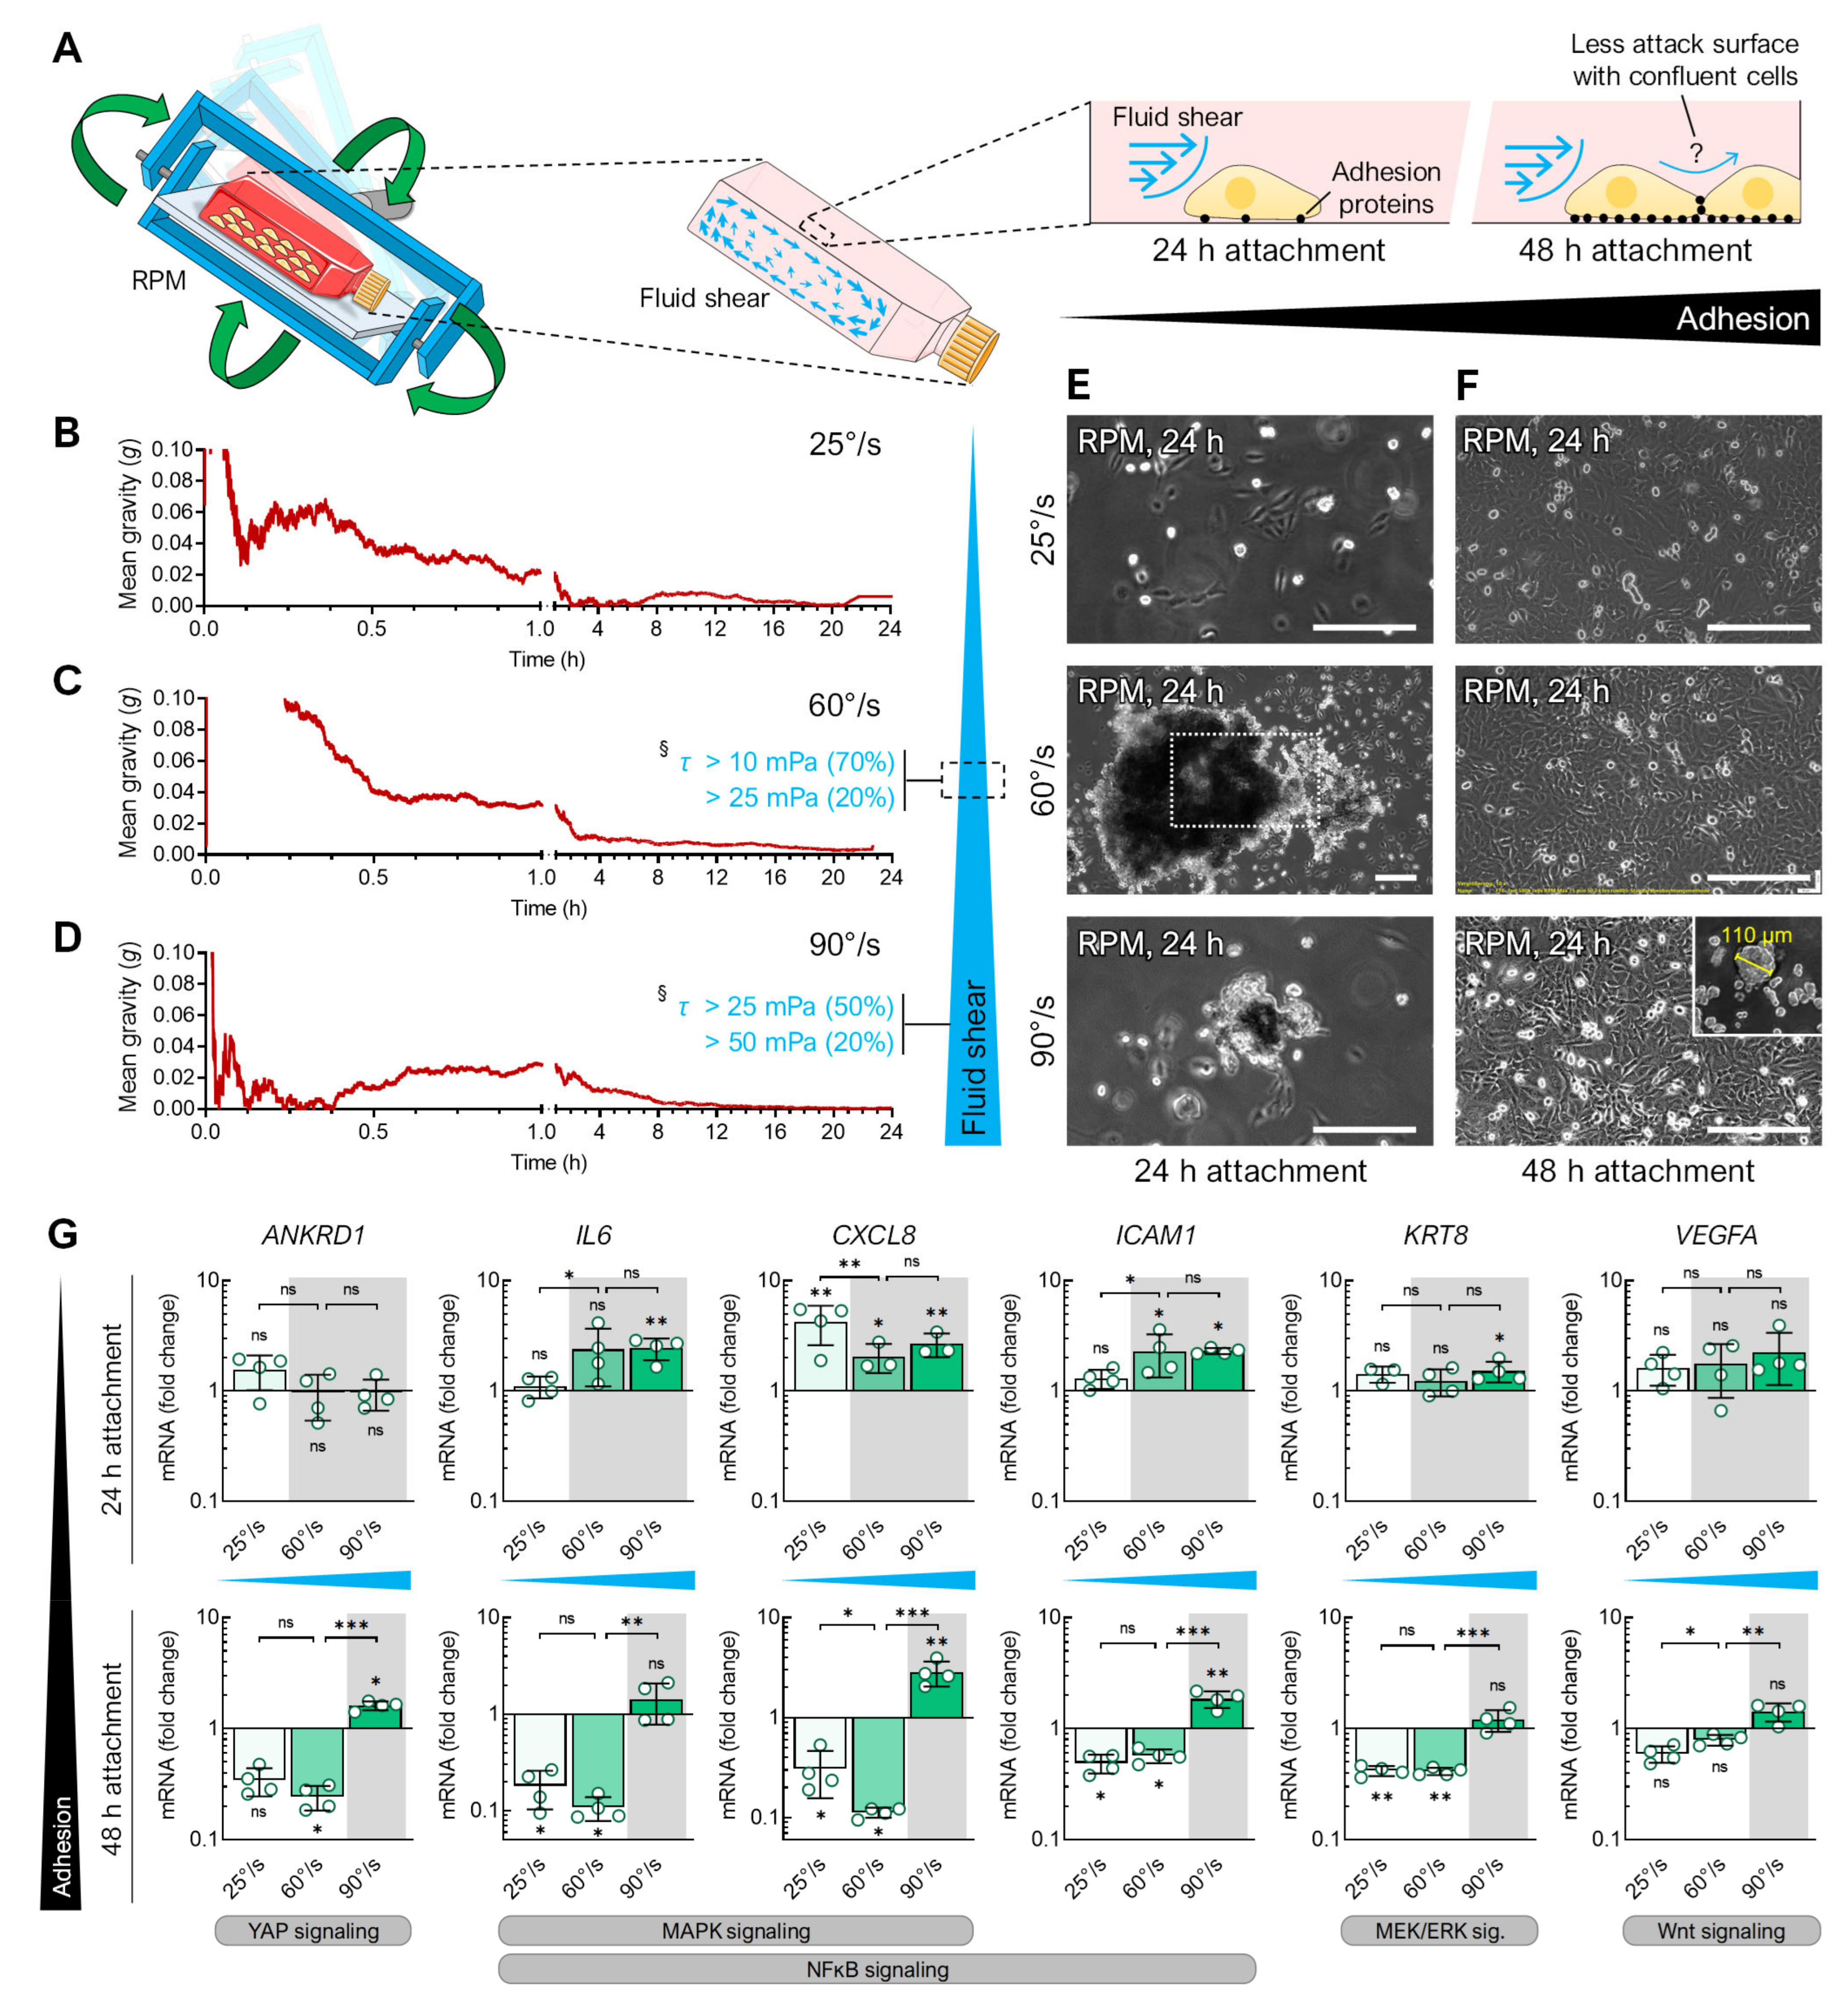
3.2. Fluid Shear
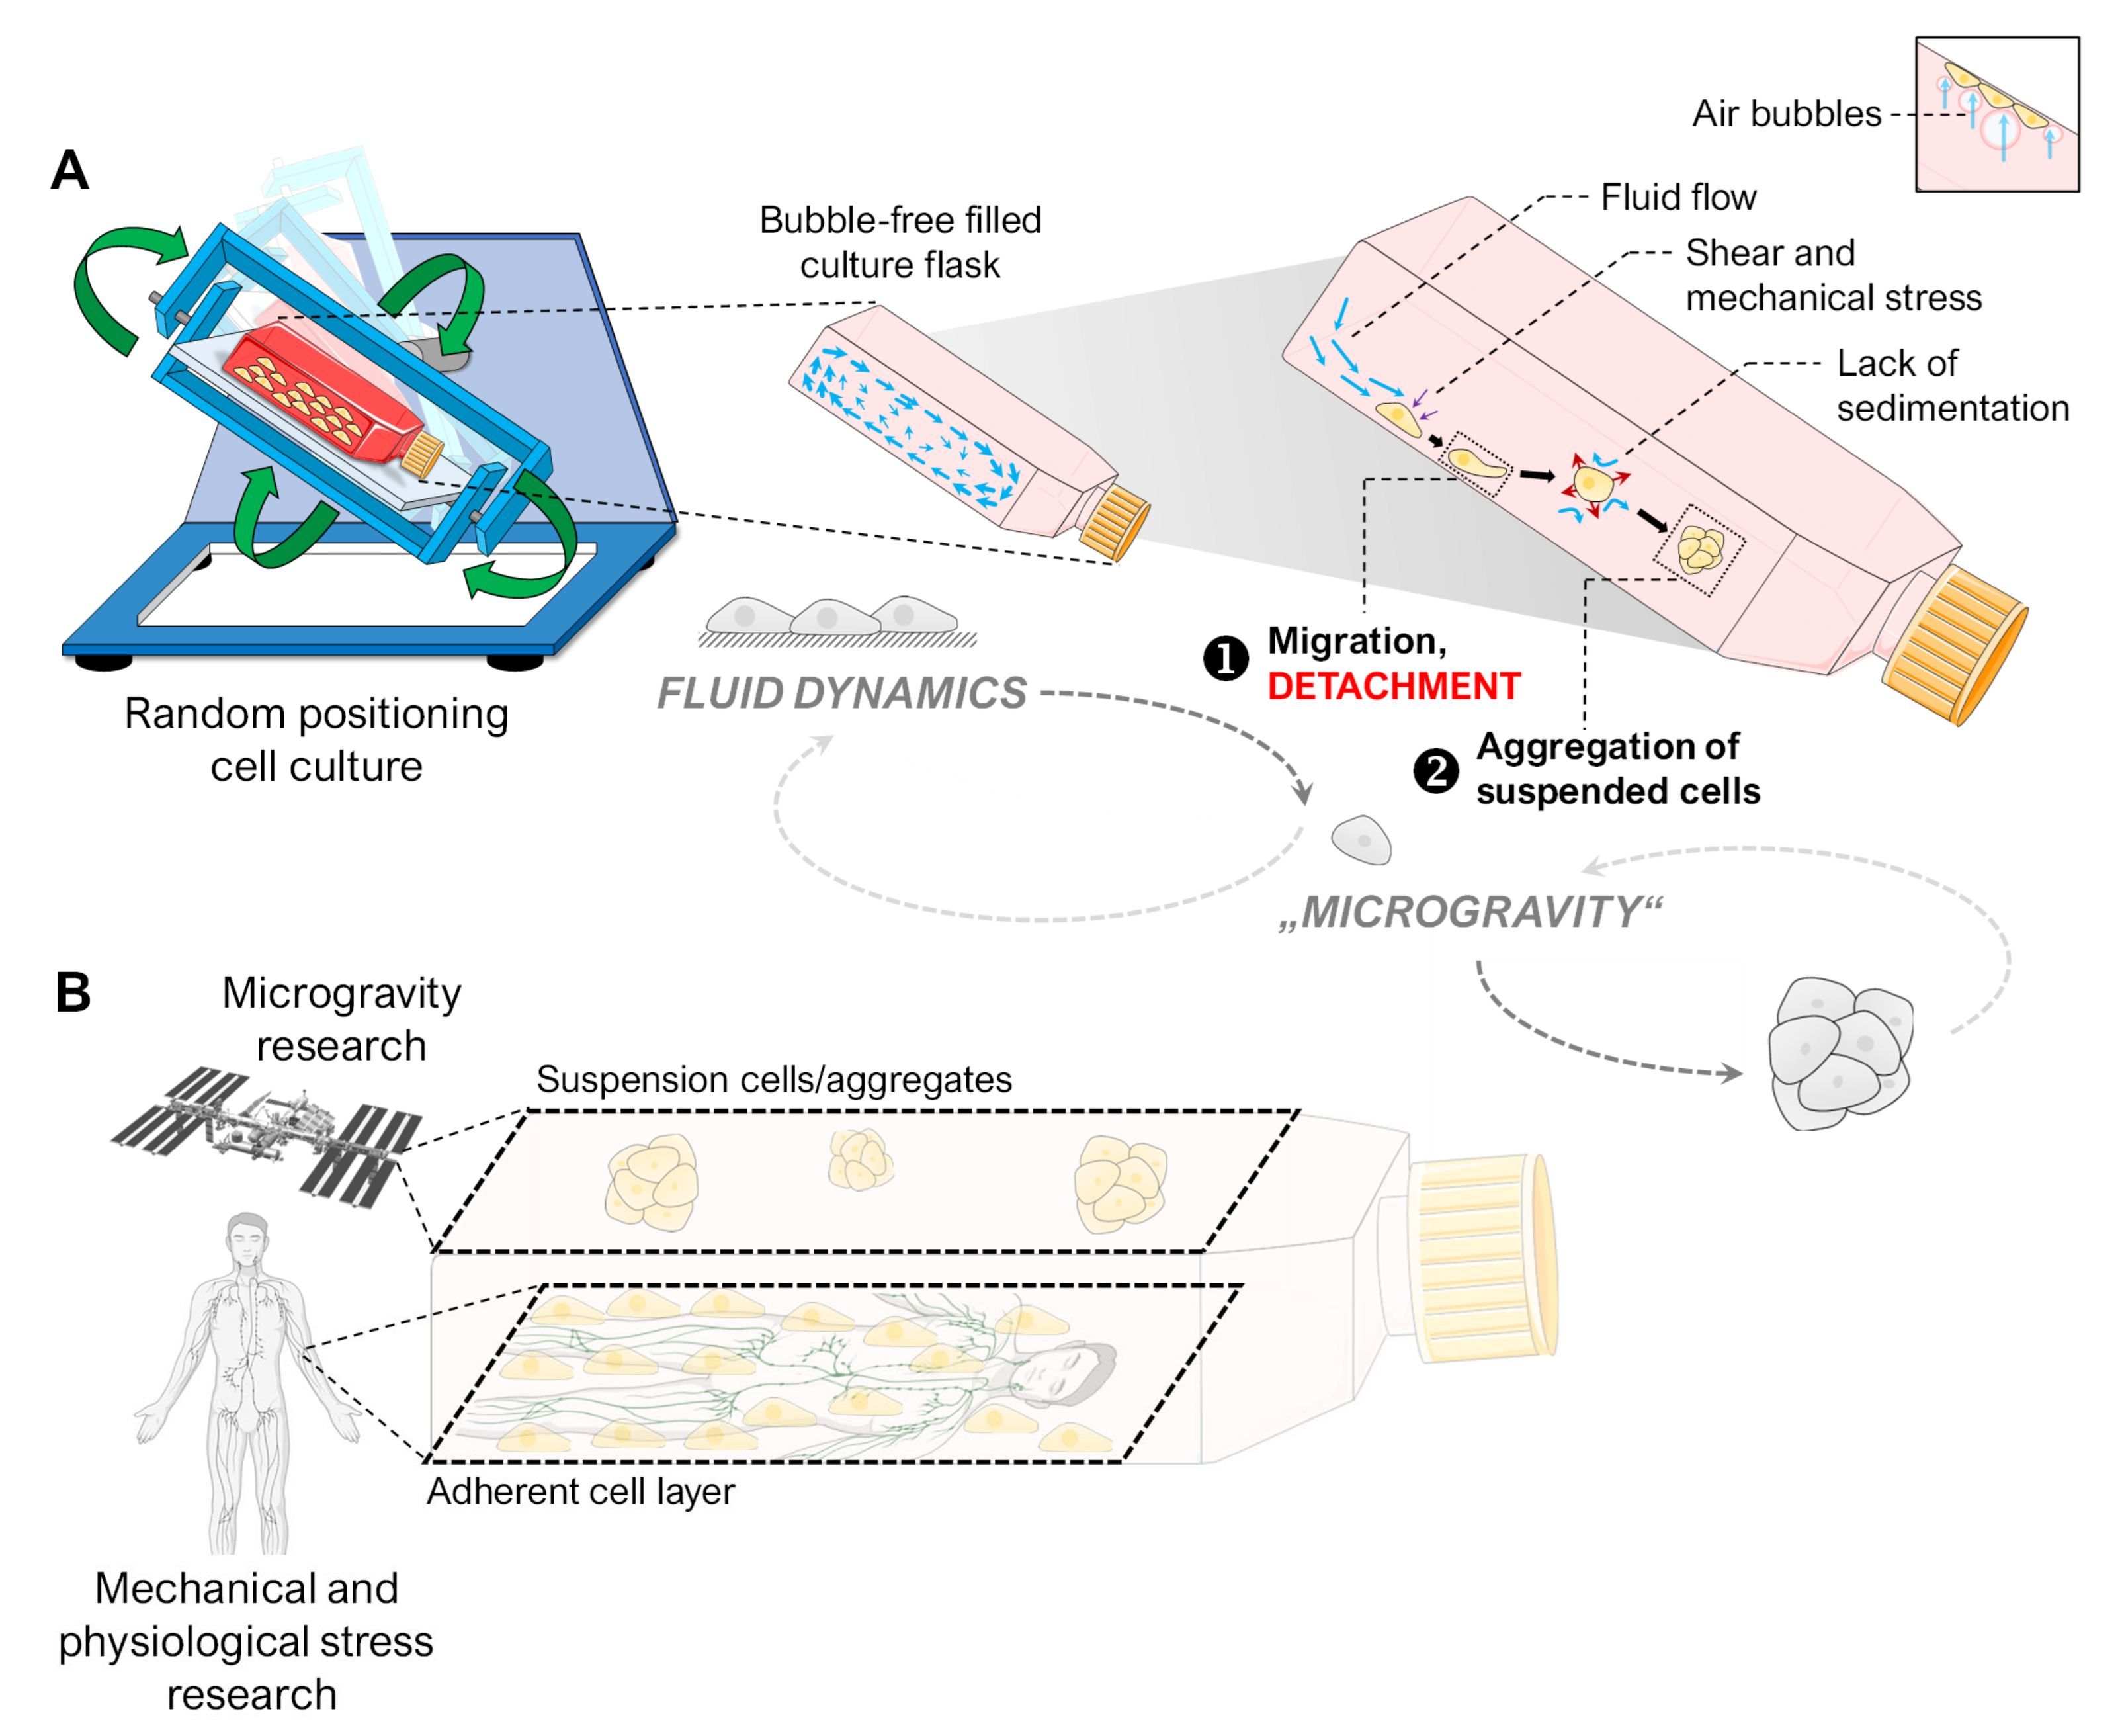
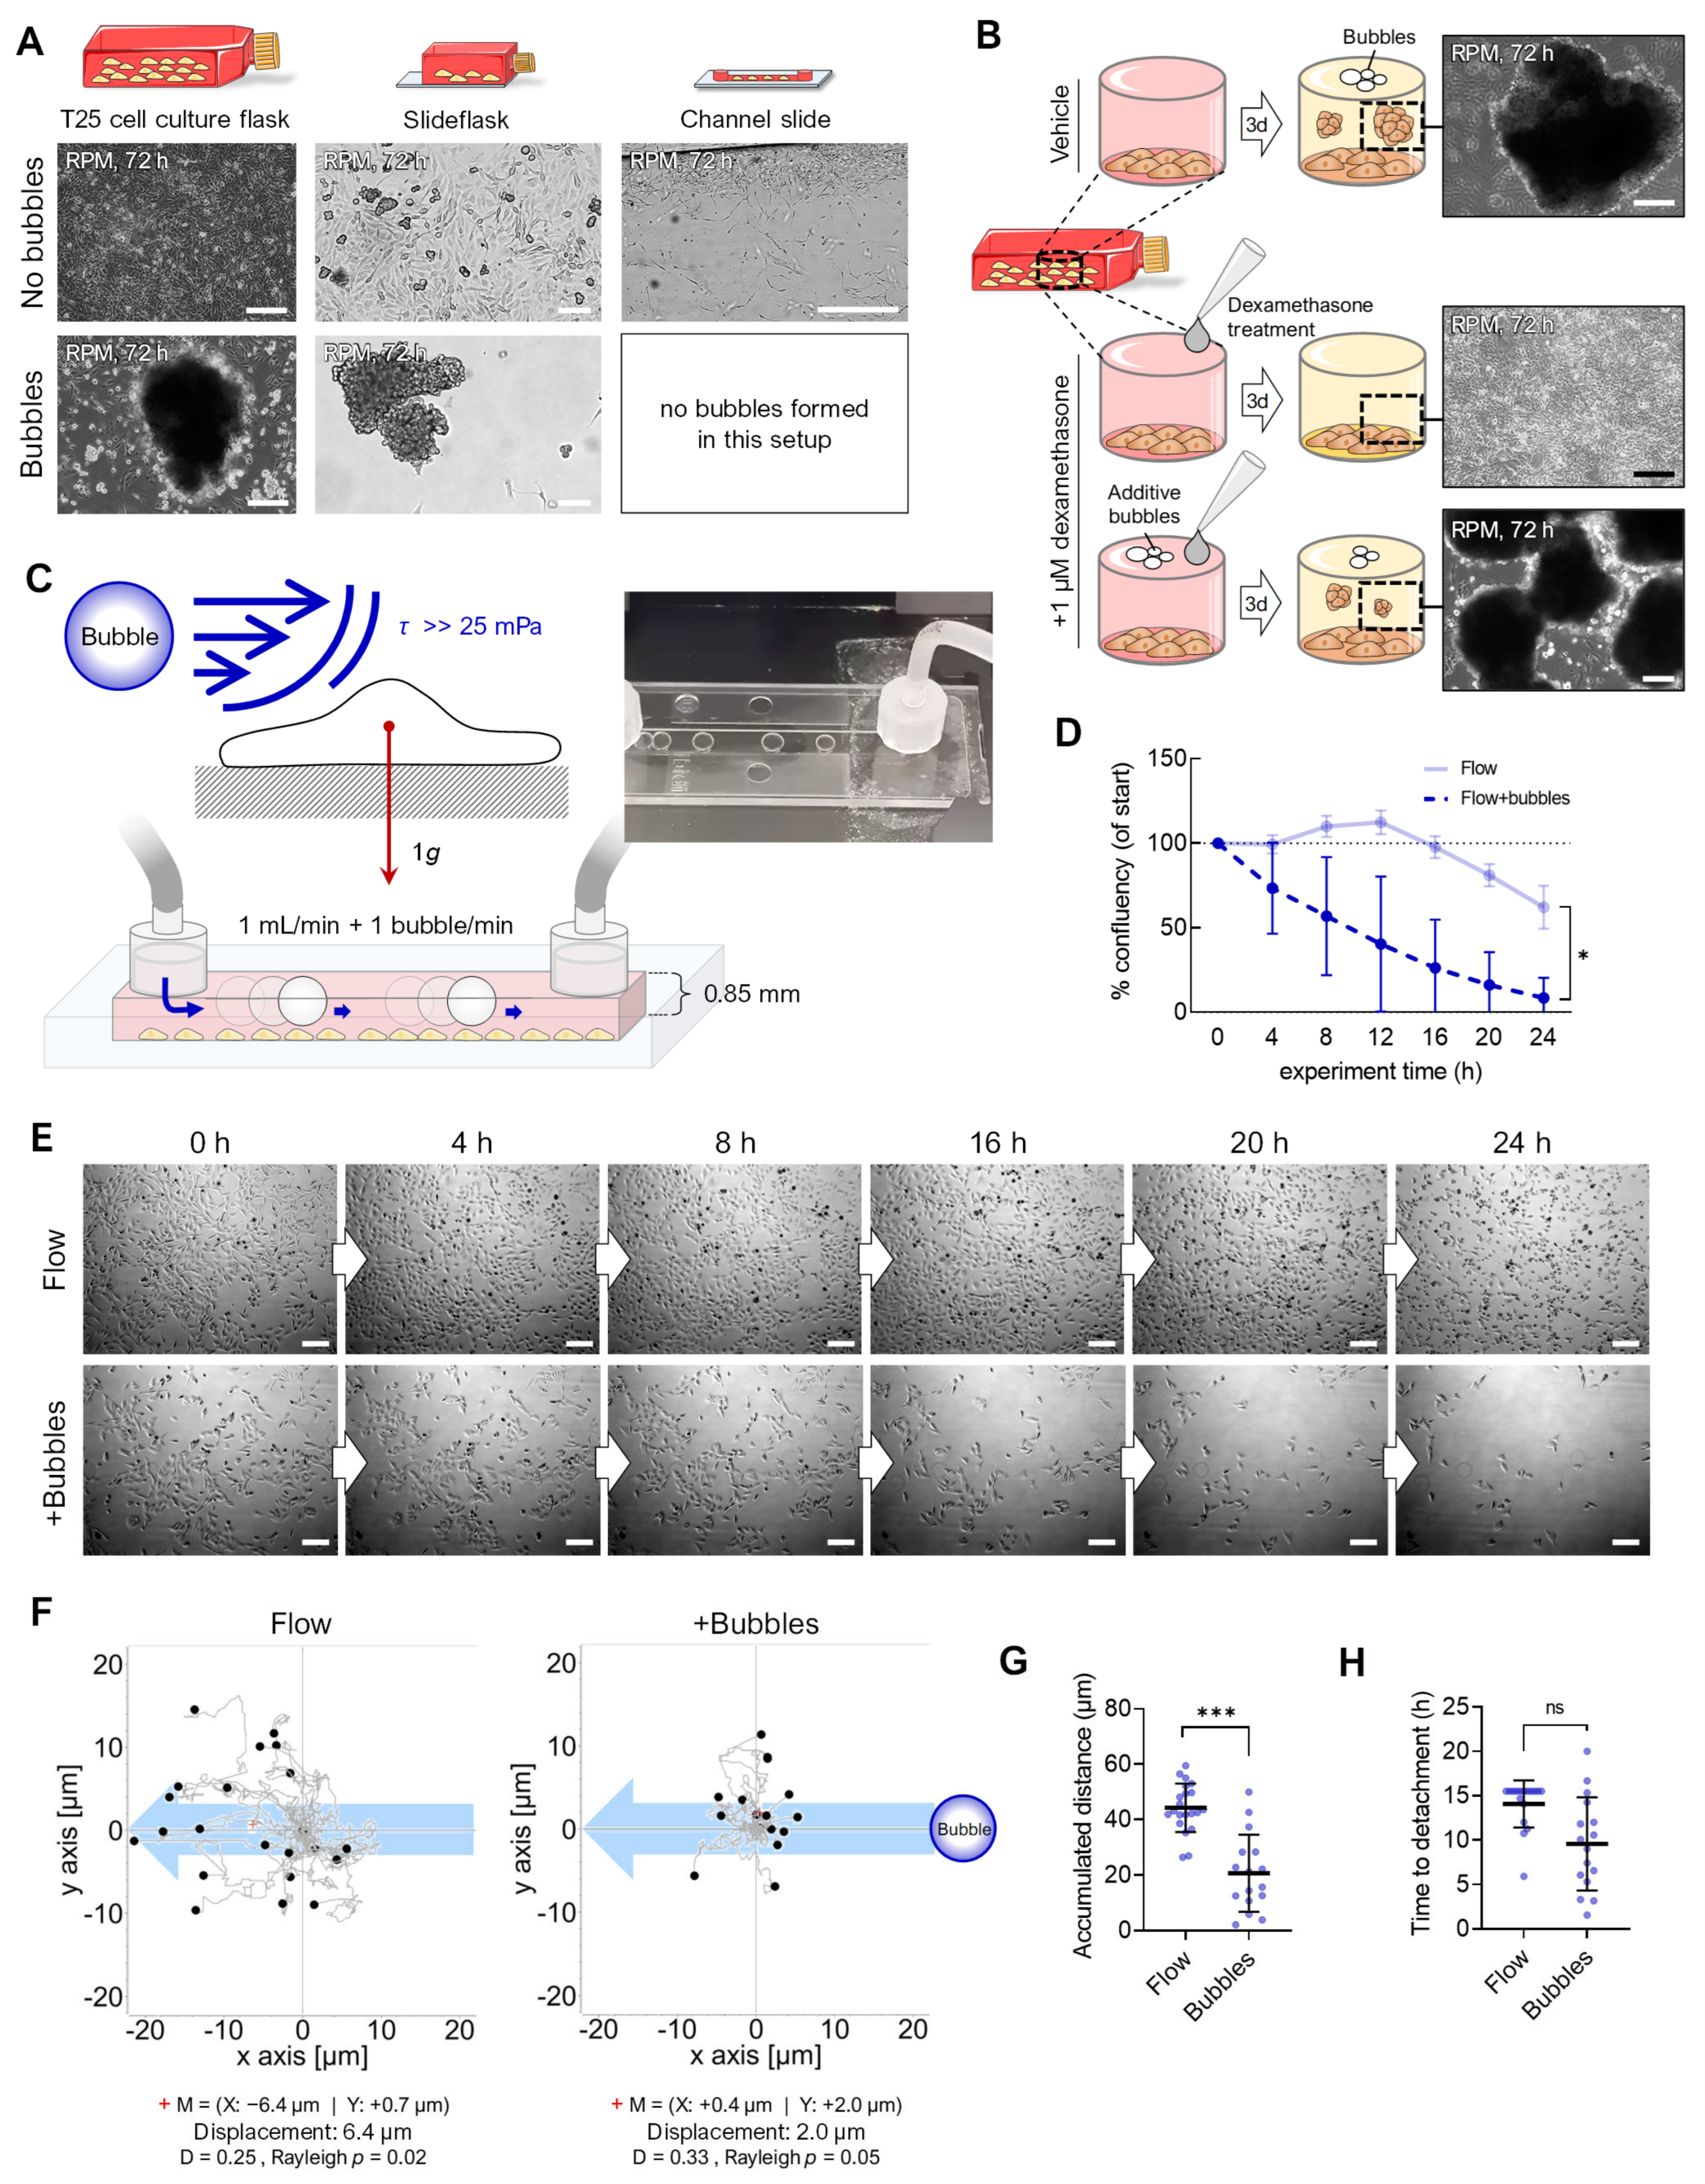
3.3. Air Bubbles
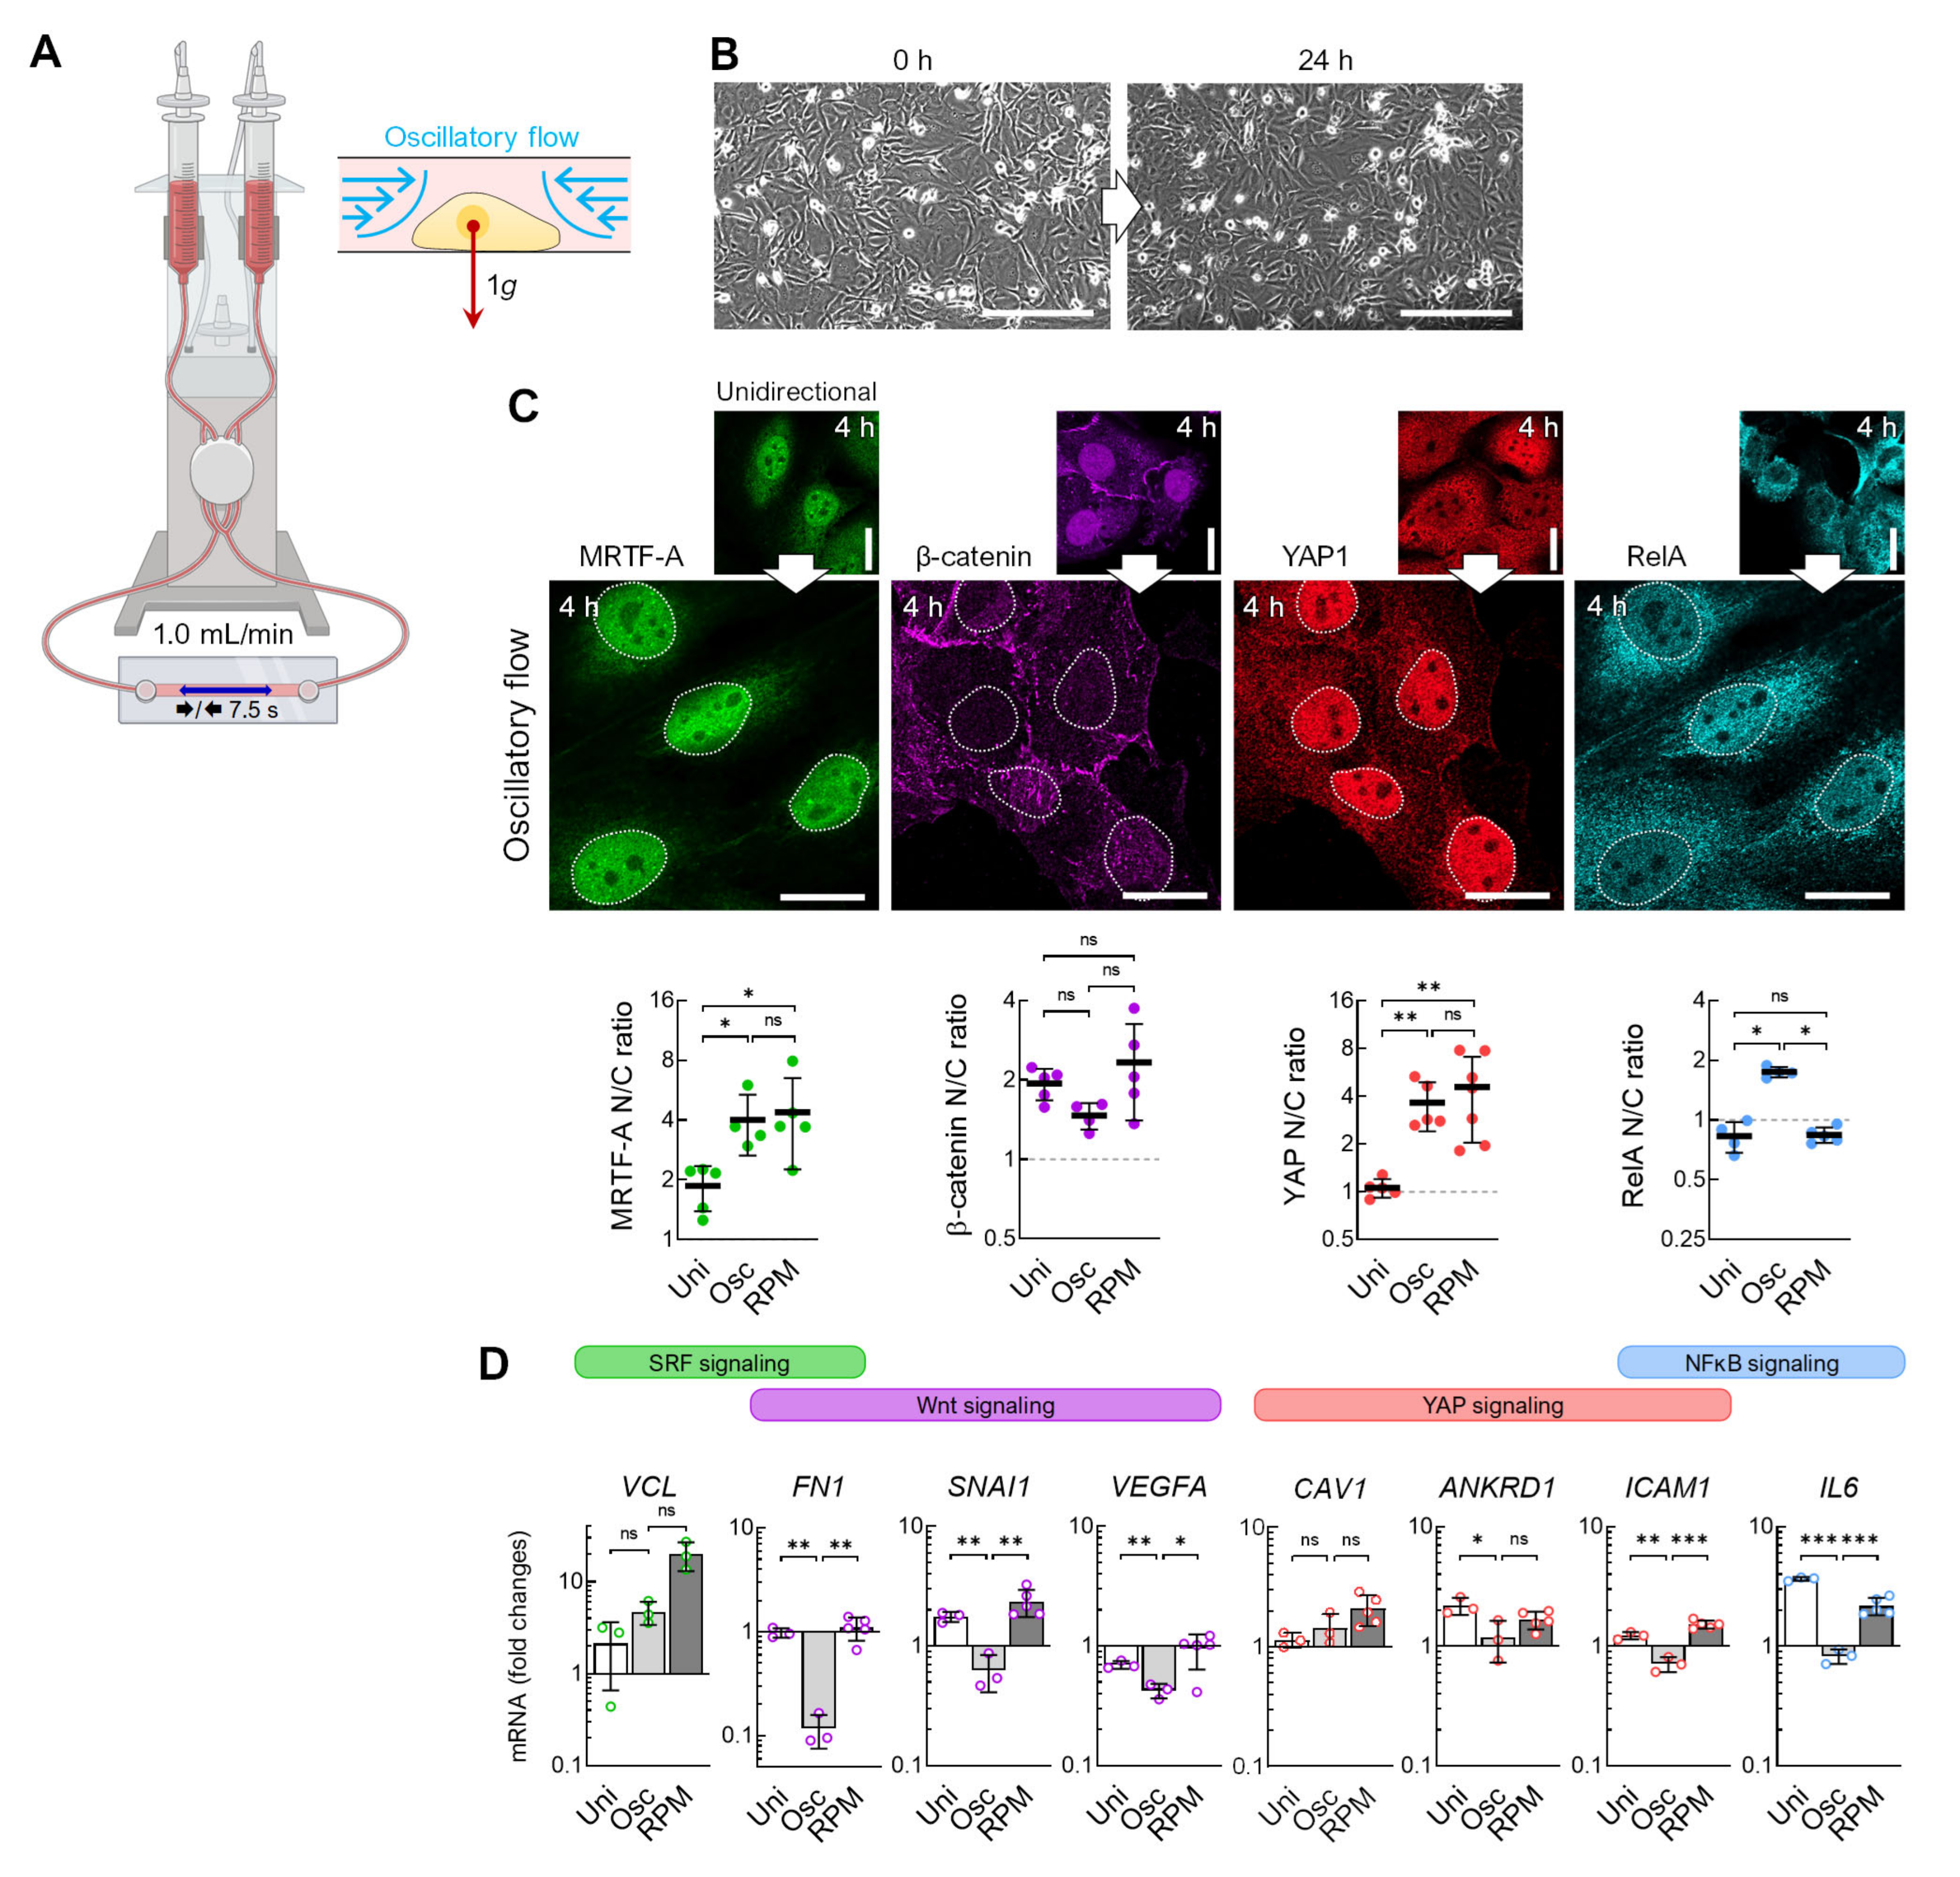
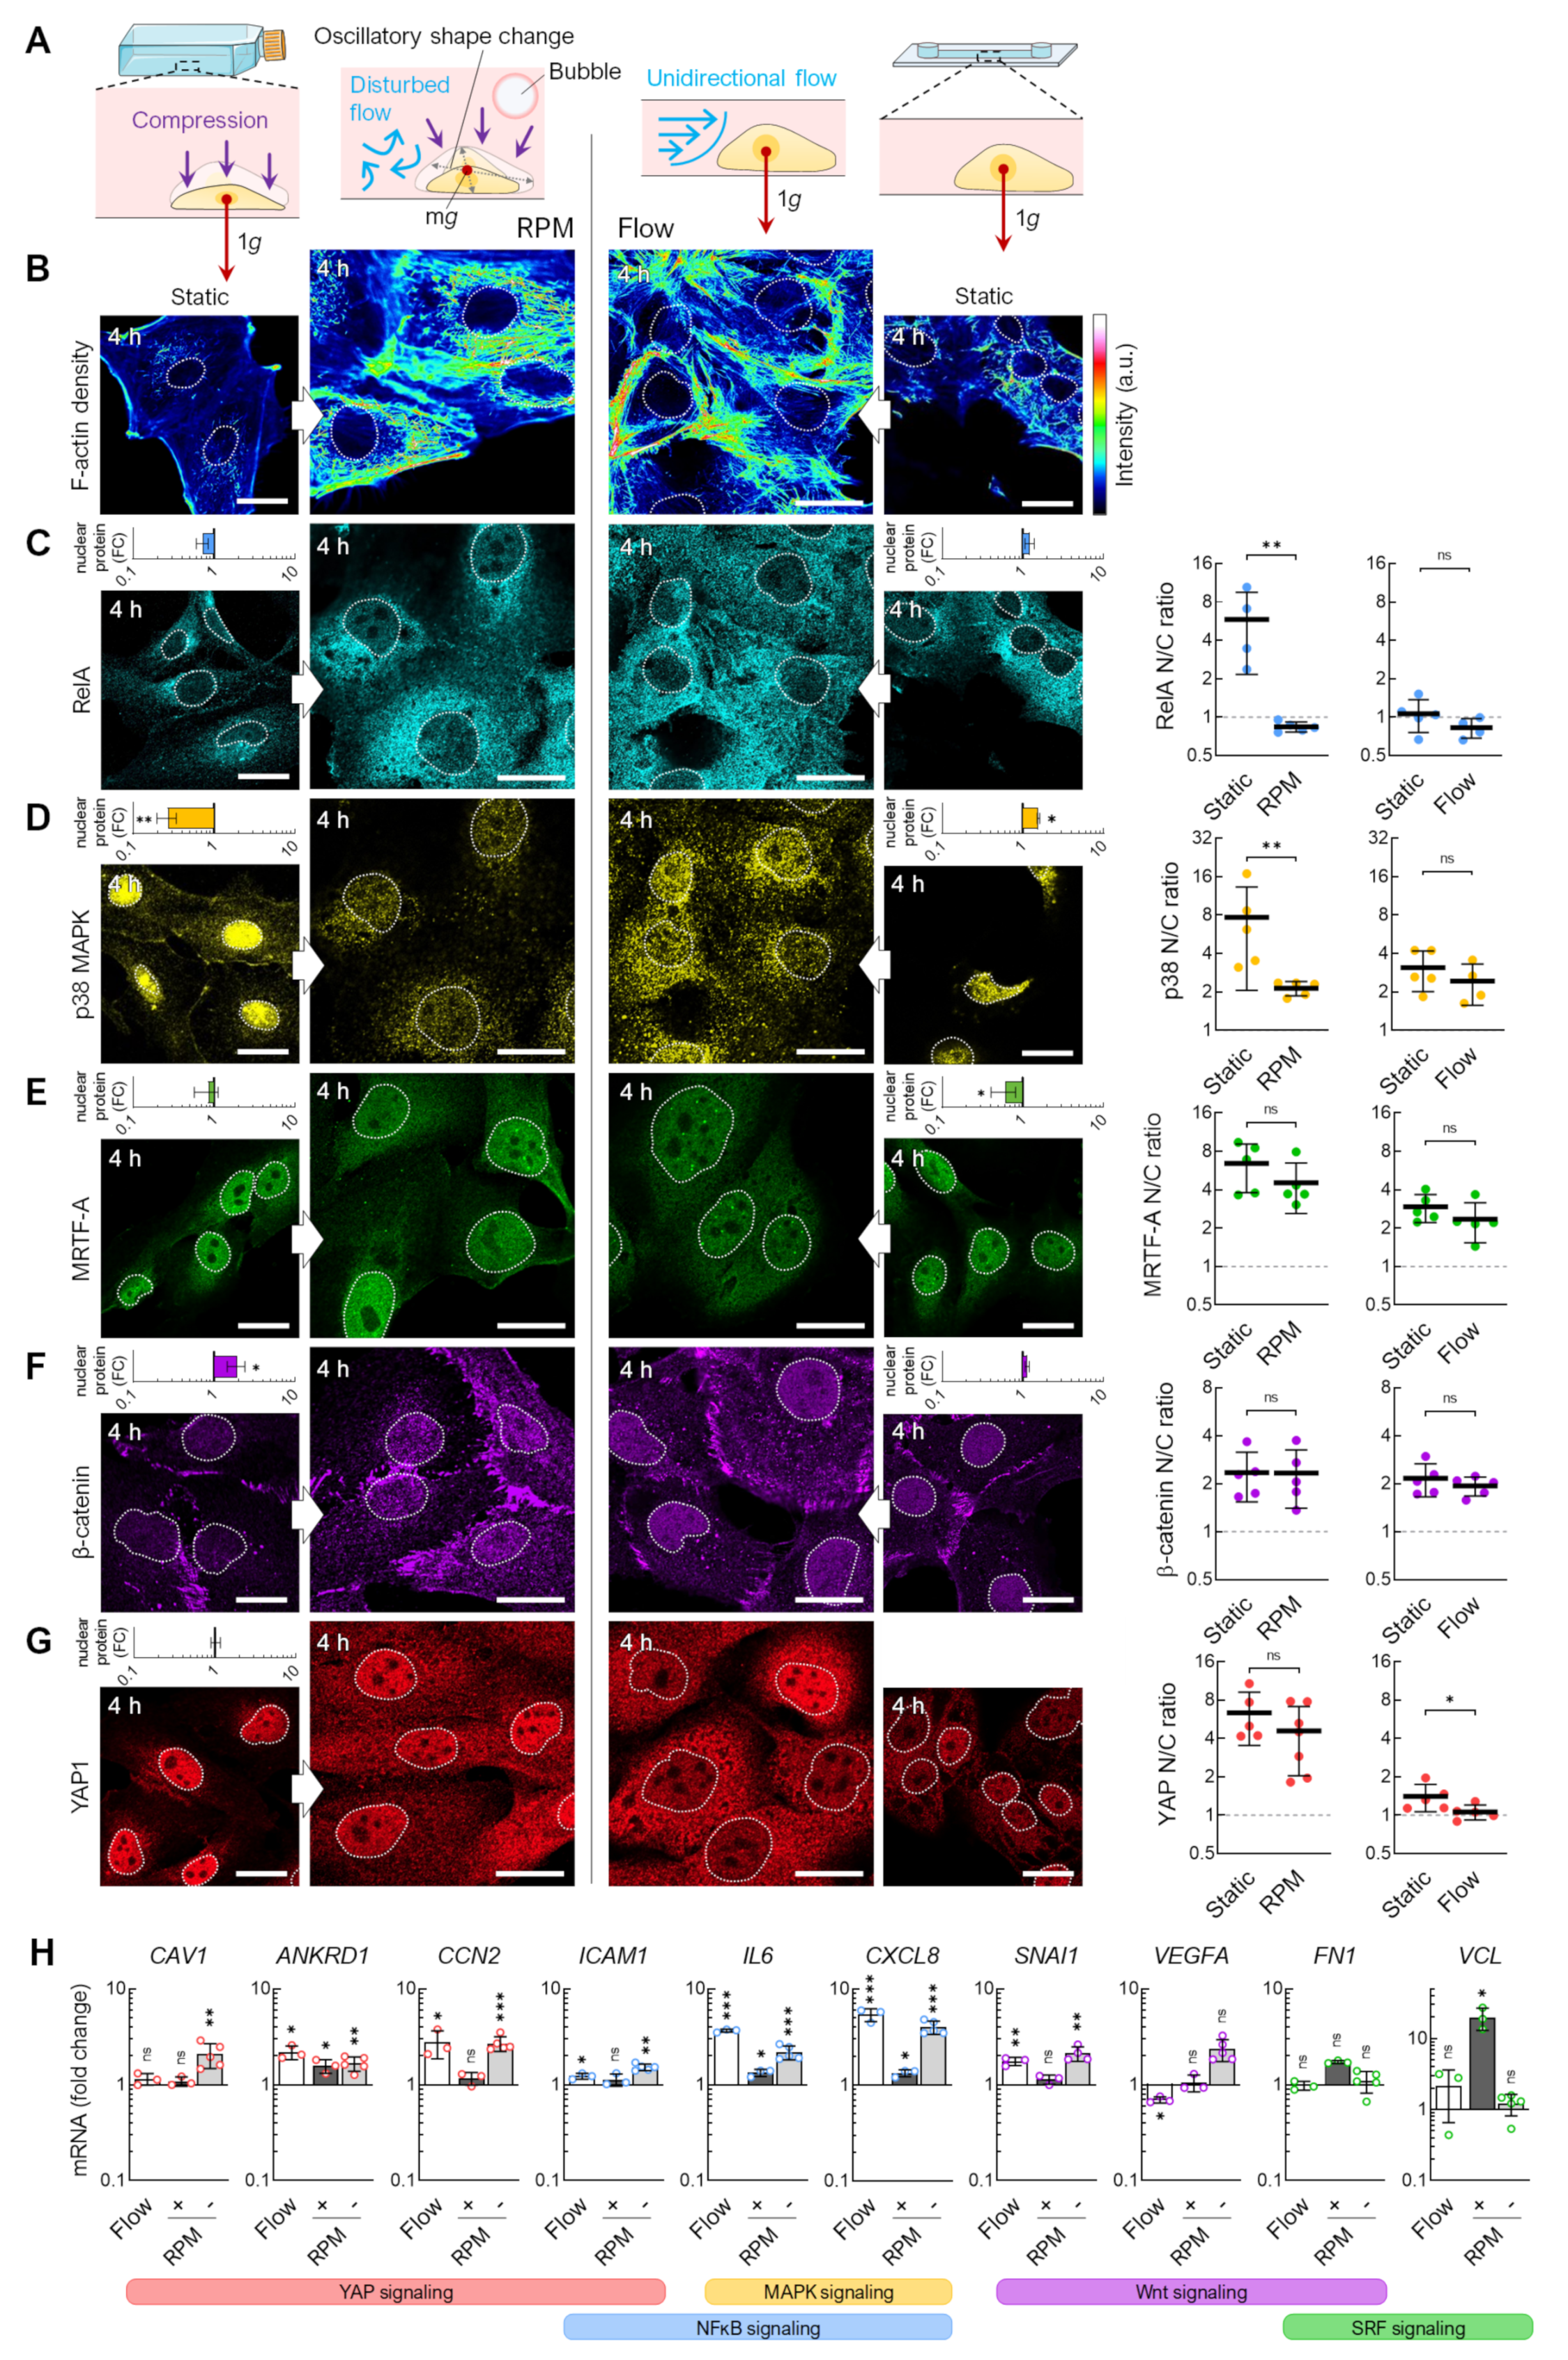
3.4. Flow Versus Random Positioning—Mechanobiology of Cell Detachment
4. Discussion
4.1. Adherent Cells in Rotating Bioreactors
4.2. Flow Shear
4.3. Air Bubbles
4.4. Cell Density
4.5. Spheroid Formation on the RPM
4.6. Implications for Future Experiments in Gravitational Biology
4.6.1. “Simulated Microgravity”
4.6.2. Real Microgravity
4.6.3. Cell Models
4.7. Study Limitations
5. Conclusions
Supplementary Materials
Author Contributions
Funding
Institutional Review Board Statement
Informed Consent Statement
Data Availability Statement
Acknowledgments
Conflicts of Interest
References
- Pietsch, J.; Ma, X.; Wehland, M.; Aleshcheva, G.; Schwarzwälder, A.; Segerer, J.; Birlem, M.; Horn, A.; Bauer, J.; Infanger, M.; et al. Spheroid Formation of Human Thyroid Cancer Cells in an Automated Culturing System during the Shenzhou-8 Space Mission. Biomaterials 2013, 34, 7694–7705. [Google Scholar] [CrossRef] [PubMed]
- Pietsch, J.; Gass, S.; Nebuloni, S.; Echegoyen, D.; Riwaldt, S.; Baake, C.; Bauer, J.; Corydon, T.J.; Egli, M.; Infanger, M.; et al. Three-Dimensional Growth of Human Endothelial Cells in an Automated Cell Culture Experiment Container during the SpaceX CRS-8 ISS Space Mission—The SPHEROIDS Project. Biomaterials 2017, 124, 126–156. [Google Scholar] [CrossRef] [PubMed]
- Melnik, D.; Krüger, M.; Schulz, H.; Kopp, S.; Wehland, M.; Bauer, J.; Baselet, B.; Vermeesen, R.; Baatout, S.; Corydon, T.J.; et al. The CellBox-2 Mission to the International Space Station: Thyroid Cancer Cells in Space. Int. J. Mol. Sci. 2021, 22, 8777. [Google Scholar] [CrossRef] [PubMed]
- Freed, L.E.; Langer, R.; Martin, I.; Pellis, N.R.; Vunjak-Novakovic, G. Tissue Engineering of Cartilage in Space. Proc. Natl. Acad. Sci. USA 1997, 94, 13885–13890. [Google Scholar] [CrossRef] [PubMed]
- Kim, H.; Shin, Y.; Kim, D.-H. Mechanobiological Implications of Cancer Progression in Space. Front. Cell Dev. Biol. 2021, 9, 740009. [Google Scholar] [CrossRef] [PubMed]
- Becker, J.L.; Souza, G.R. Using Space-Based Investigations to Inform Cancer Research on Earth. Nat. Rev. Cancer 2013, 13, 315–327. [Google Scholar] [CrossRef]
- Brungs, S.; Egli, M.; Wuest, S.L.; Christianen, P.C.M.; van Loon, J.J.W.A.; Anh, T.J.N.; Hemmersbach, R. Facilities for Simulation of Microgravity in the ESA Ground-Based Facility Programme. Microgravity Sci. Technol. 2016, 28, 191–203. [Google Scholar] [CrossRef]
- Kopp, S.; Slumstrup, L.; Corydon, T.J.; Sahana, J.; Aleshcheva, G.; Islam, T.; Magnusson, N.E.; Wehland, M.; Bauer, J.; Infanger, M.; et al. Identifications of Novel Mechanisms in Breast Cancer Cells Involving Duct-like Multicellular Spheroid Formation after Exposure to the Random Positioning Machine. Sci. Rep. 2016, 6, 26887. [Google Scholar] [CrossRef]
- Shi, S.; Li, Q.; Cao, Q.; Diao, Y.; Zhang, Y.; Yue, L.; Wei, L. EMT Transcription Factors Are Involved in the Altered Cell Adhesion under Simulated Microgravity Effect or Overloading by Regulation of E-Cadherin. Int. J. Mol. Sci. 2020, 21, 1349. [Google Scholar] [CrossRef]
- Albrecht-Buehler, G. Possible Mechanisms of Indirect Gravity Sensing by Cells. ASGSB Bull. 1991, 4, 25–34. [Google Scholar]
- Hauslage, J.; Cevik, V.; Hemmersbach, R. Pyrocystis Noctiluca Represents an Excellent Bioassay for Shear Forces Induced in Ground-Based Microgravity Simulators (Clinostat and Random Positioning Machine). NPJ Microgravity 2017, 3, 12. [Google Scholar] [CrossRef] [PubMed]
- Leguy, C.A.D.; Delfos, R.; Pourquie, M.J.B.M.; Poelma, C.; Westerweel, J.; van Loon, J.J.W.A. Fluid Dynamics during Random Positioning Machine Micro-Gravity Experiments. Adv. Space Res. 2017, 59, 3045–3057. [Google Scholar] [CrossRef]
- Wuest, S.L.; Richard, S.; Kopp, S.; Grimm, D.; Egli, M. Simulated Microgravity: Critical Review on the Use of Random Positioning Machines for Mammalian Cell Culture. BioMed Res. Int. 2015, 2015, 971474. [Google Scholar] [CrossRef] [PubMed]
- Wuest, S.L.; Stern, P.; Casartelli, E.; Egli, M. Fluid Dynamics Appearing during Simulated Microgravity Using Random Positioning Machines. PLoS ONE 2017, 12, e0170826. [Google Scholar] [CrossRef] [PubMed]
- Ibidi GmbH. Application Note 11, Shear Stress and Shear Rates for Ibidi µ-Slides Based on Numerical Calculations. 2022. Available online: https://ibidi.com/img/cms/support/AN/AN11_Shear_stress.pdf (accessed on 29 October 2023).
- Melnik, D.; Sahana, J.; Corydon, T.J.; Kopp, S.; Nassef, M.Z.; Wehland, M.; Infanger, M.; Grimm, D.; Krüger, M. Dexamethasone Inhibits Spheroid Formation of Thyroid Cancer Cells Exposed to Simulated Microgravity. Cells 2020, 9, 367. [Google Scholar] [CrossRef] [PubMed]
- Shihan, M.H.; Novo, S.G.; Le Marchand, S.J.; Wang, Y.; Duncan, M.K. A Simple Method for Quantitating Confocal Fluorescent Images. Biochem. Biophys. Rep. 2021, 25, 100916. [Google Scholar] [CrossRef] [PubMed]
- Melnik, D.; Cortés-Sánchez, J.L.; Sandt, V.; Kahlert, S.; Kopp, S.; Grimm, D.; Krüger, M. Dexamethasone Selectively Inhibits Detachment of Metastatic Thyroid Cancer Cells during Random Positioning. Cancers 2023, 15, 1641. [Google Scholar] [CrossRef]
- Kopp, S.; Warnke, E.; Wehland, M.; Aleshcheva, G.; Magnusson, N.E.; Hemmersbach, R.; Corydon, T.J.; Bauer, J.; Infanger, M.; Grimm, D. Mechanisms of Three-Dimensional Growth of Thyroid Cells during Long-Term Simulated Microgravity. Sci. Rep. 2015, 5, 16691. [Google Scholar] [CrossRef]
- Riwaldt, S.; Bauer, J.; Pietsch, J.; Braun, M.; Segerer, J.; Schwarzwälder, A.; Corydon, T.J.; Infanger, M.; Grimm, D. The Importance of Caveolin-1 as Key-Regulator of Three-Dimensional Growth in Thyroid Cancer Cells Cultured under Real and Simulated Microgravity Conditions. Int. J. Mol. Sci. 2015, 16, 28296–28310. [Google Scholar] [CrossRef]
- Corydon, T.J.; Schulz, H.; Richter, P.; Strauch, S.M.; Böhmer, M.; Ricciardi, D.A.; Wehland, M.; Krüger, M.; Erzinger, G.S.; Lebert, M.; et al. Current Knowledge about the Impact of Microgravity on Gene Regulation. Cells 2023, 12, 1043. [Google Scholar] [CrossRef]
- Ma, X.; Pietsch, J.; Wehland, M.; Schulz, H.; Saar, K.; Hübner, N.; Bauer, J.; Braun, M.; Schwarzwälder, A.; Segerer, J.; et al. Differential Gene Expression Profile and Altered Cytokine Secretion of Thyroid Cancer Cells in Space. FASEB J. 2014, 28, 813–835. [Google Scholar] [CrossRef] [PubMed]
- Kopp, S.; Krüger, M.; Feldmann, S.; Oltmann, H.; Schütte, A.; Schmitz, B.; Bauer, J.; Schulz, H.; Saar, K.; Huebner, N.; et al. Thyroid Cancer Cells in Space during the TEXUS-53 Sounding Rocket Mission—The THYROID Project. Sci. Rep. 2018, 8, 10355. [Google Scholar] [CrossRef] [PubMed]
- Kalukula, Y.; Stephens, A.D.; Lammerding, J.; Gabriele, S. Mechanics and Functional Consequences of Nuclear Deformations. Nat. Rev. Mol. Cell Biol. 2022, 23, 583–602. [Google Scholar] [CrossRef]
- Brungs, S.; Hauslage, J.; Hemmersbach, R. Validation of Random Positioning Versus Clinorotation Using a Macrophage Model System. Microgravity Sci. Technol. 2019, 31, 223–230. [Google Scholar] [CrossRef]
- Riwaldt, S.; Pietsch, J.; Sickmann, A.; Bauer, J.; Braun, M.; Segerer, J.; Schwarzwälder, A.; Aleshcheva, G.; Corydon, T.J.; Infanger, M.; et al. Identification of Proteins Involved in Inhibition of Spheroid Formation under Microgravity. Proteomics 2015, 15, 2945–2952. [Google Scholar] [CrossRef]
- Kopp, S.; Sahana, J.; Islam, T.; Petersen, A.G.; Bauer, J.; Corydon, T.J.; Schulz, H.; Saar, K.; Huebner, N.; Slumstrup, L.; et al. The Role of NFκB in Spheroid Formation of Human Breast Cancer Cells Cultured on the Random Positioning Machine. Sci. Rep. 2018, 8, 921. [Google Scholar] [CrossRef]
- Dietrichs, D.; Grimm, D.; Sahana, J.; Melnik, D.; Corydon, T.J.; Wehland, M.; Krüger, M.; Vermeesen, R.; Baselet, B.; Baatout, S.; et al. Three-Dimensional Growth of Prostate Cancer Cells Exposed to Simulated Microgravity. Front. Cell Dev. Biol. 2022, 10, 841017. [Google Scholar] [CrossRef]
- Grosse, J.; Wehland, M.; Pietsch, J.; Schulz, H.; Saar, K.; Hübner, N.; Elles, C.; Bauer, J.; Abou-El-Ardat, K.; Baatout, S.; et al. Gravity-sensitive Signaling Drives 3-dimensional Formation of Multicellular Thyroid Cancer Spheroids. FASEB J. 2012, 26, 5124–5140. [Google Scholar] [CrossRef]
- Sahebi, R.; Aghaei, M.; Halvaei, S.; Alizadeh, A. The Role of Microgravity in Cancer: A Dual-Edge Sword. Multidiscip. Cancer Investig. 2017, 1, 1–5. [Google Scholar] [CrossRef]
- Medha, M.; Roy, A. Microgravity: New Aspect for Breast Cancer Treatment, a Review. Acta Astronaut. 2022, 190, 62–73. [Google Scholar] [CrossRef]
- Herranz, R.; Anken, R.; Boonstra, J.; Braun, M.; Christianen, P.C.M.; de Geest, M.; Hauslage, J.; Hilbig, R.; Hill, R.J.A.; Lebert, M.; et al. Ground-Based Facilities for Simulation of Microgravity: Organism-Specific Recommendations for Their Use, and Recommended Terminology. Astrobiology 2013, 13, 1–17. [Google Scholar] [CrossRef] [PubMed]
- Topal, U.; Zamur, C. Microgravity, Stem Cells, and Cancer: A New Hope for Cancer Treatment. Stem Cells Int. 2021, 2021, 5566872. [Google Scholar] [CrossRef] [PubMed]
- Choi, D.H.; Jeon, B.; Lim, M.H.; Lee, D.H.; Ye, S.-K.; Jeong, S.-Y.; Kim, S. 3D Cell Culture Using a Clinostat Reproduces Microgravity-Induced Skin Changes. NPJ Microgravity 2021, 7, 20. [Google Scholar] [CrossRef] [PubMed]
- Häder, D.-P.; Hemmersbach, R. Euglena, a Gravitactic Flagellate of Multiple Usages. Life 2022, 12, 1522. [Google Scholar] [CrossRef] [PubMed]
- Roberts, A.M. The Mechanics of Gravitaxis in Paramecium. J. Exp. Biol. 2010, 213, 4158–4162. [Google Scholar] [CrossRef] [PubMed]
- Hemmersbach, R.; Häder, D.P. Graviresponses of Certain Ciliates and Flagellates. FASEB J. 1999, 13, S69–S75. [Google Scholar] [CrossRef] [PubMed]
- Lichterfeld, Y.; Kalinski, L.; Schunk, S.; Schmakeit, T.; Feles, S.; Frett, T.; Herrmann, H.; Hemmersbach, R.; Liemersdorf, C. Hypergravity Attenuates Reactivity in Primary Murine Astrocytes. Biomedicines 2022, 10, 1966. [Google Scholar] [CrossRef]
- Ju, Z.; Thomas, T.N.; Chiu, Y.-J.; Yamanouchi, S.; Yoshida, Y.; Abe, J.-I.; Takahashi, A.; Wang, J.; Fujiwara, K.; Hada, M. Adaptation and Changes in Actin Dynamics and Cell Motility as Early Responses of Cultured Mammalian Cells to Altered Gravitational Vector. Int. J. Mol. Sci. 2022, 23, 6127. [Google Scholar] [CrossRef]
- Luna, C.; Yew, A.G.; Hsieh, A.H. Effects of Angular Frequency during Clinorotation on Mesenchymal Stem Cell Morphology and Migration. NPJ Microgravity 2015, 1, 15007. [Google Scholar] [CrossRef]
- Vorselen, D.; Roos, W.H.; MacKintosh, F.C.; Wuite, G.J.L.; van Loon, J.J.W.A. The Role of the Cytoskeleton in Sensing Changes in Gravity by Nonspecialized Cells. FASEB J. 2014, 28, 536–547. [Google Scholar] [CrossRef]
- Zhang, C.; Zhou, L.; Zhang, F.; Lü, D.; Li, N.; Zheng, L.; Xu, Y.; Li, Z.; Sun, S.; Long, M. Mechanical Remodeling of Normally Sized Mammalian Cells under a Gravity Vector. FASEB J. 2017, 31, 802–813. [Google Scholar] [CrossRef] [PubMed]
- Huang, Q.; Hu, X.; He, W.; Zhao, Y.; Hao, S.; Wu, Q.; Li, S.; Zhang, S.; Shi, M. Fluid Shear Stress and Tumor Metastasis. Am. J. Cancer Res. 2018, 8, 763–777. [Google Scholar] [PubMed]
- Lee, H.J.; Diaz, M.F.; Price, K.M.; Ozuna, J.A.; Zhang, S.; Sevick-Muraca, E.M.; Hagan, J.P.; Wenzel, P.L. Fluid Shear Stress Activates YAP1 to Promote Cancer Cell Motility. Nat. Commun. 2017, 8, 14122. [Google Scholar] [CrossRef] [PubMed]
- Kim, O.-H.; Choi, Y.W.; Park, J.H.; Hong, S.A.; Hong, M.; Chang, I.H.; Lee, H.J. Fluid Shear Stress Facilitates Prostate Cancer Metastasis through Piezo1-Src-YAP Axis. Life Sci. 2022, 308, 120936. [Google Scholar] [CrossRef] [PubMed]
- Calvaruso, M.; Militello, C.; Minafra, L.; La Regina, V.; Torrisi, F.; Pucci, G.; Cammarata, F.P.; Bravatà, V.; Forte, G.I.; Russo, G. Biological and Mechanical Characterization of the Random Positioning Machine (RPM) for Microgravity Simulations. Life 2021, 11, 1190. [Google Scholar] [CrossRef] [PubMed]
- Jha, R.; Wu, Q.; Singh, M.; Preininger, M.K.; Han, P.; Ding, G.; Cho, H.C.; Jo, H.; Maher, K.O.; Wagner, M.B.; et al. Simulated Microgravity and 3D Culture Enhance Induction, Viability, Proliferation and Differentiation of Cardiac Progenitors from Human Pluripotent Stem Cells. Sci. Rep. 2016, 6, 30956. [Google Scholar] [CrossRef] [PubMed]
- Zhao, X.; Ma, C.; Park, D.S.; Soper, S.A.; Murphy, M.C. Air Bubble Removal: Wettability Contrast Enabled Microfluidic Interconnects. Sens. Actuators B Chem. 2022, 361, 131687. [Google Scholar] [CrossRef]
- Chisti, Y. Animal-Cell Damage in Sparged Bioreactors. Trends Biotechnol. 2000, 18, 420–432. [Google Scholar] [CrossRef]
- Huang, W.; Yun, H.; Huang, W.; Zhang, B.; Lyu, X. On the Influences of Air Bubbles on Water Flow in a Two-Dimensional Channel. Math. Probl. Eng. 2021, 2021, 6818673. [Google Scholar] [CrossRef]
- Gumbiner, B.M.; Kim, N.-G. The Hippo-YAP Signaling Pathway and Contact Inhibition of Growth. J. Cell Sci. 2014, 127, 709–717. [Google Scholar] [CrossRef]
- Mason, D.E.; Collins, J.M.; Dawahare, J.H.; Nguyen, T.D.; Lin, Y.; Voytik-Harbin, S.L.; Zorlutuna, P.; Yoder, M.C.; Boerckel, J.D. YAP and TAZ Limit Cytoskeletal and Focal Adhesion Maturation to Enable Persistent Cell Motility. J. Cell Biol. 2019, 218, 1369–1389. [Google Scholar] [CrossRef] [PubMed]
- Khan, S.U.; Fatima, K.; Malik, F. Understanding the Cell Survival Mechanism of Anoikis-Resistant Cancer Cells during Different Steps of Metastasis. Clin. Exp. Metastasis 2022, 39, 715–726. [Google Scholar] [CrossRef] [PubMed]
- Masini, M.A.; Bonetto, V.; Manfredi, M.; Pastò, A.; Barberis, E.; Timo, S.; Vanella, V.V.; Robotti, E.; Masetto, F.; Andreoli, F.; et al. Prolonged Exposure to Simulated Microgravity Promotes Stemness Impairing Morphological, Metabolic and Migratory Profile of Pancreatic Cancer Cells: A Comprehensive Proteomic, Lipidomic and Transcriptomic Analysis. Cell. Mol. Life Sci. 2022, 79, 226. [Google Scholar] [CrossRef] [PubMed]
- Häder, D.-P.; Braun, M.; Hemmersbach, R. Gravity Sensing, Graviorientation and Microgravity. In Gravitational Biology I; SpringerBriefs in Space Life Sciences; Springer International Publishing: Cham, Switzerland, 2018; pp. 1–11. ISBN 9783319938936. [Google Scholar]
- ElGindi, M.; Sapudom, J.; Laws, P.; Garcia-Sabaté, A.; Daqaq, M.F.; Teo, J. 3D Microenvironment Attenuates Simulated Microgravity-Mediated Changes in T Cell Transcriptome. Cell. Mol. Life Sci. 2022, 79, 508. [Google Scholar] [CrossRef] [PubMed]
- ElGindi, M.; Sapudom, J.; Garcia Sabate, A.; Chesney Quartey, B.; Alatoom, A.; Al-Sayegh, M.; Li, R.; Chen, W.; Teo, J. Effects of an Aged Tissue Niche on the Immune Potency of Dendritic Cells Using Simulated Microgravity. NPJ Aging 2023, 9, 14. [Google Scholar] [CrossRef] [PubMed]
- Svejgaard, B.; Wehland, M.; Ma, X.; Kopp, S.; Sahana, J.; Warnke, E.; Aleshcheva, G.; Hemmersbach, R.; Hauslage, J.; Grosse, J.; et al. Common Effects on Cancer Cells Exerted by a Random Positioning Machine and a 2D Clinostat. PLoS ONE 2015, 10, e0135157. [Google Scholar] [CrossRef] [PubMed]
- Liu, Q.; Luo, Q.; Ju, Y.; Song, G. Role of the Mechanical Microenvironment in Cancer Development and Progression. Cancer Biol. Med. 2020, 17, 282–292. [Google Scholar] [CrossRef]
- Jokela, T.A.; LaBarge, M.A. Integration of Mechanical and ECM Microenvironment Signals in the Determination of Cancer Stem Cell States. Curr. Stem Cell Rep. 2021, 7, 39–47. [Google Scholar] [CrossRef]
- Mierke, C.T. Bidirectional Mechanical Response between Cells and Their Microenvironment. Front. Phys. 2021, 9, 749830. [Google Scholar] [CrossRef]
- Larose, T.L. Tumors in Space: Preparation for Spaceflight. In Preparation of Space Experiments; Pletser, V., Ed.; IntechOpen: London, UK, 2020; ISBN 9781789851380. [Google Scholar]
- Einstein, A. Grundgedanken Und Methoden Der Relativitätstheorie in Ihrer Entwicklung Dargestellt. In The Berlin Years: Writings; Janssen, M., Lehner, C., Buchwald, D., Eds.; Princeton University Press: Princeton, NJ, USA, 1918; Volume 7. [Google Scholar]


Disclaimer/Publisher’s Note: The statements, opinions and data contained in all publications are solely those of the individual author(s) and contributor(s) and not of MDPI and/or the editor(s). MDPI and/or the editor(s) disclaim responsibility for any injury to people or property resulting from any ideas, methods, instructions or products referred to in the content. |
© 2023 by the authors. Licensee MDPI, Basel, Switzerland. This article is an open access article distributed under the terms and conditions of the Creative Commons Attribution (CC BY) license (https://creativecommons.org/licenses/by/4.0/).
Share and Cite
Cortés-Sánchez, J.L.; Melnik, D.; Sandt, V.; Kahlert, S.; Marchal, S.; Johnson, I.R.D.; Calvaruso, M.; Liemersdorf, C.; Wuest, S.L.; Grimm, D.; et al. Fluid and Bubble Flow Detach Adherent Cancer Cells to Form Spheroids on a Random Positioning Machine. Cells 2023, 12, 2665. https://doi.org/10.3390/cells12222665
Cortés-Sánchez JL, Melnik D, Sandt V, Kahlert S, Marchal S, Johnson IRD, Calvaruso M, Liemersdorf C, Wuest SL, Grimm D, et al. Fluid and Bubble Flow Detach Adherent Cancer Cells to Form Spheroids on a Random Positioning Machine. Cells. 2023; 12(22):2665. https://doi.org/10.3390/cells12222665
Chicago/Turabian StyleCortés-Sánchez, José Luis, Daniela Melnik, Viviann Sandt, Stefan Kahlert, Shannon Marchal, Ian R. D. Johnson, Marco Calvaruso, Christian Liemersdorf, Simon L. Wuest, Daniela Grimm, and et al. 2023. "Fluid and Bubble Flow Detach Adherent Cancer Cells to Form Spheroids on a Random Positioning Machine" Cells 12, no. 22: 2665. https://doi.org/10.3390/cells12222665
APA StyleCortés-Sánchez, J. L., Melnik, D., Sandt, V., Kahlert, S., Marchal, S., Johnson, I. R. D., Calvaruso, M., Liemersdorf, C., Wuest, S. L., Grimm, D., & Krüger, M. (2023). Fluid and Bubble Flow Detach Adherent Cancer Cells to Form Spheroids on a Random Positioning Machine. Cells, 12(22), 2665. https://doi.org/10.3390/cells12222665