Article

Plasma-Derived Exosome Proteins as Novel Diagnostic and Prognostic Biomarkers in Neuroblastoma Patients

by
Martina Morini
1,†,
Federica Raggi
2,*,†,
Martina Bartolucci
3,
Andrea Petretto
3,
Martina Ardito
1,†,
Chiara Rossi
2,†,
Daniela Segalerba
1,†,
Alberto Garaventa
4,
Alessandra Eva
5,†,
Davide Cangelosi
6,†,‡ and
Maria Carla Bosco
2,†,‡
1
Laboratory of Experimental Therapies in Oncology, IRCCS Istituto Giannina Gaslini, 16147 Genova, Italy
2
Unit of Autoinflammatory Diseases and Immunodeficiencies, Pediatric Rheumatology Clinic, IRCCS Istituto Giannina Gaslini, 16147 Genova, Italy
3
Core Facilities, Clinical Proteomics and Metabolomics, IRCCS Istituto Giannina Gaslini, 16147 Genova, Italy
4
Pediatric Oncology, IRCCS Istituto Giannina Gaslini, 16147 Genova, Italy
5
Scientific Directorate, IRCCS Istituto Giannina Gaslini, 16147 Genova, Italy
6
Clinical Bioinfomatics Unit, IRCCS Istituto Giannina Gaslini, 16147 Genova, Italy
*
Author to whom correspondence should be addressed.
At the beginning of the study, author was affiliated to the Laboratory of Molecular Biology, IRCCS Istituto Giannina Gaslini, 16147 Genova, Italy.
These authors contributed equally to this work.
Cells 2023, 12(21), 2516; https://doi.org/10.3390/cells12212516
Submission received: 1 June 2023 / Revised: 18 October 2023 / Accepted: 20 October 2023 / Published: 25 October 2023
(This article belongs to the Special Issue Early Biomarkers of Cancer: Diagnosis and Progression)

Abstract

:
Neuroblastoma (NB) is the most common extracranial solid tumor during infancy, causing up to 10% of mortality in children; thus, identifying novel early and accurate diagnostic and prognostic biomarkers is mandatory. NB-derived exosomes carry proteins (Exo-prots) reflecting the status of the tumor cell of origin. The purpose of this study was to characterize, for the first time, the Exo-prots specifically expressed in NB patients associated with tumor phenotype and disease stage. We isolated exosomes from plasma specimens of 24 HR-NB patients and 24 low-risk (LR-NB) patients at diagnosis and of 24 age-matched healthy controls (CTRL). Exo-prot expression was measured by liquid chromatography–mass spectrometry. The data are available via ProteomeXchange (PXD042422). The NB patients had a different Exo-prot expression profile compared to the CTRL. The deregulated Exo-prots in the NB specimens acted mainly in the tumor-associated pathways. The HR-NB patients showed a different Exo-prot expression profile compared to the LR-NB patients, with the modulation of proteins involved in cell migration, proliferation and metastasis. NCAM, NCL, LUM and VASP demonstrated a diagnostic value in discriminating the NB patients from the CTRL; meanwhile, MYH9, FN1, CALR, AKAP12 and LTBP1 were able to differentiate between the HR-NB and LR-NB patients with high accuracy. Therefore, Exo-prots contribute to NB tumor development and to the aggressive metastatic NB phenotype.

1. Introduction

Neuroblastoma (NB) is the most common extracranial solid tumor during infancy, with a median age at diagnosis of 17 months. Although classified as a rare disease, it represents a worldwide emergency, causing up to 10% of mortality in children. NB shows notable heterogeneity with regard to histology and clinical behavior, ranging from low-risk (LR-NB) localized tumors to high-risk (HR-NB) disease, characterized by an aggressive metastatic phenotype, resistance to treatment, and fatal relapse occurrence. Risk stratification demands the highest accuracy, as it determines the therapeutic treatment. For NB patients, risk assessment is based on age at diagnosis, stage of the disease, chromosomal aberrations and amplification of MYCN, a transcriptional factor considered the major oncogenic driver. However, the current therapeutic stratification, based on such clinical and molecular risk factors, does not allow to discriminate patients with similar clinical-pathological parameters who receive the same treatment, despite showing markedly different clinical courses. The limits of the existing classification system could be overcome by a deeper investigation of the biology of the tumor. Thus, the challenge remains the identification of additional and more accurate prognostic markers to improve risk stratification and direct a personalized treatment.
Despite aggressive therapy, the five-year survival rate of HR-NB patients remains poor. Moreover, HR-NB tumors are often unresectable as they infiltrate surrounding areas, hindering tissue biopsies. Nowadays, the molecular characterization of neoplastic diseases allows to overcome the limitations of the cell morphology-based classification of solid tumors, improving cancer diagnosis and treatment [1]. The acquired experience in molecular profiling highlights some limitations, especially in terms of sampling methods [2]. Although they are still the main source of biological material for diagnostic purposes, tissue biopsies entail high costs, high risk of adverse effects because of the invasive nature of the technique and procedural complications resulting in inadequate material retrieval and lead to increased false-negative or false-positive results that affect treatment decisions [3,4]. Moreover, tissue sampling does not capture all of the spatial and temporal heterogeneity of tumors, preventing the identification of aggressive and therapy-resistant cellular subclones that are responsible for disease progression and recurrence [5].
Recently, interest has grown in liquid biopsies, which represent a surrogate of the tumor and can provide complementary or even additional information for tissue biopsies. The investigation of biological fluids is based on a minimally invasive, less expensive and easily accessible method that can be applied for cancer diagnosis and prognosis, treatment selection, disease monitoring and assessment of relapse occurrence. Liquid biopsies are a source of circulating tumor cells, circulating tumor DNA, exosomes, and nano-sized vesicles (30–150 nm) derived from the endocytic pathway and released in the extracellular environment after the fusion of multivesicular bodies with the cell plasma membrane [6]. The release of exosomes is regulated by specific stimuli, and their cargo reflects the producing cell [7]. Indeed, exosomes are defined as the bioprint of the cell of origin and, thus, the study of their content allows to gain accurate information of primary tumor features [8,9,10]. Indeed, exosomes represent a source for both diagnostic and prognostic markers in several human diseases [8,9,10,11,12,13,14,15]. To gain insight into the characteristics of NB for improving diagnosis and treatment, we performed proteomic analysis of the exosomes released in the blood of NB patients. In particular, in order to identify molecules with potential value for improving risk stratification, we compared the exosomal protein (Exo-prot) profiles of LR-NB and HR-NB patients at the onset. Our results identified the Exo-prots and biological pathways involved in tumor development and progression and associated with the acquisition of aggressive tumoral traits, integrating the data of our previous study demonstrating that exosomal microRNAs (exo-miRNAs) are associated with HR-NB patients’ response to treatment [8].

2. Materials and Methods

2.1. Study Cohort and Blood Sample Collection and Processing

The study cohort included Italian NB patients classified into different risk groups: HR-NB (n = 24) and LR-NB (n = 24). Age-matched blood samples of healthy donors (n = 24) were used as the control (CTRL). The main clinical features of the study cohort are reported in Table 1. The procedures for patient enrollment were carried out according to the proper guidelines and in adherence with the ethical principles of the Declaration of Helsinki. Blood samples were provided by the BIT-Gaslini Biobank, which centralizes the NB specimens derived from Italian AIEOP (Associazione Italiana Emato-Oncologia Pediatrica) centers. Written informed consent was provided from the parents or legal guardian of each patient considered for the study. Blood samples were collected in EDTA tubes and processed within 24 h. Processing included centrifugation at 1200× g for 10 min at room temperature (RT) to collect plasma. Plasma was stored at −80 °C or used immediately for exosome isolation.

2.2. Exosome Isolation and Proteomic Analysis

Exosome isolation was performed from 500 μL of plasma utilizing an exoRNeasy Serum/Plasma Midi Kit (Qiagen Italia, Milan, Italy) with a modified version of the protocol that we have previously described [8], which enables to isolate vesicles with diameter and surface markers specific to exosomes. Protocol modifications were added starting from the washing step with XWP buffer, performed twice by centrifuging samples at 500× g and 5000× g for 5 min at RT, respectively. The isolated exosomes were lysed, reduced and alkylated directly on the filter by adding to 100 µL of boiling lysis buffer 6 M Guanidine, 10 mM TCEP, and 4 mM CAA in 100 mM Tris pH 8 and heating the columns in a thermomixer at 100 °C for 10 min and 1000 rpm. The lysed samples were centrifuged at 4000× g for 5 min and left to digest for 2 h with the addition of 0.6 µg of LysC (FUJIFILM Wako Pure Chemical Corporation, Milano, Italy). The filters were then washed with 200 μL of Tris 25 mM, pH 8, by centrifuging at 4000× g for 5 min. The total sample was further digested by adding 0.6 µg of Trypsin (Promega, Milano, Italy), followed by mixing and incubating at 37 °C overnight. The digested samples were loaded onto StageTips [16]. The resulting peptides were completely dried in a SpeedVac centrifuge at 30 °C, resuspended in 2% ACN and 0.1% formic acid and analyzed by a nano-UHPLC-MS/MS system using an Ultimate 3000 RSLC coupled to an Orbitrap Fusion Tribrid mass spectrometer (Thermo Scientific, Milano, Italy).

2.3. Proteomic Set-Up

Elution was performed with an EASY spray column (75 μm × 50 cm, 2 μm particle size, Thermo Scientific, Milano, Italy) at a flow rate of 250 nL/min with a 100 min non-linear gradient of 7–45% solution B (80% ACN, 20% H2O, 5% DMSO and 0.1% FA). MS analysis was performed in DDA mode. Orbitrap detection was used for MS1 measurements at a resolving power of 120 K in a range between 375 and 1500 m/z, with an AGC target of 400,000 and a maximum injection time of 50 ms. MS/MS spectra were acquired in the linear ion trap (rapid scan mode) after collision-induced dissociation (CID) fragmentation at a collision energy of 35% and an AGC target of 2000 for up to 300 ms. A 1.5 s cycle time was performed for data-dependent MS/MS analysis, during which precursors with a charge range of 2–4 were selected for activation in order of abundance. Quadrupole isolation with a 1.8 m/z isolation window was used, and dynamic exclusion was enabled for 25 s.
Raw data were processed with MaxQuant [17] software, version 1.6.4.0. A false discovery rate (FDR) of 0.01 was set for the identification of proteins, peptides and PSM (peptide-spectrum match). For peptide identification, a minimum length of 6 amino acids was required. The Andromeda engine, incorporated into MaxQuant software, was used to search the MS/MS spectra against the Uniprot human database and additional human database (release UP000005640_9606 April 2018). In the processing, acetylation (Protein N-Term), oxidation (M) and deamidation (NQ) were selected as variable modifications, and the fixed modification was carbamidomethylation (C). The quantification intensities were calculated by the default fast MaxLFQ algorithm with the activated option “match between runs.”

2.4. Bioinformatic Analysis

Differential expression analysis was carried out using the SMAGEXP tool suite [18]. Exo-prots with a Benjamini–Hochberg p-value lower than 0.05 and a log fold change >0.58 or <−0.58 were considered statistically significantly deregulated. Exo-prots with ≤30% missing values were retained for the analysis to reduce the bias introduced by imputation. The random forest (RF) and quantile regression imputation of left-censored data (QRILC) methods were used for missing value imputation using the METimp web tool [19]. The RF method uses an iterative imputation approach that trains an RF on observed values and then predicts the missing values [20]. The QRILC method performs the imputation of left-censored missing data, using random draws from a truncated distribution with parameters estimated by quantile regression [19]. Protein–protein interaction (PPI) network and pathway analyses were carried out on selected statistically significantly deregulated Exo-prots using STRING-DB software (version 12.0) [21]. The PPI enrichment p-value was used to assess whether a group of proteins have more interactions among themselves than what would be expected from a random set of proteins of a similar size, drawn from the genome. We considered significant a PPI enrichment p-value lower than 0.05. Pathway analysis was used to identify the biological processes mainly regulated by differentially expressed Exo-prots. An FDR lower than 0.05 identified significantly enriched ontology terms and pathways. Venn diagrams were plotted using the InteractiVenn web-based tool [22].

2.5. Statistical Analysis

A two-proportion Z-test based on the detectable and missing values between the NB and CTRL or HR-NB and LR-NB groups was used to determine whether the two proportions were different from each other. A Z-score <−2.6 or >2.6 were considered to demonstrate statistically significant differences. Age group and sex were considered potential confounders, and differences between the NB patients and CTRL were tested using Fisher’s exact test. A Fisher p-value lower than 0.05 was considered statistically significant. Receiver operating characteristic (ROC) curves were plotted to visually display the discriminating power of each significantly modulated Exo-prot across groups. Exo-prot expression was used to generate ROC curves. The area under the ROC curve (AUC) was computed to quantitatively assess the discriminating performance of each Exo-prot. ROC curves and statistical calculations were performed using GraphPad Prism 8.0 software (GraphPad Software, La Jolla, CA, USA).
The combined discriminatory power of a selection of statistically significantly represented Exo-prots across the NB and CTRL groups was assessed by generalized linear models using the GLMNET R package [23]. The group was set up as the response variable, Exo-prot expression as the explanatory variable, the elastic net mixing parameter at 1.0, and the minimum mean square error as the gamma value. The best gamma value was assessed using the leave-one-out cross-validation technique.

2.6. ROC Data Validation by Gene Expression

Diagnostic or prognostic Exo-prots identified by ROC analysis were validated by measuring the expression of the corresponding genes in the primary tumor tissue at the onset. Tissue biopsies from 10 LR and 10 HR-NB patients and four non-oncologic control tissues were homogenized with the Tissue Lyser II instrument and RNA was extracted with an RNeasy Mini Kit (Qiagen Italia, Milan, Italy). The RNA quality was assessed with a Nano RNA Assay on the Agilent 2100 Bioanalyzer (Agilent Technologies Spa, Milan, Italy). RNA quantification was performed with the QIAxpert System (Qiagen Italia, Milan, Italy). RNA was reverse-transcribed with SuperScript™ II Reverse Transcriptase (Thermo Fisher Scientific, Milan, Italy) and the expression levels of the FN1, AKAP12, MYH9, CALR, NCL, NCAM, VASP, LGALS3BP, DCN and LUM genes were assessed by RTqPCR (real-time quantitative PCR) with specific TaqMan assays (Thermo Fisher Scientific, Milano, Italy). Each sample was repeated in triplicate on a MicroAmp Fast Optical 96-well reaction plate run on the ViiA7 Real-Time PCR System (Thermo Fisher Scientific, Milan, Italy). GAPDH was used as the housekeeping gene for data normalization. The relative expression values between sample groups were calculated using the 2(−DCT) method. Statistical analysis and plots were carried out using GraphPad Prism 8.0 for Windows.

3. Results

3.1. Protein Cargo Profiling of the NB and CTRL Subjects

To identify the potential biomarkers and key biological processes associated with tumor development in NB patients, we performed proteomic analysis of the exosomes isolated from the plasma samples of the NB patients and age-matched CTRL provided by the BIT-Gaslini biobank. Table 1 summarizes the clinical and molecular characteristics of the patients and CTRL. A flowchart summarizing the main steps of the sample collection and bioinformatic analyses is shown in Figure 1. Specifically, plasma samples were collected from 24 LR-NB patients (stage 1, 2, 4 s and MYCN non-amplified tumors), 24 HR-NB patients (age >18 months and stage 4 tumor or MYCN amplified) and 24 CTRL children. The association between sex (male vs. female) or age group (<18 months vs. >18 months) and the subject group (CTRL) or NB-HR vs. LR-NB was analyzed to assess the potential confounding effects of these characteristics. Fisher’s exact test did not show a significant association between sex or age group and the subject group (p > 0.05), thereby excluding the possibility that sex and age group might be confounding factors in this study.
Plasma-derived exosomes from each sample were isolated, and protein cargo was profiled by high-resolution mass spectrometry coupled with liquid chromatography. The analytical data generation identified 458 exosomal proteins (Exo-prots) detectable in at least one NB or CTRL subject.

3.2. Analysis of Detectable Exo-Prots Based on the Distribution of Missing Values in the NB and CTRL Subjects

Since missing values can adversely affect statistical analysis [24], the distribution of the Exo-prot missing values between the NB patients and CTRL was investigated to assess whether detectable Exo-prots might provide new insights into disease development. The Z-test analysis of the detectable value proportions showed that 38 Exo-prots were exclusively expressed in the NB patients, whereas 83 were exclusively expressed in the CTRL subjects (z-score >2.6 or <−2.6; Supplementary Table S1). A heatmap based on the expression of these 121 Exo-prots visually shows a clear association with the NB patients and CTRL subjects, visually confirming the results of the Z-test analysis of proportions (Figure 2A). Among the exclusively detectable Exo-prots in the NB patients, we identified the MYC target nucleophosmin (NPM1) and the actin interacting protein zyxin (ZYX), known for their role in tumor proliferation and invasiveness [25,26].
Network analysis was carried out on the 121 Exo-prots to help interpret the results and assess the biological function of these proteins (Figure 2B). The network analysis displayed significantly more interactions than expected for a random set of proteins of a similar size drawn from the genome (protein–protein interaction (PPI) enrichment p-value <0.05). These findings establish a connection between significantly modulated Exo-prots and indicate that these proteins are biologically connected as a group. Pathway analysis is a well-known bioinformatic tool that is used to explore the biological processes and pathways associated with a list of differentially expressed genes/proteins using curated ontologies [27].
Pathway analysis identified 141 significantly enriched biological processes and pathways in the NB patients (Supplementary Table S2). A selection of the most significantly enriched terms are listed in Table 2. These results show that the identified Exo-prots in the NB patients might act as cancer-associated pathways, such as stress response, immune system regulation, inflammation, cell motility and cytoskeletal rearrangements.
Missing values cannot be directly handled by bioinformatics tools. Imputation is a bioinformatic technique used to substitute missing values with defined observations. We applied RF or QRILC, two well-known methods [19], for imputing missing values to subsequently identify deregulated Exo-prots.

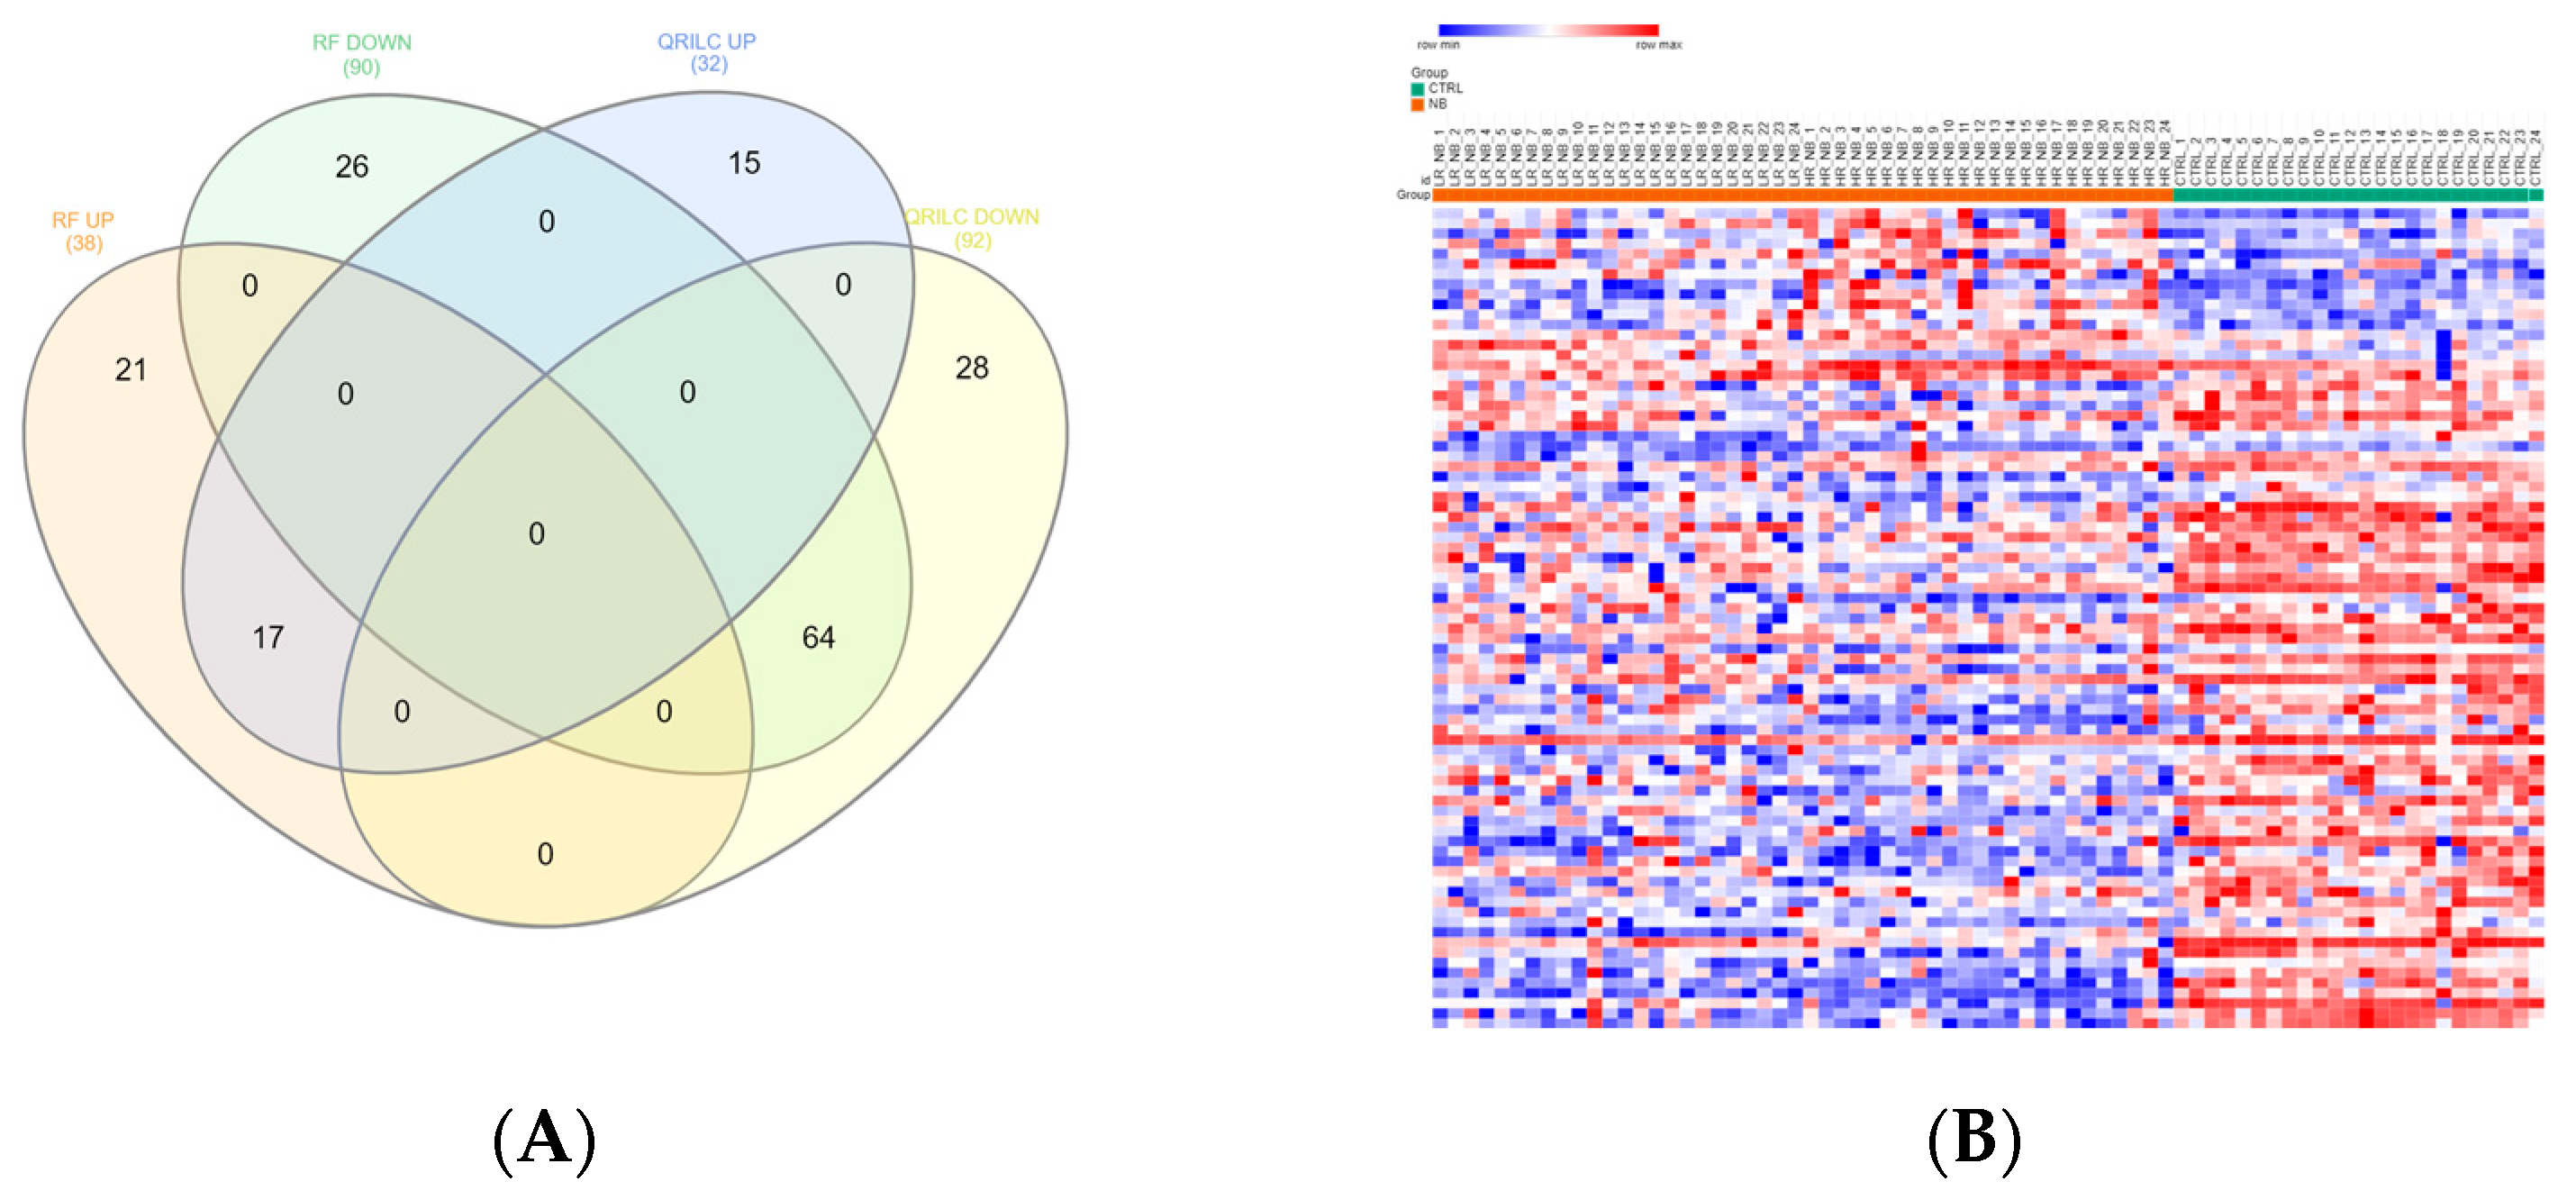
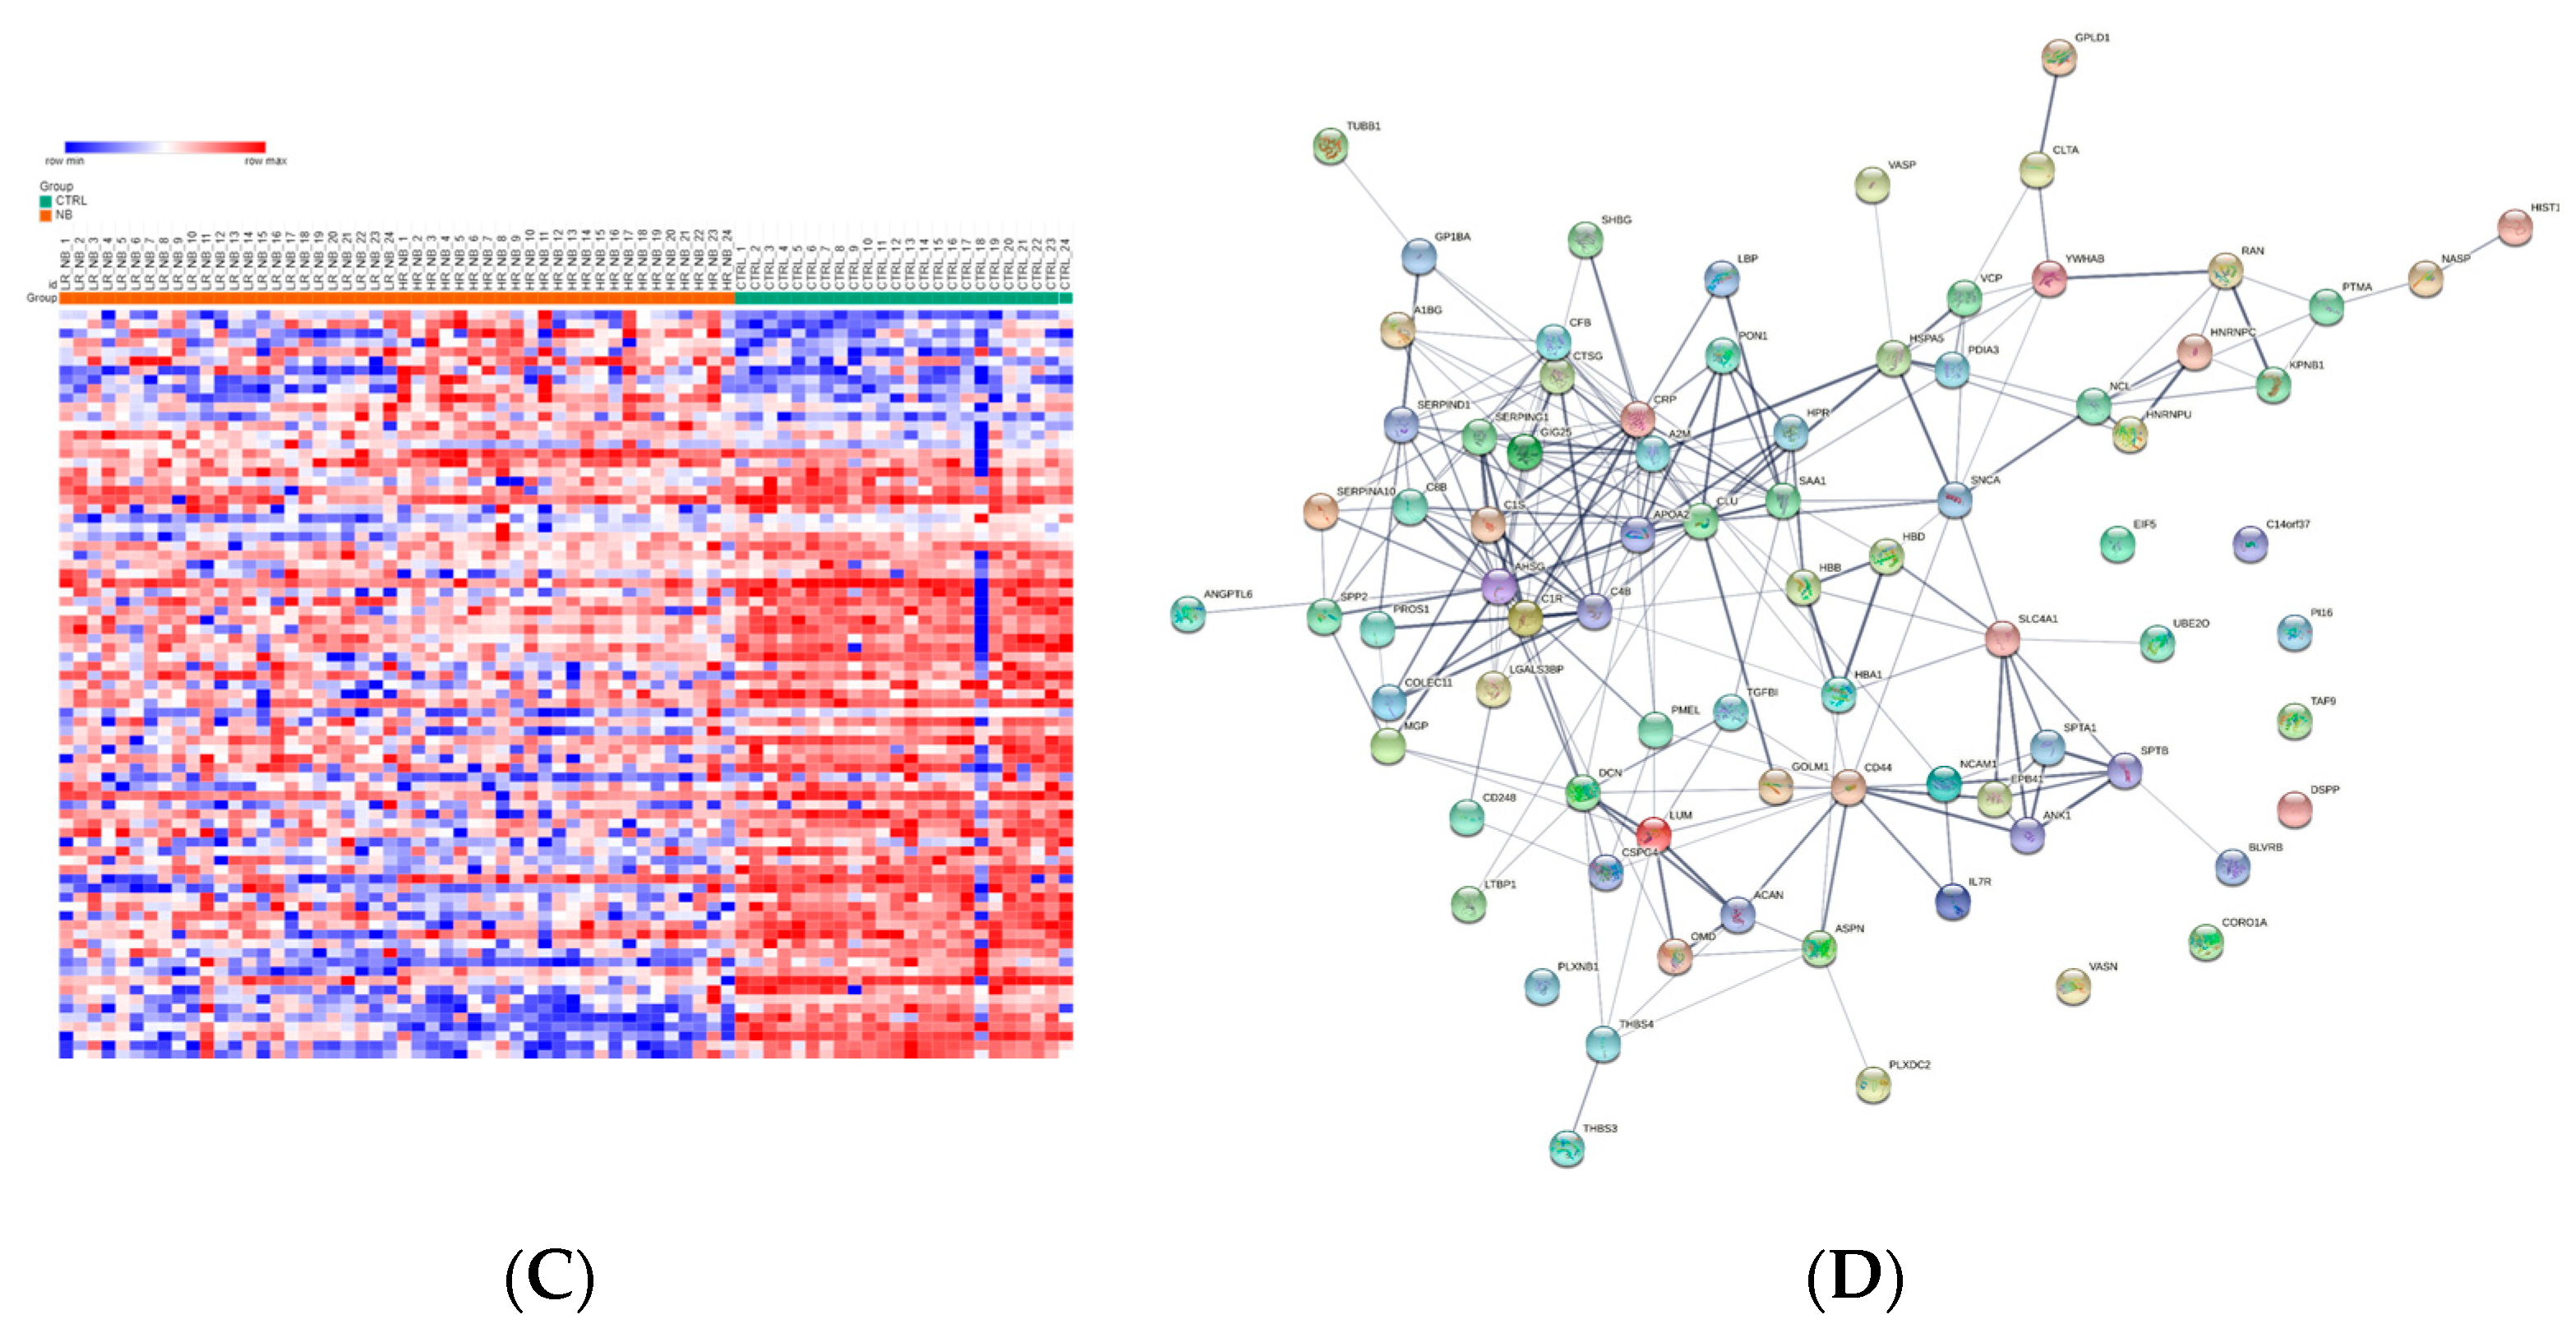
3.3. Differentially Expressed Exo-Prots in the NB Patients

Exo-prots showing at most 30% missing values were retained for imputation, while the rest were filtered out (See Section 2.4). The two imputation methods successfully substituted missing values with numeric values, thus defining two distinct datasets, hereafter referred to as the RF and QRILC datasets. Principal component analysis based on the protein expression profile of 24 HR-NB, 24 LR-NB and 24 CTRL subjects was performed in order to assess the presence of outlier samples. The results indicate that subject CTRL_18 was a potential outlier exclusively in the QRLIC dataset, but was not in the RF dataset. Therefore, we concluded that QRLIC imputation could have had a substantial impact on the proteomic profile of this specific subject. In order to identify specific deregulated Exo-prot biomarkers in the NB patients, we compared the Exo-prot expression profile of the NB and CTRL subjects using the SMAEXP tool in the RF and QRILC datasets. In the RF dataset, differential expression analysis identified 38 upregulated and 90 downregulated Exo-prots in the NB patients compared to the CTRL subjects (Supplementary Table S3), whereas in the QRILC dataset, 32 upregulated and 92 downregulated Exo-prots were identified (Supplementary Table S4). A Venn diagram of the statistically significantly modulated Exo-prots in the two datasets showed that 17 upregulated and 64 downregulated Exo-prots in the NB patients were shared by the two datasets. Meanwhile, 21 upregulated and 26 downregulated Exo-prots were exclusive to the RF dataset and 15 upregulated and 28 downregulated Exo-prots were exclusive to the QRILC dataset, respectively (Figure 3A). A complete list of the 17 upregulated and 64 downregulated Exo-prots in the NB patients identified in both datasets is reported in Table 3. Heatmap visualization based on the expression values of the 81 Exo-prots commonly regulated in the RF and QRILC datasets shows a clear separation between the NB and CTRL groups (Figure 3B,C). Notably, among the upregulated Exo-prots, we identified proteins that positively regulate tumor development and progression, such as neural cell adhesion molecule (NCAM) [28], nucleolin (NCL) [29] and galectin-3-binding protein (LGALS3BP) [30]. Among the downregulated Exo-prots, we identified proteins with oncosuppressive functions, such as lumican (LUM) [31], decorin (DCN) [32] and the vasodilator stimulated phosphoprotein (VASP) [33]. Network analysis was carried out on the 17 upregulated and 64 downregulated Exo-prots (Figure 3D), showing their strong interactions (PPI enrichment p-value <0.05). These findings establish various interactions between significantly modulated Exo-prots in Table 2 and indicate that these proteins are biologically connected as a group. Pathway analysis identified 153 significantly enriched biological processes and pathways in the NB patients (Supplementary Table S5). A selection of the most significantly enriched terms are listed in Table 4. These results show that the NB patients were characterized by aberrant expression of proteins involved mainly in inflammation and complement activation, immune response, cell proliferation and apoptosis and extracellular matrix (ECM) interactions.

3.4. Analysis of the Detectable Exo-Prots in HR-NB or LR-NB Based on the Distribution of Missing Values

To identify detectable Exo-prots in the HR-NB patients, we compared the Exo-prot expression profiles of the HR-NB and LR-NB patients. A Z-test was used to identify Exo-prots whose distribution of missing values was significantly different between the HR-NB and LR-NB patients. This analysis showed that 63 Exo-prots were exclusively expressed in the HR-NB patients, whereas 52 were exclusively expressed in the LR-NB patients (Z-score >2.6 or <−2.6; Supplementary Table S6). A heatmap based on the expression of these 115 Exo-prots showed a clear discrimination between the outcome groups, confirming the results of the Z-test analysis of proportions (Figure 2C). Among the exclusively detectable Exo-prots, we identified well-known inflammation biomarkers such as CPR, SAA1/SAA2 and PTX3 [34,35]. Network analysis showed statistically significant interactions among 115 Exo-prots (PPI enrichment p-value <0.05; Figure 2D). Pathway analysis identified 205 significantly enriched processes in the NB patients (Supplementary Table S7). A selection of the most significantly enriched terms are listed in Table 5. These results show that the identified Exo-prots in the HR-NB patients are mainly involved in immune responses, inflammation, cell migration, apoptosis and cytoskeletal organization.

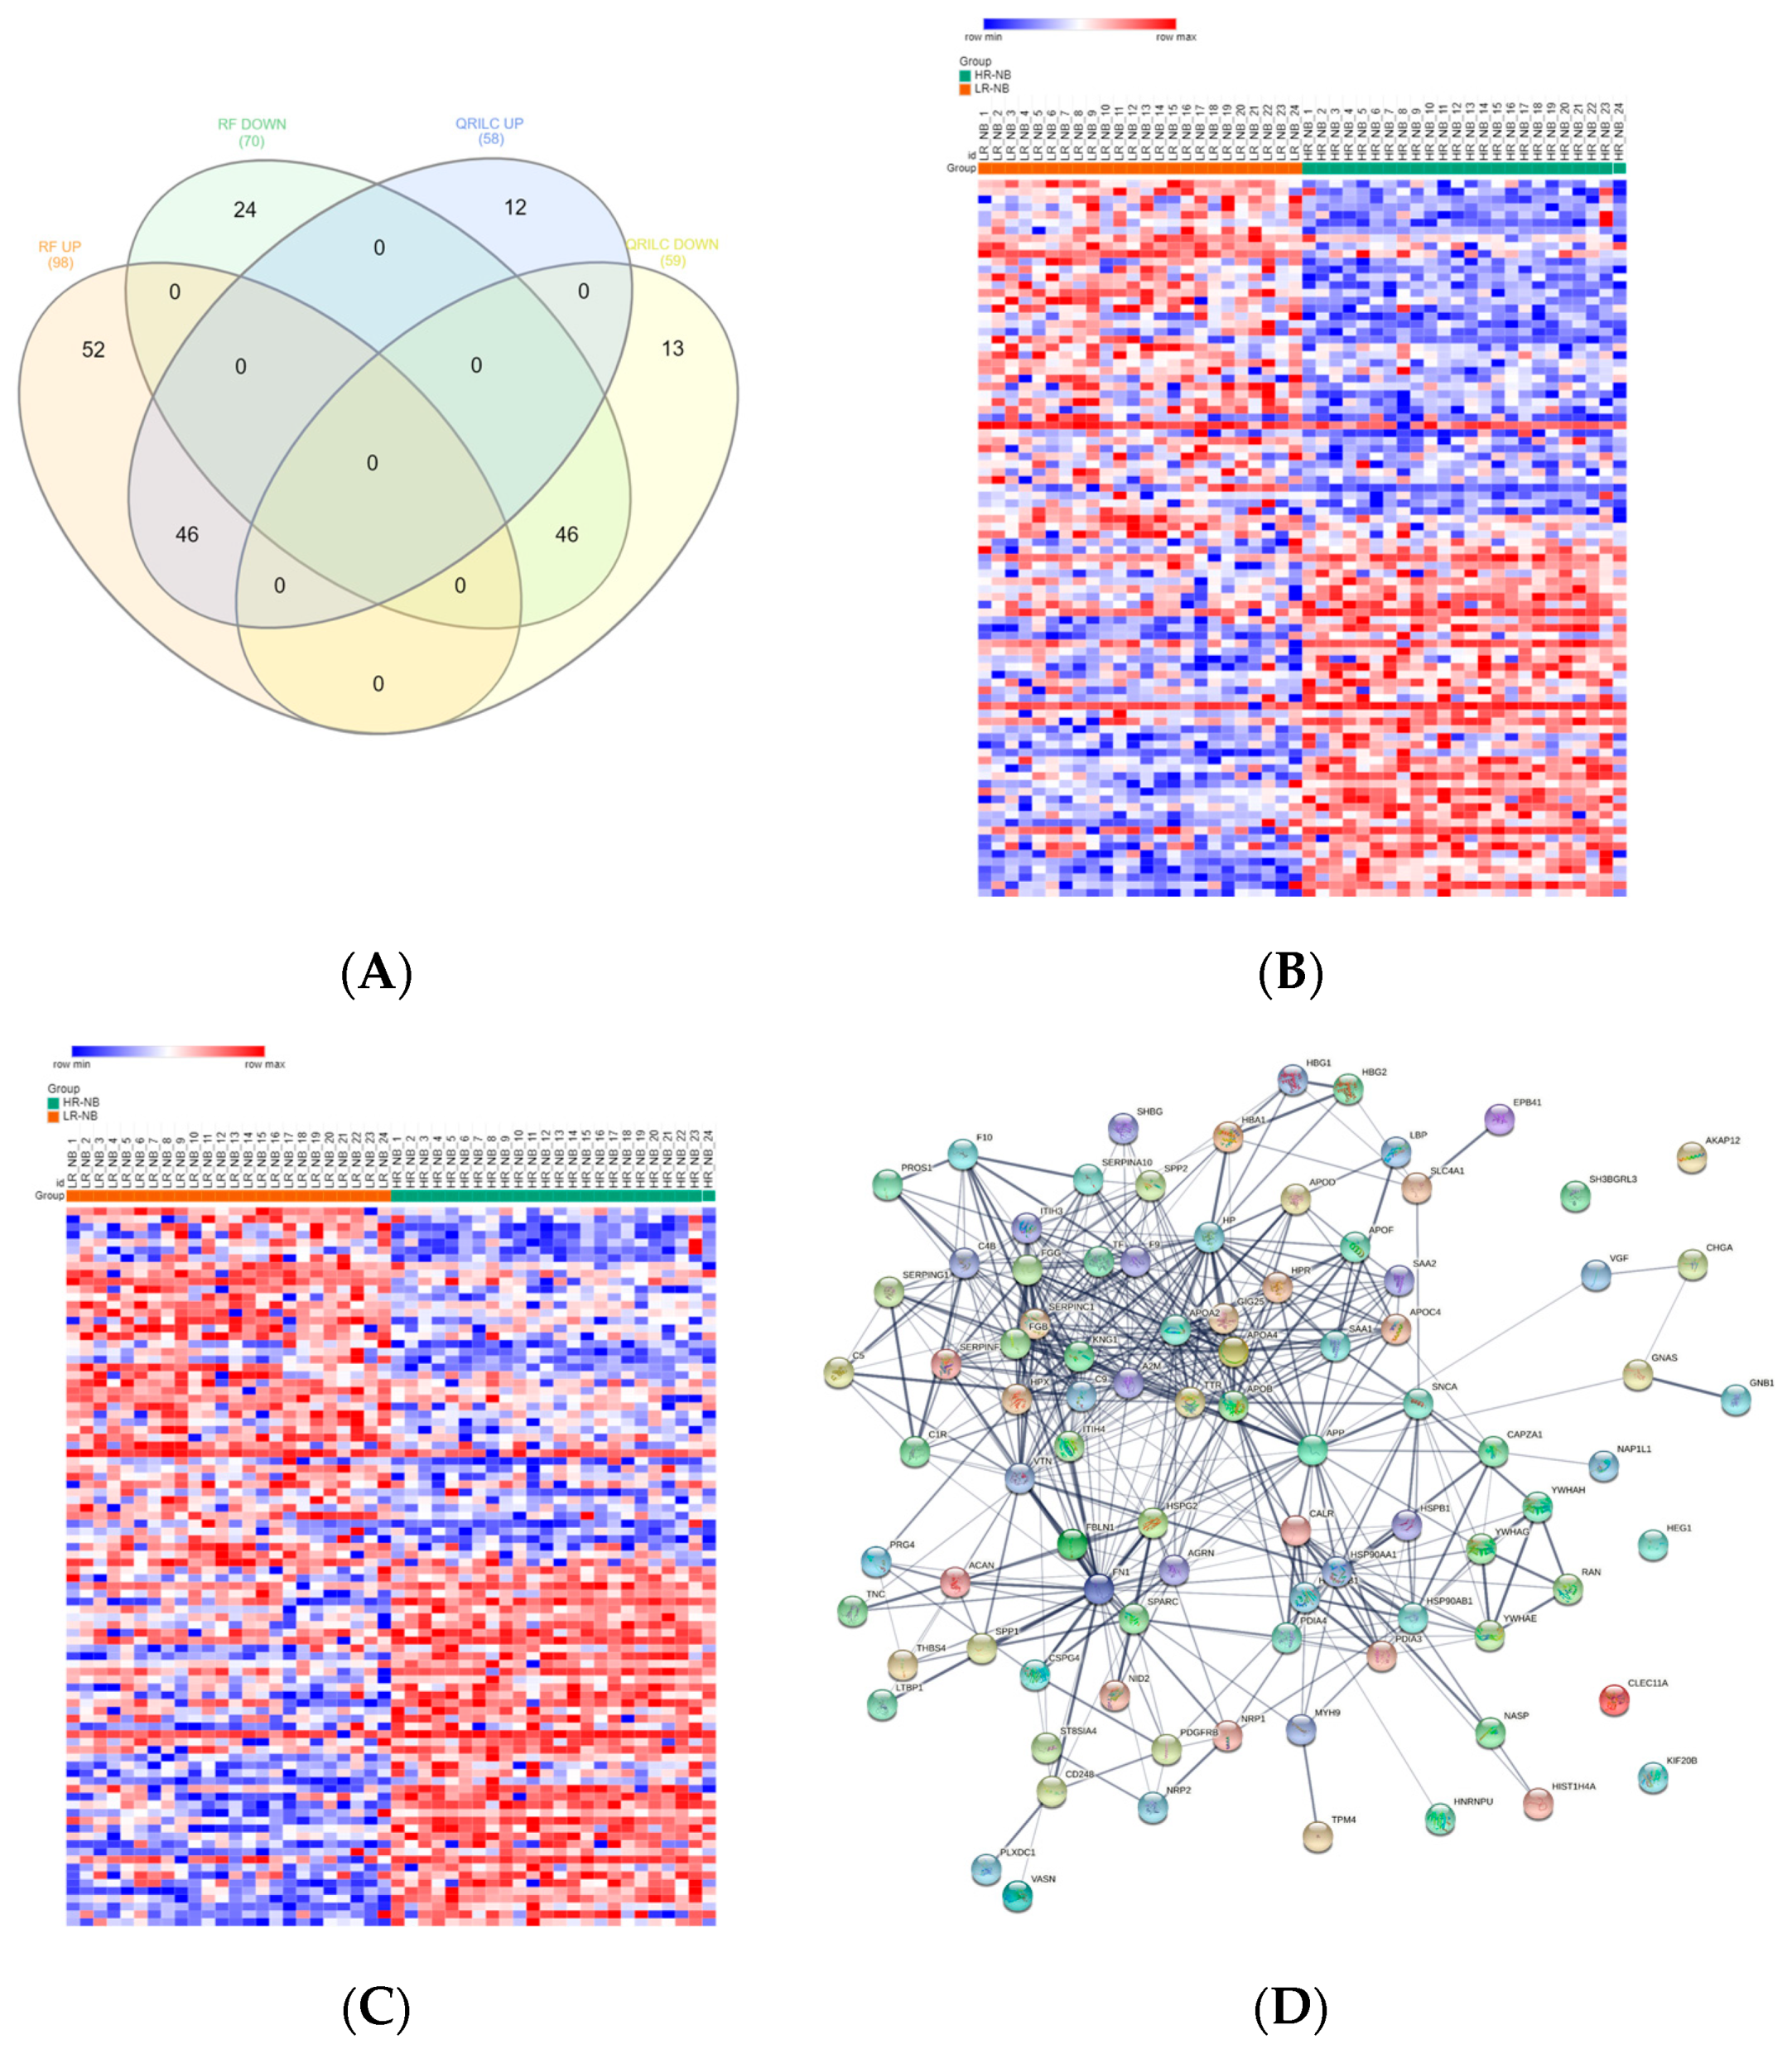
3.5. Differentially Expressed Exo-Prots in the HR-NB Patients

To identify deregulated Exo-prots in the HR-NB patients, we analyzed the Exo-prot expression profiles between the HR-NB and LR-NB patients using the SMAEXP tool in the RF or QRILC dataset. In the RF dataset, the analysis identified 98 upregulated and 70 downregulated Exo-prots in the HR-NB patients compared to the LR-NB patients (Supplementary Table S8), whereas in the QRILC dataset, 58 upregulated and 59 downregulated Exo-prots were identified (Supplementary Table S9). A Venn diagram of the deregulated Exo-prots in the two datasets showed that 46 upregulated and 46 downregulated Exo-prots in the HR-NB patients were common between the two datasets. On the contrary, 52 upregulated and 24 downregulated Exo-prots were exclusive to the RF dataset and 12 upregulated and 13 downregulated Exo-prots were exclusive to the QRILC dataset, respectively (Figure 4A). A complete list of 46 upregulated and 46 downregulated Exo-prots in the HR-NB patients identified in both datasets is reported in Table 6. Heatmap visualization of the expression values shows a clear separation between the HR-NB and LR-NB groups (Figure 4B,C). In the HR-NB patients, we observed the upregulation of proteins that positively regulate cell migration and metastasis: Myosin-9 (MYH9) [36,37], fibronectin (FN1) [38] and latent-transforming growth factor-beta-binding protein 1 (LTBP1) [39]. Among the downregulated Exo-prots, we identified proteins exerting antitumoral effects: Calreticulin (CALR) [40] and A-kinase anchor protein 12 (AKAP12) [41,42,43]. Network analysis was carried out on the 46 upregulated and 46 downregulated Exo-prots in the HR-NB patients (Figure 4D). These findings establish statistically significant interactions among the deregulated Exo-prots in Table 6 and indicate that these proteins are biologically connected as a group (PPI enrichment p-value <0.05). Pathway analysis identified 482 significantly enriched biological processes and pathways in the HR-NB patients (Supplementary Table S10). A selection of the most significantly enriched terms is reported in Table 7. These results show that the Exo-prots modulated in the HR-NB patients are involved not only in inflammation, immune response and cell proliferation, but also specifically in cell migration, adhesion and motility, as well as in angiogenic processes. Our data suggest that Exo-prots may promote the metastatic properties of HR-NB tumors.

3.6. ROC Analysis of the Diagnostic Value of the Exo-Prots in the NB and CTRL Subjects and the Prognostic Significance of the Exo-Prots in the HR-NB and LR-NB Patients

In order to assess the sensitivity and specificity of the potential biomarkers, we performed ROC analysis on the selected Exo-prots among those found to be significantly differentially expressed in the NB and HR-NB patients. Analysis was performed using both the RF and QRILC datasets. NCAM, NCL, LGALS3BP, LUM, DCN and VASP were studied for their potential diagnostic value in NB, whereas MYH9, FN1, LTBP1, CALR and AKAP12 were investigated for their prognostic value in HR-NB. The area under the curve (AUC) was used to measure the degree of separability of the Exo-prots between the NB and CTRL or HR-NB and LR-NB patients. The results show that NCAM (RF: AUC 0.83; QRILC: AUC 0.83, both p < 0.0001; Figure 5A), NCL (RF: AUC 0.85, QRILC: AUC 0.83, both p < 0.0001; Figure 5B), LUM (RF: AUC 0.77, p = 0.0002/QRILC: AUC 0.77, p = 0.0002; Figure 5C) and VASP (RF: AUC 0.8, QRILC: AUC 0.85, both p < 0.0001; Figure 5D) had the highest AUCs and p-values, indicating a robust and significant diagnostic value for NB patients. Meanwhile, LGALS3BP (RF: AUC 0.65, p = 0.03/QRILC: AUC 0.65, p = 0.03; Figure 5E) and DCN (RF: AUC 0.75, p = 0.0005/QRILC AUC 0.71, p = 0.003; Figure 5F) have a low but significant AUC, indicating a lower diagnostic value. We also investigated whether the combination of Exo-prots could improve the discriminatory power of these markers taken singularly. We applied the generalized linear model (GLMNET) algorithm (see Material and Methods). Our findings show that the discriminatory power of the combined model was higher than that obtained by each biomarker taken singularly in both datasets (RF: AUC 0.97, QRILC: AUC 0.97, both p < 0.0001; Figure 5G).
Comparing the HR-NB and LR-NB samples, ROC analysis evidenced that MYH9 (RF: AUC 0.95, QRILC: AUC 0.92, both p < 0.0001; Figure 6A), FN1 (RF: AUC 0.89, QRILC: AUC 0.89, both p < 0.0001; Figure 6B) and CALR (RF: AUC 0.94, QRILC: AUC 0.94, both p < 0.0001; Figure 6C) had high AUCs and low p-values, indicating a robust and significant prognostic value. LTBP1 (RF: AUC 0.78, p = 0.0007/QRILC AUC 0.71, p = 0.01; Figure 6D) and AKAP12 (RF: AUC 0.74; p = 0.005/QRILC: AUC 0.84, p < 0.0001; Figure 6E) had lower AUCs, but were still significant, indicating a lower prognostic value. Similarly, as performed between the NB and CTRL groups, we assessed whether the combination of Exo-prots could improve the discriminatory power of these markers taken singularly. We applied the GLMNET algorithm and showed that, again, the discriminatory power of the combined model was higher than that obtained by each single marker in both datasets (RF: AUC 0.99, QRILC: AUC 0.97, both p < 0.0001; Figure 6F).
In conclusion, these results indicate that the expression of exosomal NCAM, NCL, LUM and VASP has evident diagnostic value in discriminating NB patients from CTRL subjects, both taken singularly or in combination, suggesting that these non-invasive Exo-prot biomarkers may be used as novel diagnostic tools and provide new insights in the mechanisms of neuroblastoma pathogenesis. Meanwhile, the expression of MYH9, FN1, LTBP1, CALR and AKAP12 is effective in discriminating HR-NB from LR-NB patients, indicating that these non-invasive biomarkers may be used to detect patients at risk of developing aggressive tumor phenotypes.

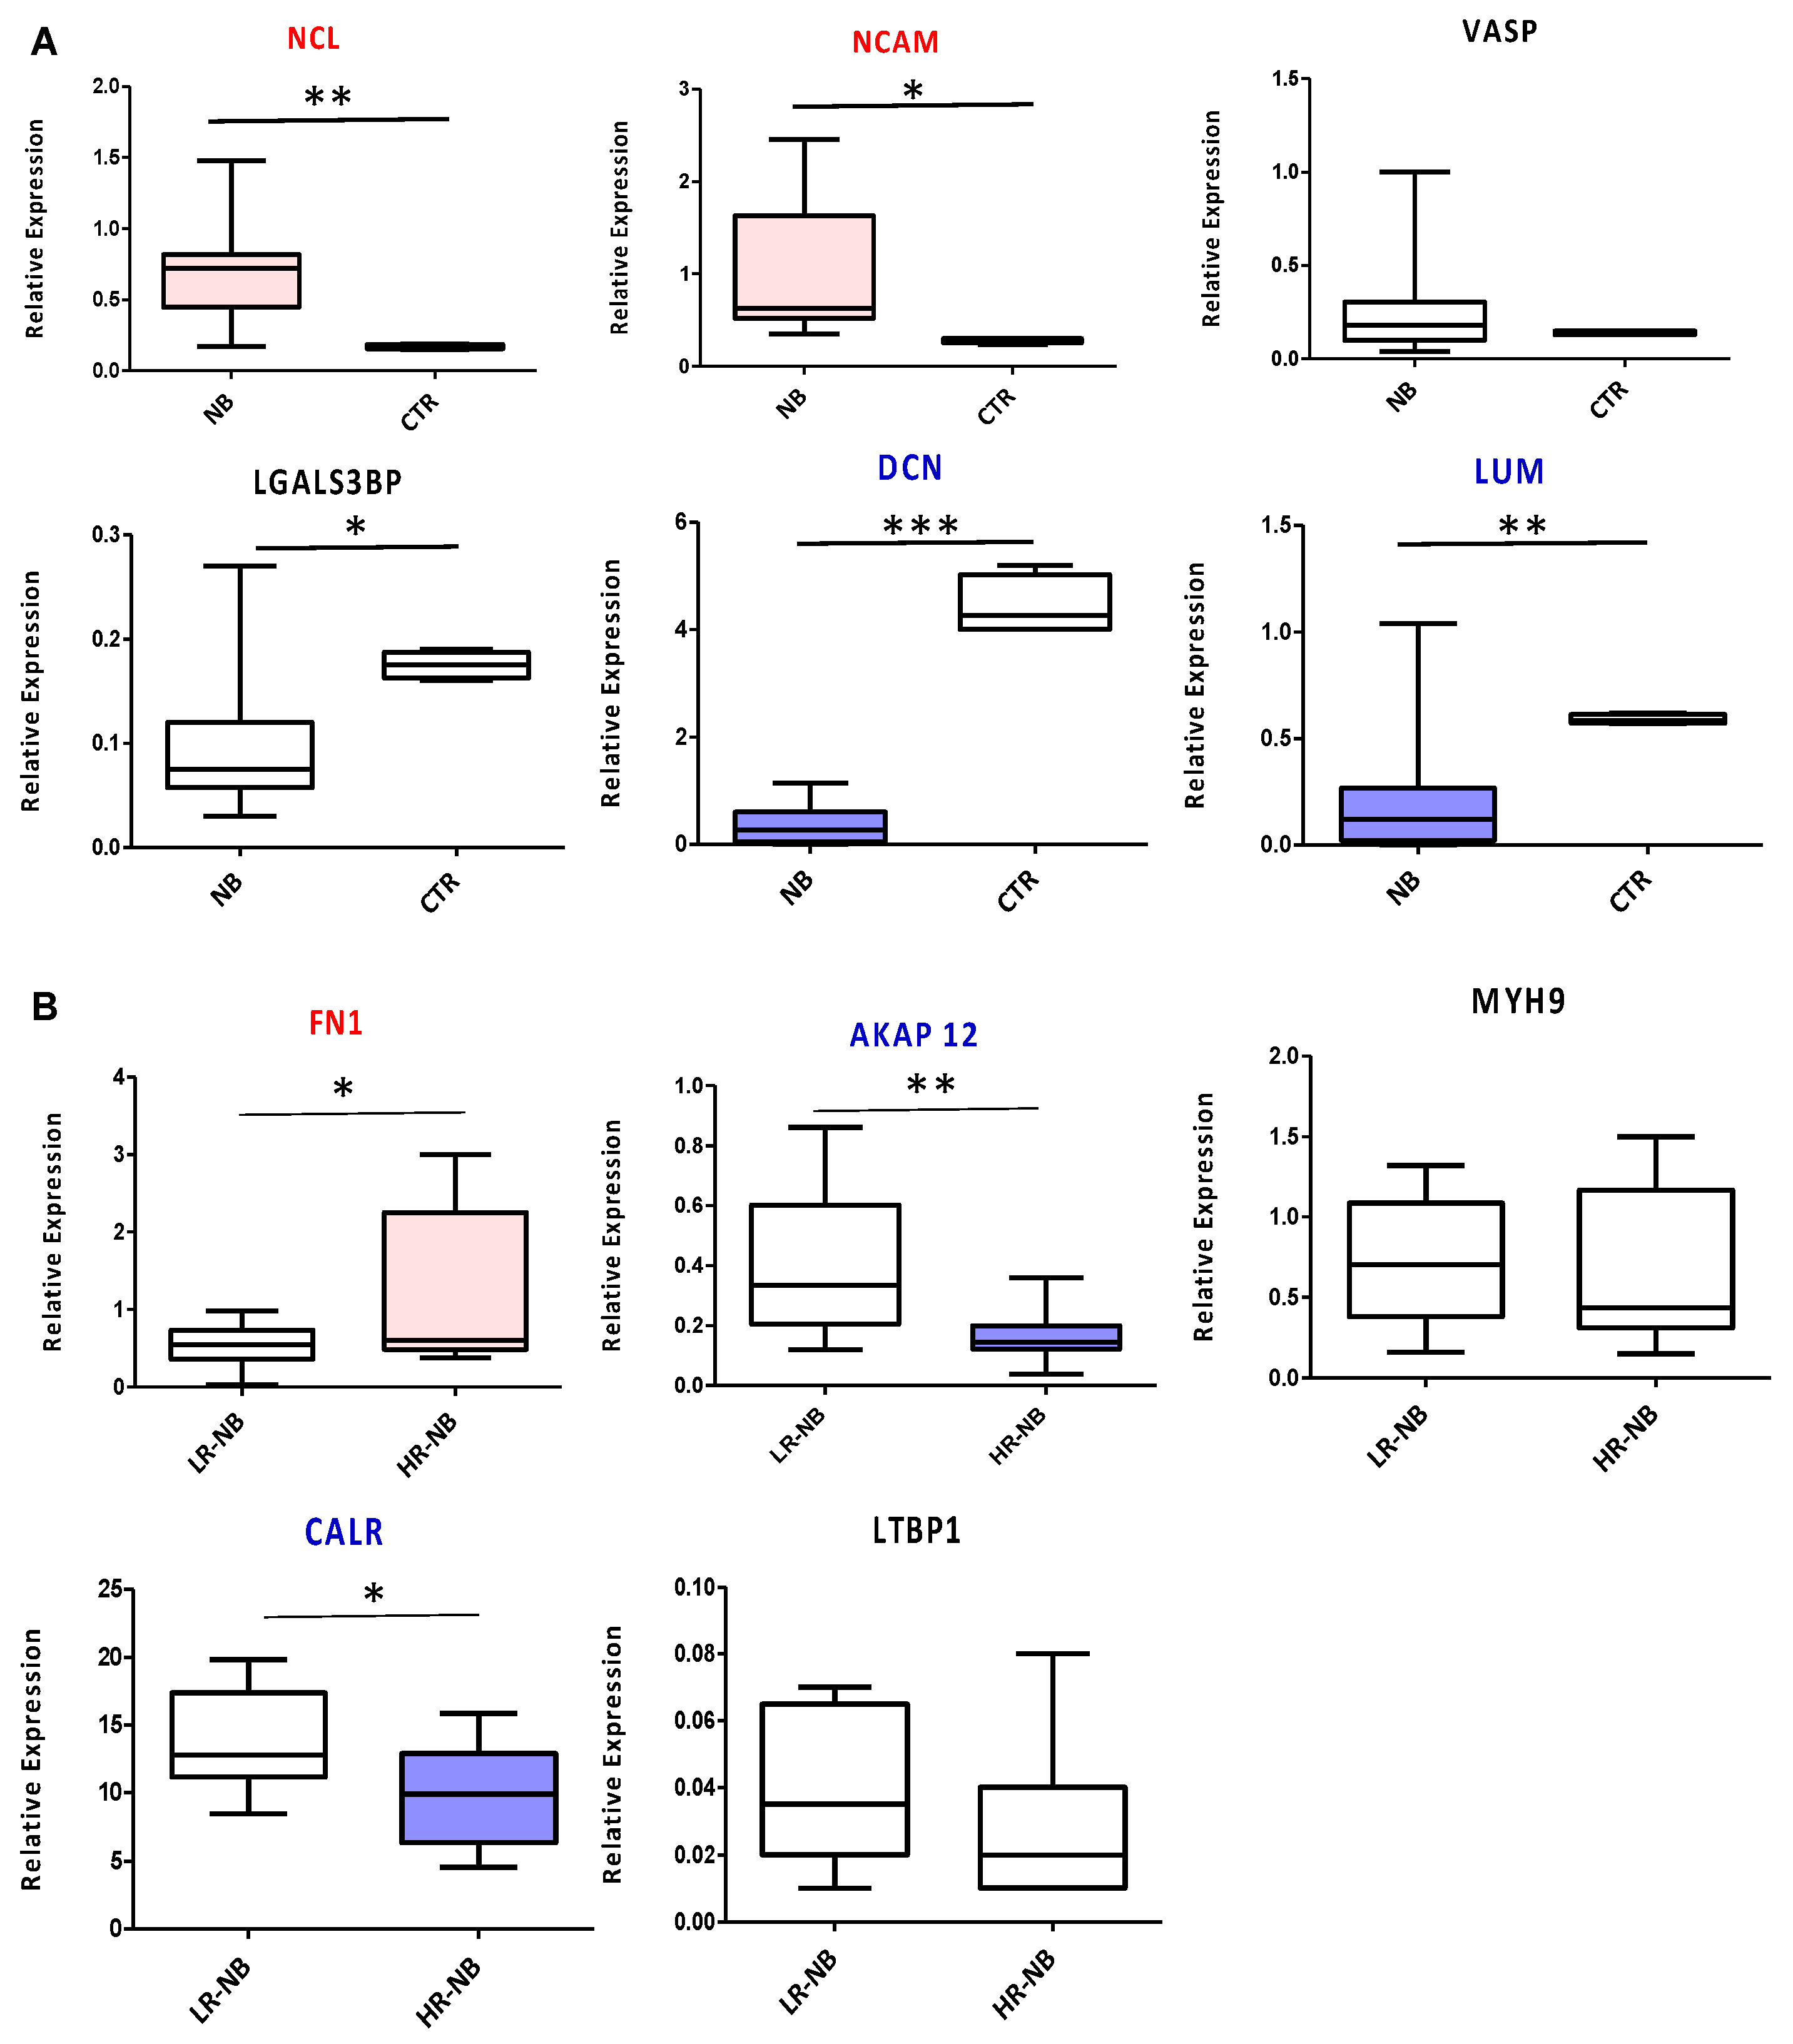
3.7. Validation of the Key Selected Proteins by Gene Expression

To validate the diagnostic and prognostic Exo-prots identified by ROC analysis, we measured the expression of the corresponding coding genes in tissue biopsies of the NB primary tumors of 10 HR and 10 LR cases. We used tissue samples of age-matched non-oncologic subjects as the control. NCL and NCAM were confirmed as diagnostic markers, significantly overexpressed in NB tumors compared to control samples (p < 0.01 and p < 0.05, respectively). The diagnostic power of DCN and LUM was confirmed as well, with a significant downregulation of both markers in NB patients (p < 0.001 and p < 0.01, respectively) (Figure 7A). VASP did not show any significant modulation between the two biological groups considered, while LGALS3BP, contrary to the exosome data, was downregulated in the NB primary tumor tissues (Figure 7A). From a prognostic point of view, significant FN1 overexpression (p < 0.05) was confirmed in the HR-NB compared to LR-NB patients, while MYH9 and LTBP1 did not report any significant modulation (Figure 7B). In agreement with the proteomic data, AKAP12 and CALR were significantly decreased in HR disease (p < 0.05 and p < 0.01, respectively) (Figure 7B).

4. Discussion

In the present study, we characterized the protein cargo of the exosomes derived from patients with LR-NB and HR-NB tumors and age-matched control subjects to identify novel non-invasive diagnostic or prognostic biomarkers.
We applied LC-MS-based proteomics, a technique that has increased the knowledge about the protein content of extracellular vesicles in recent years [44]. In vitro proteomics studies on neuroblastoma-derived exosomes have been conducted to determine their role in tumor progression and metastasis formation [45,46,47,48]. However, these studies have not been carried out on patient-derived samples, thus limiting their translational applicability to the clinical settings.
The proteomic profile of each patient and CTRL subject was analyzed with two distinct bioinformatic approaches—the distribution of missing values and differential expression analysis. Distribution analysis is expected to detect Exo-prots in which missing values are exclusively detectable in one of the biological groups, whereas differential expression analysis aims to assess the deregulation of Exo-prot expression in a large majority of samples. We considered that missing value distribution analysis could provide useful insights into tumor development because Exo-prots that are undetectable or detectable only in NB patients could actually have diagnostic value and potentially a biological meaning. Distribution analysis can identify distinct Exo-prots from those found via differential expression analysis because no filter is applied to the number of missing values. On the contrary, the differential expression analysis was based on Exo-prots with a maximum of 30% missing data that underwent missing value imputation. Thus, the results of both analyses were complementary.
Analysis of the distribution of missing values was instrumental to identify Exo-prots in NB patients involved in the stress response, immune system regulation, inflammation, cell motility and cytoskeletal rearrangements. Among the exclusively detectable Exo-prots in the NB patients, we identified the nucleolar protein NPM1 as being overexpressed in hematologic and solid tumors [49] and ZYX involved in focal adhesion and in the regulation of actin cytoskeleton with a role in cell motility and tumor invasion [50].
The comparison between HR-NB and LR-NB patients identified the C-reactive protein (CRP), recognized as a biomarker of inflammation, whose elevated serum level has been shown to be associated with poor prognosis in many cancers and in NB [51]; serum amyloid A1/2 (SAA1/SAA2), which have been found to be prognostic in many solid tumors, and whose expression, in combination with high level of CRP, can stratify patients with high-risk early-stage melanoma [34]; pentraxin 3 (PTX3), which is reported to be associated with the PI3K/AKT/mTOR signaling pathway to induce tumor cell proliferation and apoptosis and whose overexpression results in poor survival outcomes in many tumors [52]. Although the missing value distribution analysis suggested the pro-tumoral activity of deregulated Exo-prots, missing data can negatively affect statistical power [24]. Thus, imputation of the missing values is usually performed to obtain robust results [24]. Since RF and QRILC are indicated among the most accurate imputation methods [19], we decided to use both approaches to perform missing value imputation.
Differential expression analysis was instrumental in identifying Exo-prots in the NB patients involved in tumor-promoting processes, such as inflammation and complement activation, immune response, cell proliferation and apoptosis and ECM interaction. Among the upregulated Exo-prots, we identified NCAM, an adhesion molecule known to be highly expressed in NB tumors and associated with increased metastatic capacity [28], and LGALS3BP, a glycosylated protein that has migratory-promoting activity [30]. Moreover, NCL was upregulated in the NB patients; this phosphoprotein regulates several biological processes, including cell proliferation and apoptosis, DNA and RNA metabolism, ribosomal RNA maturation and ribosome assembly [29]. Of note, a high expression of NCL has recently been demonstrated to be an unfavorable independent prognostic factor in NB [53]. Hence, the demonstration of NCL overexpression in exosomes released in the circulation of patients might be relevant to better understand its role in driving NB tumor progression. Among the downregulated proteins, we identified two proteoglycans belonging to the small leucine-rich proteoglycan (SLRP) family: LUM and DCN. The former exerts an oncosuppressive function by impairing metalloproteinase 14 (MMP-14)-mediated cell migration [31], while the latter can inhibit tumor cell growth and migration and, simultaneously, induce the autophagic process of stromal cells, thus exerting a double action that results in a sharp oncosuppressive function [32]. We also reported the downregulation of VASP, an assembly regulatory protein interacting with ZYX, and regulating cell adhesion and migration [33]. Interestingly, the absence of VASP/ZYX interaction impairs cell adhesion and promotes cell migration and invasion. Moreover, VASP affects the phosphorylation of focal adhesion kinase (FAK), which has anti-apoptotic properties, thus being involved in the regulation of the apoptotic process [33]. Tumor-derived exosomes carry on their surface specific tumor markers. Disialoganglioside GD2 is a marker associated with neuroectoderm-derived cancers and has been identified on the surface of exosomes isolated from melanoma [54] and neuroblastoma patients [8]. Among the Exo-prot cargo, we were not able to observe specific enzymes involved in the ganglioside metabolic pathway differentially expressed between the NB and CTRL subjects. This result was also confirmed by pathway analysis, which did not reveal the enrichment of ganglioside synthesis/catabolism processes.
The comparison between HR-NB and LR-NB patients identified Exo-prots upregulated and downregulated in patients with HR-NB disease. Network and pathway analyses revealed that such proteins are connected and act in common biological systems, exerting a major function in pathways that are not only involved in oncogenesis, such as inflammation, cell proliferation and immune response regulation, but also in the acquisition of tumor aggressive traits, such as loss of cell adhesion, migration and angiogenesis. In particular, we observed the upregulation of MYH9, which regulates cell polarity and cytoskeleton [36,37] and has been shown to enhance cell migration in breast cancer cells [37]. Indeed, the exosome-mediated transport of MYH9 is able to directly promote macrophage migration, resulting in increased macrophage infiltration at the tumor site and, consequently, in cancer cell metastasis formation [36,37]. The significantly deregulated Exo-prots in the HR-NB patients included molecules involved in ECM interaction, a key aspect for the establishment of cell-to-cell communication, with a major impact on the definition of the tumor microenvironment required for tumor growth and dissemination. Interestingly, among the upregulated Exo-prots in the HR-NB patients, we identified FN1 and LTBP1. The former is a glycoprotein that exerts its oncogenic role mainly by upregulating cell proliferation and inhibiting apoptosis [38,55] and by regulating angiogenesis, contributing to the direction of blood vessel formation and stimulating cell differentiation toward an endothelial phenotype [38]. LTBP1 is an extracellular matrix protein that enhances cell migration and invasion and promotes the epithelial-to-mesenchymal transition (EMT), a process at the basis of the acquisition of cell motility and invasion properties, leading to metastasis formation [39]. In esophageal squamous cell carcinoma, a positive correlation between FN1 and LTBP1 has been demonstrated [39]. Indeed, while LTBP1 was mainly expressed in tumor tissues, FN1 was highly expressed in fibroblasts of the stroma, suggesting a potential correlation between the overexpression of the two genes, which synergistically act to induce EMT. Among the downregulated proteins, we identified CALR, a protein localized in the endoplasmic reticulum and surveilling proper protein folding, cell adhesion, integrin signaling and antigen presentation [40]. CALR exposed on the surface of tumor cells can trigger phagocytosis and initiate the anticancer immune response [40]. Hence, the downregulation of CALR can have oncogenic effects because of the impairment of physiological homeostasis and the reduced stimulation of immune surveillance against cancer cells [40]. We also observed downregulation of AKAP12, a scaffold protein belonging to the A-kinase anchoring protein (AKAP) family and regulating signal transduction cascade. In particular, AKAP members drive the compartmentalization of cAMP-dependent protein kinases (PKAs) to different subcellular locations to ensure the specificity of PKA-mediated signal transduction [56]. AKAP12 exerts a tumor-suppressive function through the negative modulation of angiogenesis, cell proliferation and migration by preventing PKC activation [57]. Thus, reduced expression of AKAP12 may result in the activation of pro-tumoral and metastatic pathways.
Importantly, ROC analysis demonstrated that the exosomal levels of NCAM, NCL, LUM and VASP have significant diagnostic power in discriminating NB patients from CTRL subjects. High levels of NCAM and NCL have already been described as unfavorable prognostic factors in NB [53,58], and herein we reported, for the first time, their significant upregulation within the exosomes derived from plasma samples of NB patients at diagnosis. In addition, our results indicated that MYH9, FN1, CALR, AKAP12 and, with a lower performance, LTBP1 expression can discriminate HR-NB and LR-NB patients with high specificity and sensitivity. Interestingly, FN1 overexpression has been associated with mesenchymal phenotype [59], which confers chemoresistance to NB cells. Thus, the exosome-mediated delivery of such proteins that we reported to be overexpressed in HR-NB patients could be involved in therapy-resistant mechanisms. Our results showed that the combination of all Exo-prot diagnostic and prognostic markers outperformed each single marker. Therefore, measuring the whole panel of such molecules will provide higher specificity and sensitivity to the analysis. Importantly, the overexpression of NCL and NCAM and the downregulation of DCN and LUM in the NB patient-derived exosomes compared to the CTRL samples was confirmed also in primary tumor tissues. Consistency between the proteomics data and tumor gene expression was also reported for the upregulation of FN1 and the downregulation of CALR and AKAP12 in the HR-NB patients compared to the LR-NB cases. The lack of correspondence between exosomes and tumor tissues for VASP, LGALS3BP, MYH9 and LTBP1 could be due to the fact that these vesicles are loaded through active mechanisms [60]. Thus, the differential expression specifically observed in the exosomes may be due to the cargo selection, which does not necessarily reflect the tissue gene expression levels. Functional experiments and a prospective clinical trial should be performed to increase our knowledge of the biological mechanisms involved in NB formation and development and to robustly assess the applicability of Exo-prots for improving NB patient diagnosis and prognosis.

5. Conclusions

We characterized the Exo-prot cargo of HR, LR-NB and CTRL subjects and identified significantly differentially expressed molecules. We assessed the diagnostic significance of specific deregulated Exo-prots and we identified highly accurate markers differentiating NB vs. CTRL samples and HR vs. LR-NB patients. The present study is the first, to the best of our knowledge, to characterize the protein content of exosomes derived from the plasma samples of NB patients. The results showed that these vesicles contain differentially expressed Exo-prots that are mainly involved in cancer-associated pathways and in the acquisition of aggressive tumor features, thus playing a major role in driving oncogenesis and tumor progression. Importantly, we demonstrated that a few specific Exo-prots are able to discriminate, with high accuracy, NB patients from CTRL samples, whereas others are able to precisely distinguish HR-NB from LR-NB patients. These results provide evidence of the potential relevance of liquid biopsies to integrate the diagnosis of NB tumors and improving risk stratification to help refine patient treatment.

Supplementary Materials

The following supporting information can be downloaded at: https://www.mdpi.com/article/10.3390/cells12212516/s1. Table S1: List of the Exo-prots exclusively expressed in the NB patients compared to the CTRL samples; Table S2: Significantly enriched processes associated with the Exo-prots exclusively detectable in the NB and CTRL subjects; Table S3: Differentially expressed Exo-prots between the NB and CTRL subjects in the RF dataset; Table S4: Differentially expressed Exo-prots between the NB and CTRL subjects in the QRILC dataset; Table S5: Significantly enriched processes associated with the Exo-prots regulated in the comparison between the NB and CTRL samples; Table S6: List of Exo-prots exclusively detectable in the HR-NB or LR-NB samples; Table S7: Significantly enriched processes associated with the Exo-prots exclusively detectable in the HR-NB or LR-NB samples; Table S8: Differentially expressed Exo-prots between the HR-NB and LR-NB subjects in the RF dataset; Table S9: Differentially expressed Exo-prots between the HR-NB and LR-NB subjects in the QRILC dataset; Table S10: Significantly enriched processes associated with the Exo-prots regulated in the comparison between the HR-NB and LR-NB samples.

Author Contributions

Conceptualization, M.M., F.R., D.C. and M.C.B.; methodology, M.M., F.R., D.C., M.B., A.P., M.A., C.R., D.S. and A.G.; software, D.C. and A.P.; formal analysis, M.M., F.R., D.C., A.P., M.B., M.C.B. and A.E.; data curation, M.M., F.R., D.C., A.E. and M.C.B.; writing—original draft preparation, M.M. and D.C.; writing—review and editing, F.R., A.E. and M.C.B.; supervision, M.M., F.R., D.C., A.E. and M.C.B.; funding acquisition, F.R., A.E. and M.C.B. All authors have read and agreed to the published version of the manuscript.

Funding

This research was funded by Fondazione Umberto Veronesi, Fondazione Italiana per la Lotta al Neuroblastoma O.N.L.U.S., the Italian Ministry of Health (“Ricerca Corrente”), and the Italian Association for Cancer Research (AIRC) (IG-17459).

Institutional Review Board Statement

This study was conducted in accordance with the Declaration of Helsinki, and approved by the Ethics Committee of IRCCS Istituto Giannina Gaslini (verbale n.11/2016, date 15 December 2016).

Informed Consent Statement

Informed consent was obtained from all subjects involved in the study.

Data Availability Statement

The proteomic data have been deposited to the ProteomeXchange Consortium via the PRIDE [61] partner repository with the dataset identifier PXD042422.

Acknowledgments

The authors thank Fondazione Italiana per la Lotta al Neuroblastoma O.N.L.U.S., Fondazione Umberto Veronesi and the Italian Association for Cancer Research. The authors also thank the BIT-Gaslini Biobank (IRCCS Istituto Giannina Gaslini, Genova, Italy), for providing the biological specimens, and the PhD course in “Clinical and Experimental Immunology” of the University of Genova, currently attended by the first author (M.M).

Conflicts of Interest

The authors declare no conflict of interest. The funders had no role in the design of the study; in the collection, analyses, or interpretation of data; in the writing of the manuscript, or in the decision to publish the results.

References

  1. Cross, D.; Burmester, J.K. The Promise of Molecular Profiling for Cancer Identification and Treatment. Clin. Med. Res. 2004, 2, 147. [Google Scholar] [CrossRef] [PubMed]
  2. Wang, J.; Chang, S.; Li, G.; Sun, Y. Application of Liquid Biopsy in Precision Medicine: Opportunities and Challenges. Front. Med. 2017, 11, 522–527. [Google Scholar] [CrossRef] [PubMed]
  3. Mathai, R.A.; Vidya, R.V.S.; Shrikar, B.; Thomas, L.; Udupa, K.; Kolesar, J.; Rao, M. Potential Utility of Liquid Biopsy as a Diagnostic and Prognostic Tool for the Assessment of Solid Tumors: Implications in the Precision Oncology. J. Clin. Med. 2019, 8, 373. [Google Scholar] [CrossRef] [PubMed]
  4. Bedard, P.L.; Hansen, A.R.; Ratain, M.J.; Siu, L.L. Tumour Heterogeneity in the Clinic. Nature 2013, 501, 355–364. [Google Scholar] [CrossRef] [PubMed]
  5. Chowell, D.; Napier, J.; Gupta, R.; Anderson, K.S.; Maley, C.C.; Wilson Sayres, M.A. Modeling the Subclonal Evolution of Cancer Cell Populations. Cancer Res. 2018, 78, 830–839. [Google Scholar] [CrossRef] [PubMed]
  6. Karn, V.; Ahmed, S.; Tsai, L.W.; Dubey, R.; Ojha, S.; Singh, H.N.; Kumar, M.; Gupta, P.K.; Sadhu, S.; Jha, N.K.; et al. Extracellular Vesicle-Based Therapy for COVID-19: Promises, Challenges and Future Prospects. Biomedicines 2021, 9, 1373. [Google Scholar] [CrossRef]
  7. Zhang, J.; Kumar, S.; Jayachandran, M.; Herrera Hernandez, L.P.; Wang, S.; Wilson, E.M.; Lieske, J.C. Excretion of Urine Extracellular Vesicles Bearing Markers of Activated Immune Cells and Calcium/Phosphorus Physiology Differ between Calcium Kidney Stone Formers and Non-Stone Formers. BMC Nephrol. 2021, 22, 204. [Google Scholar] [CrossRef]
  8. Morini, M.; Cangelosi, D.; Segalerba, D.; Marimpietri, D.; Raggi, F.; Castellano, A.; Fruci, D.; De Mora, J.F.; Cañete, A.; Yáñez, Y.; et al. Exosomal MicroRNAs from Longitudinal Liquid Biopsies for the Prediction of Response to Induction Chemotherapy in High-Risk Neuroblastoma Patients: A Proof of Concept SIOPEN Study. Cancers 2019, 11, 1476. [Google Scholar] [CrossRef]
  9. Resaz, R.; Cangelosi, D.; Morini, M.; Segalerba, D.; Mastracci, L.; Grillo, F.; Bosco, M.C.; Bottino, C.; Colombo, I.; Eva, A. Circulating Exosomal MicroRNAs as Potential Biomarkers of Hepatic Injury and Inflammation in a Murine Model of Glycogen Storage Disease Type 1a. Dis. Model. Mech. 2020, 13, dmm043364. [Google Scholar] [CrossRef]
  10. Resaz, R.; Cangelosi, D.; Segalerba, D.; Morini, M.; Uva, P.; Bosco, M.C.; Banderali, G.; Estrella, A.; Wanner, C.; Weinstein, D.A.; et al. Exosomal MicroRNAs as Potential Biomarkers of Hepatic Injury and Kidney Disease in Glycogen Storage Disease Type Ia Patients. Int. J. Mol. Sci. 2022, 23, 328. [Google Scholar] [CrossRef]
  11. Raggi, F.; Bartolucci, M.; Cangelosi, D.; Rossi, C.; Pelassa, S.; Trincianti, C.; Petretto, A.; Filocamo, G.; Civino, A.; Eva, A.; et al. Proteomic Profiling of Extracellular Vesicles in Synovial Fluid and Plasma from Oligoarticular Juvenile Idiopathic Arthritis Patients Reveals Novel Immunopathogenic Biomarkers. Front. Immunol. 2023, 14, 1134747. [Google Scholar] [CrossRef] [PubMed]
  12. Raggi, F.; Cangelosi, D.; Consolaro, A.; Rossi, C.; Pelassa, S.; Cortese, K.; Gagliani, M.C.; Morini, M.; Segalerba, D.; Brignole, C.; et al. Extracellular Vesicle-derived MicroRNAs as Potential Biomarkers in Oligoarticular Juvenile Idiopathic Arthritis Patients: Methodological Challenges and New Perspectives. Clin. Transl. Med. 2022, 12, e1067. [Google Scholar] [CrossRef] [PubMed]
  13. Dejima, H.; Iinuma, H.; Kanaoka, R.; Matsutani, N.; Kawamura, M. Exosomal MicroRNA in Plasma as a Non-Invasive Biomarker for the Recurrence of Non-Small Cell Lung Cancer. Oncol. Lett. 2017, 13, 1256–1263. [Google Scholar] [CrossRef] [PubMed]
  14. Rodríguez-Martínez, A.; De Miguel-Pérez, D.; Ortega, F.G.; García-Puche, J.L.; Robles-Fernández, I.; Exposito, J.; Martorell-Marugan, J.; Carmona-Sáez, P.; Garrido-Navas, M.D.C.; Rolfo, C.; et al. Exosomal MiRNA Profile as Complementary Tool in the Diagnostic and Prediction of Treatment Response in Localized Breast Cancer under Neoadjuvant Chemotherapy. Breast Cancer Res. 2019, 21, 21. [Google Scholar] [CrossRef] [PubMed]
  15. Scavo, M.P.; Depalo, N.; Tutino, V.; De Nunzio, V.; Ingrosso, C.; Rizzi, F.; Notarnicola, M.; Curri, M.L.; Giannelli, G. Exosomes for Diagnosis and Therapy in Gastrointestinal Cancers. Int. J. Mol. Sci. 2020, 21, 367. [Google Scholar] [CrossRef]
  16. Kulak, N.A.; Pichler, G.; Paron, I.; Nagaraj, N.; Mann, M. Minimal, Encapsulated Proteomic-Sample Processing Applied to Copy-Number Estimation in Eukaryotic Cells. Nat. Methods 2014, 11, 319–324. [Google Scholar] [CrossRef]
  17. Cox, J.; Mann, M. MaxQuant Enables High Peptide Identification Rates, Individualized p.p.b.-Range Mass Accuracies and Proteome-Wide Protein Quantification. Nat. Biotechnol. 2008, 26, 1367–1372. [Google Scholar] [CrossRef]
  18. Blanck, S.; Marot, G. SMAGEXP: A Galaxy Tool Suite for Transcriptomics Data Meta-Analysis. Gigascience 2019, 8, giy167. [Google Scholar] [CrossRef]
  19. Wei, R.; Wang, J.; Su, M.; Jia, E.; Chen, S.; Chen, T.; Ni, Y. Missing Value Imputation Approach for Mass Spectrometry-Based Metabolomics Data. Sci. Rep. 2018, 8, 663. [Google Scholar] [CrossRef]
  20. Stekhoven, D.J.; Bühlmann, P. MissForest—Non-Parametric Missing Value Imputation for Mixed-Type Data. Bioinformatics 2012, 28, 112–118. [Google Scholar] [CrossRef]
  21. Szklarczyk, D.; Franceschini, A.; Wyder, S.; Forslund, K.; Heller, D.; Huerta-Cepas, J.; Simonovic, M.; Roth, A.; Santos, A.; Tsafou, K.P.; et al. STRING V10: Protein-Protein Interaction Networks, Integrated over the Tree of Life. Nucleic Acids Res. 2015, 43, D447–D452. [Google Scholar] [CrossRef] [PubMed]
  22. Heberle, H.; Meirelles, V.G.; da Silva, F.R.; Telles, G.P.; Minghim, R. InteractiVenn: A Web-Based Tool for the Analysis of Sets through Venn Diagrams. BMC Bioinform. 2015, 16, 169. [Google Scholar] [CrossRef] [PubMed]
  23. Friedman, J.; Hastie, T.; Tibshirani, R. Regularization Paths for Generalized Linear Models via Coordinate Descent. J. Stat. Softw. 2010, 33, 1–22. [Google Scholar] [CrossRef]
  24. Liew, A.W.C.; Law, N.F.; Yan, H. Missing Value Imputation for Gene Expression Data: Computational Techniques to Recover Missing Data from Available Information. Brief. Bioinform. 2011, 12, 498–513. [Google Scholar] [CrossRef]
  25. Zeid, R.; Lawlor, M.A.; Poon, E.; Reyes, J.M.; Fulciniti, M.; Lopez, M.A.; Scott, T.G.; Nabet, B.; Erb, M.A.; Winter, G.E.; et al. Enhancer Invasion Shapes MYCN Dependent Transcriptional Amplification in Neuroblastoma. Nat. Genet. 2018, 50, 515–523. [Google Scholar] [CrossRef] [PubMed]
  26. Agathanggelou, A.; Bièche, I.; Ahmed-Choudhury, J.; Nicke, B.; Dammann, R.; Baksh, S.; Gao, B.; Minna, J.D.; Downward, J.; Maher, E.R.; et al. Identification of Novel Gene Expression Targets for the Ras Association Domain Family 1 (RASSF1A) Tumor Suppressor Gene in Non-Small Cell Lung Cancer and Neuroblastoma. Cancer Res. 2003, 63, 5344–5351. [Google Scholar]
  27. Nguyen, T.M.; Shafi, A.; Nguyen, T.; Draghici, S. Identifying Significantly Impacted Pathways: A Comprehensive Review and Assessment. Genome Biol. 2019, 20, 203. [Google Scholar] [CrossRef]
  28. Wachowiak, R.; Rawnaq, T.; Metzger, R.; Quaas, A.; Fiegel, H.; Kähler, N.; Rolle, U.; Izbicki, J.R.; Kaifi, J.; Till, H. Universal Expression of Cell Adhesion Molecule NCAM in Neuroblastoma in Contrast to L1: Implications for Different Roles in Tumor Biology of Neuroblastoma? Pediatr. Surg. Int. 2008, 24, 1361–1364. [Google Scholar] [CrossRef]
  29. Tajrishi, M.M.; Tuteja, R.; Tuteja, N. Nucleolin: The Most Abundant Multifunctional Phosphoprotein of Nucleolus. Commun. Integr. Biol. 2011, 4, 267–275. [Google Scholar] [CrossRef]
  30. Grassadonia, A.; Tinari, N.; Iurisci, I.; Piccolo, E.; Cumashi, A.; Innominato, P.; D’Egidio, M.; Natoli, C.; Piantelli, M.; Iacobelli, S. 90K (Mac-2 BP) and Galectins in Tumor Progression and Metastasis. Glycoconj. J. 2002, 19, 551–556. [Google Scholar] [CrossRef]
  31. Pietraszek, K.; Chatron-Colliet, A.; Brézillon, S.; Perreau, C.; Jakubiak-Augustyn, A.; Krotkiewski, H.; Maquart, F.X.; Wegrowski, Y. Lumican: A New Inhibitor of Matrix Metalloproteinase-14 Activity. FEBS Lett. 2014, 588, 4319–4324. [Google Scholar] [CrossRef] [PubMed]
  32. Mao, L.; Yang, J.; Yue, J.; Chen, Y.; Zhou, H.; Fan, D.; Zhang, Q.; Buraschi, S.; Iozzo, R.V.; Bi, X. Decorin Deficiency Promotes Epithelial-Mesenchymal Transition and Colon Cancer Metastasis. Matrix Biol. 2021, 95, 1–14. [Google Scholar] [CrossRef] [PubMed]
  33. Bernusso, V.A.; Machado-Neto, J.A.; Pericole, F.V.; Vieira, K.P.; Duarte, A.S.S.; Traina, F.; Hansen, M.D.; Olalla Saad, S.T.; Barcellos, K.S.A. Imatinib Restores VASP Activity and Its Interaction with Zyxin in BCR-ABL Leukemic Cells. Biochim. Biophys. Acta 2015, 1853, 388–395. [Google Scholar] [CrossRef] [PubMed]
  34. Lee, J.; Beatty, G.L. Serum Amyloid A Proteins and Their Impact on Metastasis and Immune Biology in Cancer. Cancers 2021, 13, 3179. [Google Scholar] [CrossRef]
  35. Doni, A.; Stravalaci, M.; Inforzato, A.; Magrini, E.; Mantovani, A.; Garlanda, C.; Bottazzi, B. The Long Pentraxin PTX3 as a Link Between Innate Immunity, Tissue Remodeling, and Cancer. Front. Immunol. 2019, 10, 712. [Google Scholar] [CrossRef]
  36. Kang, J.S.; Lee, S.J.; Lee, J.H.; Kim, J.H.; Son, S.S.; Cha, S.K.; Lee, E.S.; Chung, C.H.; Lee, E.Y. Angiotensin II-Mediated MYH9 Downregulation Causes Structural and Functional Podocyte Injury in Diabetic Kidney Disease. Sci. Rep. 2019, 9, 7679. [Google Scholar] [CrossRef]
  37. Feng, L.; Weng, J.; Yao, C.; Wang, R.; Wang, N.; Zhang, Y.; Tanaka, Y.; Su, L. Extracellular Vesicles Derived from SIPA1high Breast Cancer Cells Enhance Macrophage Infiltration and Cancer Metastasis through Myosin-9. Biology 2022, 11, 543. [Google Scholar] [CrossRef]
  38. Rick, J.W.; Chandra, A.; Dalle Ore, C.; Nguyen, A.T.; Yagnik, G.; Aghi, M.K. Fibronectin in Malignancy: Cancer-Specific Alterations, Protumoral Effects, and Therapeutic Implications. Semin. Oncol. 2019, 46, 284–290. [Google Scholar] [CrossRef]
  39. Cai, R.; Wang, P.; Zhao, X.; Lu, X.; Deng, R.; Wang, X.; Su, Z.; Hong, C.; Lin, J. LTBP1 Promotes Esophageal Squamous Cell Carcinoma Progression through Epithelial-Mesenchymal Transition and Cancer-Associated Fibroblasts Transformation. J. Transl. Med. 2020, 18, 139. [Google Scholar] [CrossRef]
  40. Fucikova, J.; Spisek, R.; Kroemer, G.; Galluzzi, L. Calreticulin and Cancer. Cell Res. 2021, 31, 5–16. [Google Scholar] [CrossRef]
  41. Hu, T.; Wu, X.; Li, K.; Li, Y.; He, P.; Wu, Z.; Fan, J.; Liu, W.; Guan, M. AKAP12 Endogenous Transcripts Suppress The Proliferation, Migration and Invasion of Colorectal Cancer Cells By Directly Targeting OncomiR-183-5p. Onco Targets Ther. 2019, 12, 8301–8310. [Google Scholar] [CrossRef] [PubMed]
  42. Hayashi, M.; Nomoto, S.; Kanda, M.; Okamura, Y.; Nishikawa, Y.; Yamada, S.; Fujii, T.; Sugimoto, H.; Takeda, S.; Kodera, Y. Identification of the A Kinase Anchor Protein 12 (AKAP12) Gene as a Candidate Tumor Suppressor of Hepatocellular Carcinoma. J. Surg. Oncol. 2012, 105, 381–386. [Google Scholar] [CrossRef] [PubMed]
  43. Soh, R.Y.Z.; Lim, J.P.; Samy, R.P.; Chua, P.J.; Bay, B.H. A-Kinase Anchor Protein 12 (AKAP12) Inhibits Cell Migration in Breast Cancer. Exp. Mol. Pathol. 2018, 105, 364–370. [Google Scholar] [CrossRef] [PubMed]
  44. Doyle, L.M.; Wang, M.Z. Overview of Extracellular Vesicles, Their Origin, Composition, Purpose, and Methods for Exosome Isolation and Analysis. Cells 2019, 8, 727. [Google Scholar] [CrossRef]
  45. Marimpietri, D.; Petretto, A.; Raffaghello, L.; Pezzolo, A.; Gagliani, C.; Tacchetti, C.; Mauri, P.; Melioli, G.; Pistoia, V. Proteome Profiling of Neuroblastoma-Derived Exosomes Reveal the Expression of Proteins Potentially Involved in Tumor Progression. PLoS ONE 2013, 8, e75054. [Google Scholar] [CrossRef]
  46. Marimpietri, D.; Airoldi, I.; Faini, A.C.; Malavasi, F.; Morandi, F. The Role of Extracellular Vesicles in the Progression of Human Neuroblastoma. Int. J. Mol. Sci. 2021, 22, 3964. [Google Scholar] [CrossRef]
  47. Colletti, M.; Petretto, A.; Galardi, A.; Di Paolo, V.; Tomao, L.; Lavarello, C.; Inglese, E.; Bruschi, M.; Lopez, A.A.; Pascucci, L.; et al. Proteomic Analysis of Neuroblastoma-Derived Exosomes: New Insights into a Metastatic Signature. Proteomics 2017, 17. [Google Scholar] [CrossRef]
  48. Lerone, M.; Ognibene, M.; Pezzolo, A.; Martucciello, G.; Zara, F.; Morini, M.; Mazzocco, K. Molecular Genetics in Neuroblastoma Prognosis. Children 2021, 8, 456. [Google Scholar] [CrossRef]
  49. Chen, Y.; Hu, J. Nucleophosmin1 (NPM1) Abnormality in Hematologic Malignancies, and Therapeutic Targeting of Mutant NPM1 in Acute Myeloid Leukemia. Ther. Adv. Hematol. 2020, 11, 204062071989981. [Google Scholar] [CrossRef]
  50. Wen, X.M.; Luo, T.; Jiang, Y.; Wang, L.H.; Luo, Y.; Chen, Q.; Yang, K.; Yuan, Y.; Luo, C.; Zhang, X.; et al. Zyxin (ZYX) Promotes Invasion and Acts as a Biomarker for Aggressive Phenotypes of Human Glioblastoma Multiforme. Lab. Investig. 2020, 100, 812–823. [Google Scholar] [CrossRef]
  51. Zheng, C.; Liu, S.; Feng, J.; Zhao, X. Prognostic Value of Inflammation Biomarkers for Survival of Patients with Neuroblastoma. Cancer Manag. Res. 2020, 12, 2415–2425. [Google Scholar] [CrossRef] [PubMed]
  52. Wang, Z.; Wang, X.; Zou, H.; Dai, Z.; Feng, S.; Zhang, M.; Xiao, G.; Liu, Z.; Cheng, Q. The Basic Characteristics of the Pentraxin Family and Their Functions in Tumor Progression. Front. Immunol. 2020, 11, 1757. [Google Scholar] [CrossRef] [PubMed]
  53. Cangelosi, D.; Brignole, C.; Bensa, V.; Tamma, R.; Malaguti, F.; Carlini, B.; Giusto, E.; Calarco, E.; Perri, P.; Ribatti, D.; et al. Nucleolin Expression Has Prognostic Value in Neuroblastoma Patients. EBioMedicine 2022, 85, 104300. [Google Scholar] [CrossRef] [PubMed]
  54. Yesmin, F.; Furukawa, K.; Kambe, M.; Ohmi, Y.; Bhuiyan, R.H.; Hasnat, M.A.; Mizutani, M.; Tajima, O.; Hashimoto, N.; Tsuchida, A.; et al. Extracellular Vesicles Released from Ganglioside GD2-Expressing Melanoma Cells Enhance the Malignant Properties of GD2-Negative Melanomas. Sci. Rep. 2023, 13, 4987. [Google Scholar] [CrossRef] [PubMed]
  55. Han, S.W.; Roman, J. Fibronectin Induces Cell Proliferation and Inhibits Apoptosis in Human Bronchial Epithelial Cells: Pro-Oncogenic Effects Mediated by PI3-Kinase and NF-Kappa B. Oncogene 2006, 25, 4341–4349. [Google Scholar] [CrossRef] [PubMed]
  56. Edwards, A.S.; Scott, J.D. A-Kinase Anchoring Proteins: Protein Kinase A and Beyond. Curr. Opin. Cell Biol. 2000, 12, 217–221. [Google Scholar] [CrossRef]
  57. Li, H. Physiologic and Pathophysiologic Roles of AKAP12. Sci. Prog. 2022, 105, 368504221109212. [Google Scholar] [CrossRef]
  58. Markovsky, E.; Eldar-Boock, A.; Ben-Shushan, D.; Baabur-Cohen, H.; Yeini, E.; Pisarevsky, E.; Many, A.; Aviel-Ronen, S.; Barshack, I.; Satchi-Fainaro, R. Targeting NCAM-Expressing Neuroblastoma with Polymeric Precision Nanomedicine. J. Control. Release 2017, 249, 162–172. [Google Scholar] [CrossRef]
  59. Van Groningen, T.; Koster, J.; Valentijn, L.J.; Zwijnenburg, D.A.; Akogul, N.; Hasselt, N.E.; Broekmans, M.; Haneveld, F.; Nowakowska, N.E.; Bras, J.; et al. Neuroblastoma Is Composed of Two Super-Enhancer-Associated Differentiation States. Nat. Genet. 2017, 49, 1261–1266. [Google Scholar] [CrossRef]
  60. Xie, S.; Zhang, Q.; Jiang, L. Current Knowledge on Exosome Biogenesis, Cargo-Sorting Mechanism and Therapeutic Implications. Membranes 2022, 12, 498. [Google Scholar] [CrossRef]
  61. Vizcaíno, J.A.; Csordas, A.; Del-Toro, N.; Dianes, J.A.; Griss, J.; Lavidas, I.; Mayer, G.; Perez-Riverol, Y.; Reisinger, F.; Ternent, T.; et al. 2016 Update of the PRIDE Database and Its Related Tools. Nucleic Acids Res. 2016, 44, D447–D456. [Google Scholar] [CrossRef] [PubMed]
Figure 1. Flowchart of the analysis. Flow chart of the NB (n = 48) and CTR (n = 24) plasma sample analysis. NB included LR-NB (n = 24) and HR-NB (n = 24) patients. The diagram reports the different steps of the bioinformatic analysis applied to the proteomic data, which includes the distribution analysis of missing data, data filtering based on the number of missing values, the application of two different imputation methods (RF and QRILC), differential expression analyses, the selection of the Exo-prots commonly differentially expressed between the RF and QRILC datasets and pathway and network analyses.
Cells 12 02516 g001
Figure 2. Distribution analysis of the detectable and missing expression values across samples. (A) Heatmap showing the significantly differentially represented Exo-prots (n = 121) between the NB and CTRL samples according to the Z-test statistics based on the distribution of missing values. Exo-prots with Z-test values larger than 2.6 or lower than −2.6 were considered to have a significantly different distribution of missing values between groups. The heatmap was drawn using global coloring. Detectable values are colored in red and missing values in grey. A dendrogram is reported above the plot. (B) Protein–protein interaction network among the 121 differentially represented Exo-prots. A network was built using the STRING-DB tool. The line thickness indicates the strength of data support. A medium confidence of 0.4 was set up as the minimum required interaction score. (C) Heatmap showing the significantly differentially represented Exo-prots (n = 115) between the HR-NB and LR-NB samples according to the Z-test statistics. Exo-prots with Z-test values larger than 2.6 or lower than −2.6 were considered to have a significantly different distribution of missing values across groups. The heatmap was drawn using global coloring. Detectable values are colored in red and missing values in grey. A dendrogram is reported above the plot. (D) Protein–protein interaction network among the 115 differentially represented Exo-prots. A network was built using String-DB. The line thickness indicates the strength of the data support. A medium confidence of 0.4 was set up as the minimum required interaction score.
Cells 12 02516 g002
Figure 3. Significantly differentially expressed Exo-prots between the NB and CTRL samples. (A) Venn diagram showing the number of commonly and exclusively up- and downregulated Exo-prots in the RF and QRILC datasets. (B,C) Heatmaps showing the expression values of the deregulated Exo-prots identified in the RF (panel B) and QRILC (panel C) datasets. The NB and CTRL group labels are shown above the plot. A color key is reported in the top left part of the plot. (D) Protein–protein interaction network showing the interactions among the 81 differentially represented Exo-prots between the NB and CTRL samples and shared by the RF and QRILC datasets. A network was built using the STRINGg-DB tool. The Exo-prots are shown as nodes. The line width indicates the strength of data support. A medium confidence of 0.4 was set up as the minimum required interaction score.
Cells 12 02516 g003aCells 12 02516 g003b
Figure 4. Significantly differentially expressed Exo-prots between the HR-NB and LR-NB samples. (A) Venn diagram showing the number of commonly and exclusively up- and downregulated Exo-prots in the RF and QRILC datasets by comparing the HR-NB and LR-NB samples. (B,C) Heatmaps showing the expression values of the deregulated Exo-prots identified in the RF (panel B) or QRILC (panel C) dataset. The HR-NB and LR-NB group labels are shown above the plot. A color key is reported in the top left part of the plot. (D) Protein–protein interaction network showing the interactions among the 92 differentially represented Exo-prots. Network analysis showing the interactions among the 92 commonly differentially expressed proteins between the HR-NB and LR-NB samples and shared by the RF and QRILC datasets. The network was built using the STRING-DB tool. Exo-prots are shown as nodes. The line width indicates the strength of data support. A medium confidence of 0.4 was set up as the minimum required interaction score.
Cells 12 02516 g004
Figure 5. Results of the ROC analysis to assess the diagnostic value of the selected differentially expressed Exo-prots between the NB and CTRL subjects. ROC analysis was performed to assess the diagnostic value of the differentially expressed Exo-prots between the NB and CTRL samples. Analysis was carried out using the expression values from the RF or QRILC datasets. ROC curves for NCAM (A), NCL (B), LUM (C), VASP (D), LGALS3BP (E) and DCN (F) singularly and the combination of all markers (G) are reported. Sensitivity (%) is shown on the Y-axis, 100%; specificity (%) is shown on the X-axis. Areas under the curves (AUCs), coincidence intervals (CIs) and p-values are reported for each graph. The red dotted line corresponds to AUC = 0.5, representing a random classifier. p-Values lower than 0.05 are considered statistically significant. Red and blue labels refer to the upregulated and downregulated Exo-prots in the NB vs. CTRL samples, respectively. The gene symbol and dataset name are reported above each plot.
Cells 12 02516 g005
Figure 6. Results of the ROC analysis to assess the prognostic value of the selected differentially expressed Exo-prots between the HR-NB and LR-NB samples. ROC analysis was performed to assess the prognostic value of selected Exo-prot in discriminating between the HR-NB and LR-NB patients. Analysis was carried out using the expression values from the RF and QRILC datasets. ROC curves for MYH9 (A), FN1 (B), CALR (C), LTBP1 (D) and AKAP12 (E) singularly and the combination of all markers (F) are reported. Sensitivity (%) is shown on the Y-axis, 100%; specificity (%) is shown on the X-axis. Areas under the curves (AUCs), coincidence intervals (CIs) and p-values are reported for each graph. The red dotted line corresponds to AUC = 0.5, representing a random classifier. p-Values lower than 0.05 are considered statistically significant. Red and blue labels refer to upregulated and downregulated Exo-prots in the HR-NB vs. LR-NB patients, respectively. The gene symbol and dataset name are reported above each plot.
Cells 12 02516 g006
Figure 7. RTqPCR validation of the genes encoding the diagnostic or prognostic Exo-prots identified by ROC analysis. Transcript levels were compared between the HR-NB (n = 10), LR-NB (n = 10) tissues and CTRL subjects (A) and between the HR-NB and LR-NB patients (B). The graph shows the mean of 2(−DCT) values, against the mean of the DCt of the reference gene GAPDH. The results are shown as a box plot and are expressed as the mean normalized gene expression values. The boxes show the values that fall between the 25th and 75th percentiles, the horizontal lines represent the mean values, and the whiskers (lines that extend from the boxes) represent the highest and lowest values for each group. p-Values of NB relative to CTRL: * p < 0.05; ** p < 0.01; *** p < 0.001. p-Values of HR-NB relative to LR-NB: * p < 0.05; ** p < 0.01.
Cells 12 02516 g007
Table 1. Clinical features of the NB and CTRL subjects included in this study.
Cohort (n = 72)
Patients (n = 48)Controls (n = 24)
n%n%
Sex
Male28591666
Female2041834
Age at diagnosis
<18 months1940730
≥18 months29601770
INSS * stage
1919--
2715--
4816--
4S2450--
MYCN status
Amplified1837--
Not amplified2654--
N/A59--
Relapse
Yes715--
No4185--
Event overall
Yes3471--
No1429--
* INSS: International Neuroblastoma Staging System.
Table 2. Selection of the significant pathways of deregulated Exo-prots in the NB patients according to analysis of the distribution of missing values.
Database aPathway bGene Count cFDR d
GO BPImmune system process426.50 × 10−7
GO BPImmune effector process246.68 × 10−6
GO BPNeutrophil degranulation152.10 × 10−4
GO BPMyeloid leukocyte activation162.70 × 10−4
GO BPResponse to stimulus753.20 × 10−4
GO BPCell activation involved in immune response165.40 × 10−4
GO BPActivation of immune response121.30 × 10−3
GO BPActin filament organization101.30 × 10−3
GO BPRegulation of cell–substrate adhesion92.00 × 10−3
GO BPLeukocyte activation183.30 × 10−3
GO BPActin filament-based process143.80 × 10−3
GO BPActin cytoskeleton organization134.00 × 10−3
GO BPPositive regulation of integrin-mediated signaling pathway35.20 × 10−3
GO BPComplement activation55.70 × 10−3
GO BPCytoskeleton organization199.60 × 10−3
GO BPComplement activation, lectin pathway31.04 × 10−2
GO BPRegulation of focal adhesion assembly51.04 × 10−2
GO BPRegulation of cell migration161.27 × 10−2
GO BPRegulation of actin filament polymerization71.70 × 10−2
GO BPCell migration161.71 × 10−2
GO BPComplement activation, classical pathway41.73 × 10−2
GO BPRegulation of cell adhesion141.73 × 10−2
GO BPPositive regulation of cell–substrate adhesion61.86 × 10−2
GO BPRegulation of cytoskeleton organization121.86 × 10−2
GO BPCell motility171.97 × 10−2
GO BPPositive regulation of neuron migration32.32 × 10−2
GO BPExtracellular matrix organization92.89 × 10−2
GO BPRegulation of cell junction assembly72.89 × 10−2
GO BPInflammatory response113.40 × 10−2
GO BPRegulation of substrate adhesion-dependent cell spreading43.78 × 10−2
GO BPActin filament bundle assembly44.15 × 10−2
GO BPPositive regulation of cell adhesion molecule production24.77 × 10−2
GO BPPositive regulation of extracellular exosome assembly24.77 × 10−2
KEGGFocal adhesion91.50 × 10−3
KEGGECM–receptor interaction62.50 × 10−3
ReactomeImmune system356.19 × 10−6
ReactomeInnate immune system233.97 × 10−5
ReactomeCell–extracellular matrix interaction42.20 × 10−3
ReactomeLectin pathway of complement activation35.30 × 10−3
ReactomeComplement cascade56.90 × 10−3
GO BP, KEGG and Reactome pathway analyses were carried out with STRING-DB on Exo-prots exclusively expressed in the NB or CTRL samples. The pathways are listed by increasing false discovery rate values for each ontology. a Name of the ontology defining a pathway. GO BP stands for Gene Ontology biological process. KEGG stands for Kyoto Encyclopedia of Genes and Genomes. b Official name of a GO biological process, KEGG or Reactome pathway. c Number of identified genes. d FDR (false discovery rate) shows p-values corrected for multiple testing within each category using the Benjamini–Hochberg procedure. Values lower than 0.05 are considered significant.
Table 3. Relative expression of the commonly regulated Exo-Prots between the NB and CTRL samples in the RF and QRILC datasets.
Protein NameGene Name aRF_logFC bRF_adj p-Value cQRILC_logFC dQRILC_adj p-Value e
Upregulated
NucleolinNCL3.309.80 × 10−63.463.90 × 10−5
Cathepsin GCTSG2.511.20 × 10−32.664.90 × 10−3
C-reactive proteinCRP2.314.80 × 10−52.064.80 × 10−2
Tubulin beta-1 chainTUBB12.288.10 × 10−42.568.60 × 10−4
Serum amyloid A-1 proteinSAA12.174.20 × 10−32.691.80 × 10−2
Histone H4HIST1H4A1.963.00 × 10−21.963.10 × 10−2
Heterogeneous nuclear ribonucleoproteins C1/C2HNRNPC1.602.00 × 10−32.837.00 × 10−5
Prothymosin alphaPTMA1.413.70 × 10−32.647.70 × 10−5
Nuclear autoantigenic sperm proteinNASP1.314.10 × 10−22.037.20 × 10−3
Heterogeneous nuclear ribonucleoprotein UHNRNPU1.201.40 × 10−21.914.60 × 10−3
Neural cell adhesion molecule 1NCAM10.921.20 × 10−40.922.80 × 10−4
Complement C4-BC4B0.812.00 × 10−30.813.50 × 10−3
Golgi membrane protein 1GOLM10.819.20 × 10−31.043.50 × 10−3
Platelet glycoprotein Ib alpha chainGP1BA0.773.50 × 10−40.778.40 × 10−4
Alpha-2-macroglobulinA2M0.753.00 × 10−20.753.40 × 10−2
Plasma protease C1 inhibitorSERPING10.624.10 × 10−20.624.70 × 10−2
Galectin-3-binding proteinLGALS3BP0.592.50 × 10−20.593.10 × 10−2
Downregulated
Alpha-1B-glycoproteinA1BG−0.776.40 × 10−4−0.613.20 × 10−2
EndosialinCD248−0.603.60 × 10−2−1.441.20 × 10−2
LumicanLUM−0.651.20 × 10−3−0.652.80 × 10−3
78 kDa glucose-regulated proteinHSPA5−0.663.50 × 10−3−0.761.20 × 10−2
Haptoglobin-related proteinHPR−0.663.00 × 10−2−2.094.30 × 10−2
Protein disulfide–isomerase A3PDIA3_DR2−0.681.30 × 10−3−0.723.50 × 10−2
Aggrecan core proteinACAN−0.731.10 × 10−2−0.952.90 × 10−2
Ig gamma-1 chain C regionIGHG1−0.733.10 × 10−2−0.862.20 × 10−2
Complement factor BCFB−0.754.80 × 10−2−0.874.70 × 10−2
Dentin sialophosphoproteinDSPP−0.764.00 × 10−3−1.732.10 × 10−4
Flavin reductase (NADPH)BLVRB−0.844.50 × 10−2−1.422.00 × 10−2
CoroninCORO1A−0.861.20 × 10−3−1.782.40 × 10−3
Apolipoprotein A-IIAPOA2−0.864.20 × 10−5−0.861.40 × 10−4
Alpha-1-antichymotrypsinSERPINA3−0.894.00 × 10−3−0.895.80 × 10−3
Complement component C8 beta chainC8B−0.893.30 × 10−3−0.894.80 × 10−3
DecorinDCN−0.937.20 × 10−4−0.924.30 × 10−2
Vasodilator-stimulated phosphoproteinVASP−1.001.20 × 10−3−2.801.90 × 10−6
Protein 4.1EPB41−1.011.20 × 10−2−3.163.50 × 10−7
Plexin-B1PLXNB1−1.014.30 × 10−4−0.913.90 × 10−2
Protein Z-dependent protease inhibitorSERPINA10−1.071.10 × 10−2−2.443.90 × 10−3
VasorinVASN−1.108.60 × 10−5−2.206.00 × 10−5
Transforming growth factor-beta-induced protein ig-h3TGFBI−1.111.80 × 10−3−1.569.20 × 10−3
GTP-binding nuclear protein RanRAN−1.139.50 × 10−3−1.864.60 × 10−3
Angiopoietin-related protein 6ANGPTL6−1.143.30 × 10−4−1.445.70 × 10−4
ClusterinCLU−1.155.80 × 10−6−1.151.70 × 10−5
Clathrin light chain ACLTA−1.164.00 × 10−3−1.212.90 × 10−2
Latent-transforming growth factor-beta-binding protein 1LTBP1−1.191.90 × 10−3−1.963.50 × 10−4
Eukaryotic translation initiation factor 5EIF5−1.225.70 × 10−4−2.198.90 × 10−5
Alpha-synucleinSNCA−1.289.10 × 10−4−1.679.90 × 10−3
Matrix Gla proteinMGP−1.289.10 × 10−4−1.171.20 × 10−2
Interleukin-7 receptor subunit alphaIL7R−1.333.60 × 10−8−1.813.00 × 10−4
Melanocyte protein PMELPMEL−1.345.40 × 10−5−1.211.20 × 10−2
Plexin domain-containing protein 2PLXDC2−1.351.70 × 10−9−2.024.70 × 10−6
OsteomodulinOMD−1.361.00 × 10−7−1.064.90 × 10−3
Band 3 anion transport proteinSLC4A1−1.382.40 × 10−2−1.691.10 × 10−2
Vitamin K-dependent protein SPROS1−1.394.20 × 10−5−1.397.70 × 10−5
Collectin-11COLEC11−1.412.00 × 10−5−1.472.80 × 10−3
Transitional endoplasmic reticulum ATPaseVCP−1.441.20 × 10−4−1.442.10 × 10−4
CD44 antigenCD44−1.464.20 × 10−5−1.234.00 × 10−3
14-3-3 protein beta/alphaYWHAB−1.462.70 × 10−4−1.494.00 × 10−3
Hemoglobin subunit betaHBB−1.482.50 × 10−3−1.483.40 × 10−3
Chondroitin sulfate proteoglycan 4CSPG4−1.481.40 × 10−4−1.238.00 × 10−3
Hemoglobin subunit alphaHBA1−1.558.10 × 10−3−1.558.80 × 10−3
Alpha-2-HS-glycoproteinAHSG−1.552.80 × 10−6−1.556.60 × 10−6
UBE2OUBE2O−1.562.10 × 10−5−2.152.50 × 10−4
AsporinASPN−1.701.20 × 10−7−2.336.60 × 10−6
Peptidase inhibitor 16PI16−1.703.40 × 10−4−1.886.80 × 10−4
Thrombospondin-4THBS4−1.742.70 × 10−5−1.744.90 × 10−5
Importin subunit beta-1KPNB1−1.814.70 × 10−7−1.829.40 × 10−6
Heparin cofactor 2SERPIND1−1.891.80 × 10−5−1.892.80 × 10−5
Transcription initiation factor TFIID subunit 9TAF9−1.932.30 × 10−9−1.694.30 × 10−2
Uncharacterized protein C14orf37C14orf37−1.951.60 × 10−7−1.331.50 × 10−2
Complement C1s subcomponentC1S−2.144.50 × 10−10−2.141.70 × 10−9
Hemoglobin subunit deltaHBD−2.511.90 × 10−5−3.965.50 × 10−6
Phosphatidylinositol-glycan-specific phospholipase DGPLD1−2.553.20 × 10−18−4.651.70 × 10−12
Thrombospondin-3THBS3−2.611.30 × 10−8−2.616.70 × 10−6
Lipopolysaccharide-binding proteinLBP−2.695.80 × 10−6−3.272.30 × 10−5
Serum paraoxonase/arylesterase 1PON1−3.182.90 × 10−7−3.872.70 × 10−6
Spectrin beta chainSPTB−3.472.20 × 10−7−4.183.00 × 10−6
Secreted phosphoprotein 24SPP2−3.762.10 × 10−10−3.463.50 × 10−7
Sex hormone-binding globulinSHBG−4.268.50 × 10−16−4.643.40 × 10−14
Complement C1r subcomponentC1R−5.489.90 × 10−12−5.841.50 × 10−11
Spectrin alpha chainSPTA1−5.777.80 × 10−11−6.543.20 × 10−11
Ankyrin-1ANK1−6.352.20 × 10−10−6.563.30 × 10−10
Exo-prot expression profile was evaluated in the NB and CTRL samples, and comparative analysis of the expression differences between the two groups was carried out by a two-sample Student’s t-test after imputation by the RF or QRILC methods. Exo-prots are listed by decreasing FC value. a Name of the protein-coding genes. b Fold change values expressed as log2 after the RF imputation method. FC values greater than 0.67 are reported. c p-Value adjusted for FDR (false discovery rate). Adjusted p-values lower than 0.05 are considered significant. d Fold change values expressed as log2 after the RF imputation method. FC values greater than 0.67 are reported. e p-Value adjusted for FDR (false discovery rate). Adjusted p-values lower than 0.05 are considered significant.
Table 4. Selection of significant pathways of the Exo-prots regulated in the comparison between the NB and CTRL samples.
Database aPathway bGene Count cFDR d
GO ProcessComplement activation94.93 × 10−8
GO ProcessRegulation of complement activation94.93 × 10−8
GO ProcessLeukocyte-mediated immunity166.90 × 10−6
GO ProcessImmune effector process199.04 × 10−6
GO ProcessImmune system process301.35 × 10−5
GO ProcessAcute inflammatory response72.37 × 10−5
GO ProcessImmune response233.36 × 10−5
GO ProcessRegulation of immune effector process127.75 × 10−5
GO ProcessRegulation of immune system process211.90 × 10−4
GO ProcessRegulation of immune response162.10 × 10−4
GO ProcessAcute-phase response54.40 × 10−4
GO ProcessActivation of immune response109.70 × 10−4
GO ProcessInflammatory response111.70 × 10−3
GO ProcessMyeloid leukocyte activation114.40 × 10−3
GO ProcessNegative regulation of intrinsic apoptotic signaling pathway in response to DNA damage33.83 × 10−2
GO ProcessRegulation of cell death174.27 × 10−2
KEGGECM–receptor interaction55.30 × 10−3
ReactomeExtracellular matrix organization108.84 × 10−5
ReactomeECM proteoglycans61.40 × 10−4
ReactomeDegradation of the extracellular matrix51.90 × 10−2
ReactomeNeutrophil degranulation83.73 × 10−2
GO BP, KEGG and Reactome pathway analyses were carried out with STRING-DB on the Exo-prots differentially expressed in the NB vs. CTRL samples. Pathways are listed by increasing false discovery rate values for each ontology. a Name of the ontology defining a pathway. GO BP stands for Gene Ontology biological process. KEGG stands for Kyoto Encyclopedia of Genes and Genomes. b Official name of a GO biological process, KEGG or Reactome pathway. c Number of identified genes. d FDR (false discovery rate) shows p-values corrected for multiple testing within each category using the Benjamini–Hochberg procedure. Values lower than 0.05 are considered significant.
Table 5. Selection of significant pathways of the Exo-prots exclusively detectable in the HR-NB or LR-NB patients.
Database aPathway bGene Count cFDR d
GO BPImmune system process472.98 × 10−10
GO BPResponse to stress555.40 × 10−10
GO BPImmune response342.55 × 10−8
GO BPActivation of immune response169.11 × 10−7
GO BPInnate immune response183.97 × 10−5
GO BPInflammatory response159.06 × 10−5
GO BPAcute inflammatory response79.95 × 10−5
GO BPRegulation of actin filament-based process131.20 × 10−4
GO BPLymphocyte-mediated immunity83.80 × 10−4
GO BPRegulation of focal adhesion assembly64.30 × 10−4
GO BPCell migration172.20 × 10−3
GO BPPositive chemotaxis52.40 × 10−3
GO BPActin filament organization92.50 × 10−3
GO BPRegulation of actin filament organization93.80 × 10−3
GO BPActin cytoskeleton organization125.00 × 10−3
GO BPRegulation of cell adhesion146.60 × 10−3
GO BPCytoskeleton organization187.70 × 10−3
GO BPChemotaxis112.58 × 10−2
GO BPLeukocyte migration83.81 × 10−2
GO BPReactive oxygen species metabolic process53.84 × 10−2
KEGGECM–receptor interaction61.90 × 10−3
ReactomeComplement cascade74.39 × 10−5
ReactomeRegulation of complement cascade61.80 × 10−4
ReactomeMetabolism of proteins281.20 × 10−3
ReactomeECM proteoglycans59.40 × 10−3
ReactomeApoptosis62.72 × 10−2
GO, KEGG and Reactome pathway analyses were carried out with STRING-DB on Exo-prots exclusively expressed in the HR-NB or LR-NB samples. Pathways are listed by increasing false discovery rate values for each ontology. a Name of the ontology defining a pathway. GO BP stands for Gene Ontology biological process. KEGG stands for Kyoto Encyclopedia of Genes and Genomes. b Official name of a GO biological process, KEGG or Reactome pathway. c Number of identified genes. d FDR (false discovery rate) shows p-values corrected for multiple testing within each category using the Benjamini–Hochberg procedure. Values lower than 0.05 are considered significant.
Table 6. Relative expression of the commonly regulated Exo-prots between the HR-NB and LR-NB patients in the RF and QRILC datasets.
Protein NameGene Name aRF_logFC bRF_adj p-Value cQRILC_logFC dQRILC_adj p-Value e
Upregulated
Myosin-9MYH94.342.20 × 10−93.968.90 × 10−6
Complement C1r subcomponentC1R3.425.40 × 10−62.703.30 × 10−3
Hemoglobin subunit gamma-1HBG12.959.10 × 10−54.613.90 × 10−5
Hemoglobin subunit gamma-2HBG22.783.30 × 10−43.244.40 × 10−3
Hemoglobin subunit alphaHBA12.674.90 × 10−52.678.50 × 10−5
Band 3 anion transport proteinSLC4A12.437.50 × 10−61.769.60 × 10−3
Neuroendocrine secretory protein 55GNAS2.435.00 × 10−52.585.70 × 10−4
Secreted phosphoprotein 24SPP22.332.30 × 10−42.334.10 × 10−4
Nidogen-2NID22.208.00 × 10−51.942.10 × 10−2
FibronectinFN12.172.40 × 10−62.177.10 × 10−6
Heat shock protein beta-1HSPB12.102.60 × 10−52.956.10 × 10−5
Fibulin-1FBLN12.102.10 × 10−61.962.60 × 10−3
SPARCSPARC1.791.40 × 10−52.278.10 × 10−5
Apolipoprotein DAPOD1.687.90 × 10−91.274.20 × 10−3
VasorinVASN1.635.40 × 10−102.261.60 × 10−4
F-actin-capping protein subunit alpha-1CAPZA11.578.00 × 10−51.733.30 × 10−3
Antithrombin-IIISERPINC11.545.70 × 10−62.288.90 × 10−6
Apolipoprotein A-IVAPOA41.511.10 × 10−41.512.60 × 10−4
C-type lectin domain family 11 member ACLEC11A1.512.40 × 10−61.518.90 × 10−6
Basement membrane-specific heparan sulfate proteoglycan core proteinHSPG21.488.90 × 10−41.481.50 × 10−3
HemopexinHPX1.451.90 × 10−73.351.70 × 10−11
Latent-transforming growth factor-beta-binding protein 1LTBP11.328.10 × 10−41.353.80 × 10−2
GTP-binding nuclear protein RanRAN1.314.00 × 10−31.951.40 × 10−2
Neuropilin-1NRP11.292.00 × 10−61.094.40 × 10−3
SerotransferrinTF1.275.30 × 10−32.063.20 × 10−3
SH3 domain-binding glutamic acid-rich-like protein 3SH3BGRL31.252.80 × 10−22.318.40 × 10−3
Chondroitin sulfate proteoglycan 4CSPG41.233.90 × 10−31.235.60 × 10−3
Platelet-derived growth factor receptor betaPDGFRB1.221.10 × 10−41.209.10 × 10−3
OsteopontinSPP11.211.50 × 10−51.216.00 × 10−5
Neurosecretory protein VGFVGF1.217.20 × 10−51.221.20 × 10−2
Guanine nucleotide-binding protein G(I)/G(S)/G(T) subunit beta-1GNB11.196.60 × 10−32.161.10 × 10−2
Thrombospondin-4THBS41.181.10 × 10−21.181.40 × 10−2
Alpha-2-macroglobulinA2M1.095.30 × 10−31.098.00 × 10−3
Protein HEG homolog 1HEG11.042.40 × 10−41.046.80 × 10−4
Aggrecan core proteinACAN1.031.30 × 10−31.365.20 × 10−3
Alpha-synucleinSNCA1.002.50 × 10−21.752.30 × 10−2
Sex hormone-binding globulinSHBG0.953.20 × 10−21.338.60 × 10−3
TenascinTNC0.923.20 × 10−20.924.40 × 10−2
Amyloid beta A4 proteinAPP0.911.50 × 10−20.912.00 × 10−2
Plexin domain-containing protein 1PLXDC10.863.60 × 10−51.781.40 × 10−5
Protein 4.1EPB410.853.70 × 10−21.768.00 × 10−3
AgrinAGRN0.801.40 × 10−20.802.00 × 10−2
VitronectinVTN0.806.50 × 10−50.803.80 × 10−4
Kininogen-1KNG10.739.80 × 10−41.327.90 × 10−4
TransthyretinTTR0.681.70 × 10−20.682.70 × 10−2
EndosialinCD2480.623.80 × 10−22.121.50 × 10−3
Downregulated
CMP-N-acetylneuraminate-poly-alpha-2,8-sialyltransferaseST8SIA4−0.591.80 × 10−2−1.074.90 × 10−3
Apolipoprotein A-IIAPOA2−0.623.40 × 10−3−0.628.20 × 10−3
Protein disulfide-isomerase A3PDIA3−0.747.10 × 10−3−0.741.20 × 10−2
Vitamin K-dependent protein SPROS1−0.793.40 × 10−2−0.794.90 × 10−2
Haptoglobin-related proteinHPR−0.885.30 × 10−3−5.653.50 × 10−9
EndoplasminHSP90B1−0.892.10 × 10−4−0.897.20 × 10−4
Complement C4-BC4B−0.901.10 × 10−3−0.902.70 × 10−3
Coagulation factor XF10−1.158.40 × 10−6−1.154.00 × 10−5
14-3-3 protein etaYWHAH−1.163.90 × 10−2−1.871.80 × 10−2
Fibrinogen beta chainFGB−1.173.30 × 10−4−1.177.70 × 10−4
Neuropilin-2NRP2−1.258.20 × 10−4−1.251.50 × 10−3
Inter-alpha-trypsin inhibitor heavy chain H3ITIH3−1.261.40 × 10−10−1.265.00 × 10−9
Ig kappa chain C regionIGKC−1.266.30 × 10−5−1.061.30 × 10−2
Coagulation factor IXF9−1.362.10 × 10−3−1.363.30 × 10−3
Inter-alpha-trypsin inhibitor heavy chain H4ITIH4−1.406.90 × 10−3−1.409.10 × 10−3
Proteoglycan 4PRG4−1.413.90 × 10−4−2.671.50 × 10−5
Plasma protease C1 inhibitorSERPING1−1.421.10 × 10−7−1.428.10 × 10−7
Protein Z-dependent protease inhibitorSERPINA10−1.472.30 × 10−4−3.602.50 × 10−4
14-3-3 protein epsilonYWHAE−1.491.90 × 10−3−1.493.10 × 10−3
Alpha-2-antiplasminSERPINF2−1.509.50 × 10−3−1.951.70 × 10−2
A-kinase anchor protein 12AKAP12−1.519.30 × 10−3−2.792.50 × 10−4
Fibrinogen gamma chainFGG−1.573.60 × 10−3−1.574.90 × 10−3
Nucleosome assembly protein 1-like 1NAP1L1−1.704.80 × 10−3−1.794.90 × 10−2
Ig alpha-1 chain C regionIGHA1−1.762.50 × 10−4−1.765.00 × 10−4
Alpha-1-antichymotrypsinSERPINA3−1.851.30 × 10−9−1.858.30 × 10−9
Nuclear autoantigenic sperm proteinNASP−1.861.60 × 10−2−2.271.00 × 10−2
14-3-3 protein gammaYWHAG−1.891.40 × 10−5−1.893.40 × 10−5
Apolipoprotein B-100APOB−1.938.00 × 10−6−1.932.00 × 10−5
Apolipoprotein FAPOF−2.082.80 × 10−7−2.434.70 × 10−3
Complement C5C5−2.233.80 × 10−7−5.204.30 × 10−7
Protein disulfide-isomerase A4PDIA4−2.251.20 × 10−9−2.254.90 × 10−9
CalreticulinCALR−2.297.50 × 10−7−2.391.70 × 10−6
Apolipoprotein C-IVAPOC4−2.395.00 × 10−10−3.947.00 × 10−10
Heterogeneous nuclear ribonucleoprotein UHNRNPU−2.413.80 × 10−6−3.266.10 × 10−7
Ig mu chain C regionIGHM−2.445.60 × 10−10−2.442.50 × 10−9
Serum amyloid A-2 proteinSAA2−2.561.40 × 10−5−4.371.30 × 10−4
Chromogranin-ACHGA−2.751.60 × 10−5−2.753.40 × 10−5
HaptoglobinHP−2.796.10 × 10−4−2.799.30 × 10−4
Heat shock protein HSP 90-betaHSP90AB1−3.031.80 × 10−4−3.033.00 × 10−4
Tropomyosin alpha-4 chainTPM4−3.053.90× 10−4−3.056.50 × 10−4
Serum amyloid A-1 proteinSAA1−3.239.90 × 10−5−4.838.50 × 10−5
Complement component C9C9−3.342.10 × 10−10−5.329.60 × 10−13
Lipopolysaccharide-binding proteinLBP−3.686.50 × 10−12−4.852.70 × 10−11
Heat shock protein HSP 90-alphaHSP90AA1−3.922.10 × 10−10−3.924.70 × 10−10
Kinesin-like protein KIF20BKIF20B−3.961.30 × 10−9−3.311.30 × 10−3
Histone H4HIST1H4A−4.757.50 × 10−7−4.751.50 × 10−6
Exo-prot expression profiles were evaluated in the HR-NB and LR-NB samples, and comparative analysis of the expression differences between the two sample groups was carried out by a two-sample Student’s t-test after imputation by the RF or QRILC method. Exo-prots are listed by decreasing FC value. a Name of the protein-coding genes. b Fold change values expressed as log2 after the RF imputation method. FC values greater than 0.67 are reported. c p-Value adjusted for FDR (false discovery rate). Adjusted p-values lower than 0.05 are considered significant. d Fold change values expressed as log2 after the QRILC imputation method. FC values greater than 0.67 are reported. e p-Value adjusted for FDR (false discovery rate). Adjusted p-values lower than 0.05 are considered significant.
Table 7. Selection of significant pathways of the Exo-prots regulated in the comparison between the HR-NB and LR-NB samples.
Database aPathway bGene Count cFDR d
GO BP ProcessNegative regulation of endopeptidase activity172.81 × 10−12
GO BP ProcessAcute inflammatory response111.00 × 10−10
GO BP ProcessRegulation of peptidase activity191.57 × 10−10
GO BP ProcessExtracellular matrix organization161.94 × 10−9
GO BP ProcessInflammatory response188.16 × 10−9
GO BP ProcessAcute-phase response82.45 × 10−8
GO BP ProcessRegulation of complement activation81.04 × 10−7
GO BP ProcessPositive regulation of cell motility168.80 × 10−7
GO BP ProcessPositive regulation of cell migration152.95 × 10−6
GO BP ProcessImmune system process323.34 × 10−6
GO BP ProcessMovement of cell or subcellular component232.54 × 10−5
GO BP ProcessRegulation of cell motility182.55 × 10−5
GO BP ProcessRegulation of cell migration174.52 × 10−5
GO BP ProcessPositive regulation of cell communication254.70 × 10−5
GO BP ProcessBlood vessel morphogenesis125.03 × 10−5
GO BP ProcessBlood vessel development135.81 × 10−5
GO BP ProcessBiological adhesion171.10 × 10−4
GO BP ProcessComplement activation, classical pathway51.40 × 10−4
GO BP ProcessRegulation of cell death231.60 × 10−4
GO BP ProcessRegulation of transforming growth factor-beta production51.60 × 10−4
GO BP ProcessPositive regulation of cell–substrate adhesion72.00 × 10−4
GO BP ProcessResponse to cytokines182.00 × 10−4
GO BP ProcessLocomotion192.80 × 10−4
GO BP ProcessVascular endothelial growth factor signaling pathway43.20 × 10−4
GO BP ProcessCell adhesion163.60 × 10−4
GO BP ProcessPositive regulation of chemotaxis75.00 × 10−4
GO BP ProcessRegulation of substrate adhesion-dependent cell spreading55.00 × 10−4
GO BP ProcessCell activation175.30 × 10−4
GO BP ProcessRegulation of cell–substrate adhesion85.30 × 10−4
GO BP ProcessNeural crest cell migration involved in autonomic nervous system development35.40 × 10−4
GO BP ProcessAngiogenesis91.00 × 10−3
GO BP ProcessPositive regulation of substrate adhesion-dependent cell spreading42.20 × 10−3
GO BP ProcessRegulation of cell adhesion125.00 × 10−3
GO BP ProcessToll-like receptor signaling pathway55.70 × 10−3
GO BP ProcessPositive regulation of endothelial cell migration56.20 × 10−3
GO BP ProcessVentral trunk neural crest cell migration21.17 × 10−2
GO BP ProcessTelomerase holoenzyme complex assembly21.17 × 10−2
GO BP ProcessCell–matrix adhesion51.23 × 10−2
GO BP ProcessVascular endothelial growth factor receptor signaling pathway41.24 × 10−2
GO BP ProcessRegulation of leukocyte migration61.55 × 10−2
GO BP ProcessNegative regulation of cell death132.03 × 10−2
GO BP ProcessActin cytoskeleton organization92.04 × 10−2
KEGGPI3K-Akt signaling pathway131.56 × 10−6
KEGGECM–receptor interaction72.75 × 10−5
KEGGFocal adhesion61.85 × 10−2
ReactomeExtracellular matrix organization162.12 × 10−10
ReactomeInnate immune system222.01 × 10−7
ReactomeECM proteoglycans87.05 × 10−7
ReactomeDegradation of the extracellular matrix51.43 × 10−2
GO BP, KEGG and Reactome pathway analyses were carried out with STRING-DB on the Exo-prots differentially expressed in the HR-NB and LR-NB samples. Pathways are listed by increasing false discovery rate values for each ontology. a Name of the ontology defining a pathway. GO BP stands for Gene Ontology biological process. KEGG stands for Kyoto Encyclopedia of Genes and Genomes. b Official name of a GO biological process, KEGG or Reactome pathway. c Number of identified genes. d FDR (false discovery rate) shows p-values corrected for multiple testing within each category using the Benjamini–Hochberg procedure. Values lower than 0.05 are considered significant.
Disclaimer/Publisher’s Note: The statements, opinions and data contained in all publications are solely those of the individual author(s) and contributor(s) and not of MDPI and/or the editor(s). MDPI and/or the editor(s) disclaim responsibility for any injury to people or property resulting from any ideas, methods, instructions or products referred to in the content.

