Article

Effect of Vitamin D3 on Chemerin and Adiponectin Levels in Uterus of Polycystic Ovary Syndrome Rats

1
Laboratory of Physiology and Toxicology of Reproduction, Institute of Zoology and Biomedical Research, Jagiellonian University, 30-387 Krakow, Poland
2
Doctoral School of Exact and Natural Sciences, Jagiellonian University, 30-348 Kraków, Poland
3
Department of Endocrinology, Institute of Zoology and Biomedical Research, Jagiellonian University, 30-387 Krakow, Poland
4
Department of Neurophysiology and Chronobiology, Institute of Zoology and Biomedical Research, Jagiellonian University, 30-387 Krakow, Poland
*
Author to whom correspondence should be addressed.
Cells 2023, 12(16), 2026; https://doi.org/10.3390/cells12162026
Submission received: 10 July 2023 / Revised: 29 July 2023 / Accepted: 7 August 2023 / Published: 8 August 2023
(This article belongs to the Special Issue Adipose Tissue and Metabolic Disease)

Abstract

:
Background: Polycystic ovary syndrome (PCOS) is an endocrine disorder with disrupted uterus structure and function. A positive effect of vitamin D3 (VD3) in female reproduction was observed. Chemerin (RARRES2) and adiponectin (ADIPOQ) are the main adipokines whose levels are altered in PCOS patients. Therefore, the aim of this study was to investigate the impact of VD3 supplementation on RARRES2 and ADIPOQ levels in the uterus of PCOS rats. Methods: We analyzed the plasma levels and uterine transcript and protein expression of RARRES2 and ADIPOQ and their receptors (CCRL2, CMKLR1, GPR1, and ADIPOR1 and ADIPOR2, respectively) in rats with letrozole-induced PCOS. Results: In control animals, VD3 did not change plasma levels of both adipokines, while in PCOS rats supplemented with VD3, they returned to control levels. The expression of RARRES2 and all investigated receptors increased in the uterus of VD3-treated rats; however, the levels of Rarres2 and Gpr1 genes remained unchanged. VD3 supplementation decreased RARRES2, CMKLR1, and GPR1 but increased CCRL2 level to the control value. In the uterus of VD3-treated rats, the transcript and protein levels of ADIPOQ and both receptors ADIPOR1 increased. At the same time, VD3 supplementation induced an increase in Adipoq, Adipor1, and Adipor2 gene expression and restored protein levels to control level values. Conclusions: our findings indicate a new mechanism of VD3 action in the uterine physiology of PCOS rats.

1. Introduction

Polycystic ovary syndrome (PCOS) is an endocrine–metabolic disorder commonly affecting 20–25% of women of reproductive age [1]. The diagnosis is particularly based on two of three criteria: oligo- or anovulation, clinical/biochemical hyperandrogenism, and polycystic ovarian morphology. Women affected with PCOS display hormonal imbalances such as elevated circulating luteinizing hormone (LH), testosterone (T), progesterone (P4), sex hormone-binding globulin (SHBG), and anti-mullerian hormone (AMH) [2]. Moreover, PCOS is associated with metabolic problems, especially insulin resistance, hyperinsulinemia, obesity, impaired glucose tolerance, and type 2 diabetes mellitus [1]. Additionally, literature data suggest that women with PCOS, independent of ovulatory status, have reduced reproductive potential [3] associated with abnormalities in oocyte morphology as well as lower rates of oocyte maturation and fertilization [4]. Moreover, the latest literature data indicate that women with PCOS exhibit pregnancy compilations like a three-to-fourfold increased risk of pregnancy-induced hypertension and preeclampsia (PE), a threefold increased risk of gestational diabetes, and a twofold higher chance for premature delivery [5]. In this regard, a “uterus factor” has been suggested to play a crucial role in infertility and poor pregnancy outcomes in PCOS women. The endometrial function of women with PCOS is altered including abnormalities in thickness, cell cycle, and apoptosis, as well as a disturbance in the regulation of enzymatic and metabolic pathways [6]. For example, in the endometrium tissue of PCOS women, the protein expression of B-cell lymphoma 2 was downregulated; on the other hand, the gene Fas cell surface death receptor was upregulated [7]. Endometrial alterations in PCOS women also include the enhanced expression of receptors for estrogen (ERα), P4 (PRα), and androgen (AR), and the coactivators of AR and ERα [6]. Moreover, it has been shown that the endometrial immune environment in PCOS is altered by increased levels of tumor necrosis factor and nuclear factor kappa B [8]. Interestingly, women with PCOS have a significantly higher risk of endometrial cancer [9].
Recently, the gene and protein expression of VD3, its receptor (VDR), and metabolic enzymes (CYP27B1 and CYP24A1) have been reported in the endometrium and myometrium [10]. Disrupted VD3 levels and metabolism were described in reproductive pathologies such as PCOS, endometriosis, and uterine leiomyoma [11,12]. The latest data demonstrated reduced calcidiol levels in PCOS women, suggesting a relationship between VD3 deficiency and the occurrence of many PCOS symptoms [13]. VD3 deficiency is often associated with disturbed calcium metabolism, which in women with PCOS may inhibit follicle maturation and ovulation. Moreover, a deficiency of plasma level of VD3 in PCOS women [14] also reduces the activity and expression of aromatase, which disturbs the conversion of androgens to estrogens. Recent studies have shown that in PCOS rats, the supplementation of VD3 reduced the thickness of the endometrium and decreased the immunohistochemical staining of caspase-3 and proliferative marker Ki67 as well as the serum AMH level [15,16]. In addition, the supplementation of VD3 affects the plasma chemerin level (RARRES2, retinoic acid 109 receptor responder protein 2) in a rat model of PE [17], and adiponectin (ADIPOQ) levels in diabetic [18] as well as PCOS [19] patients. However, the possible effects of VD3 on uterine adipokines level in PCOS have not been studied. Therefore, in the present study, we examined the impact of VD3 supplementation on the transcript and protein levels of RARRES2 and ADIPOQ, as well as their receptors in the uterus and plasma of PCOS rats.
It is a well-known fact that adipose tissue plays a crucial role in the development and progression of PCOS, manifested by secreting bioactive adipokines, which can modulate metabolism and reproduction [20]. Recently, there has been a growing interest in findings of the changes in circulating levels of adipokines in women with PCOS, and such meta-analysis studies demonstrated higher plasma levels of RARRES2 and a decreased concentration of ADIPOQ in PCOS patients compared to the control subjects [21]. Both RARRES2 and ADIPOQ are adipokines that are mainly produced by adipose tissue and regulate food intake, energy homeostasis, as well as insulin sensitivity by acting via the receptors C-C motif chemokine receptor-like 2 (CCRL2), chemerin chemokine-like receptor 1 (CMKLR1), and G protein-coupled receptor 1 (GPR1) (for RARRES2), and via adiponectin receptor-1 (ADIPOR1) and -2 (ADIPOR2) (for ADIPOQ) [20]. Previous studies demonstrated the expression of RARRES2 and ADIPOQ as well as their receptors in the endometrium in pigs [22,23] and humans [24] as well as ADIPORs in the uterus of pregnant rats [25]. Moreover, both adipokines regulate endometrium physiology by controlling the expression of genes, which are involved in cell proliferation, programmed cell death, angiogenesis, inflammation, and endocrinology [26,27].
The advantages of using the rat model of PCOS include the ability to provide a controlled environment, as well as capitalizing on the short life cycle to explore both reproductive and long-term metabolic effects [28]. Moreover, letrozole-induced PCOS model rats exhibit acyclicity and cystic ovarian morphology corresponding to human PCOS, as well as elevated serum LH levels [29]. It is also important to be aware of limitations, such as that rodents are multiovulatory species with some polymorphic variations of genes coding steroidogenic enzymes [30], which may have an impact on the outcome [31]. Additionally, limitations may also vary between the rat and female uterus. Humans have lightbulb-shaped uteri with mixed muscle layers, whereas rats have two-horned uteri with defined muscle layers [32]. The latest data showed that adenosine triphosphate-sensitive potassium channels may play different roles in the rat and human myometrium [32].
We hypothesize that the supplementation of VD3 in PCOS rats affects the transcript and protein levels of RARRES2 and ADIPOQ, as well as its receptors in the uterus and plasma levels of both adipokines. Therefore, the aim of the current study was to (i) confirm the induction of PCOS in rats by measuring plasma levels of steroids: T and estradiol (E2) and metabolic parameters: glucose, triglycerides, total cholesterol, and high-density lipoprotein (HDL) levels as well as the characterization of ovarian and uterus histology; (ii) describe plasma levels of RARRES2 and ADIPOQ; and (iii) mRNA and protein expression of RARRES2 and its receptors, CCRL2, CMKLR1, GPR1, as well as ADIPOQ, and its receptors ADIPOR1 and ADIPOR2 in the uterine of control and PCOS-induced rats.

2. Materials and Methods

2.1. Reagents

TRI reagent solution (cat. no. 15596018), a high-capacity cDNA reverse transcription kit (cat. no. 4368814), and tissue protein extraction reagent (cat. no. 78510) were purchased from ThermoFisher Scientific, Waltham, MA, USA. In total, 4–20% mini protean-gels and trans blot turbo mini PVDF (cat. no. 1704156) were purchased from Bio-Rad Laboratories, Hercules, CA, USA. WesternBright Sirius HRP substrate (cat. no. K-12043 D30) was purchased from Advansta Inc., San Jose, CA, USA. Letrozole (cat. no. L6545), 3′3′-aminopropyl-triethoxysaline-coated (cat. no. A-3648), eosin Y (cat. no. 1.09844), dibutylphtalate xylene (cat. no. 06522), and 3,3′-diaminobenzidine (cat. no. 857734) were purchased from Sigma-Aldrich, St. Louis, MO, USA. Hematoxylin QS (cat. no. H-3404) and StreptABCcomplex-HRP (cat. no. PK-6100) were purchased from Vector Laboratories, Newark, CA, USA.

2.2. Animals and Experimental Protocol

Six-week-old female Wistar rats (weighing 176.9 g ± 14.54 g) were purchased from the Faculty of Pharmacy JU Medical College (Kraków, Poland). Animals were housed in controlled conditions of temperature, humidity, and light (LD 12/12) with ad libitum availability of food and water. Rats were allowed to acclimate for one week before subsequent one-week-long handling and treatment. All experimental protocols listed herein were approved by the Local Animal Ethics Committee, Poland (permit no. 70/2021, Krakow, Poland).
PCOS was induced in rats via the oral administration of a nonsteroidal aromatase inhibitor letrozole [33]. Briefly, rats (n = 32) were randomly assigned to one of the four experimental groups: control (in proestrous), VD3 (500 IU VD3/day, Vigantol 20,000 IU/mL, P&G Health, Darmstadt, Germany)-treated, PCOS, and VD3-treated PCOS group (n = 8 per each group) (Figure 1). The dose of VD3 was chosen based on previous [34] and our preliminary studies. A daily treatment regime of 21 days included oral administration through the gavage of either 2% (v/v) dimethyl sulfoxide (DMSO; Sigma-Aldrich) in rapeseed oil (1 mL/kg body weight) in the control group or letrozole (1 mg/kg body weight) dissolved in 2% DMSO in rapeseed oil. The rats were weighed daily for 21 consecutive days of the experiment, and the estrous cyclicity was assessed. The animals were deeply anesthetized via the inhalation of 4% isoflurane in an enclosed vessel. Trunk blood was collected in a tube and centrifuged at 4000× g for 10 min at 4 °C, and the plasma was stored at −20 °C for further analyses. The uterus and ovary were dissected out, fixed in formalin or snap-frozen in liquid nitrogen and stored at −80 °C for RNA and protein isolation. To verify PCOS induction, after 21 days of treatment, plasma levels of steroids: T and E2 and metabolic parameters: glucose, triglycerides, total cholesterol, and HDL as well as ovarian and uterus histology were analyzed.

2.3. Ovarian and Uterus Histology

Paraplast-embedded ovaries and uteri were cut into 5 μm thick sections and mounted on 3′3′-aminopropyl-triethoxysaline-coated slides. After deparaffinization and rehydration, tissue sections were stained with hematoxylin QS and eosin Y. Next, the stained slides were dehydrated, mounted in DPX, and coverslipped. Digital images were collected using an Axio Scope A1 microscope with EC Epiplan-NEOFLUAR objectives equipped with a Nikon Eclipse Ni-U microscope using a Nikon Digital DS-Fi1-U3 camera (Nikon, Japan) and Niko NIS-ELEMENT Image Software.

2.4. ELISA

The commercially available ELISA kits were used to determine the plasma level of T and E2 (cat no. EIA-1559, EIA-2693, respectively, DRG Instruments GmbH, Marburg, Germany). The sensitivity of the assays was 0.083 ng/mL for T and 9.714 pg/mL for E2. The inter- and intra-experimental coefficients of variation were <9.94% and <4.16% for T or <9.39% and <6.81% for E2.
The commercially available ELISA kits were used to determine the plasma level of RARRES2 and ADIPOQ (cat. no. ER0834, FineTest, Wuhan, China; cat. no. E-EL-R3012, Elabscience, Houston, TX, USA, respectively). The sensitivity of the assays was 18.75 pg/mL for RARRES2 and 0.94 ng/mL for ADIPOQ. The inter- and intra-experimental coefficients of variation were <10% and <8% for RARRES2 as well as <5% and <4.5% for ADIPOQ. All analyses were performed in duplicate.

2.5. Colorimetric Assays

The commercially available colorimetric assays were used to determine the plasma level of glucose, triglycerides, total cholesterol, and HDL (cat. no G7521, T7532, C7510, and H7511, respectively; Pointe Scientific, Warsaw, Poland). The concentration of the low-density lipoprotein (LDL) fraction was calculated using the following formula: LDL = total cholesterol-HDL (triglycerides/5). Detection limits were 1 mg/dL for glucose, 5 mg/dL for triglycerides, 3 mg/dL for total cholesterol, and 3 mg/dL for HDL. The intra-assay and inter-assay coefficients of variation for glucose, triglycerides, total cholesterol, and HDL were 1.1% and 2.5%, 1.62% and 1.92%, 1.32% and 1.93%, and 4.7% and 5.1%, respectively. All analyses were performed in duplicate.

2.6. Real-Time PCR

Total RNA was extracted from the uterus using TRI Reagent solution according to the manufacturer’s protocol. The quality of RNAs was evaluated by measuring the A260/A280 ratio using a NanoDrop™Lite Spectrophotometer (Thermo Scientific). Total RNA (1 µg) was used as a template in cDNA synthesis with High-Capacity cDNA Reverse Transcription Kit. Real-time PCR analyses were performed using StepOne Real-Time PCR (Applied Biosystems, Norwalk, CT, USA). TaqMan Gene Expression Assays were used to quantify the mRNA expression of adipokines and their receptor genes (Table 1). Quantitative PCR was performed with 100 ng cDNA, 1 mL TaqMan Gene Expression primers, and 10 mL TaqMan PCR master mix (Applied Biosystems) in a final reaction volume of 20 mL. After a 2 min incubation at 50 °C, the thermal cycling conditions were 10 min at 95 °C, followed by 40 cycles of 15 s at 95 °C and 1 min at 60 °C to determine the cycle threshold number (Ct) for quantitative measurement. The relative mRNA expression levels of adipokines and their receptor genes relative to GAPDH were determined using the 2−ΔCt method [35]. Briefly, the cycle threshold (Ct; defined as the cycle number at which the fluorescence exceeds the threshold level) was determined for each sample. The Ct value of the reference gene, GAPDH, was subtracted from the Ct value of the gene of interest (ΔCt) and the relative expression was presented as 2−ΔCt. These 2−ΔCt values were used to calculate the statistical differences. The values are expressed as a relatively arbitrary unit.

2.7. Western Blotting

Western blotting and quantification were performed as previously described [36]. In brief, tissue was homogenized twice in ice-cold lysis buffer, and then the lysates were cleared by centrifugation at 15,000× g for 15 min at 4 °C. The protein content was determined via a protein assay using bovine serum albumin (BSA) as a standard and then Western blots for RARRES2 and its receptors CCRL2, CMKLR1, GPR1, as well as ADIPOQ and its receptors ADIPOR1 and ADIPOR2 in the uterine were performed. Briefly, 30 μg of protein was separated by 4–20% SDS–PAGE transferred onto a PVDF membrane (BioRad Mini-Protean 3 apparatus, Bio-Rad Laboratories). The blots were blocked for 2 h with 5% w/v BSA and 0.1% v/v Tween 20 in 0.02 M Tris-buffered saline buffer (TBS). Next, the blots were incubated with primary antibodies for anti-RARRES2 (cat. no. ab103153, Abcam, Waltham, MA, USA), anti-CCRL2 (cat. no. ab88632, Abcam), and anti-CMKLR1 (cat. no. SAB4500334, Sigma-Aldrich) diluted at 1:500 as well as anti-GPR1 (cat. no. ab169331, Abcam), anti-ADIPOQ (cat. no. PA1-054, Thermo Scientific), anti-ADIPOR1 (cat. no. PA5-35347, Thermo Scientific), and anti-ADIPOR2 (cat. no. PA1-12759, Thermo Scientific) diluted at 1:1000 at 4 °C overnight. Then, the membrane was incubated with secondary antibody anti-mouse (cat. no. 7076S, Cell Signaling, Beverly, MA, USA) or anti-rabbit (cat. no. 7074S, Cell Signaling) diluted at 1:1000 for 1 h before chemiluminescence using WesternBright Quantum HRP substrate and visualized using a Chemidoc XRS + System (Bio-Rad). All visible bands were quantified using a densitometer and ImageJ software (US National Institutes of Health, Bethesda, MD, USA). β-actin (ACTB) (cat. no. A5316, Sigma-Aldrich) was also detected as a loading control. Semi-quantitative analysis was performed for three separately repeated experiments.

2.8. Immunohistochemistry

Immunohistochemistry was conducted on formalin-fixed, paraffin-embedded, 5 μm thick uterine sections as previously described from four rats per each group [12]. Sections were deparaffinized in xylene, rehydrated in decreasing gradient of ethanol, and subjected to microwave (750 W) antigen retrieval in 0.01 M (w/v) citrate buffer (pH 6.0). Endogenous peroxidase activity was blocked with 0.3% (v/v) hydrogen peroxide in TBS for 20 min, and non-specific binding sites were blocked with 5% (v/v) normal goat (for ADIPOQ, ADIPOR1, and CMKLR1) or horse (for RARRES2) serum in TBS for 40 min. After overnight incubation at 4 °C in a humidified chamber with the primary antibodies anti-ADIPOQ (dilution 1:50), anti-ADIPOR1 (dilution 1:50), anti-RARRES2 (dilution 1:100), and anti-CMKLR1 (dilution 1:200), the sections were immersed for 1.5 h at room temperature with anti-rabbit or anti-mouse secondary antibodies (dilution 1:300; Vector Laboratories, USA) followed by the incubation with an avidin–biotin–peroxidase complex (dilution 1:100, 40 min at room temperature, StreptABComplex-HRP) and then with 3,3′-diaminobenzidine as a chromogen. Sections were then counterstained with hematoxylin QS, dehydrated, fixed in xylene, and mounted using DPX. Negative controls were incubated with non-immune rabbit or mouse IgGs instead of primary antibodies and processed as above. Selected sections were photographed under a Nikon Eclipse Ni-U microscope using a Nikon Digital DS-Fi1-U3 camera (Nikon, Tokyo, Japan) and Nikon NIS-ELEMENT Image Software. To evaluate the intensity of the immunoreaction quantitatively, digital images from at least 10 different sections of each examined animal were analyzed using ImageJ software. The intensity of RARRES2, CMKLR1, ADIPOQ, and ADIPOR1 staining was expressed as a relative optical density (ROD) and was calculated using the following formula: ROD = ODspecimen/ODbackground = log(GLblank/GLspecimen)/log(GLblank/GLbackground); where OD—optical density, GL—grey level, specimen—stained area, background—unstained area, and blank—grey level measured after removing the slide from the light path.

2.9. Statistical Analysis

Statistical data are presented as the means ± standard error of the mean (SEM). The distribution of normality was checked with the Shapiro–Wilk test. Statistical analysis was carried out using one-way or two-way ANOVA, followed by Tukey’s test (PRISM software version 8; GraphPad, La Jolla, CA, USA). Statistically significant differences (p < 0.05) between points in each graph are indicated by different letters (a < b < c < d), identical letters indicate a lack of significant differences.

3. Results

3.1. Plasma Levels of Hormonal and Metabolic Parameters, and Ovarian Morphology in PCOS Rats

Plasma concentrations of steroid hormones and metabolic parameters are presented in Table 2. In PCOS rats, the plasma level of T increased, while the E2 concentration was lower compared to the control rats (p < 0.05). We noted elevated plasma levels of glucose, triglyceride, cholesterol, HDL, and LDL in PCOS rats vs. control (p < 0.05).
We also observed that control rats displayed normal follicular development with preantral follicles and antral follicles, whereas PCOS rats resulted in ovarian cysts and a lack of corpora lutea (Figure 2).

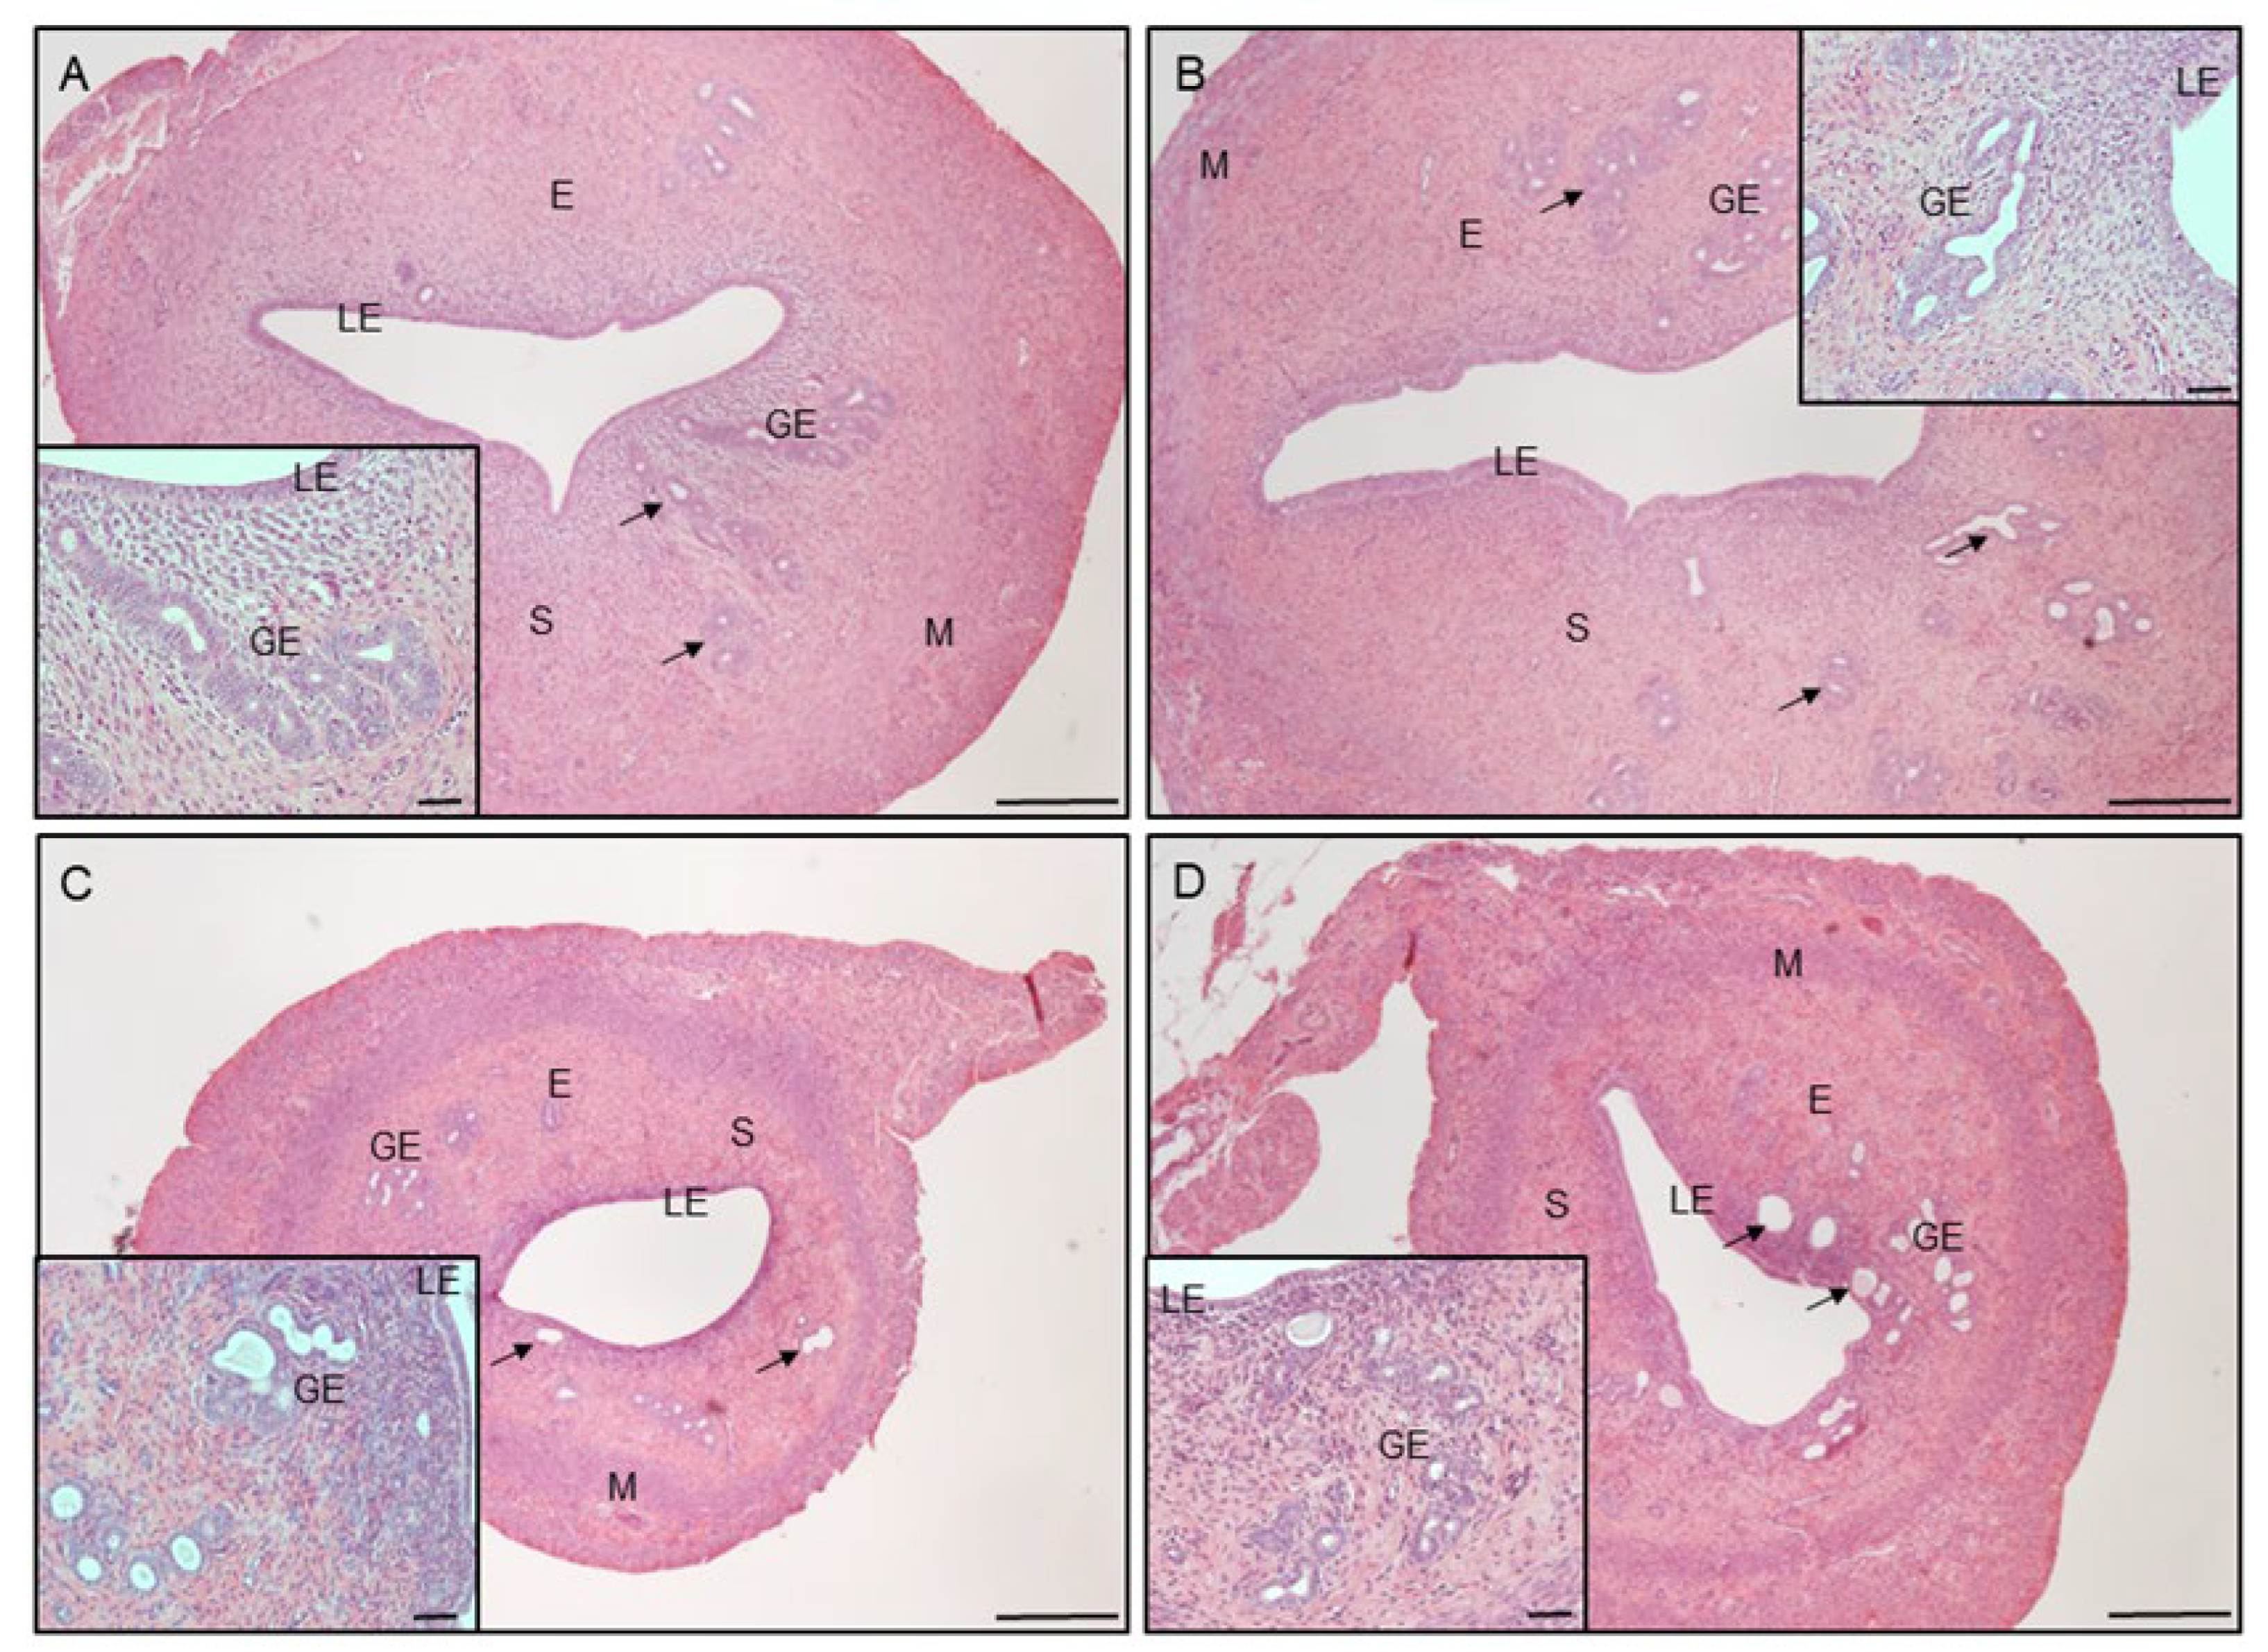
3.2. Uterine Histology

In all examined groups, uteri comprised the endometrium and the myometrium layers. The endometrium includes luminal (LE) and glandular epithelium (GE), and stroma cells (Figure 3A–D). However, in PCOS rats (Figure 3C) and in PCOS rats treated with VD3 (Figure 3D), the uteri were smaller in cross-sections, and the endometrial compartment was thinner in those groups (Figure 3C,D). The endometrial glands in PCOS (Figure 3C, arrows; inset) and PCOS rats treated with VD3 (Figure 3D, arrows; inset) were round and unbranched in comparison to the control (Figure 3A, arrows; inset) and VD3-treated (Figure 3B, arrows; inset) groups.

3.3. Effect of VD3 on Plasma Level of RARRES2, ADIPOQ and Steroids in PCOS Rats

As shown in Figure 4A, VD3 treatment did not affect RARRES2 plasma concentration in control rats, while in PCOS rats, we noted higher levels of RARRES2 (p < 0.05). In PCOS rats supplemented with VD3, we found decreased plasma levels of RARRES2 compared to the PCOS group but not to the control levels (Figure 4A, p < 0.05). The plasma concentration of ADIPOQ in the VD3-treated group was not changed but was decreased in PCOS rats (Figure 4B, p < 0.05). VD3 supplementation in PCOS rats resulted in an increase in ADIPOQ levels toward control values.
We observed that the plasma level of T did not change in the VD3-treated control group, increased in PCOS rats, but markedly decreased in PCOS supplemented with VD3 vs. PCOS rats, but not vs. the control levels (Figure 4C, p < 0.05). The plasma E2 concentration decreased in VD3-treated and PCOS rats vs. control; however, in PCOS rats supplemented with VD3, E2 increased to the same level as in the control group (Figure 4D, p < 0.05).

3.4. Effect of VD3 on Gene and Protein Expression of RARRES2 and Its Receptors in the Uterus of PCOS Rats

The gene expression of Rarres2 was unchanged in the uterus of the VD3-treated control group, whereas was higher in PCOS rats (Figure 5A, p < 0.05), and decreased to the control level in PCOS rats treated with VD3. However, we noted that the protein expression of RARRES2 was greater in the uterus of VD3-treated and PCOS rats, while in PCOS supplemented with VD3, we observed a lower expression of RARRES2 in the uterus vs. the control group (Figure 5B, p < 0.05).
We demonstrated that Ccrl2 mRNA expression markedly increased in the uterus of all experimental groups: VD3-treated, PCOS-induced, and PCOS-supplemented with VD3 (Figure 5C, p < 0.05). These results were confirmed for the protein levels of CCRL2 in the uterus (Figure 5D, p < 0.05).
The transcript levels of Cmklr1 in the uterus were higher in the VD3-treated group vs. the control group (Figure 5E, p < 0.05). We observed that in the uterus of PCOS rats, the expression of Cmklr1 was lower compared to the control group, and the supplementation of PCOS rats with VD3 did not differ between PCOS rats but decreased vs. the control. The protein abundance of CMKLR1 in the uterus was higher in the VD3-treated and PCOS groups (Figure 5F, p  <  0.05) when compared to the controls, while in PCOS rats treated with VD3, we noted lower CMKLR1 expression vs. the control.
The gene expression of Gpr1 was higher in the uterus in the PCOS group compared to the control rats (Figure 5G, p < 0.05). The supplementation of VD3 in the PCOS rats decreased transcript Gpr1 expression in the uterus to the control level. However, the protein expression of GPR1 markedly increased in the uterus of the VD3-treated group, while in the PCOS and PCOS treated with VD3 groups, it was significantly decreased (Figure 5H, p < 0.05).

3.5. Effect of VD3 on Cellular Immunolocalization of RARRES2 and CKMLR1 in the Uterus of PCOS Rats

RARRES2 and CMKLR1 were found in LE and GE, while CMKLR1 appeared additionally in the stroma cells of all examined groups (Figure 6). The intensity of RARRES2 immunoreaction within LE was greater in the VD3-treated, PCOS, and PCOS-and-VD3-treated groups than in the control, and lower in the PCOS-and-VD3-treated rats than in the VD3-treated rats (Figure 6K, p < 0.05). The intensity of the RARRES2 immunoreaction within GE did not differ between the groups (Figure 6K). Regarding the intensity of the CMKLR1 immunoreaction, there were no significant differences between the examined groups either in LE or GE and stroma (Figure 6L).

3.6. Effect of VD3 on Gene and Protein Expression of ADIPOQ and Its Receptors in the Uterus of PCOS Rats

As shown in Figure 7A, the mRNA expression of Adipoq in the uterus of the VD3-treated group was higher, while in the PCOS group, it was decreased compared to the control rats (p < 0.05). We observed that in the PCOS rats supplemented with VD3, the expression of Adipoq increased vs. the control group. A similar effect was noted in the protein abundance of ADIPOQ in the uterus of all experimental groups, except PCOS rats treated with VD3, where the ADIPORQ was at the same level as in the control rats (Figure 7B, p < 0.05).
The expression of Adipor1 mRNA in the uterus was higher in the VD3-treated vs. the control group, lower in PCOS rats, and increased in the PCOS supplemented with VD3 groups (Figure 7E, p < 0.05). A similar effect we found at the protein levels in the uterus of ADIPOR1 in VD3-treated and PCOS rats, while in the PCOS-treated VD3 group, the ADIPOR1 protein expression increased to the control level (Figure 7D, p < 0.05).
We noted that transcript levels of Adipor2 increased in the uterus of all experimental groups (Figure 7E, p < 0.05). For the protein level, we observed that ADIPOR2 in the uterus markedly increased in the VD3 and decreased in the PCOS groups (Figure 7D, p < 0.05), while in the PCOS rats supplemented with VD3, the protein expression of ADIPOR1 increased to the control level.

3.7. Effect of VD3 on Cellular Immunolocalization of ADIPOQ and AdipoR1 in the Uterus of PCOS Rats

ADIPOQ and ADIPOR1 were detected in the LE and GE as well as in the stromal cells of the control (Figure 8A,F, respectively), VD3 (Figure 8B,G, respectively), PCOS (Figure 8C,H, respectively), and PCOS treated with VD3 (Figure 8D,I, respectively) groups. The intensity of the ADIPOQ immunoreaction was similar between the groups within the LE and GE, while in the stroma, the ADIPOQ signal was lower in the PCOS rats than in the VD3-treated animals (Figure 8K, p < 0.05). The intensity of the ADIPOR1 immunoreaction did not differ between the groups within the LE, GE, and stroma (Figure 8L).

4. Discussion

A positive effect of VD3 supplementation on the uterus alteration of PCOS patients was demonstrated in previous studies. For example, VD3 treatment could increase endometrial thickness in intrauterine-inseminated women with PCOS and increase the success rate of intrauterine insemination [37]. Moreover, supplementation with calcium and ergocalciferol for 2 months improved the menstrual regularity of women with PCOS and hypovitaminosis D [38]. A pilot study revealed that supplementation with VD3 improves glucose metabolism and menstrual frequency in PCOS women [39] and gonadotropin concentrations in induced PCOS in rats [40]. Our previous study demonstrates that the ovarian conversion of the circulating 25OHD3 to active 1,25(OH)2D3 is decreased in the PCOS rat model, and this may contribute to the VD3 deficiency observed in PCOS [12]. To the best of our knowledge, this is the first study investigating the effect of VD3 supplementation in PCOS rats on plasma levels of two adipokines—RARRES2 and ADIPOQ—as well as the transcript and protein expression of these adipokines and their receptors in the uterus. We found that VD3 supplementation does not influence the plasma levels of RARRES2 and ADIPOQ, while in PCOS rats supplemented with VD3, the concentration of plasma adipokines returns to the levels of the control group. Moreover, we noted variations in the gene and protein expression of RARRES2 and ADIPOQ and their receptors in the uterus of PCOS rats. In our study, we used a letrozole-induced rat model of PCOS, which exhibits hormonal, reproductive, and metabolic signs similar to PCOS women [33]. In the PCOS rats, we observed significantly higher plasma concentrations of T and lower E2 levels compared to the control. Additionally, metabolic parameters like glucose, triglyceride, cholesterol, HDL, and LDL were increased in the PCOS rats. Moreover, in the PCOS ovaries, we noted cystic follicles and a lack of corpora lutea; therefore, the PCOS model was confirmed via histology, endocrinology, and metabolic parameters in the present study, as previously described [41]. The metabolic dysfunction of PCOS women also contributed to increased endometrial thickness and hyperplasia [42].
Treatment with VD3 in rats with PCOS significantly decreased the T concentration and increased the E2 levels. Our study, in agreement with Behmanesh et al. [40], demonstrated significant PCOS-related changes in steroids: P4, T, and E2 levels. Moreover, VD3 supplementation in PCOS rats increased insulin sensitivity and thereby stimulated the development of the dominant follicles and the ovulation of matured follicles, suggesting that VD3 treatment can protect ovarian tissue from the negative effects of PCOS [40]. Besides the ovary, hormonal changes also influence the uterus histology. We have observed that the uterus in PCOS and PCOS treated with VD3 rats was smaller in cross-section with thinner endometrium and unbranched glands in comparison to the control and VD3-treated groups. That is in agreement with the results of Yan et al. [7], who noted reduced uterine weight, endometrium thickness, and number of endometrial glands following letrozole administration.
It has been reported that the plasma levels of circulating adipokines are changed in PCOS patients [43] and they are a link between infertility related to obesity and the development of PCOS. ADIPOQ is the most abundantly secreted adipokine by the adipose tissue, and the latest data show that there is a significantly lower circulating level of ADIPOQ in PCOS women [43]. On the other hand, PCOS women have elevated levels of RARRES2, which is associated with insulin resistance and inflammation [44]. In our study, we observed an elevated plasma level of RARRES2 in PCOS rats compared to the control group, which is in agreement with the results obtained in PCOS women [43]. The serum concentration of RARRES2 was positively correlated with the T level in women [45] and negatively correlated with the serum E2 level in men [46], which we also observed in induced PCOS rats. Interestingly, our data show that VD3 treatment has no effect on plasma RARRES2 levels; however, we observed that after VD3 supplementation in PCOS rats, the concentration of RARRES2 was significantly reduced to the control level. Literature data on the effect of VD3 on RARRES2 levels are limited. Nassar and Badae [17] observed that in a rat model of PE supplementation of VD3 decreased serum RARRES2 levels, which was significantly increased in PE-untreated rats. Additionally, Abeer et al. [47], demonstrated that VD3 supplementation in gestational-diabetes-mellitus-induced rats reduces circulating RARRES2 levels, which partly confirms the results obtained in the present study. Our results showed that the transcript and protein levels of RARRES2 and its receptors, CCRL2, CMKLR1, and GPR1, were markedly changed in the uterus after VD3 supplementation. We observed that levels of RARRES2 and all its receptors increased in the uterus in VD3-treated rats, except for Rarres2 and Gpr1 mRNA expression. Interestingly, VD3 supplementation in PCOS rats decreased the uterine expression of RARRES2 and the receptors CMKLR1 and GPR1 but increased CCRL2. In our data, we observed a difference in the transcripts’ contents and the corresponding abundance of proteins. Schwanhäusser et al. [48] suggest that such differences in the transcripts and the corresponding proteins could arise from mRNA binding by specific proteins, the regulation of expression by microRNAs, and RNA and protein stability. Similarly, our previous study documented that the Smim20 (precursor of neuropeptide phoenixin-14) mRNA expression in the hypothalamus of PCOS rats was not parallel with the phoenixin-14 protein levels [41]. Moreover, the difference in the transcript and protein levels of RARRES2 and its receptors can be explained by transcriptional, post-transcriptional, and translational regulations and discrepancies in mRNA and protein stability [49]. RARRES2 and CMKLR1 were found in the luminal and glandular epithelium, while CMKLR1 was additionally found in the stroma cells of all examined groups. In addition, the intensity of the RARRES2 immunoreaction was changed within the luminal epithelium and was lower in PCOS rats treated with VD3 than in the group supplemented with VD3 alone, which is partly similar to results obtained herein from Western blot analysis. Our results are partly in agreement with the data of Roman and Sinal [50], who observed that VD3 may regulate the expression of RARRES2 in human adipocyte precursors. On the other hand, Nagpal et al. [51] demonstrated that VD3 has no effect on the total RNA level of RARRES2 in human skin raft cultures, which we also observed in the uterus. The results of this study indicated that only the expression of CCRL2 increased significantly in the uterus of PCOS rats supplemented with VD3. The data of De Henau et al. [52] demonstrated that, unlike CMKLR1 and GPR1, CCRL2 does not mediate the signal transduction/intracellular signaling pathway and is presently considered as an atypical receptor able to present the protein to cells expressing CMKLR1, so the molecular mechanism of our observation should be explained in future studies. CCRL2 is expressed by many cell types including leukocyte subsets and endothelial cells, and its expression is strongly upregulated by inflammatory stimuli [53]. Additionally, previous data demonstrated that RARRES2 regulates P4 and E2 synthesis [54] as well as affects the transcriptomic profile of the porcine endometrium, controlling the expression of numerous genes, including those involved in the cell migration and adhesion, angiogenesis, inflammation, and steroidogenesis [27]. Our study for the first time documented that levels of RARRES2 and all receptors, except the Cmklr1 transcript and GPR1 protein, increased in the uterus of PCOS rats. This is in line with the results of Luo et al. [55], who observed that the expression of RARRES2 and CMKLR1 was higher in the ovary of the rat model of PCOS. Additionally, previous reports documented that RARRES2, through CMKLR1, regulates steroid secretion in granulosa cells collected from PCOS women [56]. Our study provides novel data on PCOS endocrinology; the supplementation of VD3 in PCOS rats decreased the plasma level of RARRES2 and the uterine expression of RARRES2, CMKLR1, and GPR1.
In the present study, we also demonstrated that the plasma ADIPOQ level did not change after VD3 treatment, decreased in PCOS rats, and increased in VD3-supplemented PCOS rats. Literature data suggest that in humans, the plasma ADIPOQ concentration negatively correlates with body mass index and insulin resistance and is lower in patients with type 2 diabetes [57] and PCOS [43]. Meta-analysis data showed no significant effect of VD3 on the plasma concentration of ADIPOQ [58], which is in line with our current results. However, we found that in VD3-treated rats, the transcript and protein levels of ADIPOQ and both receptors, ADIPOR1 and ADIPOR2, significantly increased in the uterus. Our results are in accordance with data from previous studies which indicated that VD3 treatment elevates the protein expression of ADIPOQ in adipose cells via post-transcription-dependent mechanisms involving endoplasmic reticulum proteins [59]. On the other hand, Lorente-Cebrián et al. [60] documented that VD3 did not affect ADIPOQ mRNA expression in human subcutaneous adipose tissue while decreasing ADIPOQ secretion. Little is known about the molecular mechanism of VD3’s impact on ADIPOQ levels. Literature data suggest that VD3 may affect ADIPOQ levels through the renin–angiotensinogen system by decreasing angiotensin production; this biomolecule is associated with the production of dysfunctional adipocytes, and, in consequence, it may lead to decreased ADIPOQ production [61]. Other studies suggest that VD3 may be associated with increased serum ADIPOQ levels by decreasing the gene expression of TNFα [62]. Additionally, other factors like how the peroxisome proliferator-activated receptor gamma (PPAR-γ) agonist increases the expression of ADIPOR2, and insulin inhibits its expression through the phosphoinositide 3-kinases pathway in porcine preadipocytes [63]. In the present study, we observed that VD3 supplementation in PCOS rats increased the transcript abundance of Adipoq, Adipor1, and Adipor2 in the uterus and led to the return of the protein levels to the control values. Our results are in agreement with Seyyed et al. [19], who observed that in PCOS women treated with VD3, the ADIPOQ plasma level was significantly increased. Comim et al. [64] show that in antral follicles, Adipor1 and Adipor2 mRNA expression was reduced in theca cells from polycystic ovaries compared with theca from normal ovaries, while no differences were observed between polycystic ovaries and normal ovaries in the proportions of granulosa cells in antral follicles expressing ADIPOR1 or ADIPOR2. Moreover, silencing ADIPOR1 and ADIPOR2 in theca cells results in the enhanced production of androgens [64]. ADIPOQ and ADIPOR1 were detected in the luminal and glandular epithelium as well as in the stromal cells of the control, VD3, PCOS, and PCOS supplemented with VD3 groups. However, there were no significant differences in the intensity of the ADIPOQ and ADIPOR1 immunoreaction between the analyzed groups within the luminal and glandular epithelium as well as in the stroma cells.

5. Conclusions

In conclusion, to the best of our knowledge, the present study is the first to document the effect of VD3 supplementation on the plasma levels of RARRES2 and ADIPOQ, as well as their transcript and protein expression in the uterus of PCOS rats. VD3 supplementation in PCOS rats decreased the expression of RARRES2, CMKLR1, and GPR1 but increased the CCRL2 levels. Moreover, VD3 supplementation in PCOS rats increased the transcript of Adipoq, Adipor1, and Adipor2 in the uterus and brought them to the control protein expression. Our findings indicate a new mechanism of action of VD3 in the uterus physiology in PCOS rats.

Author Contributions

K.P. participated in the methodology, validation, formal analysis, investigation, resources, writing drafts, and visualization. J.R. participated in the investigation. K.K. participated in the investigation. M.T. participated in the investigation. A.S. participated in the investigation. P.S. participated in the investigation. A.B. participated in obtaining resources, conceptualization, methodology, validation, formal analysis, and writing drafts. M.G. participated in obtaining resources, conceptualization, methodology, validation, formal analysis, and writing drafts. A.R. participated in obtaining resources, conceptualization, methodology, validation, formal analysis, writing drafts, and supervision. All authors have read and agreed to the published version of the manuscript.

Funding

The research was supported by a grant from the Priority Research Area (POB BioS) under the Strategic Programme Excellence Initiative-Research University at Jagiellonian University (U1U/P03/NO/14.87 to MG).

Institutional Review Board Statement

Procedures of animal experiments in this study were approved by the 1st Local Ethical Commission on Animal Research (70/2021, Krakow, Poland) and conducted in accordance with the directives 2010/63/EU of the European Parliament (2010) and the Act on the Protection of Animals Used for Scientific or Educational Purposes (2015).

Informed Consent Statement

Not applicable.

Data Availability Statement

The comprehensive study protocol is available from the authors. Data can be provided by the authors upon request.

Acknowledgments

The authors thank BioRender for the figures. Created with BioRender.com (accessed on 29 January 2022).

Conflicts of Interest

The authors declare no conflict of interest.

References

  1. Bruni, V.; Capozzi, A.; Lello, S. The Role of Genetics, Epigenetics and Lifestyle in Polycystic Ovary Syndrome Development: The State of the Art. Reprod. Sci. 2022, 29, 668–679. [Google Scholar] [CrossRef]
  2. De Leo, V.; Musacchio, M.C.; Cappelli, V.; Massaro, M.G.; Morgante, G.; Petraglia, F. Genetic, hormonal and metabolic aspects of PCOS: An update. Reprod. Biol. Endocrinol. 2016, 14, 38. [Google Scholar] [CrossRef] [Green Version]
  3. Palomba, S. Is fertility reduced in ovulatory women with polycystic ovary syndrome? An opinion paper. Hum. Reprod. 2021, 36, 2421–2428. [Google Scholar] [CrossRef] [PubMed]
  4. Palomba, S.; Daolio, J.; La Sala, G.B. Oocyte Competence in Women with Polycystic Ovary Syndrome. Trends Endocrinol. Metab. 2017, 28, 186–198. [Google Scholar] [CrossRef]
  5. Palomba, S.; de Wilde, M.A.; Falbo, A.; Koster, M.P.; La Sala, G.B.; Fauser, B.C. Pregnancy complications in women with polycystic ovary syndrome. Hum. Reprod. Update 2015, 21, 575–592. [Google Scholar] [CrossRef] [Green Version]
  6. Palomba, S.; Piltonen, T.T.; Giudice, L.C. Endometrial Function in Women with Polycystic Ovary Syndrome: A Comprehensive Review. Hum. Reprod. Update 2021, 27, 584–618. [Google Scholar] [CrossRef] [PubMed]
  7. Yan, L.; Wang, A.; Chen, L.; Shang, W.; Li, M.; Zhao, Y. Expression of Apoptosis-Related Genes in the Endometrium of Polycystic Ovary Syndrome Patients during the Window of Implantation. Gene 2012, 506, 350–354. [Google Scholar] [CrossRef]
  8. Oróstica, L.; Astorga, I.; Plaza-Parrochia, F.; Vera, C.; García, V.; Carvajal, R.; Gabler, F.; Romero, C.; Vega, M. Proinflammatory Environment and Role of TNF-α in Endometrial Function of Obese Women Having Polycystic Ovarian Syndrome. Int. J. Obes. 2016, 40, 1715–1722. [Google Scholar] [CrossRef]
  9. Ding, D.-C.; Chen, W.; Wang, J.-H.; Lin, S.-Z. Association between Polycystic Ovarian Syndrome and Endometrial, Ovarian, and Breast Cancer: A Population-Based Cohort Study in Taiwan. Medicine 2018, 97, e12608. [Google Scholar] [CrossRef] [PubMed]
  10. Grzesiak, M.; Waszkiewicz, E.; Wojtas, M.; Kowalik, K.; Franczak, A. Expression of Vitamin D Receptor in the Porcine Uterus and Effect of 1,25(OH)2D3 on Progesterone and Estradiol-17β Secretion by Uterine Tissues in Vitro. Theriogenology 2019, 125, 102–108. [Google Scholar] [CrossRef] [PubMed]
  11. Ingles, S.A.; Wu, L.; Liu, B.T.; Chen, Y.; Wang, C.-Y.; Templeman, C.; Brueggmann, D. Differential Gene Expression by 1,25(OH) 2D3 in an Endometriosis Stromal Cell Line. J. Steroid Biochem. Mol. Biol. 2017, 173, 223–227. [Google Scholar] [CrossRef]
  12. Grzesiak, M.; Burzawa, G.; Kurowska, P.; Blaszczyk, K.; Szlaga, A.; Blasiak, A.; Sechman, A.; Rak, A. Altered vitamin D3 metabolism in the ovary and periovarian adipose tissue of rats with letrozole-induced PCOS. Histochem. Cell Biol. 2021, 155, 101–116. [Google Scholar] [CrossRef]
  13. Dravecká, I.; Figurová, J.; Javorský, M.; Petríková, J.; Vaľková, M.; Lazúrová, I. The Effect of Alfacalcidiol and Metformin on Phenotype Manifestations in Women with Polycystic Ovary Syndrome—A Preliminary Study. Physiol. Res. 2016, 815–822. [Google Scholar] [CrossRef] [PubMed]
  14. Krul-Poel, Y.H.M.; Koenders, P.P.; Steegers-Theunissen, R.P.; ten Boekel, E.; ter Wee, M.M.; Louwers, Y.; Lips, P.; Laven, J.S.E.; Simsek, S. Vitamin D and Metabolic Disturbances in Polycystic Ovary Syndrome (PCOS): A Cross-Sectional Study. PLoS ONE 2018, 13, e0204748. [Google Scholar] [CrossRef] [PubMed]
  15. Kuyucu, Y.; Çelik, L.S.; Kendirlinan, Ö.; Tap, Ö.; Mete, U.Ö. Investigation of the uterine structural changes in the experimental model with polycystic ovary syndrome and effects of vitamin D treatment: An ultrastructural and immunohistochemical study. Reprod. Biol. 2018, 18, 53–59. [Google Scholar] [CrossRef]
  16. Mu, Y.; Cheng, D.; Yin, T.; Yang, J. Vitamin D and Polycystic Ovary Syndrome: A Narrative Review. Reprod. Sci. 2021, 28, 2110–2117. [Google Scholar] [CrossRef]
  17. Nassar, S.Z.; Badae, N.M. Protective Effect of Vitamin D Supplementation in a Rat Modal of Preeclampsia: A Possible Implication of Chemerin. Hypertens. Pregnancy 2019, 38, 149–156. [Google Scholar] [CrossRef] [PubMed]
  18. Mohammadi, S.M.; Eghbali, S.A.; Soheilikhah, S.; Jam Ashkezari, S.; Salami, M.; Afkhami-Ardekani, M.; Afkhami-Ardekani, A. The Effects of Vitamin D Supplementation on Adiponectin Level and Insulin Resistance in First-Degree Relatives of Subjects with Type 2 Diabetes: A Randomized Double-Blinded Controlled Trial. Electron Physician 2016, 8, 2849–2854. [Google Scholar] [CrossRef] [PubMed]
  19. Seyyed Abootorabi, M.; Ayremlou, P.; Behroozi-Lak, T.; Nourisaeidlou, S. The Effect of Vitamin D Supplementation on Insulin Resistance, Visceral Fat and Adiponectin in Vitamin D Deficient Women with Polycystic Ovary Syndrome: A Randomized Placebo-Controlled Trial. Gynecol. Endocrinol. 2018, 34, 489–494. [Google Scholar] [CrossRef] [PubMed]
  20. Recinella, L.; Orlando, G.; Ferrante, C.; Chiavaroli, A.; Brunetti, L.; Leone, S. Adipokines: New Potential Therapeutic Target for Obesity and Metabolic, Rheumatic, and Cardiovascular Diseases. Front. Physiol. 2020, 11, 578966. [Google Scholar] [CrossRef] [PubMed]
  21. Mehrabani, S.; Arab, A.; Karimi, E.; Nouri, M.; Mansourian, M. Blood Circulating Levels of Adipokines in Polycystic Ovary Syndrome Patients: A Systematic Review and Meta-analysis. Reprod. Sci. 2021, 28, 3032–3050. [Google Scholar] [CrossRef] [PubMed]
  22. Smolińska, N.; Maleszka, A.; Dobrzyn, K.; Kiezun, M.; Szeszko, K.; Kaminski, T. Expression of adiponectin and adiponectin receptors 1 and 2 in the porcine uterus, conceptus, and trophoblast during early pregnancy. Theriogenology 2014, 82, 951–965. [Google Scholar] [CrossRef] [PubMed]
  23. Gudelska, M.; Dobrzyn, K.; Kiezun, M.; Rytelewska, E.; Kisielewska, K.; Kaminska, B.; Kaminski, T.; Smolinska, N. The Expression of Chemerin and Its Receptors (CMKLR1, GPR1, CCRL2) in the Porcine Uterus during the Oestrous Cycle and Early Pregnancy and in Trophoblasts and Conceptuses. Animal 2020, 14, 2116–2128. [Google Scholar] [CrossRef] [PubMed]
  24. Takemura, Y.; Osuga, Y.; Yamauchi, T.; Kobayashi, M.; Harada, M.; Hirata, T.; Morimoto, C.; Hirota, Y.; Yoshino, O.; Koga, K.; et al. Expression of Adiponectin Receptors and Its Possible Implication in the Human Endometrium. Endocrinology 2006, 147, 3203–3210. [Google Scholar] [CrossRef] [PubMed] [Green Version]
  25. Schaffer, A.; Ducza, E.; Bódi, N.; Bagyánszki, M.; Szalai, Z.; Mirdamadi, M.; Barna, T.; Szűcs, K.F.; Gáspár, R. The ontogenies of endometrial and myometrial leptin and adiponectin receptors in pregnant rats: Their putative impact on uterine contractility. Life Sci. 2022, 297, 120465. [Google Scholar] [CrossRef]
  26. Smolińska, N.; Szeszko, K.; Dobrzyn, K.; Kiezun, M.; Rytelewska, E.; Kisielewska, K.; Gudelska, M.; Bors, K.; Wyrebek, J.; Kopij, G.; et al. Transcriptomic Analysis of Porcine Endometrium during Implantation after In Vitro Stimulation by Adiponectin. Int. J. Mol. Sci. 2019, 20, 1335. [Google Scholar] [CrossRef] [Green Version]
  27. Orzechowska, K.; Kopij, G.; Paukszto, L.; Dobrzyn, K.; Kiezun, M.; Jastrzebski, J.; Kaminski, T.; Smolinska, N. Chemerin Effect on Transcriptome of the Porcine Endometrium during Implantation Determined by RNA-Sequencing. Biol. Reprod. 2022, 107, 557–573. [Google Scholar] [CrossRef]
  28. Franks, S. Do animal models of polycystic ovary syndrome help to understand its pathogenesis and management? Yes, but their limitations should be recognized. Endocrinology 2009, 150, 3983–3985. [Google Scholar] [CrossRef]
  29. Osuka, S.; Nakanishi, N.; Murase, T.; Nakamura, T.; Goto, M.; Iwase, A.; Kikkawa, F. Animal models of polycystic ovary syndrome: A review of hormone-induced rodent models focused on hypothalamus-pituitary-ovary axis and neuropeptides. Reprod. Med. Biol. 2018, 18, 151–160. [Google Scholar] [CrossRef] [PubMed] [Green Version]
  30. Brock, B.J.; Waterman, M.R. Biochemical differences between rat and human cytochrome P450c17 support the different steroidogenic needs of these two species. Biochemistry 1999, 38, 1598–1606. [Google Scholar] [CrossRef] [PubMed]
  31. Stener-Victorin, E.; Padmanabhan, V.; Walters, K.A.; Campbell, R.E.; Benrick, A.; Giacobini, P.; Dumesic, D.A.; Abbott, D.H. Animal Models to Understand the Etiology and Pathophysiology of Polycystic Ovary Syndrome. Endocr. Rev. 2020, 41, bnaa010. [Google Scholar] [CrossRef]
  32. Malik, M.; Roh, M.; England, S.K. Uterine contractions in rodent models and humans. Acta Physiol. 2021, 231, e13607. [Google Scholar] [CrossRef] [PubMed]
  33. Kafali, H.; Iriadam, M.; Ozardalı, I.; Demir, N. Letrozole-Induced Polycystic Ovaries in the Rat: A New Model for Cystic Ovarian Disease. Arch. Med. Res. 2004, 35, 103–108. [Google Scholar] [CrossRef] [PubMed]
  34. Lajtai, K.; Nagy, C.T.; Tarszabó, R.; Benkő, R.; Hadjadj, L.; Sziva, R.E.; Gerszi, D.; Bányai, B.; Ferdinandy, P.; Nádasy, G.L.; et al. Effects of Vitamin D deficiency on proliferation and autophagy of ovarian and liver tissues in a rat model of polycystic ovary syndrome. Biomolecules 2019, 9, 471. [Google Scholar] [CrossRef] [Green Version]
  35. Livak, K.J.; Schmittgen, T.D. Analysis of relative gene expression data using real-time quantitative PCR and the 2(-Delta Delta C(T)) Method. Methods 2001, 25, 402–408. [Google Scholar] [CrossRef] [PubMed]
  36. Rak, A.; Drwal, E.; Rame, C.; Knapczyk-Stwora, K.; Słomczyńska, M.; Dupont, J.; Gregoraszczuk, E.L. Expression of apelin and apelin receptor (APJ) in porcine ovarian follicles and in vitro effect of apelin on steroidogenesis and proliferation through APJ activation and different signaling pathways. Theriogenology 2017, 96, 126–135. [Google Scholar] [CrossRef] [PubMed]
  37. Asadi, M.; Matin, N.; Frootan, M.; Mohamadpour, J.; Qorbani, M.; Tanha, F.D. Vitamin D Improves Endometrial Thickness in PCOS Women Who Need Intrauterine Insemination: A Randomized Double-Blind Placebo-Controlled Trial. Arch. Gynecol. Obs. 2014, 289, 865–870. [Google Scholar] [CrossRef] [PubMed]
  38. Thys-Jacobs, S.; Donovan, D.; Papadopoulos, A.; Sarrel, P.; Bilezikian, J.P. Vitamin D and calcium dysregulation in the polycystic ovarian syndrome. Steroids. 1999, 64, 430–435. [Google Scholar] [CrossRef]
  39. Wehr, E.; Pieber, T.R.; Obermayer-Pietsch, B. Effect of vitamin D3 treatment on glucose metabolism and menstrual frequency in polycystic ovary syndrome women: A pilot study. J. Endocrinol. Invest. 2011, 34, 757–763. [Google Scholar] [CrossRef] [PubMed]
  40. Behmanesh, N.; Abedelahi, A.; Charoudeh, H.N.; Alihemmati, A. Effects of Vitamin D Supplementation on Follicular Development, Gonadotropins and Sex Hormone Concentrations, and Insulin Resistance in Induced Polycystic Ovary Syndrome. Turk. J. Obstet. Gynecol. 2019, 16, 143–150. [Google Scholar] [CrossRef] [PubMed]
  41. Kalamon, N.; Błaszczyk, K.; Szlaga, A.; Billert, M.; Skrzypski, M.; Pawlicki, P.; Górowska-Wójtowicz, E.; Kotula-Balak, M.; Błasiak, A.; Rak, A. Levels of the Neuropeptide Phoenixin-14 and Its Receptor GRP173 in the Hypothalamus, Ovary and Periovarian Adipose Tissue in Rat Model of Polycystic Ovary Syndrome. Biochem. Biophys. Res. Commun. 2020, 528, 628–635. [Google Scholar] [CrossRef] [PubMed]
  42. Shang, K.; Jia, X.; Qiao, J.; Kang, J.; Guan, Y. Endometrial Abnormality in Women with Polycystic Ovary Syndrome. Reprod. Sci. 2012, 19, 674–683. [Google Scholar] [CrossRef] [PubMed]
  43. Lin, K.; Sun, X.; Wang, X.; Wang, H.; Chen, X. Circulating Adipokine Levels in Nonobese Women With Polycystic Ovary Syndrome and in Nonobese Control Women: A Systematic Review and Meta-Analysis. Front Endocrinol. 2021, 11, 537809. [Google Scholar] [CrossRef] [PubMed]
  44. Li, X.; Zhu, Q.; Wang, W.; Qi, J.; He, Y.; Wang, Y.; Lu, Y.; Wu, H.; Ding, Y.; Sun, Y. Elevated chemerin induces insulin resistance in human granulosa-lutein cells from polycystic ovary syndrome patients. FASEB J. 2019, 33, 11303–11313. [Google Scholar] [CrossRef]
  45. Yang, S.; Wang, Q.; Huang, W.; Song, Y.; Feng, G.; Zhou, L.; Tan, J. Are Serum Chemerin Levels Different between Obese and Non-Obese Polycystic Ovary Syndrome Women? Gynecol. Endocrinol. 2016, 32, 38–41. [Google Scholar] [CrossRef] [PubMed]
  46. Bobjer, J.; Katrinaki, M.; Dermitzaki, E.; Margioris, A.N.; Giwercman, A.; Tsatsanis, C. Serum Chemerin Levels Are Negatively Associated with Male Fertility and Reproductive Hormones. Hum. Reprod. 2018, 33, 2168–2174. [Google Scholar] [CrossRef] [PubMed]
  47. Abeer, A.; Said, M.D.; Suzan, M.M.; Moursi, M.D. Vitamin D Supplementation Reduces Serum Chemerin Level in Gestational Diabetes Mellitus Rat Model. Med. J. Cairo Univ. 2019, 87, 3069–3080. [Google Scholar] [CrossRef] [Green Version]
  48. Schwanhäusser, B.; Busse, D.; Li, N.; Dittmar, G.; Schuchhardt, J.; Wolf, J.; Chen, W.; Selbach, M. Global Quantification of Mammalian Gene Expression Control. Nature 2011, 473, 337–342. [Google Scholar] [CrossRef] [PubMed] [Green Version]
  49. Vogel, C.; Marcotte, E.M. Insights into the Regulation of Protein Abundance from Proteomic and Transcriptomic Analyses. Nat. Rev. Genet. 2012, 13, 227–232. [Google Scholar] [CrossRef] [Green Version]
  50. Roman, A.A.; Sinal, C. Vitamin D regulation of chemerin in human bone marrow adipogenesis. FASEB J. 2009, 23. [Google Scholar] [CrossRef]
  51. Nagpal, S.; Patel, S.; Jacobe, H.; DiSepio, D.; Ghosn, C.; Malhotra, M.; Teng, M.; Duvic, M.; Chandraratna, R.A.S. Tazarotene-Induced Gene 2 (TIG2), a Novel Retinoid-Responsive Gene in Skin. J. Investig. Dermatol. 1997, 109, 91–95. [Google Scholar] [CrossRef] [PubMed] [Green Version]
  52. De Henau, O.; Degroot, G.N.; Imbault, V.; Robert, V.; De Poorter, C.; Mcheik, S.; Galés, C.; Parmentier, M.; Springael, J.Y. Signaling Properties of Chemerin Receptors CMKLR1, GPR1 and CCRL2. PLoS ONE 2016, 11, e0164179. [Google Scholar] [CrossRef]
  53. Monnier, J.; Lewén, S.; O.’Hara, E.; Huang, K.; Tu, H.; Butcher, E.C.; Zabel, B.A. Expression, Regulation, and Function of Atypical Chemerin Receptor CCRL2 on Endothelial Cells. J. Immunol. 2012, 189, 956–967. [Google Scholar] [CrossRef] [Green Version]
  54. Gudelska, M.; Dobrzyn, K.; Kiezun, M.; Kisielewska, K.; Rytelewska, E.; Kaminski, T.; Smolinska, N. Chemerin Affects P4 and E2 Synthesis in the Porcine Endometrium during Early Pregnancy. Int. J. Mol. Sci. 2022, 23, 945. [Google Scholar] [CrossRef] [PubMed]
  55. Luo, X.; Gong, Y.; Cai, L.; Zhang, L.; Dong, X. Chemerin Regulates Autophagy to Participate in Polycystic Ovary Syndrome. J. Int. Med. Res. 2021, 49, 030006052110583. [Google Scholar] [CrossRef] [PubMed]
  56. Estienne, A.; Mellouk, N.; Bongrani, A.; Plotton, I.; Langer, I.; Ramé, C.; Petit, C.; Guérif, F.; Froment, P.; Dupont, J. Involvement of Chemerin and CMKLR1 in the Progesterone Decrease by PCOS Granulosa Cells. Reproduction 2021, 162, 427–436. [Google Scholar] [CrossRef]
  57. Yamamoto, Y.; Hirose, H.; Saito, I.; Tomita, M.; Taniyama, M.; Matsubara, K.; Okazaki, Y.; Ishii, T.; Nishikai, K.; Saruta, T. Correlation of the Adipocyte-Derived Protein Adiponectin with Insulin Resistance Index and Serum High-Density Lipoprotein-Cholesterol, Independent of Body Mass Index, in the Japanese Population. Clin. Sci. 2002, 103, 137. [Google Scholar] [CrossRef]
  58. Nikooyeh, B.; Neyestani, T.R. Can Vitamin D Be Considered an Adiponectin Secretagogue? A Systematic Review and Meta-Analysis. J. Steroid Biochem. Mol. Biol. 2021, 212, 105925. [Google Scholar] [CrossRef]
  59. Walker, G.E.; Ricotti, R.; Roccio, M.; Moia, S.; Bellone, S.; Prodam, F.; Bona, G. Pediatric Obesity and Vitamin D Deficiency: A Proteomic Approach Identifies Multimeric Adiponectin as a Key Link between These Conditions. PLoS ONE 2014, 9, e83685. [Google Scholar] [CrossRef] [PubMed]
  60. Lorente-Cebrián, S.; Eriksson, A.; Dunlop, T.; Mejhert, N.; Dahlman, I.; Åström, G.; Sjölin, E.; Wåhlén, K.; Carlberg, C.; Laurencikiene, J.; et al. Differential effects of 1α,25-dihydroxycholecalciferol on MCP-1 and adiponectin production in human white adipocytes. Eur. J. Nutr. 2012, 51, 335–342. [Google Scholar] [CrossRef]
  61. Vaidya, A.; Williams, J.S. The relationship between vitamin D and the renin-angiotensin system in the pathophysiology of hypertension, kidney disease, and diabetes. Metabolism 2012, 61, 450–458. [Google Scholar] [CrossRef] [PubMed] [Green Version]
  62. Liu, E.; Meigs, J.B.; Pittas, A.G.; McKeown, N.M.; Economos, C.D.; Booth, S.L.; Jacques, P.F. Plasma 25-hydroxyvitamin d is associated with markers of the insulin resistant phenotype in nondiabetic adults. J. Nutr. 2009, 139, 329–334. [Google Scholar] [CrossRef] [PubMed] [Green Version]
  63. Liu, B.H.; Wang, Y.C.; Wu, S.C.; Mersmann, H.J.; Cheng, W.T.K.; Ding, S.T. Insulin regulates the expression of adiponectin and adiponectin receptors in porcine adipocytes. Domest. Anim. Endocrinol. 2008, 34, 352–359. [Google Scholar] [CrossRef] [PubMed]
  64. Comim, F.V.; Hardy, K.; Franks, S. Adiponectin and Its Receptors in the Ovary: Further Evidence for a Link between Obesity and Hyperandrogenism in Polycystic Ovary Syndrome. PLoS ONE 2013, 8, e80416. [Google Scholar] [CrossRef] [PubMed]
Figure 1. Experimental protocol. ANOVA, analysis of variance. ELISA, enzyme-linked immunosorbent assay. PCOS, polycystic ovarian syndrome. PCR, polymerase chain reaction. VD3, vitamin D3.
Cells 12 02026 g001
Figure 2. Representative photomicrographs of ovary from control and induced PCOS rats. Arrows indicate early antral follicles, while asterisks indicate ovarian cysts. Scale bar 100 µm. PCOS, polycystic ovarian syndrome.
Cells 12 02026 g002
Figure 3. Hematoxylin and eosin staining of uterus obtained from control (A), VD3-treated (B), induced PCOS (C), and VD3-treated PCOS (D) rats. Scale bar 250 µm or 50 µm for insets. E, endometrium. M, myometrium. GE, glandular epithelium. LE, luminal epithelium. PCOS, polycystic ovarian syndrome. S, stroma. VD3, vitamin D3. Arrows indicate endometrial glands.
Cells 12 02026 g003
Figure 4. Plasma concentrations of RARRES2 (A), ADIPOQ (B), testosterone (C), and estradiol (D) measured by ELISA assay. Results were mean ± SEM of eight independent determinations. Statistically significant differences (p < 0.05) between points in each graph are indicated by different letters (a < b < c), identical letters indicate a lack of significant differences. ADIPOQ, adiponectin. C, control. ELISA, enzyme-linked immunosorbent assay. PCOS, polycystic ovarian syndrome. RARRES2, retinoic acid 109 receptor responder protein 2. SEM, standard error of the mean. VD3, vitamin D3.
Cells 12 02026 g004
Figure 5. mRNA and protein expression of RARRES2 (A,B), CCRL2 (C,D), CMKLR1 (E,F), and GPR1 (G,H) in rat uterus. mRNA expression was determined using real-time PCR and presented relative to Gapdh; the protein expression was detected via Western blot assay, each protein abundance was evaluated densitometrically and expressed as the ratio relative to the ACTB abundance. Results were mean ± SEM of eight independent determinations. Statistically significant differences (p < 0.05) between points in each graph are indicated by different letters (a < b < c < d), identical letters indicate a lack of significant differences. ACTB, β-actin. C, control. CCRL2, C-C motif chemokine receptor-like 2. CMLR1, chemerin chemokine-like receptor 1. Gapdh, glyceraldehyde-3-phosphate dehydrogenase. GPR1, G protein-coupled receptor 1. PCR, polymerase chain reaction. PCOS, polycystic ovarian syndrome. RARRES2, retinoic acid 109 receptor responder protein 2. SEM, standard error of the mean. VD3, vitamin D3.
Cells 12 02026 g005aCells 12 02026 g005b
Figure 6. Representative micrographs of immunohistochemical RARRES2 and CMKLR1 localization in uterus obtained from control ((A) and (F), respectively), VD3-treated ((B) and (G), respectively), induced PCOS ((C) and (H), respectively), and VD3-treated PCOS ((D) and (I), respectively) rats. Arrows indicate positive RARRES2 and CMKLR1 staining within LE and GE in all examined groups ((AD) and (FI), respectively). Asterisks indicate positive CMKLR1 immunoreaction in stroma cells (FI). Control sections ((E) and (J), respectively) showed no positive staining. Charts represent the intensity of RARRES2 (K) and CMKLR1 (L) immunostaining expressed as the relative optical density (ROD) in LE, GE, and stroma. Statistically significant differences (p < 0.05) between points in each graph are indicated by different letters (a < b < c), identical letters indicate a lack of significant differences. Scale bar 50 μm. C, control. CMKLR1, chemerin chemokine-like receptor 1. GE, glandular epithelium. LE, luminal epithelium. RARRES2, retinoic acid 109 receptor responder protein 2. PCOS, polycystic ovarian syndrome. SEM, standard error of the mean. VD3, vitamin D3.
Cells 12 02026 g006aCells 12 02026 g006b
Figure 7. mRNA and protein expression of ADIPOQ (A,B), ADIPOR1 (C,D), and ADIPOR2 (E,F) in rat uterus. mRNA expression was determined using real-time PCR and presented relative to Gapdh; the protein expression was detected by Western blot assay; each protein abundance was evaluated densitometrically and expressed as the ratio relative to ACTB abundance. Results were mean ± SEM of six independent determinations. Statistically significant differences (p < 0.05) between points in each graph are indicated by different letters (a < b < c < d), identical letters indicate a lack of significant differences. ACTB, β-actin. ADIPOQ, adiponectin. ADIPOR1, adiponectin receptor-1. ADIPOR2, adiponectin receptor-2. C, control. Gapdh, glyceraldehyde-3-phosphate dehydrogenase. PCR, polymerase chain reaction. PCOS, polycystic ovarian syndrome. SEM, standard error of the mean. VD3, vitamin D3.
Cells 12 02026 g007aCells 12 02026 g007b
Figure 8. Representative micrographs of immunohistochemical ADIPOQ and ADIPOR1 localization in uterus obtained from control ((A) and (F), respectively), VD3-treated ((B) and (G), respectively), induced PCOS ((C) and (H), respectively) and VD3-treated PCOS ((D) and (I), respectively) rats. Arrows indicate positive ADIPOQ and ADIPOR1 staining within LE and GE ((AD) and (FI), respectively), but asterisks in stroma cells ((AD) and (FI), respectively) of all examined groups. Control sections ((E) and (J), respectively) showed no positive staining. Charts represent the intensity of ADIPOQ (K) and ADIPOQR1 (L) immunostaining expressed as the ROD in LE, GE, and stroma. Statistically significant differences (p < 0.05) between points in each graph are indicated by different letters (a < b), identical letters indicate a lack of significant differences. Scale bar 50 μm. ADIPOQ, adiponectin. ADIPOR1, adiponectin receptor-1. GE, glandular epithelium. LE, luminal epithelium. PCOS, polycystic ovarian syndrome. ROD, relative optical density. SEM, standard error of the mean. VD3, vitamin D3.
Cells 12 02026 g008aCells 12 02026 g008b
Table 1. TaqMan gene expression assays were used to quantify the mRNA expression for adipokines and their receptors.
Gene SymbolGene NameCatalog NumberReference Sequence
Rarres2retinoic acid 109 receptor responder protein 2Rn01451853_m1NM_001013427.1
Ccrl2chemokine (C-C motif) receptor-like 2Rn01746782_g1NM_001108191.1
Cmklr1chemokine-like receptor 1Rn00573616_s1NM_022218.2
Gpr1G protein-coupled receptor 1Rn00564179_s1NM_012961.1
AdipoqadiponectinRn00595250_m1NM_144744
Adipor1adiponectin receptor-1Rn01483784_m1NM_207587.1
Adipor2adiponectin receptor-2Rn01463173_m1NM_001037979.1
GapdhGlyceraldehyde-3-phosphate dehydrogenaseRn01775763_g1NM_017008.4
Table 2. Plasma levels of hormones and metabolic parameters in control and PCOS rats. HDL, high-density lipoprotein. LDL, low-density lipoprotein. PCOS, polycystic ovarian syndrome. Statistically significant differences (p < 0.05) between control and PCOS rats are indicated by different letters (a < b).
Hormone and Metabolic ParametersControlPCOS Rats
Testosterone (ng/mL)0.268 a2.471 b
Estradiol (pg/mL)28.918 b22.575 a
Glucose (mg/dL)186.685 a281.391 b
Triglyceride (mg/dL)59.490 a98.668 b
HDL26.303 a28.067 b
LDL3.950 a17.735 b
Cholesterol (mg/dL)42.615 a66.538 b
Disclaimer/Publisher’s Note: The statements, opinions and data contained in all publications are solely those of the individual author(s) and contributor(s) and not of MDPI and/or the editor(s). MDPI and/or the editor(s) disclaim responsibility for any injury to people or property resulting from any ideas, methods, instructions or products referred to in the content.

