
Transcriptomic Profiling of DNA Damage Response in Patient-Derived Glioblastoma Cells before and after Radiation and Temozolomide Treatment

 ,
,  , and
, and
Abstract
:
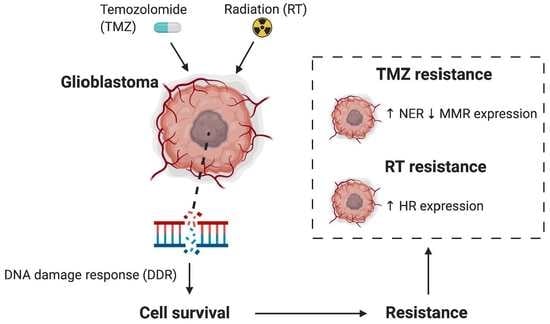
1. Introduction
2. Materials and Methods
2.1. Ethics
2.2. TCGA Glioblastoma Cohort
2.3. Cell Lines and Reagents
2.4. RNA Sequencing Analysis
2.5. Cell Viability Assay
2.6. Comparison of Cell Line DDR Profile and Treatment Response
2.7. Time Course and Quantitative PCR
2.8. Statistical Analysis
3. Results
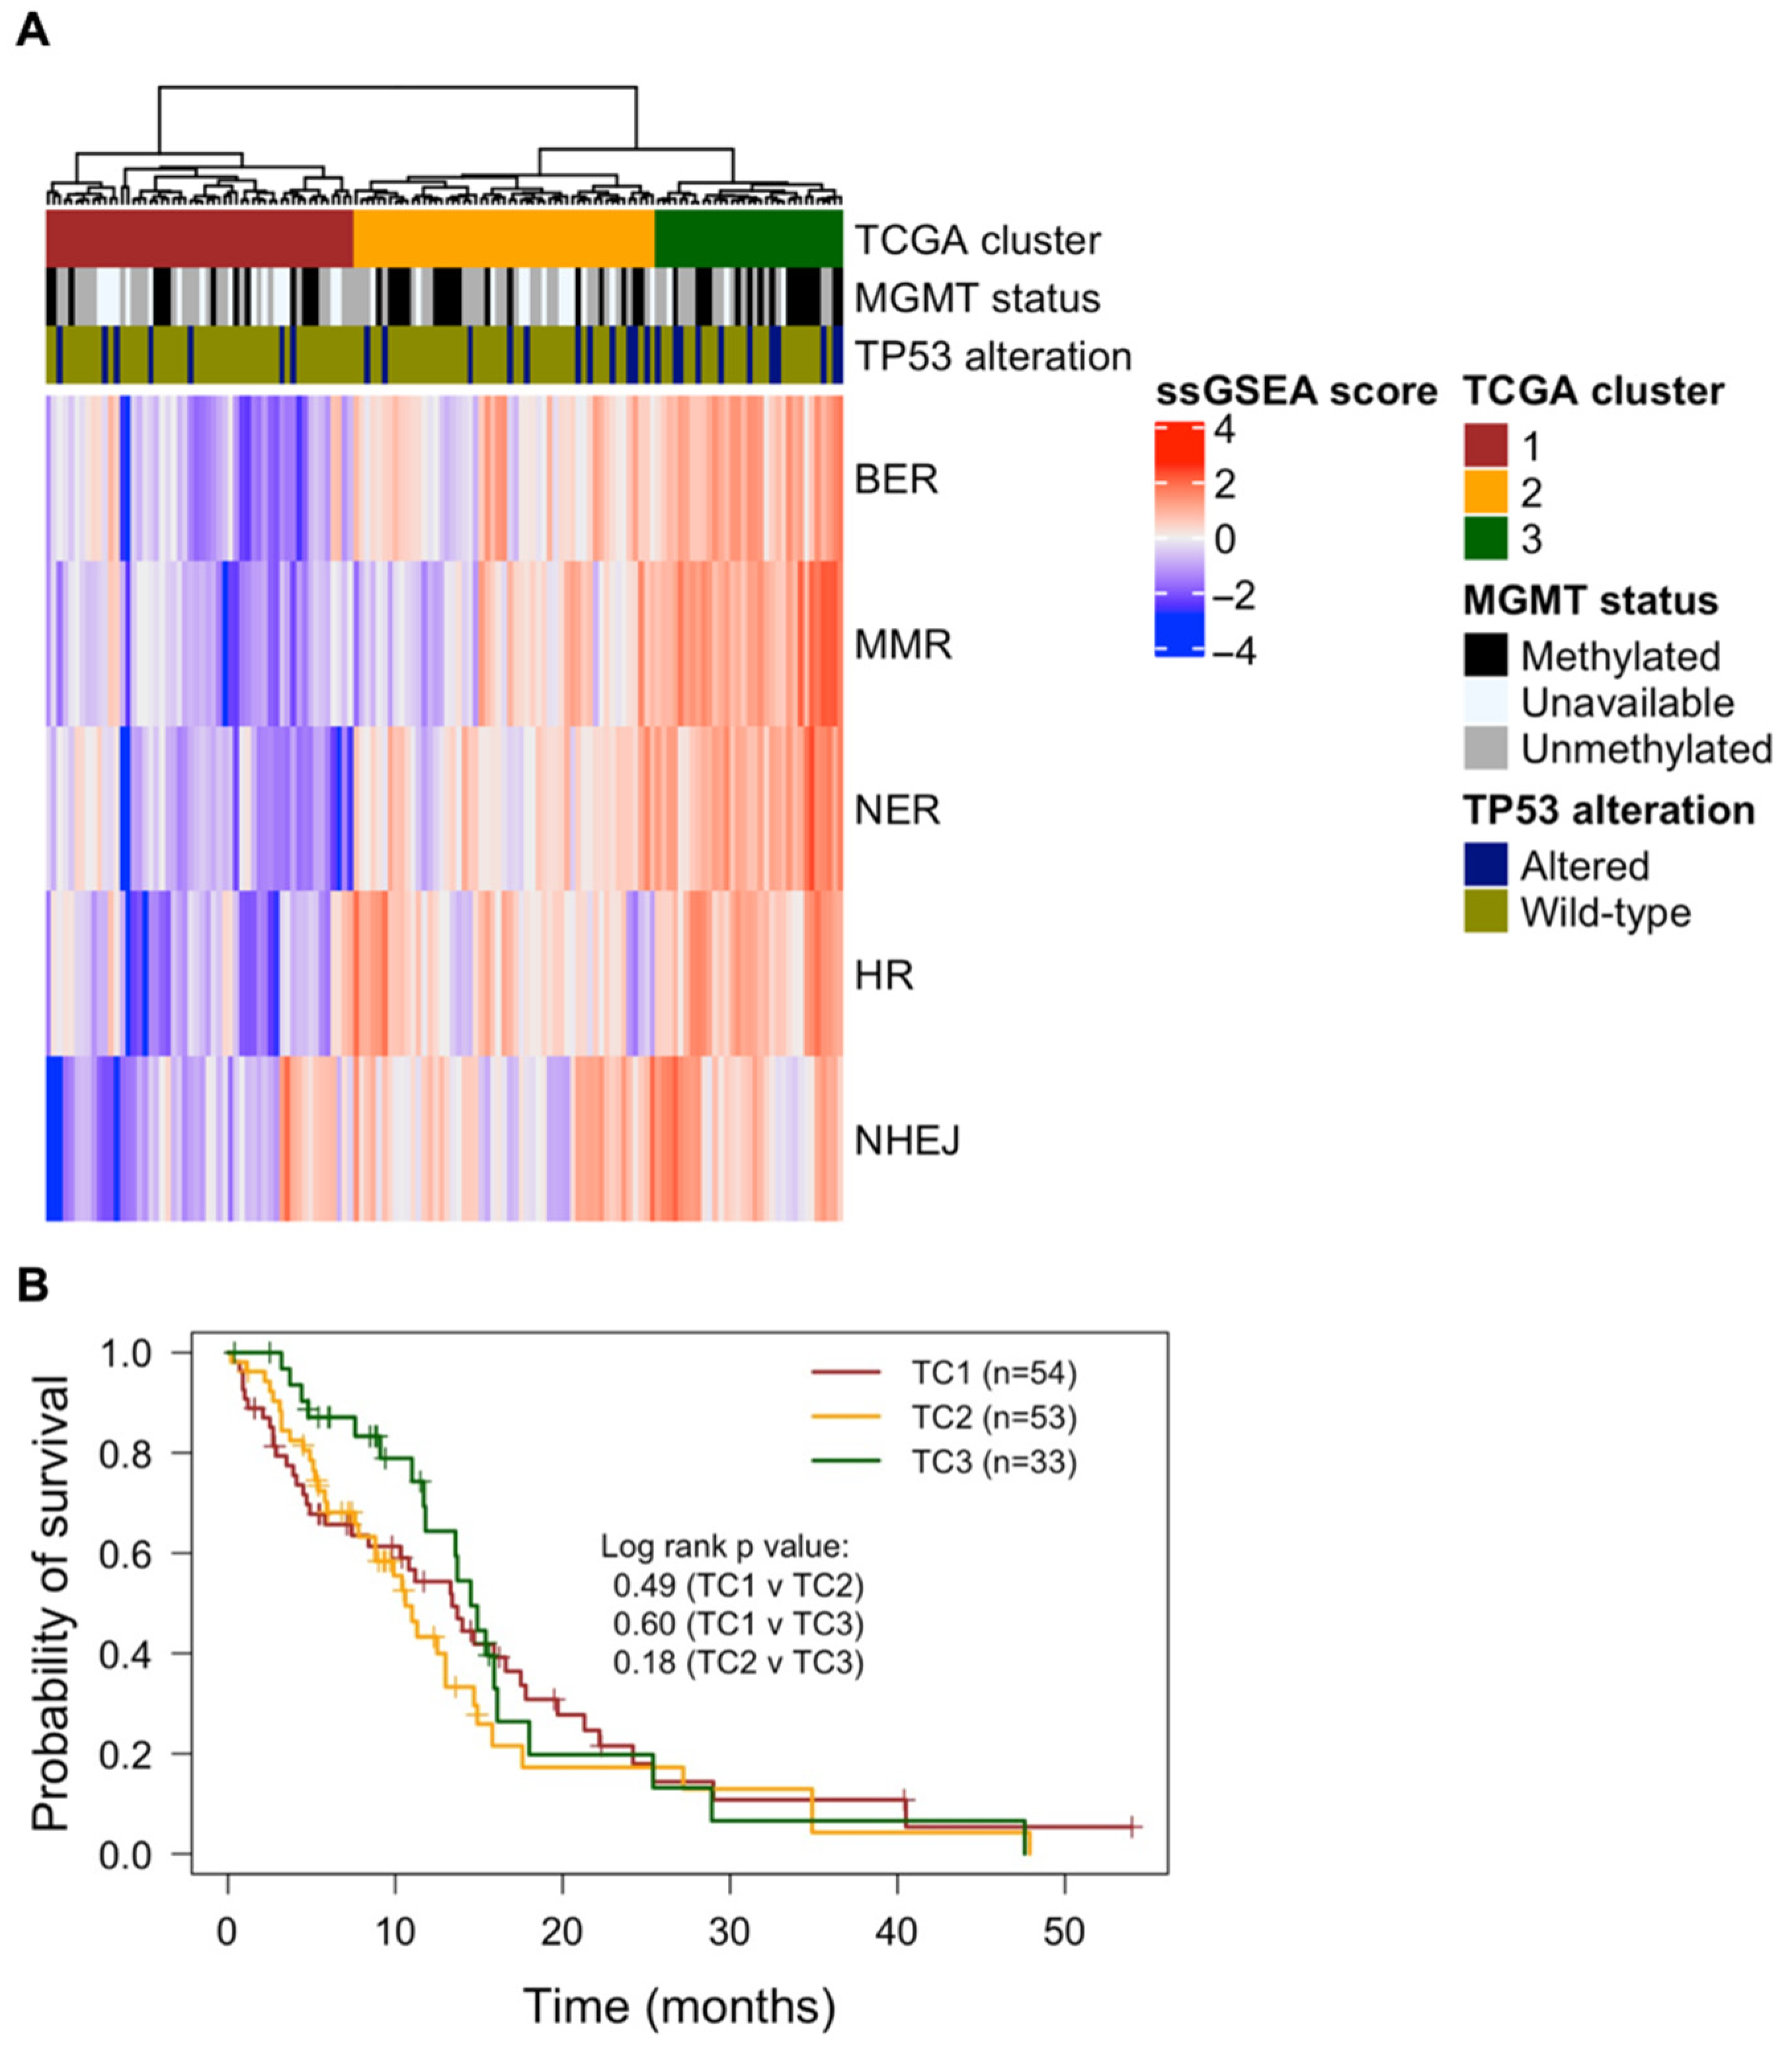
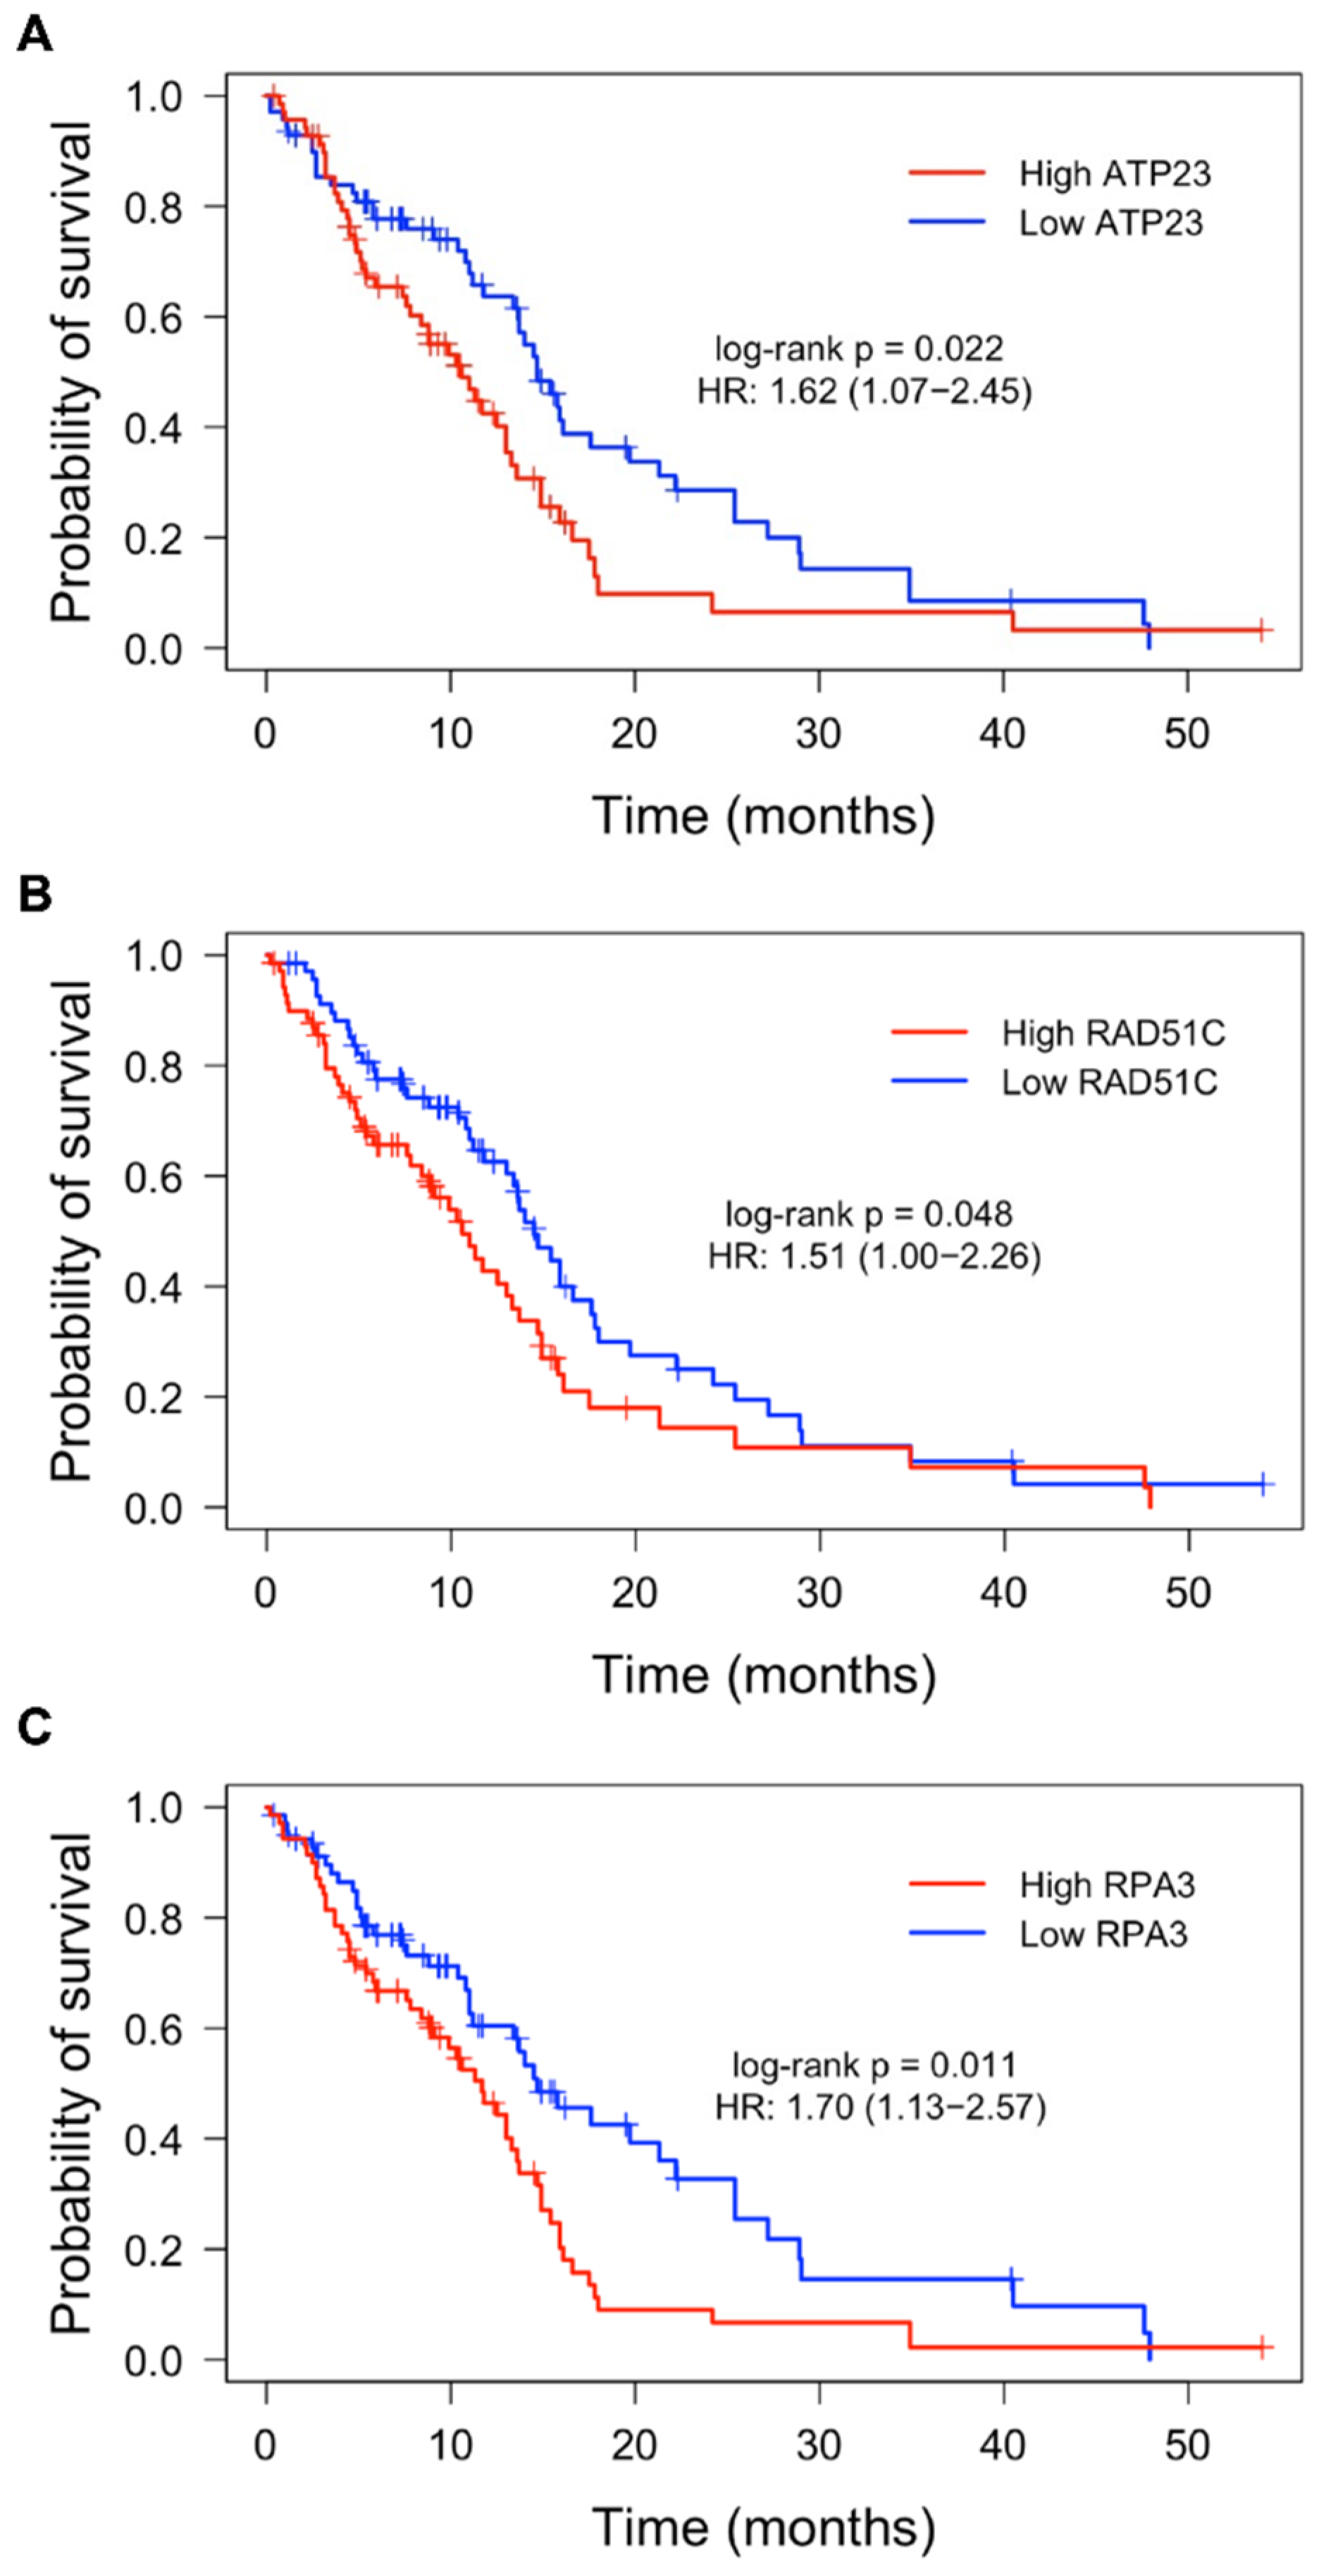
3.1. Expression of DDR Genes and Association with Patient Survival
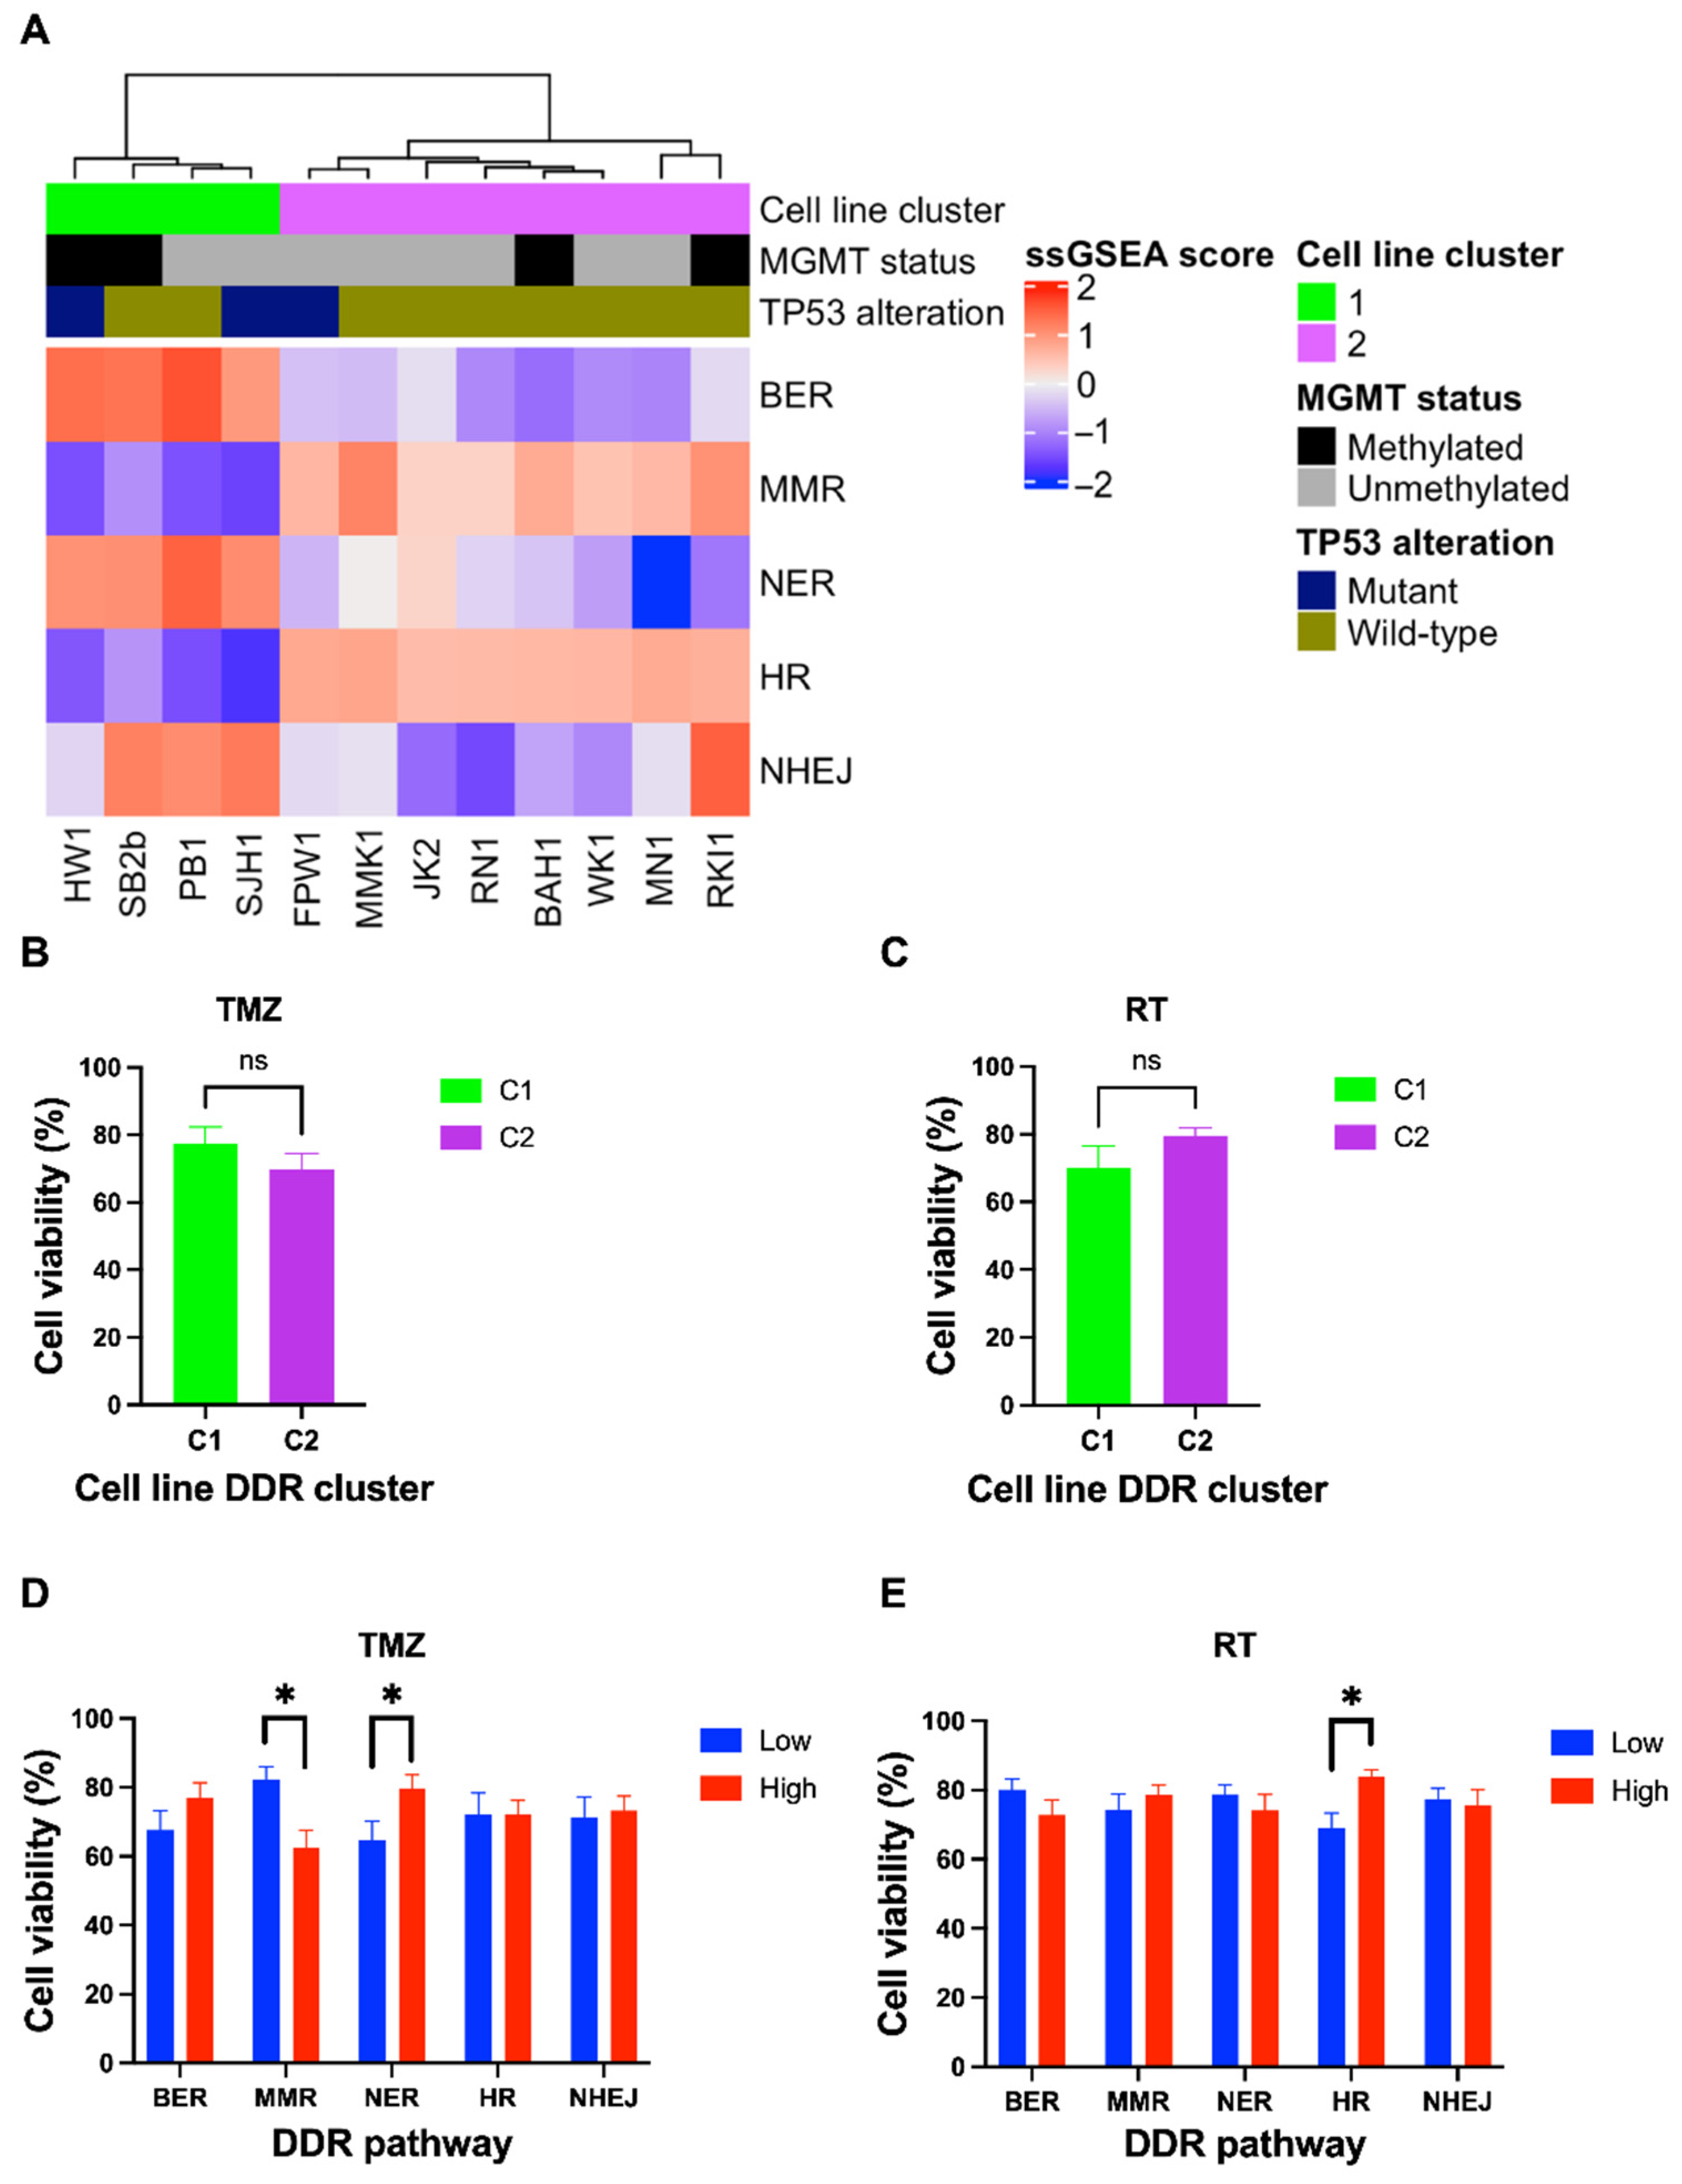
3.2. Expression of DDR Pathways Influence Treatment Response in Glioblastoma Cell Lines
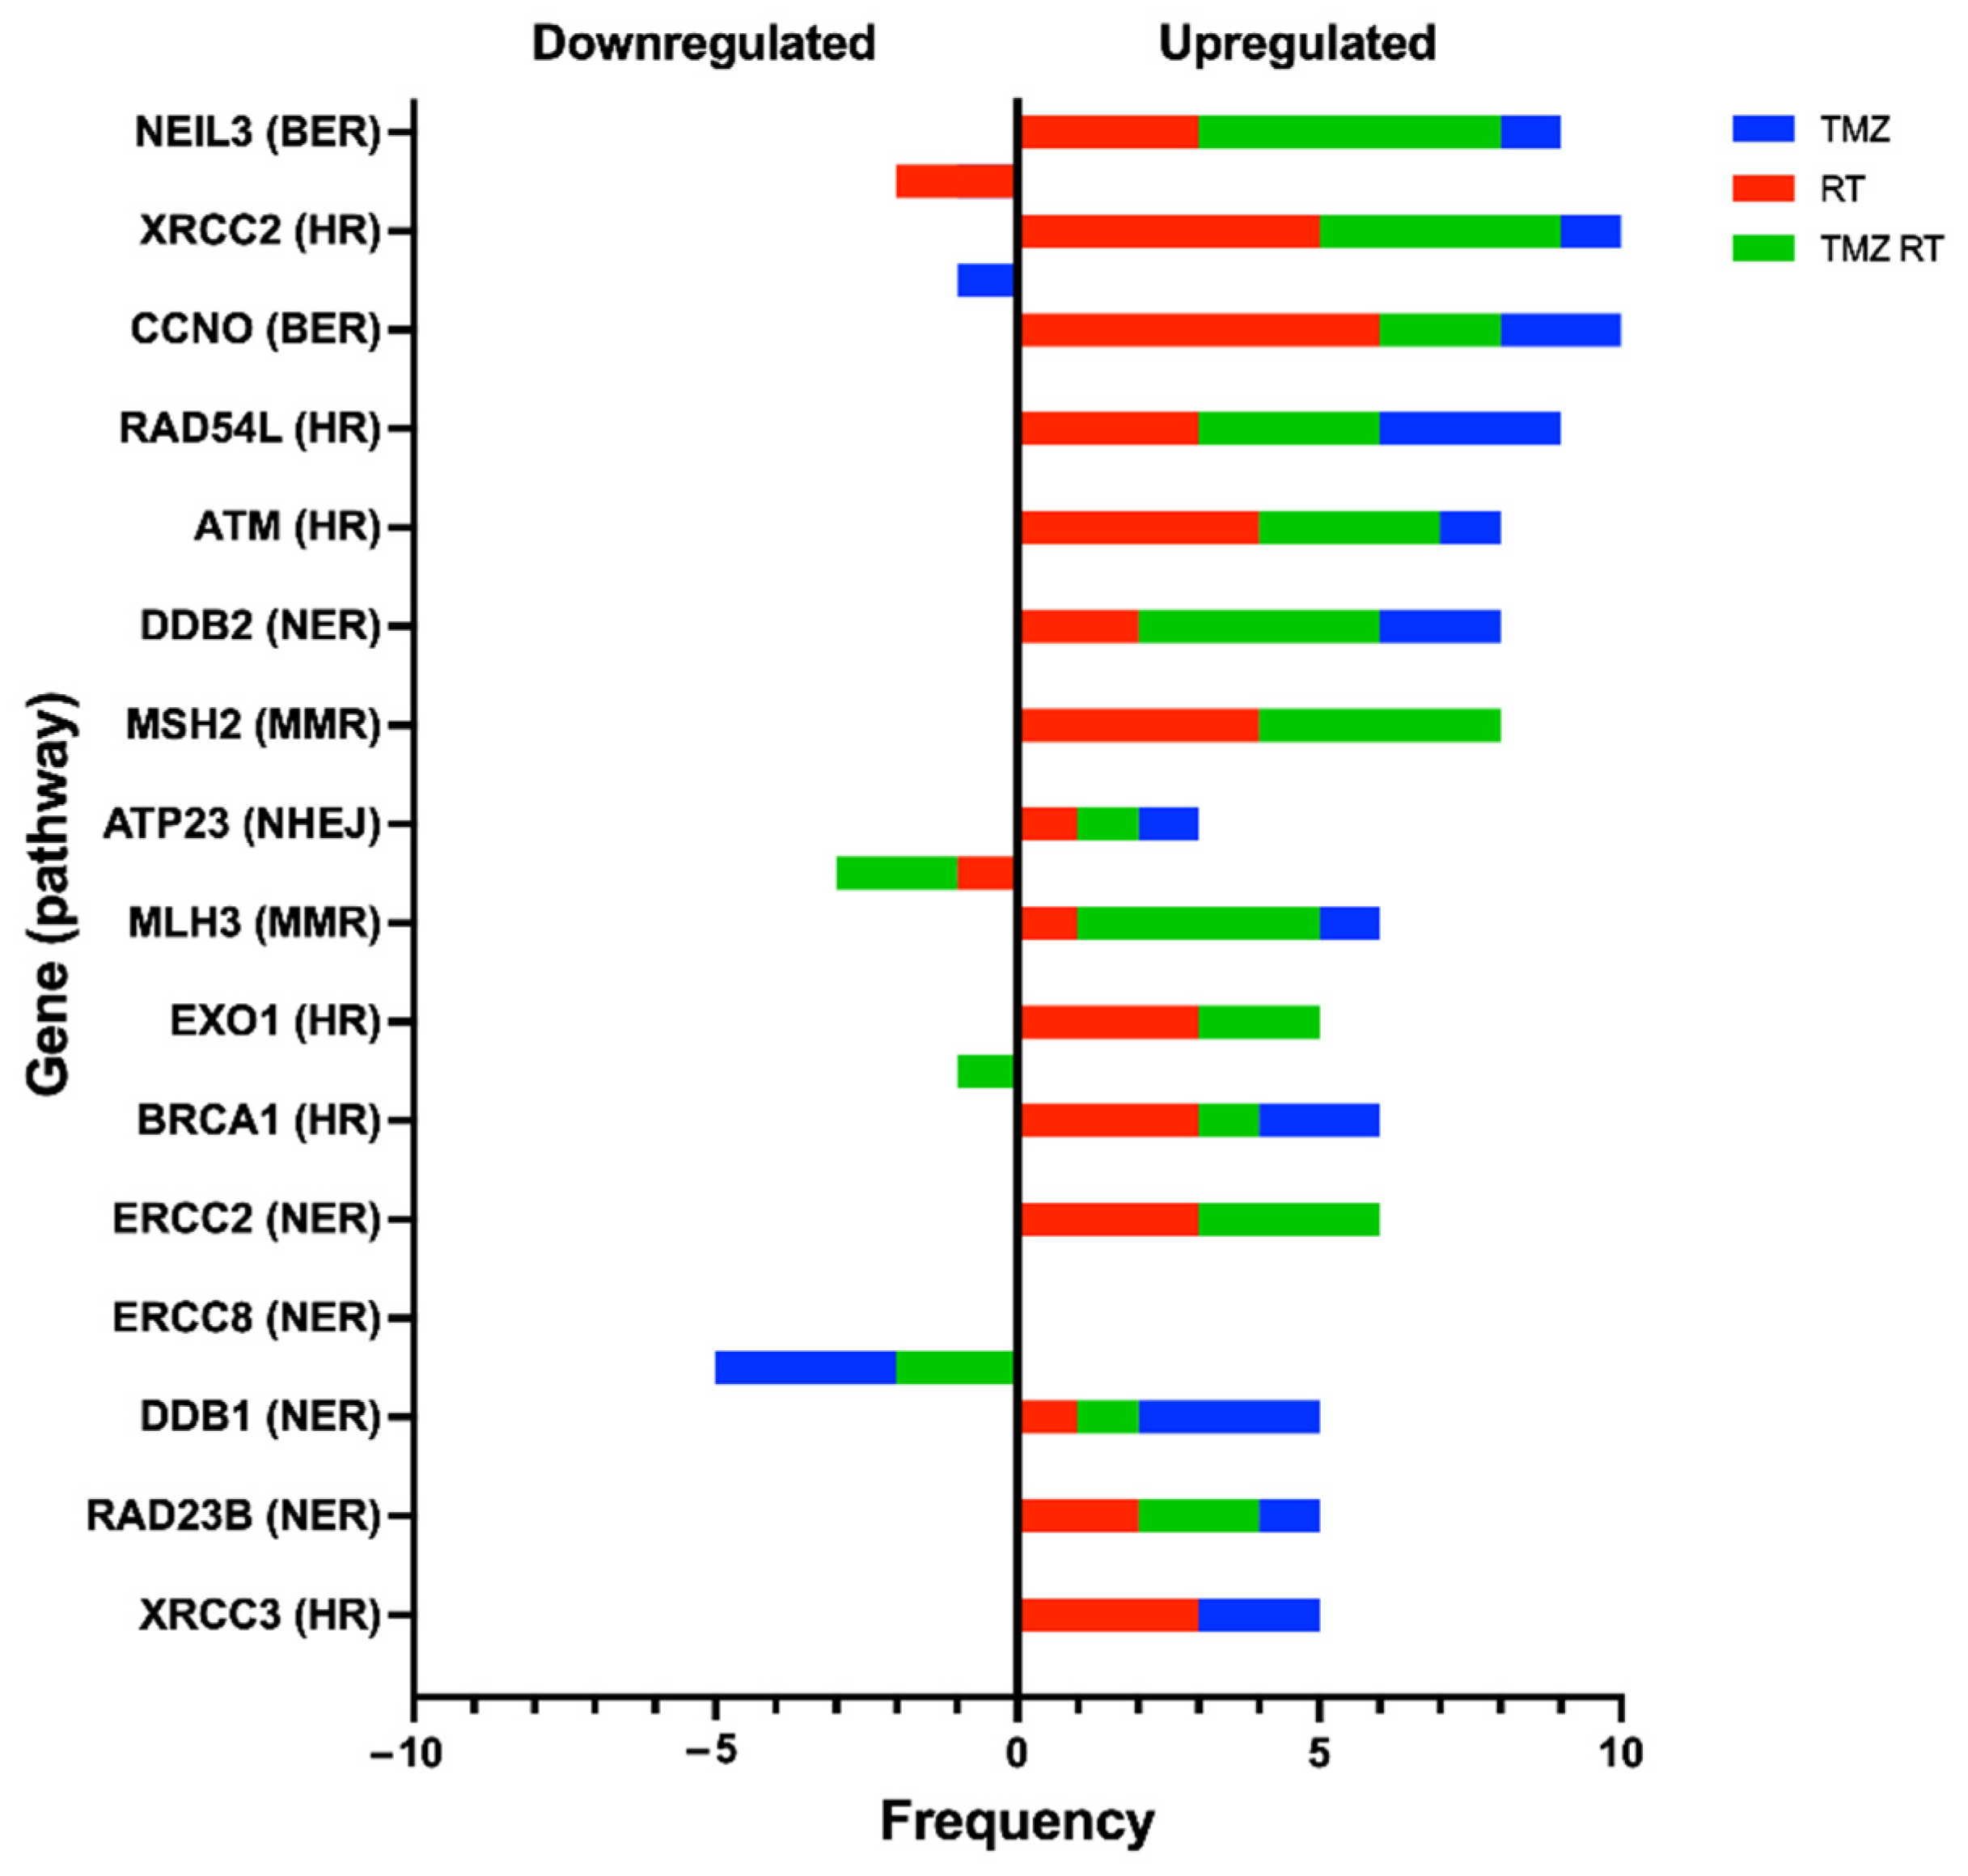
3.3. Upregulation of DDR Genes after Standard Treatment in Glioblastoma Cell Lines
4. Discussion
Supplementary Materials
Author Contributions
Funding
Institutional Review Board Statement
Informed Consent Statement
Data Availability Statement
Acknowledgments
Conflicts of Interest
References
- Louis, D.N.; Perry, A.; Wesseling, P.; Brat, D.J.; Cree, I.A.; Figarella-Branger, D.; Hawkins, C.; Ng, H.K.; Pfister, S.M.; Reifenberger, G.; et al. The 2021 WHO Classification of Tumors of the Central Nervous System: A summary. Neuro-Oncology 2021, 23, 1231–1251. [Google Scholar] [CrossRef] [PubMed]
- Rubner, Y.; Muth, C.; Strnad, A.; Derer, A.; Sieber, R.; Buslei, R.; Frey, B.; Fietkau, R.; Gaipl, U.S. Fractionated radiotherapy is the main stimulus for the induction of cell death and of Hsp70 release of p53 mutated glioblastoma cell lines. Radiat. Oncol. 2014, 9, 89. [Google Scholar] [CrossRef] [PubMed] [Green Version]
- Poon, M.T.C.; Sudlow, C.L.M.; Figueroa, J.D.; Brennan, P.M. Longer-term (≥2 years) survival in patients with glioblastoma in population-based studies pre- and post-2005: A systematic review and meta-analysis. Sci. Rep. 2020, 10, 11622. [Google Scholar] [CrossRef] [PubMed]
- Lozinski, M.; Bowden, N.A.; Graves, M.C.; Fay, M.; Tooney, P.A. DNA damage repair in glioblastoma: Current perspectives on its role in tumour progression, treatment resistance and PIKKing potential therapeutic targets. Cell. Oncol. 2021, 44, 961–981. [Google Scholar] [CrossRef] [PubMed]
- Bartkova, J.; Hamerlik, P.; Stockhausen, M.-T.; Ehrmann, J.; Hlobilkova, A.; Laursen, H.; Kalita, O.; Kolar, Z.; Poulsen, H.S.; Broholm, H.; et al. Replication stress and oxidative damage contribute to aberrant constitutive activation of DNA damage signalling in human gliomas. Oncogene 2010, 29, 5095–5102. [Google Scholar] [CrossRef] [PubMed] [Green Version]
- Carruthers, R.D.; Ahmed, S.U.; Ramachandran, S.; Strathdee, K.; Kurian, K.M.; Hedley, A.; Gomez-Roman, N.; Kalna, G.; Neilson, M.P.; Gilmour, L.; et al. Replication Stress Drives Constitutive Activation of the DNA Damage Response and Radioresistance in Glioblastoma Stem-like Cells. Cancer Res. 2018, 78, 5060–5071. [Google Scholar] [CrossRef] [Green Version]
- Yoshimoto, K.; Mizoguchi, M.; Hata, N.; Murata, H.; Hatae, R.; Amano, T.; Nakamizo, A.; Sasaki, T. Complex DNA repair pathways as possible therapeutic targets to overcome temozolomide resistance in glioblastoma. Front. Oncol. 2012, 2, 186. [Google Scholar] [CrossRef] [Green Version]
- Nagel, Z.D.; Kitange, G.J.; Gupta, S.K.; Joughin, B.; Chaim, I.A.; Mazzucato, P.; Lauffenburger, D.A.; Sarkaria, J.N.; Samson, L.D. DNA Repair Capacity in Multiple Pathways Predicts Chemoresistance in Glioblastoma Multiforme. Cancer Res. 2017, 77, 198–206. [Google Scholar] [CrossRef] [Green Version]
- Gobin, M.; Nazarov, P.V.; Warta, R.; Timmer, M.; Reifenberger, G.; Felsberg, J.; Vallar, L.; Chalmers, A.J.; Herold-Mende, C.C.; Goldbrunner, R.; et al. A DNA Repair and Cell-Cycle Gene Expression Signature in Primary and Recurrent Glioblastoma: Prognostic Value and Clinical Implications. Cancer Res. 2019, 79, 1226–1238. [Google Scholar] [CrossRef] [Green Version]
- de Sousa, J.F.; Torrieri, R.; Serafim, R.B.; Di Cristofaro, L.F.M.; Escanfella, F.D.; Ribeiro, R.; Zanette, D.L.; Paçó-Larson, M.L.; da Silva, W.A., Jr.; Tirapelli, D.P.D.C.; et al. Expression signatures of DNA repair genes correlate with survival prognosis of astrocytoma patients. Tumor Biol. 2017, 39. [Google Scholar] [CrossRef] [Green Version]
- Brennan, C.W.; Verhaak, R.G.W.; McKenna, A.; Campos, B.; Noushmehr, H.; Salama, S.R.; Zheng, S.; Chakravarty, D.; Sanborn, J.Z.; Berman, S.H.; et al. The Somatic Genomic Landscape of Glioblastoma. Cell 2013, 155, 462–477. [Google Scholar] [CrossRef] [PubMed]
- Zhao, S.; Ye, Z.; Stanton, R. Misuse of RPKM or TPM normalization when comparing across samples and sequencing protocols. RNA 2020, 26, 903–909. [Google Scholar] [CrossRef] [PubMed] [Green Version]
- Stringer, B.W.; Day, B.W.; D’Souza, R.; Jamieson, P.R.; Ensbey, K.S.; Bruce, Z.C.; Lim, Y.C.; Goasdoué, K.; Offenhäuser, C.; Akgul, S.; et al. A reference collection of patient-derived cell line and xenograft models of proneural, classical and mesenchymal glioblastoma. Sci. Rep. 2019, 9, 4902. [Google Scholar] [CrossRef] [PubMed] [Green Version]
- Liston, D.R.; Davis, M. Clinically Relevant Concentrations of Anticancer Drugs: A Guide for Nonclinical Studies. Clin. Cancer Res. 2017, 23, 3489–3498. [Google Scholar] [CrossRef] [Green Version]
- Remans, T.; Keunen, E.; Bex, G.J.; Smeets, K.; Vangronsveld, J.; Cuypers, A. Reliable Gene Expression Analysis by Reverse Transcription-Quantitative PCR: Reporting and Minimizing the Uncertainty in Data Accuracy. Plant Cell 2014, 26, 3829–3837. [Google Scholar] [CrossRef] [Green Version]
- Barbie, D.A.; Tamayo, P.; Boehm, J.S.; Kim, S.Y.; Moody, S.E.; Dunn, I.F.; Schinzel, A.C.; Sandy, P.; Meylan, E.; Scholl, C.; et al. Systematic RNA interference reveals that oncogenic KRAS-driven cancers require TBK1. Nature 2009, 462, 108–112. [Google Scholar] [CrossRef]
- Maréchal, A.; Zou, L. DNA Damage Sensing by the ATM and ATR Kinases. Cold Spring Harb. Perspect. Biol. 2013, 5, a012716. [Google Scholar] [CrossRef]
- Stupp, R.; Mason, W.P.; van den Bent, M.J.; Weller, M.; Fisher, B.; Taphoorn, M.J.B.; Belanger, K.; Brandes, A.A.; Marosi, C.; Bogdahn, U.; et al. Radiotherapy plus Concomitant and Adjuvant Temozolomide for Glioblastoma. N. Engl. J. Med. 2005, 352, 987–996. [Google Scholar] [CrossRef]
- Meng, X.; Duan, C.; Pang, H.; Chen, Q.; Han, B.; Zha, C.; Dinislam, M.; Wu, P.; Li, Z.; Zhao, S.; et al. DNA damage repair alterations modulate M2 polarization of microglia to remodel the tumor microenvironment via the p53-mediated MDK expression in glioma. EBioMedicine 2019, 41, 185–199. [Google Scholar] [CrossRef] [Green Version]
- Reaper, P.M.; Griffiths, M.R.; Long, J.M.; Charrier, J.-D.; MacCormick, S.; Charlton, P.A.; Golec, J.M.C.; Pollard, J.R. Selective killing of ATM- or p53-deficient cancer cells through inhibition of ATR. Nat. Chem. Biol. 2011, 7, 428–430. [Google Scholar] [CrossRef]
- Fischer, U.; Rheinheimer, S.; Krempler, A.; Löbrich, M.; Meese, E. Glioma-amplified sequence KUB3 influences double-strand break repair after ionizing radiation. Int. J. Oncol. 2013, 43, 50–56. [Google Scholar] [CrossRef] [PubMed] [Green Version]
- Miller, K.A.; Sawicka, D.; Barsky, D.; Albala, J.S. Domain mapping of the Rad51 paralog protein complexes. Nucleic Acids Res. 2004, 32, 169–178. [Google Scholar] [CrossRef] [PubMed]
- Du, J.; Yan, X.; Mi, S.; Li, Y.; Ji, H.; Hou, K.; Ma, S.; Ba, Y.; Zhou, P.; Chen, L.; et al. Identification of Prognostic Model and Biomarkers for Cancer Stem Cell Characteristics in Glioblastoma by Network Analysis of Multi-Omics Data and Stemness Indices. Front. Cell Dev. Biol. 2020, 8, 558961. [Google Scholar] [CrossRef] [PubMed]
- Ryu, A.H.; Eckalbar, W.L.; Kreimer, A.; Yosef, N.; Ahituv, N. Use antibiotics in cell culture with caution: Genome-wide identification of antibiotic-induced changes in gene expression and regulation. Sci. Rep. 2017, 7, 7533. [Google Scholar] [CrossRef] [PubMed] [Green Version]
- Boccard, S.G.; Marand, S.V.; Geraci, S.; Pycroft, L.; Berger, F.R.; Pelletier, L.A. Inhibition of DNA-repair genes Ercc1 and Mgmt enhances temozolomide efficacy in gliomas treatment: A pre-clinical study. Oncotarget 2015, 6, 29456–29468. [Google Scholar] [CrossRef] [PubMed] [Green Version]
- Felsberg, J.; Thon, N.; Eigenbrod, S.; Hentschel, B.; Sabel, M.C.; Westphal, M.; Schackert, G.; Kreth, F.W.; Pietsch, T.; Löffler, M.; et al. Promoter methylation and expression of MGMT and the DNA mismatch repair genes MLH1, MSH2, MSH6 and PMS2 in paired primary and recurrent glioblastomas. Int. J. Cancer 2011, 129, 659–670. [Google Scholar] [CrossRef] [PubMed]
- King, H.O.; Brend, T.; Payne, H.L.; Wright, A.; Ward, T.; Patel, K.; Egnuni, T.; Stead, L.F.; Patel, A.; Wurdak, H.; et al. RAD51 Is a Selective DNA Repair Target to Radiosensitize Glioma Stem Cells. Stem Cell Rep. 2017, 8, 125–139. [Google Scholar] [CrossRef] [Green Version]
- Kim, N.; Kim, S.H.; Kang, S.-G.; Moon, J.H.; Cho, J.; Suh, C.-O.; Yoon, H.I.; Chang, J.H. ATM mutations improve radio-sensitivity in wild-type isocitrate dehydrogenase-associated high-grade glioma: Retrospective analysis using next-generation sequencing data. Radiat. Oncol. 2020, 15, 184. [Google Scholar] [CrossRef]
- Huang, R.-X.; Zhou, P.-K. DNA damage response signaling pathways and targets for radiotherapy sensitization in cancer. Signal Transduct. Target. Ther. 2020, 5, 60. [Google Scholar] [CrossRef]
- Ferri, A.; Stagni, V.; Barilà, D. Targeting the DNA Damage Response to Overcome Cancer Drug Resistance in Glioblastoma. Int. J. Mol. Sci. 2020, 21, 4910. [Google Scholar] [CrossRef]
- Noonan, E.M.; Shah, D.; Yaffe, M.B.; Lauffenburger, D.A.; Samson, L.D. O6-Methylguanine DNA lesions induce an intra-S-phase arrest from which cells exit into apoptosis governed by early and late multi-pathway signaling network activation. Integr. Biol. 2012, 4, 1237–1255. [Google Scholar] [CrossRef] [PubMed] [Green Version]
- Quiros, S.; Roos, W.; Kaina, B. Processing of O6-methylguanine into DNA double-strand breaks requires two rounds of replication whereas apoptosis is also induced in subsequent cell cycles. Cell Cycle 2010, 9, 168–178. [Google Scholar] [CrossRef] [PubMed] [Green Version]
- Klattenhoff, A.W.; Thakur, M.; Chu, C.S.; Ray, D.; Habib, S.L.; Kidane, D. Loss of NEIL3 DNA glycosylase markedly increases replication associated double strand breaks and enhances sensitivity to ATR inhibitor in glioblastoma cells. Oncotarget 2017, 8, 112942–112958. [Google Scholar] [CrossRef] [PubMed]
- Struve, N.; Binder, Z.A.; Stead, L.F.; Brend, T.; Bagley, S.J.; Faulkner, C.; Ott, L.; Müller-Goebel, J.; Weik, A.-S.; Hoffer, K.; et al. EGFRvIII upregulates DNA mismatch repair resulting in increased temozolomide sensitivity of MGMT promoter methylated glioblastoma. Oncogene 2020, 39, 3041–3055. [Google Scholar] [CrossRef] [PubMed] [Green Version]
- Li, L.; Cao, Y.; Zhou, H.; Li, Y.; He, B.; Zhou, X.; Nie, Z.; Liang, L.; Liu, Y.; Ye, L. Knockdown of CCNO decreases the tumorigenicity of gastric cancer by inducing apoptosis. OncoTargets Ther. 2018, 11, 7471–7481. [Google Scholar] [CrossRef] [PubMed] [Green Version]
- Tang, L.; Deng, L.; Bai, H.X.; Sun, J.; Neale, N.; Wu, J.; Wang, Y.; Chang, K.; Huang, R.Y.; Zhang, P.J.; et al. Reduced expression of DNA repair genes and chemosensitivity in 1p19q codeleted lower-grade gliomas. J. Neuro-Oncol. 2018, 139, 563–571. [Google Scholar] [CrossRef] [PubMed]
- Liu, Z.; Zhang, W.; Cheng, X.; Wang, H.; Bian, L.; Wang, J.; Han, Z.; Wang, Y.; Lian, X.; Liu, B.; et al. Overexpressed XRCC2 as an independent risk factor for poor prognosis in glioma patients. Mol. Med. 2021, 27, 52. [Google Scholar] [CrossRef] [PubMed]
- Qin, C.-J.; Song, X.-M.; Chen, Z.-H.; Ren, X.-Q.; Xu, K.-W.; Jing, H.; He, Y.-L. XRCC2 as a predictive biomarker for radioresistance in locally advanced rectal cancer patients undergoing preoperative radiotherapy. Oncotarget 2015, 6, 32193–32204. [Google Scholar] [CrossRef]
- Auclair, Y.; Rouget, R.; Affar, E.B.; Drobetsky, E.A. ATR kinase is required for global genomic nucleotide excision repair exclusively during S phase in human cells. Proc. Natl. Acad. Sci. USA 2008, 105, 17896–17901. [Google Scholar] [CrossRef] [Green Version]
- Kurosawa, A.; Saito, S.; So, S.; Hashimoto, M.; Iwabuchi, K.; Watabe, H.; Adachi, N. DNA Ligase IV and Artemis Act Cooperatively to Suppress Homologous Recombination in Human Cells: Implications for DNA Double-Strand Break Repair. PLoS ONE 2013, 8, e72253. [Google Scholar] [CrossRef]
- Hegde, M.L.; Hazra, T.K.; Mitra, S. Early steps in the DNA base excision/single-strand interruption repair pathway in mammalian cells. Cell Res. 2008, 18, 27–47. [Google Scholar] [CrossRef] [PubMed] [Green Version]
- Masani, S.; Han, L.; Meek, K.; Yu, K. Redundant function of DNA ligase 1 and 3 in alternative end-joining during immunoglobulin class switch recombination. Proc. Natl. Acad. Sci. USA 2016, 113, 1261–1266. [Google Scholar] [CrossRef] [PubMed] [Green Version]


Publisher’s Note: MDPI stays neutral with regard to jurisdictional claims in published maps and institutional affiliations. |
© 2022 by the authors. Licensee MDPI, Basel, Switzerland. This article is an open access article distributed under the terms and conditions of the Creative Commons Attribution (CC BY) license (https://creativecommons.org/licenses/by/4.0/).
Share and Cite
Lozinski, M.; Bowden, N.A.; Graves, M.C.; Fay, M.; Day, B.W.; Stringer, B.W.; Tooney, P.A. Transcriptomic Profiling of DNA Damage Response in Patient-Derived Glioblastoma Cells before and after Radiation and Temozolomide Treatment. Cells 2022, 11, 1215. https://doi.org/10.3390/cells11071215
Lozinski M, Bowden NA, Graves MC, Fay M, Day BW, Stringer BW, Tooney PA. Transcriptomic Profiling of DNA Damage Response in Patient-Derived Glioblastoma Cells before and after Radiation and Temozolomide Treatment. Cells. 2022; 11(7):1215. https://doi.org/10.3390/cells11071215
Chicago/Turabian StyleLozinski, Mathew, Nikola A. Bowden, Moira C. Graves, Michael Fay, Bryan W. Day, Brett W. Stringer, and Paul A. Tooney. 2022. "Transcriptomic Profiling of DNA Damage Response in Patient-Derived Glioblastoma Cells before and after Radiation and Temozolomide Treatment" Cells 11, no. 7: 1215. https://doi.org/10.3390/cells11071215
APA StyleLozinski, M., Bowden, N. A., Graves, M. C., Fay, M., Day, B. W., Stringer, B. W., & Tooney, P. A. (2022). Transcriptomic Profiling of DNA Damage Response in Patient-Derived Glioblastoma Cells before and after Radiation and Temozolomide Treatment. Cells, 11(7), 1215. https://doi.org/10.3390/cells11071215