
Analysis of Secreted Proteins from Prepubertal Ovarian Tissues Exposed In Vitro to Cisplatin and LH

 , , ,
, , ,  and
and
Abstract
:1. Introduction
2. Materials and Methods
2.1. Animals
2.2. Ovarian Fragments Culture
2.3. LC-MS/MS Analysis
2.4. Statistical Analysis
3. Results
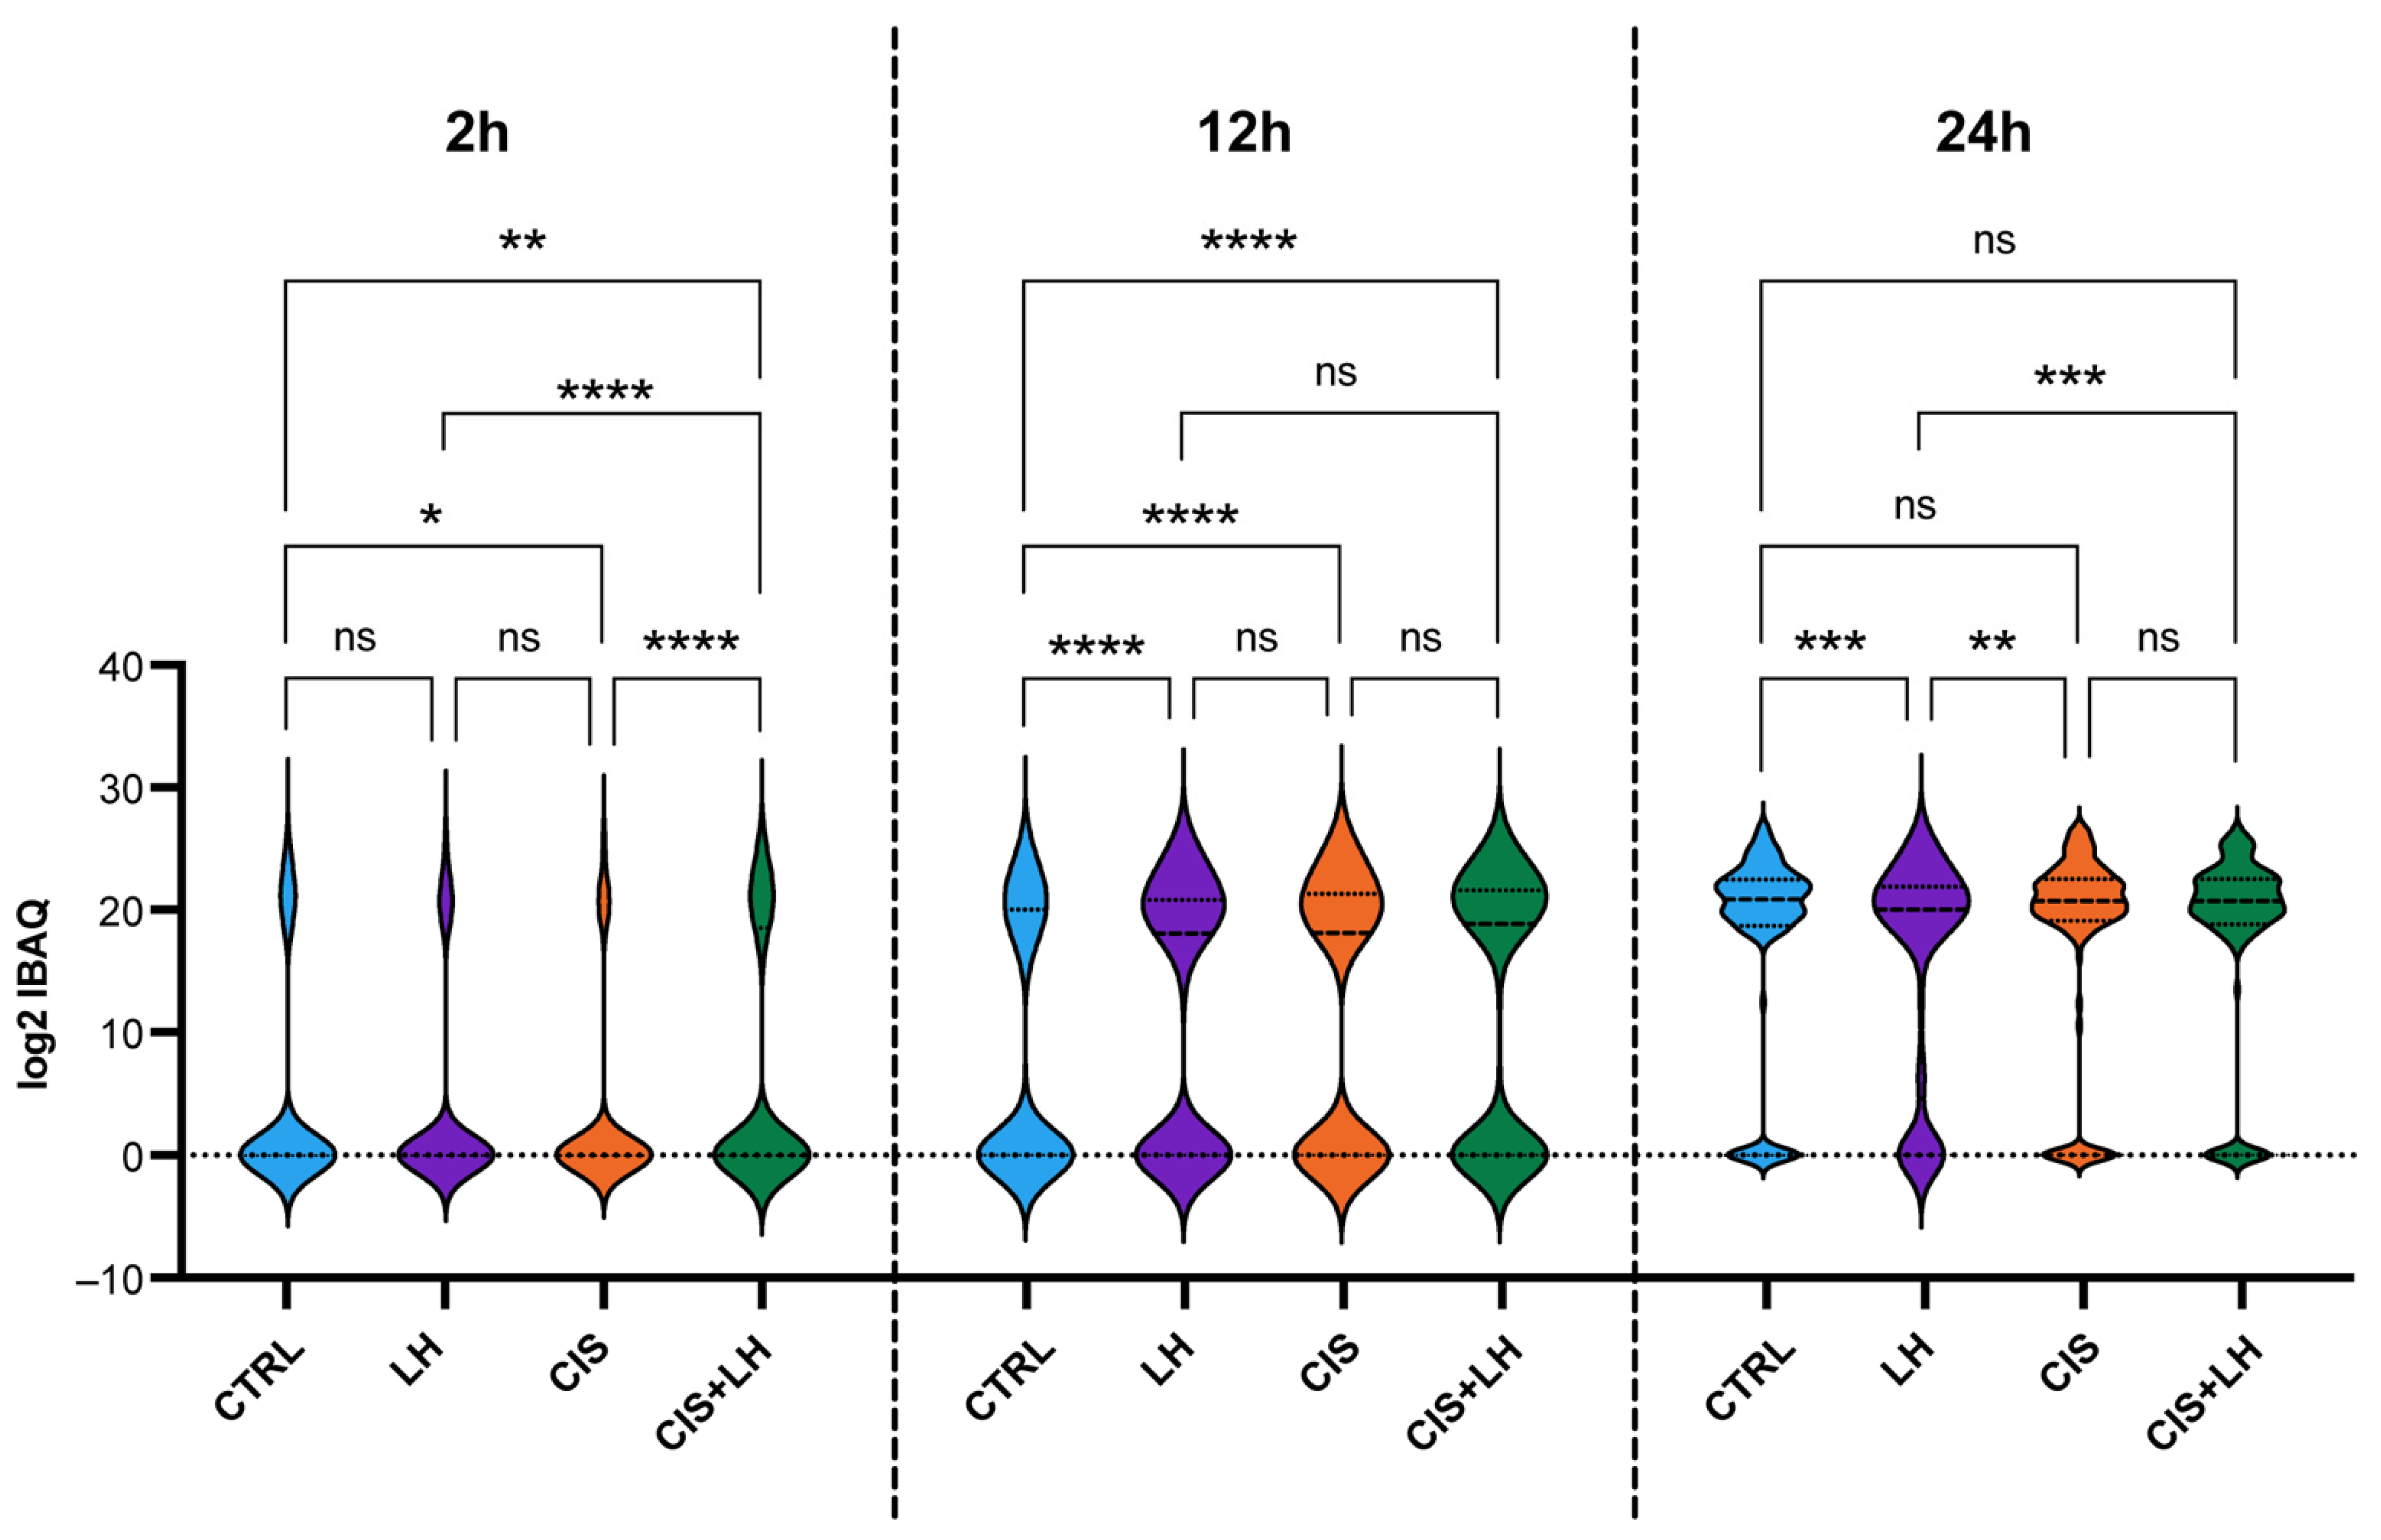
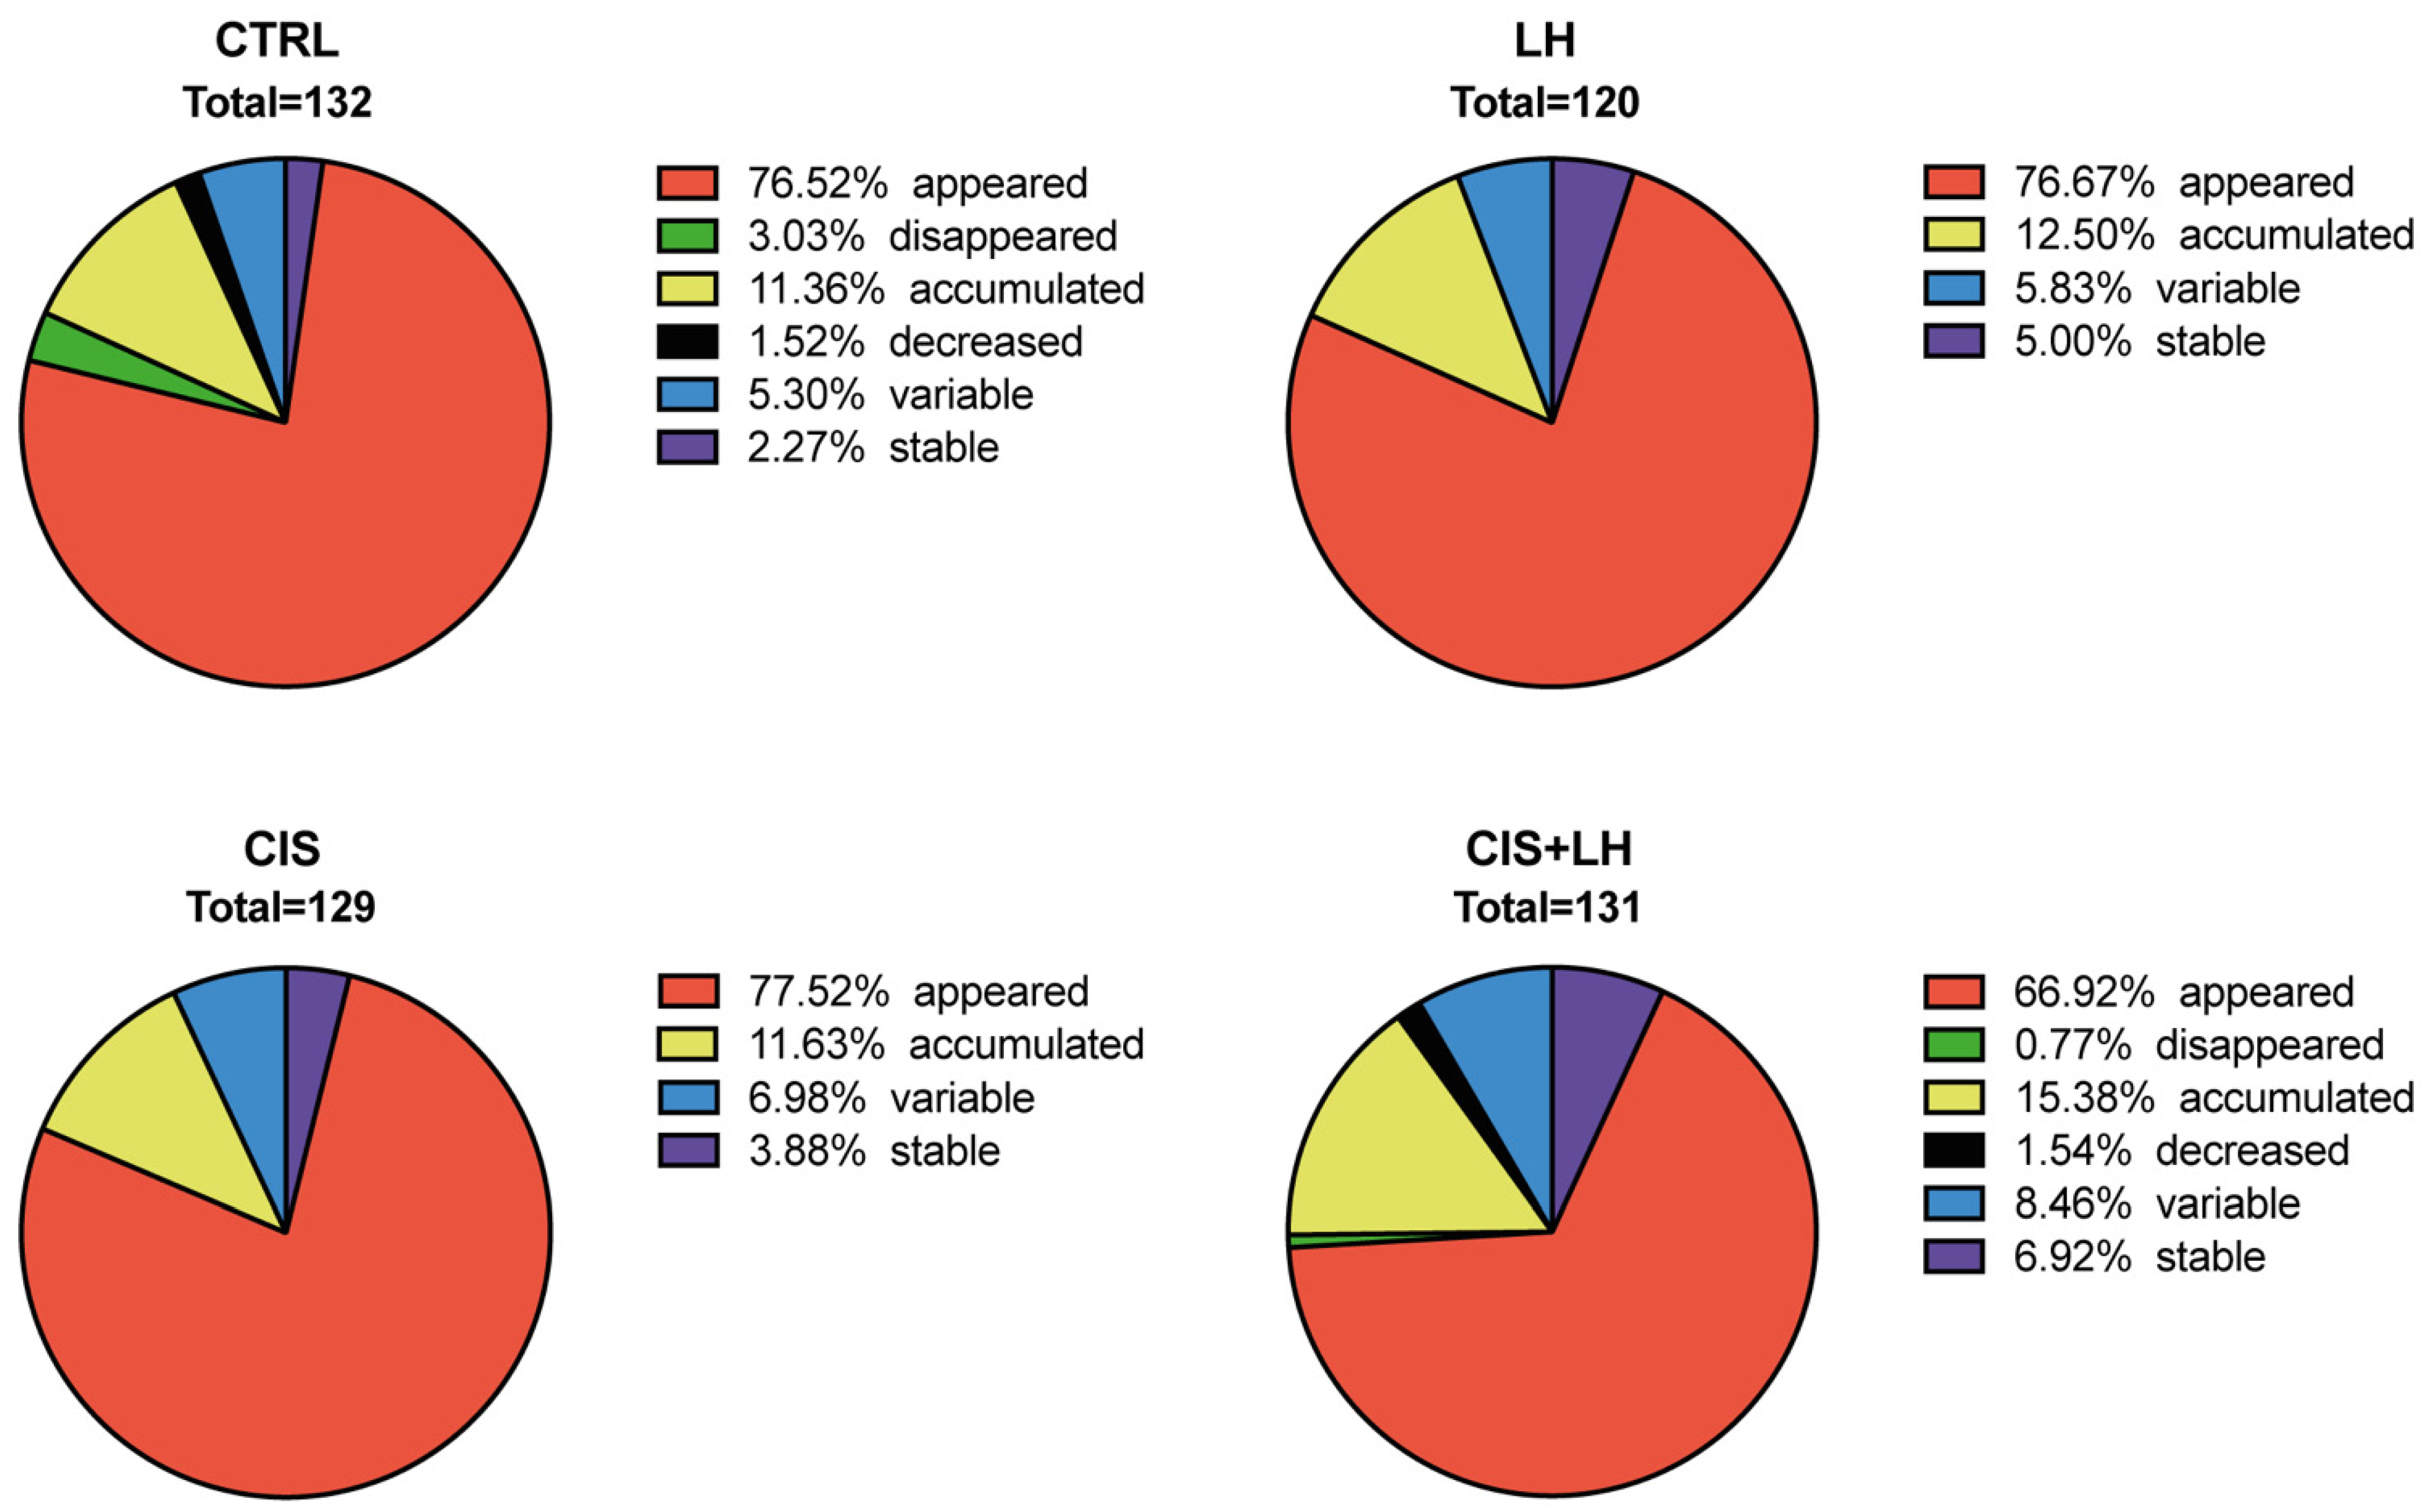
3.1. General Profiles of Proteins in the Culture Media
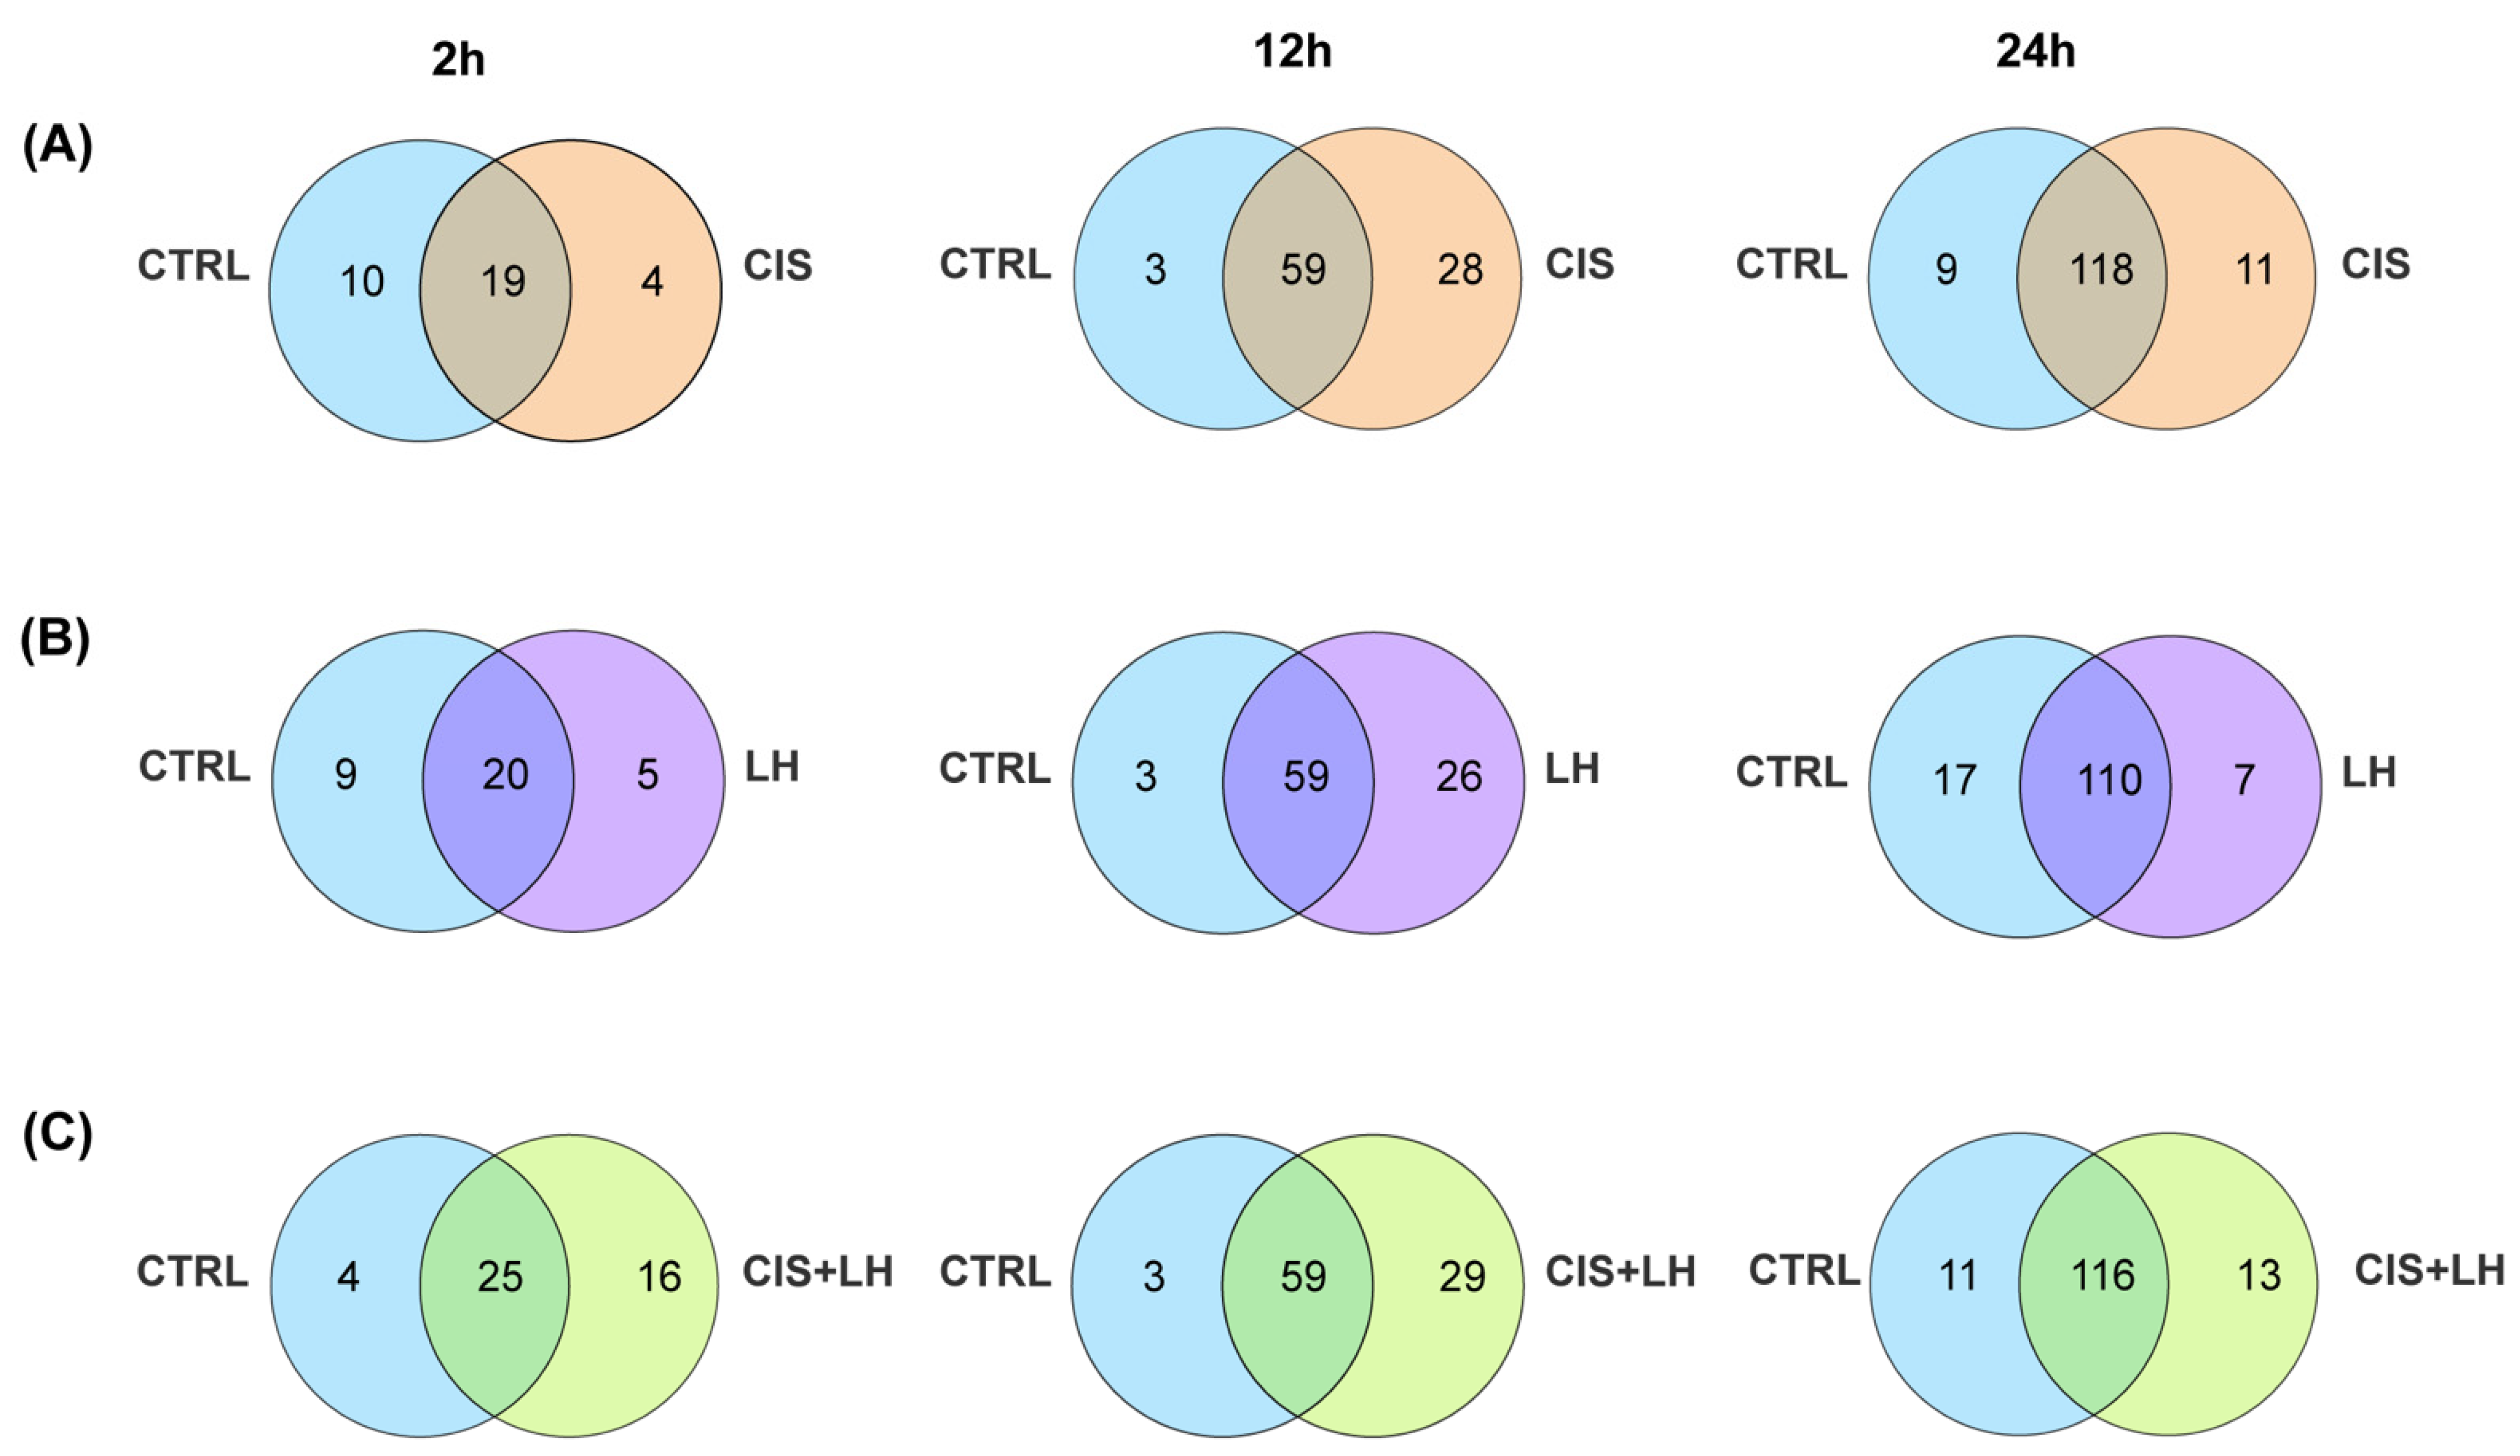
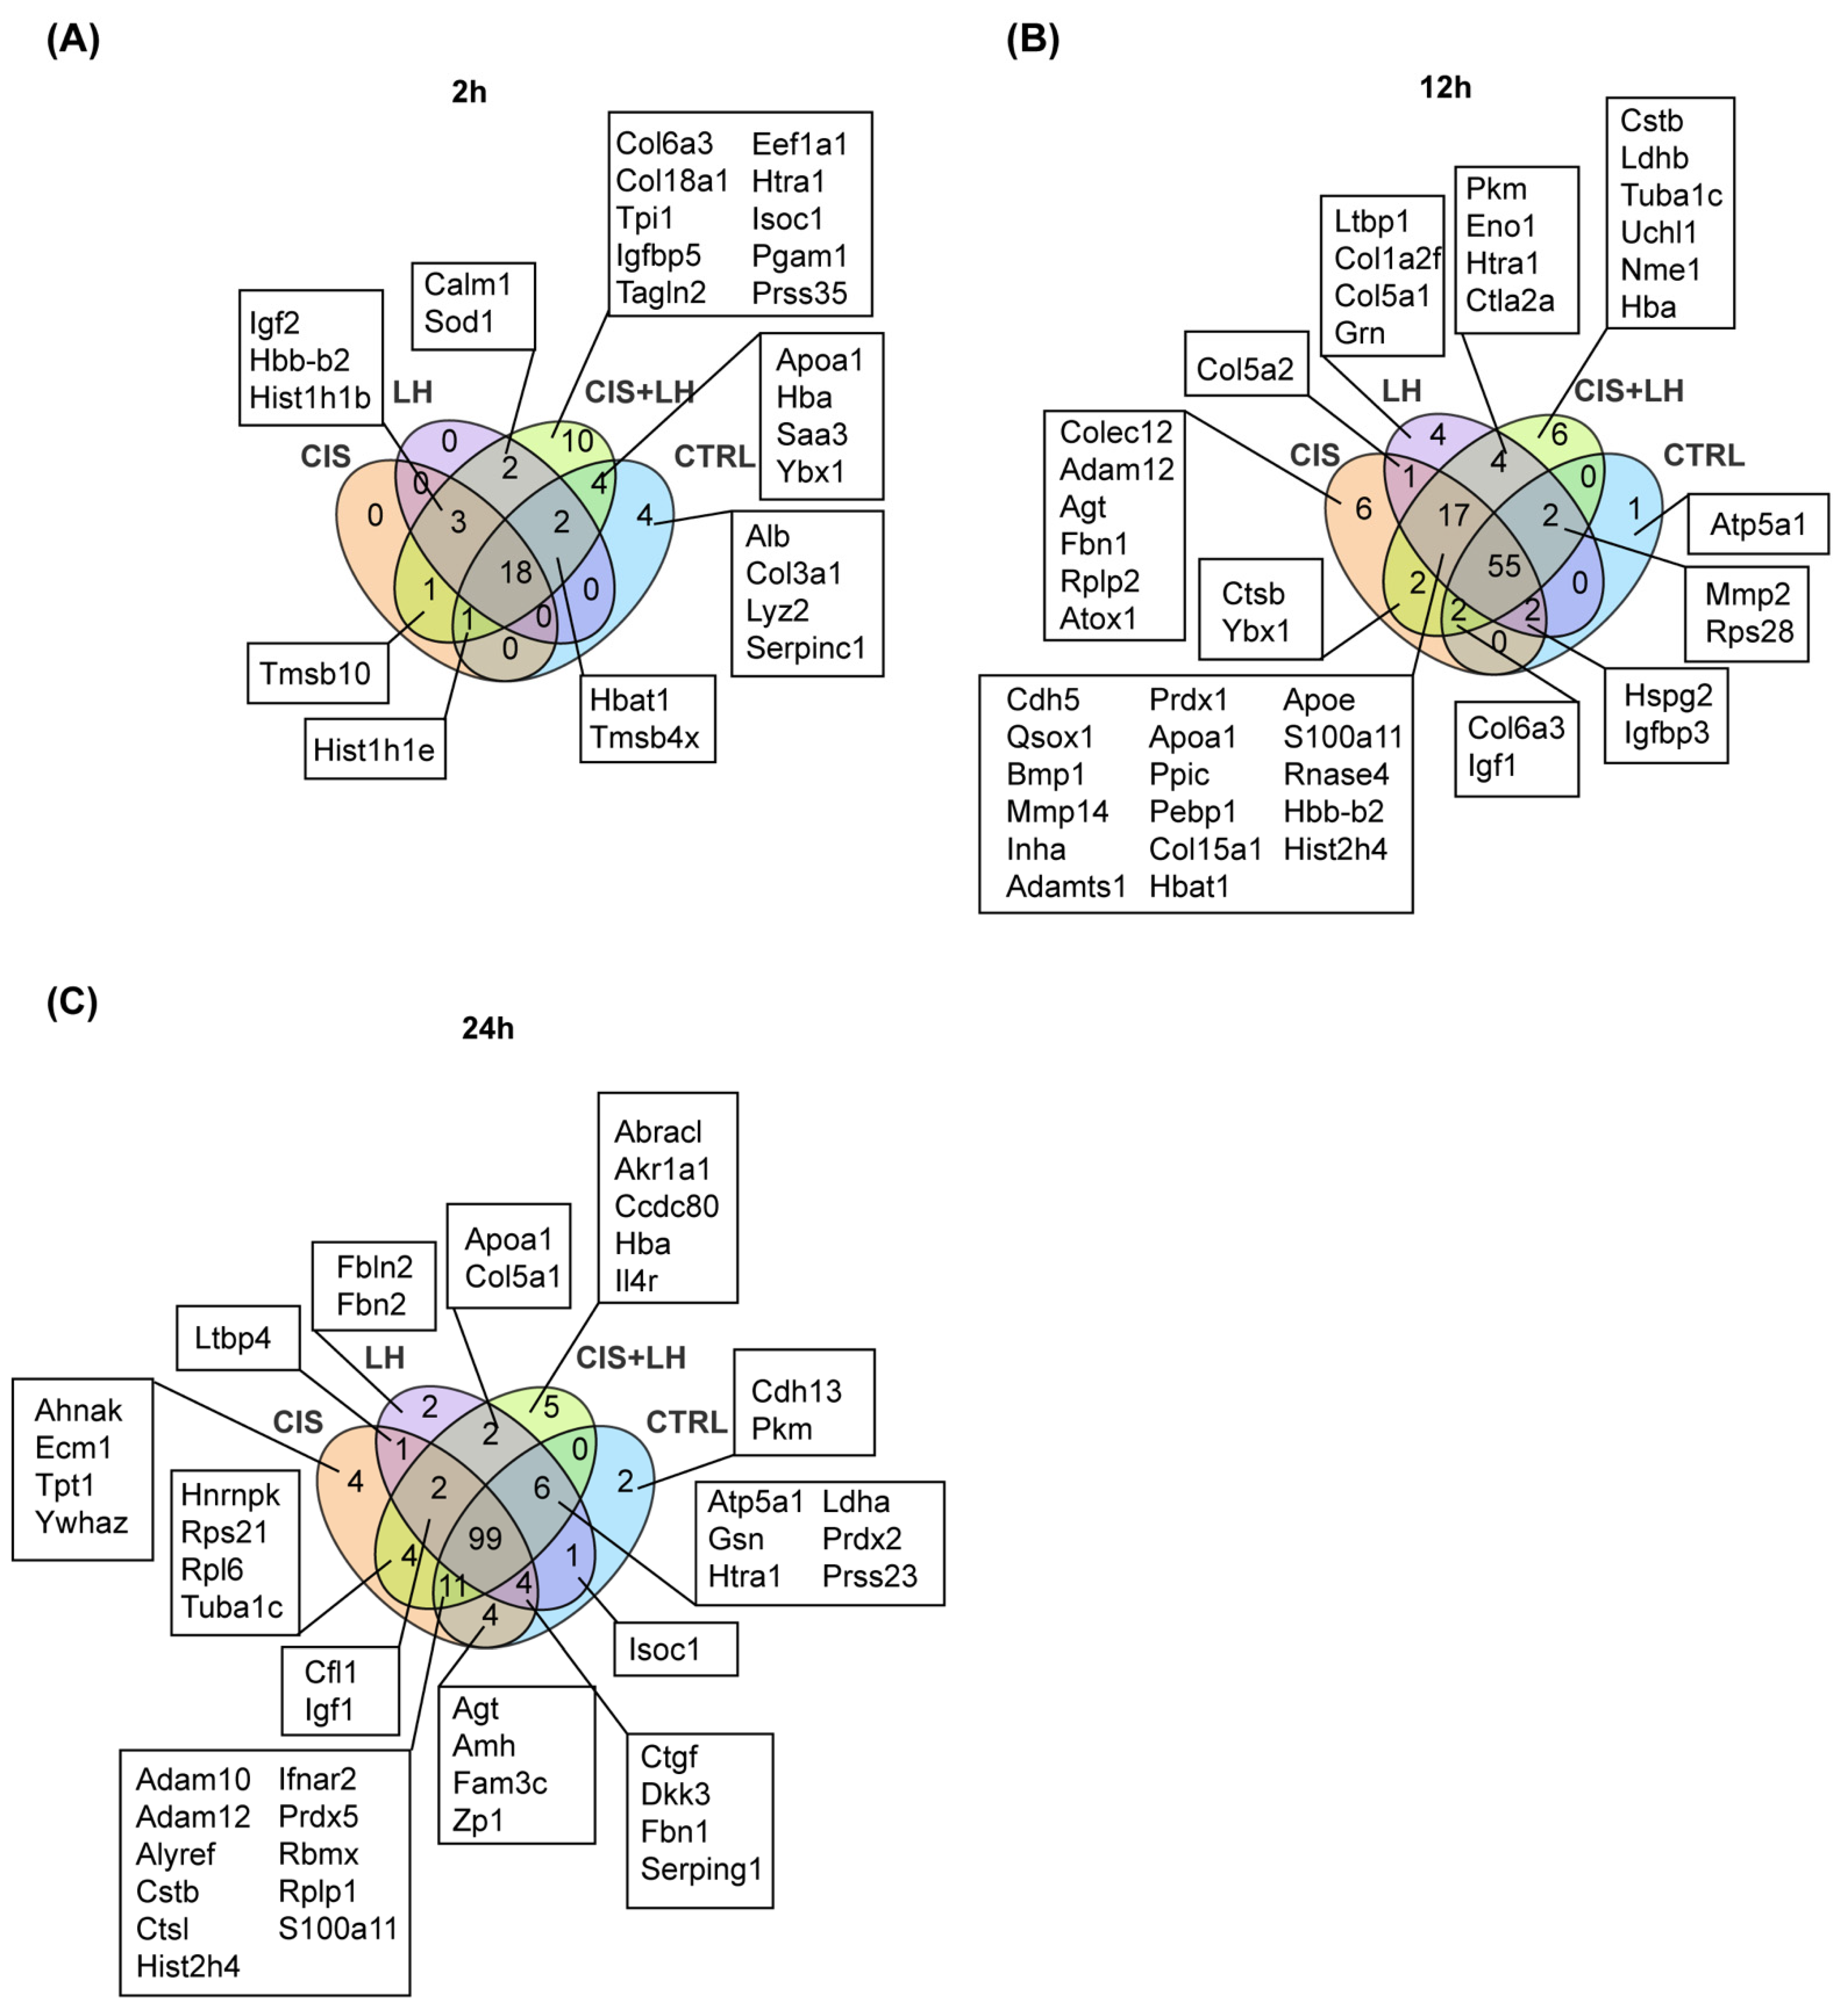
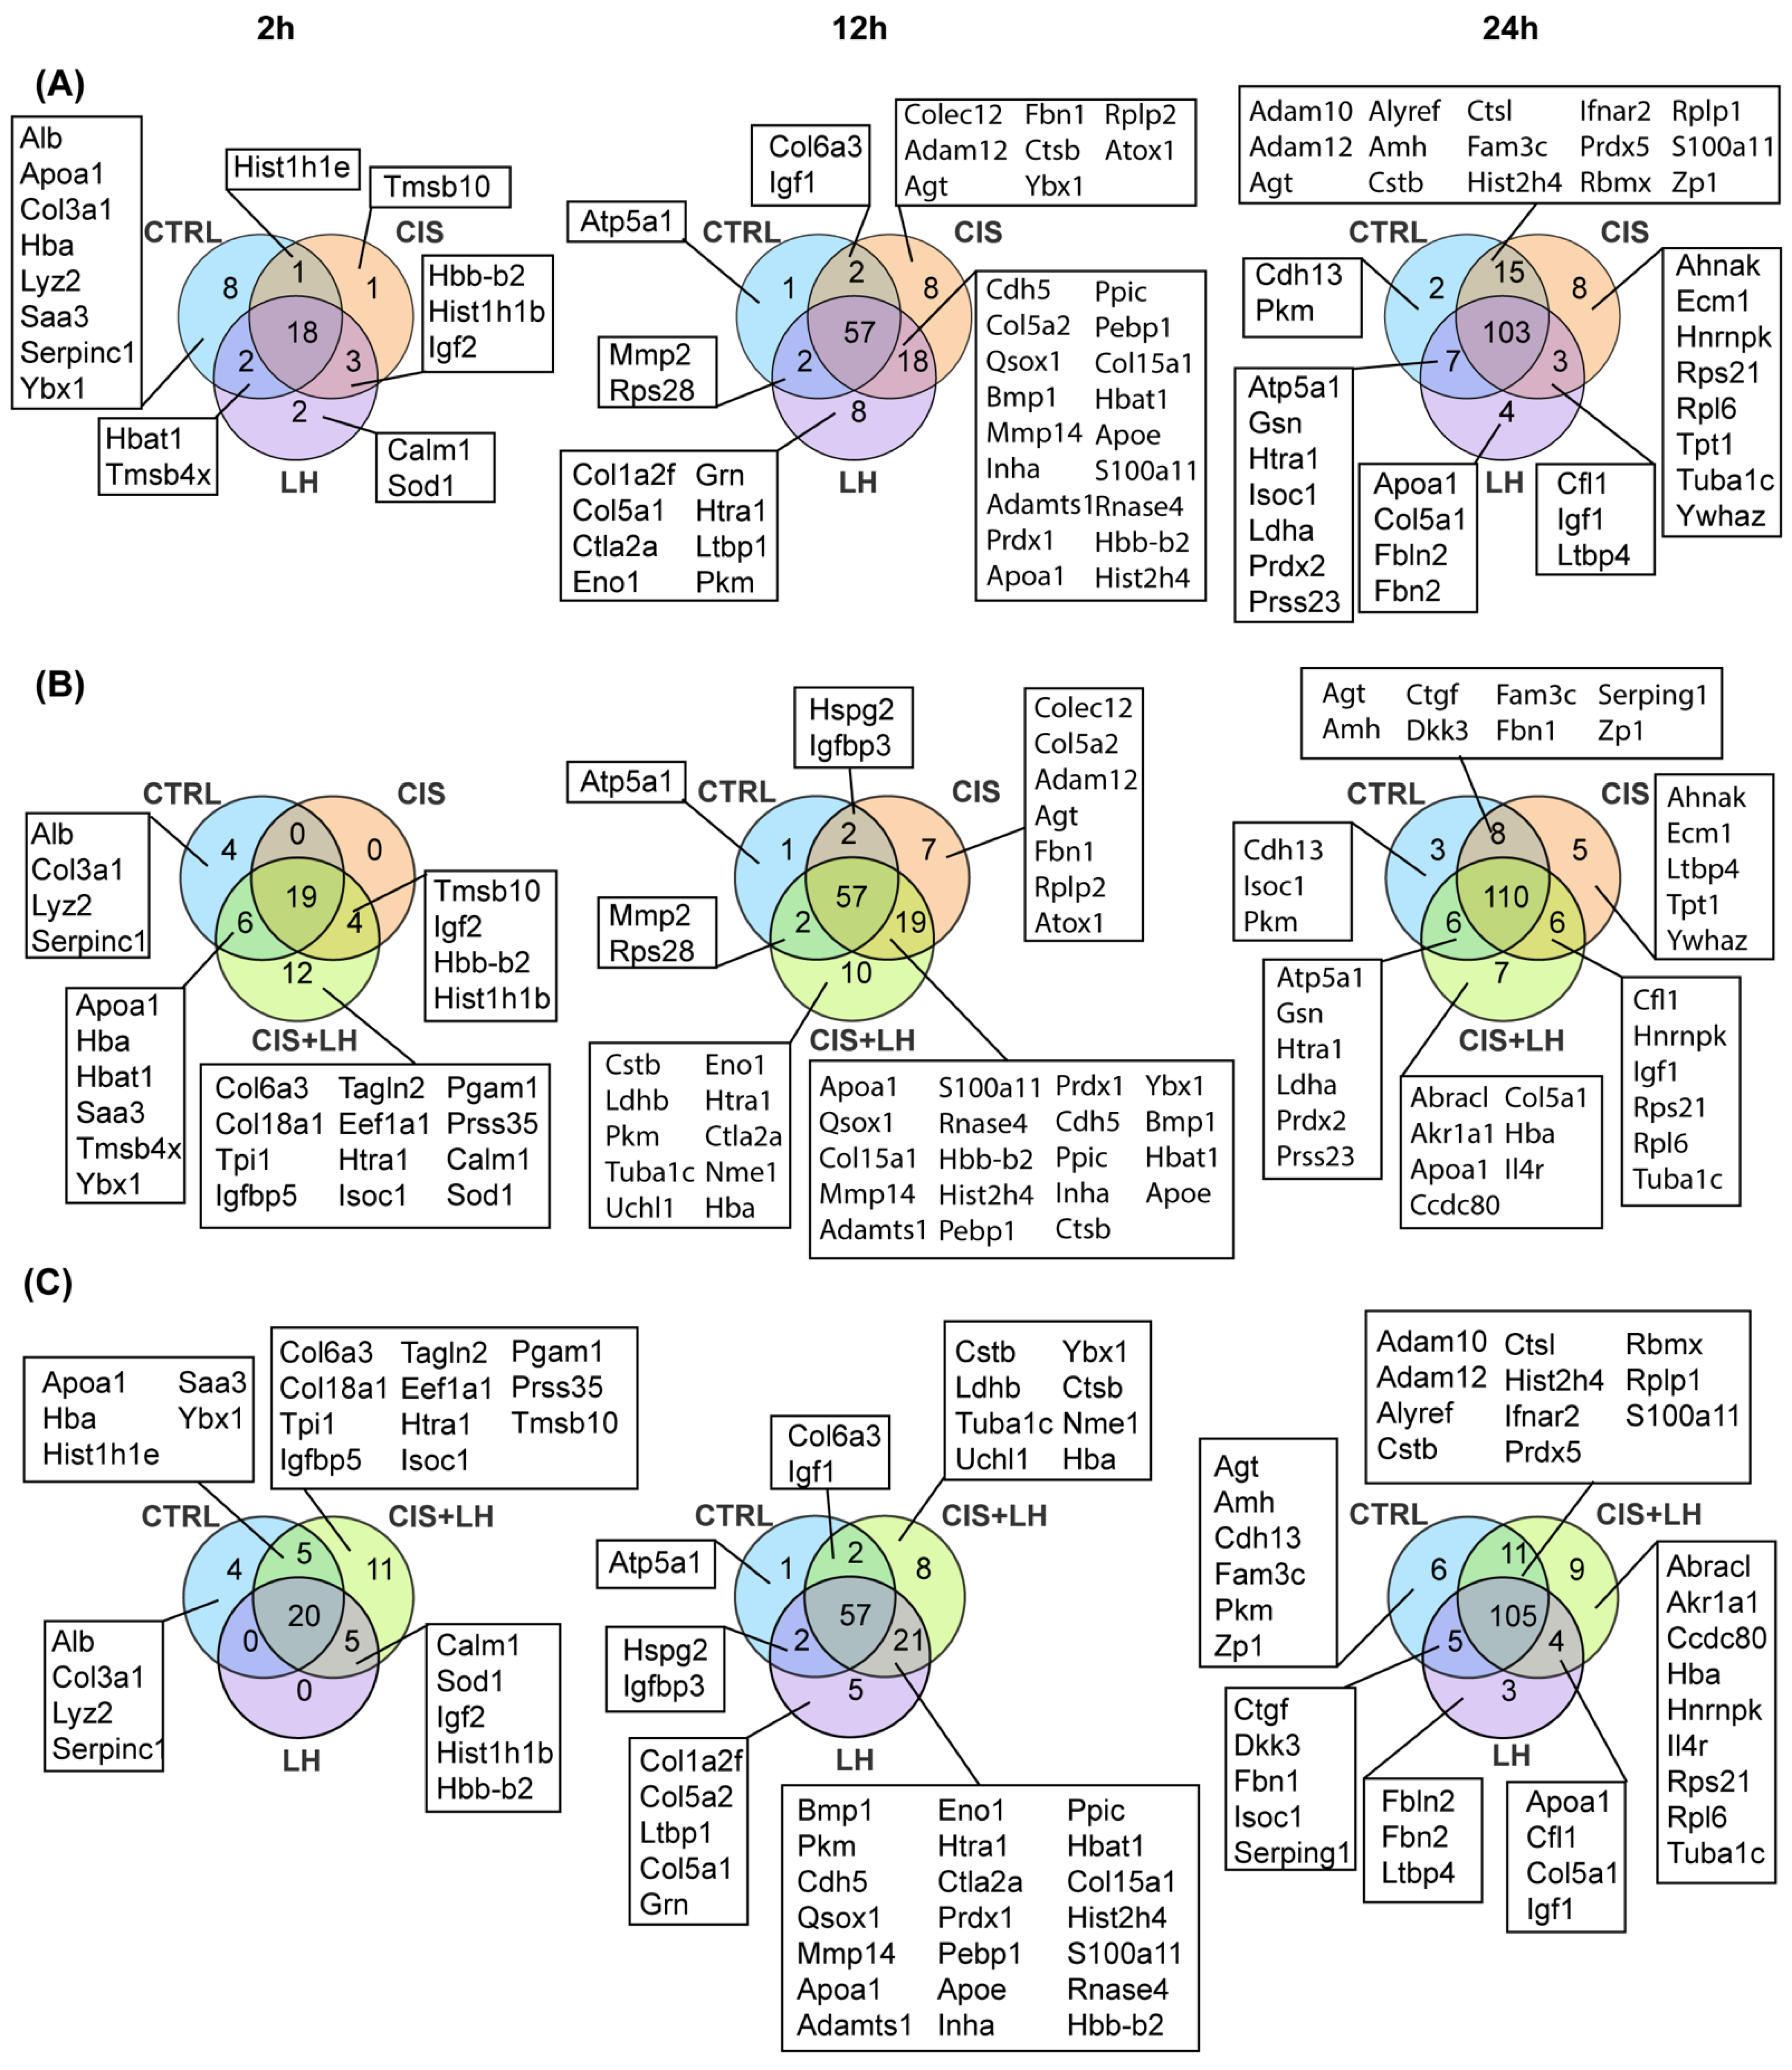
3.2. Proteosome Comparison at 2 h
3.3. Proteosome Comparison at 12 h
3.4. Proteosome Comparison at 24 h
4. Discussion
Supplementary Materials
Author Contributions
Funding
Institutional Review Board Statement
Informed Consent Statement
Data Availability Statement
Conflicts of Interest
References
- Spears, N.; Lopes, F.; Stefansdottir, A.; Rossi, V.; De Felici, M.; Anderson, R.A.; Klinger, F.G. Ovarian damage from chemotherapy and current approaches to its protection. Hum. Reprod. Update 2019, 25, 673–693. [Google Scholar] [CrossRef] [PubMed]
- Rossi, V.; Lispi, M.; Longobardi, S.; Mattei, M.; Di Rella, F.; Salustri, A.; De Felici, M.; Klinger, F.G. LH prevents cisplatin-induced apoptosis in oocytes and preserves female fertility in mouse. Cell Death Differ. 2017, 24, 72–82. [Google Scholar] [CrossRef] [PubMed] [Green Version]
- Del Castillo, L.M.; Buigues, A.; Rossi, V.; Soriano, M.J.; Martinez, J.; De Felici, M.; Lamsira, H.K.; Di Rella, F.; Klinger, F.G.; Pellicer, A.; et al. The cyto-protective effects of LH on ovarian reserve and female fertility during exposure to gonadotoxic alkylating agents in an adult mouse model. Hum. Reprod. 2021, 36, 2514–2528. [Google Scholar] [CrossRef] [PubMed]
- Gonfloni, S.; Di Tella, L.; Caldarola, S.; Cannata, S.M.; Klinger, F.G.; Di Bartolomeo, C.; Mattei, M.; Candi, E.; De Felici, M.; Melino, G.; et al. Inhibition of the c-Abl–TAp63 pathway protects mouse oocytes from chemotherapy-induced death. Nat. Med. 2009, 15, 1179–1185. [Google Scholar] [CrossRef] [PubMed]
- Tuppi, M.; Kehrloesser, S.; Coutandin, D.W.; Rossi, V.; Luh, L.M.; Strubel, A.; Hötte, K.; Hoffmeister, M.; Schäfer, B.; De Oliveira, T.; et al. Oocyte DNA damage quality control requires consecutive interplay of CHK2 and CK1 to activate p63. Nat. Struct. Mol. Biol. 2018, 25, 261–269. [Google Scholar] [CrossRef]
- Marcozzi, S.; Rossi, V.; Salvatore, G.; Di Rella, F.; De Felici, M.; Klinger, F.G. Distinct effects of epirubicin, cisplatin and cyclophosphamide on ovarian somatic cells of prepuberal ovaries. Aging 2019, 11, 10532–10556. [Google Scholar] [CrossRef]
- Cairns, L.A.; Moroni, E.; Levantini, E.; Giorgetti, A.; Klinger, F.G.; Ronzoni, S.; Tatangelo, L.; Tiveron, C.; De Felici, M.; Dolci, S.; et al. Kit regulatory elements required for expression in developing hematopoietic and germ cell lineages. Blood 2003, 102, 3954–3962. [Google Scholar] [CrossRef]
- Ciccosanti, F.; Di Rienzo, M.; Romagnoli, A.; Colavita, F.; Refolo, G.; Castilletti, C.; Agrati, C.; Brai, A.; Manetti, F.; Botta, L.; et al. Proteomic analysis identifies the RNA helicase DDX3X as a host target against SARS-CoV-2 infection. Antivir. Res. 2021, 190, 105064. [Google Scholar] [CrossRef]
- The UniProt Consortium. The universal protein knowledgebase in 2021. Nucleic Acids Res. 2021, 49, D480–D489. [Google Scholar] [CrossRef]
- Kalra, H.; Simpson, R.J.; Ji, H.; Aikawa, E.; Altevogt, P.; Askenase, P.; Bond, V.C.; Borras, F.E.; Breakefield, X.; Budnik, V.; et al. Vesiclepedia: A compendium for extracellular vesicles with continuous community annotation. PLoS Biol. 2012, 10, e1001450. [Google Scholar] [CrossRef] [Green Version]
- Pathan, M.; Fonseka, P.; Chitti, S.V.; Kang, T.; Sanwlani, R.; Van Deun, J.; Hendrix, A.; Mathivanan, S. Vesiclepedia 2019: A compendium of RNA, proteins, lipids and metabolites in extracellular vesicles. Nucleic Acids Res. 2019, 47, D516–D519. [Google Scholar] [CrossRef] [PubMed] [Green Version]
- Shi, J.; Yang, F.; Zhou, N.; Jiang, Y.; Zhao, Y.; Zhu, J.; Prelaj, A.; Malhotra, J.; Normanno, N.; Danese, E.; et al. Isochorismatase domain-containing protein 1 (ISOC1) participates in DNA damage repair and inflammation-related pathways to promote lung cancer development. Transl. Lung Cancer Res. 2021, 10, 1444–1456. [Google Scholar] [CrossRef] [PubMed]
- Wahlberg, P.; Nylander, A.; Ahlskog, N.; Liu, K.; Ny, T. Expression and localization of the serine proteases high-temperature requirement factor A1, serine protease 23, and serine protease 35 in the mouse ovary. Endocrinology 2008, 149, 5070–5077. [Google Scholar] [CrossRef] [PubMed]
- Hall, A.K. Thymosin beta-10 accelerates apoptosis. Cell Mol. Biol. Res. 1995, 41, 167–180. [Google Scholar] [PubMed]
- Gutierrez-Pabello, J.A.; McMurray, D.N.; Adams, L.G. Upregulation of thymosin β-10 by Mycobacterium bovis infection of bovine macrophages is associated with apoptosis. Infect. Immun. 2002, 70, 2121–2127. [Google Scholar] [CrossRef] [Green Version]
- Rho, S.B.; Chun, T.; Lee, S.H.; Park, K.; Lee, J.H. The interaction between E-tropomodulin and thymosin β-10 rescues tumor cells from thymosin β-10 mediated apoptosis by restoring actin architecture. FEBS Lett. 2004, 557, 57–63. [Google Scholar] [CrossRef] [Green Version]
- Rho, S.B.; Lee, K.W.; Chun, T.; Lee, S.H.; Park, K.; Lee, J.H. The identification of apoptosis-related residues in human thymosin β-10 by mutational analysis and computational modeling. J. Biol. Chem. 2005, 280, 34003–34007. [Google Scholar] [CrossRef] [PubMed] [Green Version]
- Lee, S.H.; Son, M.J.; Oh, S.H.; Rho, S.B.; Park, K.; Kim, Y.J.; Park, M.S.; Lee, J.H. Thymosin β10 inhibits angiogenesis and tumor growth by interfering with Ras function. Cancer Res. 2005, 65, 137–148. [Google Scholar] [PubMed]
- Ochieng, J.; Nangami, G.; Sakwe, A.; Rana, T.; Ingram, S.; Goodwin, J.S.; Moye, C.; Lammers, P.; Adunyah, S.E. Extracellular histones are the ligands for the uptake of exosomes and hydroxyapatite-nanoparticles by tumor cells via syndecan-4. FEBS Lett. 2018, 592, 3274–3285. [Google Scholar] [CrossRef] [Green Version]
- Thompson, J.G.; Brown, H.M.; Kind, K.L.; Russell, D.L. The ovarian antral follicle: Living on the edge of hypoxia or not? Biol. Reprod. 2015, 92, 153. [Google Scholar] [CrossRef]
- Brown, H.M.; Anastasi, M.R.; Frank, L.A.; Kind, K.L.; Richani, D.; Robker, R.L.; Russell, D.L.; Gilchrist, R.B.; Thompson, J.G. Hemoglobin: A gas transport molecule that is hormonally regulated in the ovarian follicle in mice and humans. Biol. Reprod. 2015, 92, 26. [Google Scholar] [CrossRef] [Green Version]
- Brachat, A.; Pierrat, B.; Xynos, A.; Brecht, K.; Simonen, M.; Brungger, A.; Heim, J. A microarray-based, integrated approach to identify novel regulators of cancer drug response and apoptosis. Oncogene 2002, 21, 8361–8371. [Google Scholar] [CrossRef] [PubMed] [Green Version]
- Zhang, Z.; Liu, S.; Huang, S. Thymosin β4 prevents oxygen-glucose deprivation/reperfusion-induced injury in rat cortical neurons. Neuropsychiatr. Dis. Treat. 2019, 15, 2385–2393. [Google Scholar] [CrossRef] [PubMed] [Green Version]
- Ba, Y.S.; Ma, F.W.; Ma, Y.W.; Ba, D.C.; Ba, G.D. ATP5A1 Participates in Transcriptional and Posttranscriptional Regulation of Cancer-Associated Genes by Modulating Their Expression and Alternative Splicing Profiles in HeLa Cells. Technol. Cancer Res. Treat. 2021, 20, 15330338211039126. [Google Scholar]
- Lin, R.; Li, X.; Wu, S.; Qian, S.; Hou, H.; Dong, M.; Zhang, X.; Zhang, M. Suppression of latent transforming growth factor-β (TGF-β)-binding protein 1 (LTBP1) inhibits natural killer/T cell lymphoma progression by inactivating the TGF-β/Smad and p38MAPK pathways. Exp. Cell Res. 2021, 407, 112790. [Google Scholar] [CrossRef] [PubMed]
- Li, M.; Liu, Y.; Xia, F.; Wu, Z.; Deng, L.; Jiang, R.; Guo, F.J. Progranulin is required for proper ER stress response and inhibits ER stress-mediated apoptosis through TNFR2. Cell Signal. 2014, 26, 1539–1548. [Google Scholar] [CrossRef] [PubMed]
- Feng, G.; Ma, H.M.; Huang, H.B.; Li, Y.W.; Zhang, P.; Huang, J.J.; Cheng, L.; Li, G.R. Overexpression of COL5A1 promotes tumor progression and metastasis and correlates with poor survival of patients with clear cell renal cell carcinoma. Cancer Manag. Res. 2019, 11, 1263–1274. [Google Scholar] [CrossRef] [Green Version]
- Guan, W.; Wang, X.; Lin, Q.; Zhang, J.; Ren, W.; Xu, G. Transforming growth factor-β/miR-143-3p/cystatin B axis is a therapeutic target in human ovarian cancer. Int. J. Oncol. 2019, 55, 267–276. [Google Scholar] [CrossRef]
- Lieuallen, K.; Pennacchio, L.A.; Park, M.; Myers, R.M.; Lennon, G.G. Cystatin B-deficient mice have increased expression of apoptosis and glial activation genes. Hum. Mol. Genet. 2001, 10, 1867–1871. [Google Scholar] [CrossRef]
- Chen, X.; Xu, H.; Wu, N.; Liu, X.; Qiao, G.; Su, S.; Tian, Y.; Yuan, R.; Li, C.; Liu, X.; et al. Interaction between granulin A and enolase 1 attenuates the migration and invasion of human hepatoma cells. Oncotarget 2017, 8, 30305–30316. [Google Scholar] [CrossRef] [Green Version]
- Ivanova, N.B.; Dimos, J.T.; Schaniel, C.; Hackney, J.A.; Moore, K.A.; Lemischka, I.R. A stem cell molecular signature. Science 2002, 298, 601–604. [Google Scholar] [CrossRef] [PubMed]
- Mizukami, T.; Kuramitsu, M.; Takizawa, K.; Momose, H.; Masumi, A.; Naito, S.; Iwama, A.; Ogawa, T.; Noce, T.; Hamaguchi, I. Identification of transcripts commonly expressed in both hematopoietic and germ-line stem cells. Stem Cells Dev. 2008, 17, 67–80. [Google Scholar] [CrossRef] [PubMed]
- Takeuchi, T.; Ohtsuki, Y. Recent progress in T-cadherin (CDH13, H-cadherin) research. Histol. Histopathol. 2001, 16, 1287–1293. [Google Scholar] [PubMed]
- Xu, Y.; Li, X.; Wang, H.; Xie, P.; Yan, X.; Bai, Y.; Zhang, T. Hypermethylation of CDH13, DKK3 and FOXL2 promoters and the expression of EZH2 in ovary granulosa cell tumors. Mol. Med. Rep. 2016, 14, 2739–2745. [Google Scholar] [CrossRef] [Green Version]
- Davis, T.A.; Loos, B.; Engelbrecht, A.M. AHNAK: The giant jack of all trades. Cell. Signal. 2014, 26, 2683–2693. [Google Scholar] [CrossRef] [PubMed]
- Hardy, S.A.; Mabotuwana, N.S.; Murtha, L.A.; Coulter, B.; Sanchez-Bezanilla, S.; Al-Omary, M.S.; Senanayake, T.; Loering, S.; Starkey, M.; Lee, R.J.; et al. Novel role of extracellular matrix protein 1 (ECM1) in cardiac aging and myocardial infarction. PLoS ONE 2019, 14, e0212230. [Google Scholar] [CrossRef] [Green Version]
- Lin, Z.; Zhang, X.; Wang, J.; Liu, W.; Liu, Q.; Ye, Y.; Dai, B.; Guo, D.; Zhang, P.; Yang, P. Translationally controlled tumor protein promotes liver regeneration by activating mTORC2/AKT signaling. Cell Death Dis. 2020, 11, 58. [Google Scholar] [CrossRef]
- Perciavalle, R.M.; Opferman, J.T. Delving deeper: MCL-1’s contributions to normal and cancer biology. Trends Cell Biol. 2013, 23, 22–29. [Google Scholar] [CrossRef] [Green Version]
- Gan, Y.; Ye, F.; He, X.X. The role of YWHAZ in cancer: A maze of opportunities and challenges. J. Cancer 2020, 11, 2252–2264. [Google Scholar] [CrossRef]
- Stomberski, C.T.; Anand, P.; Venetos, N.M.; Hausladen, A.; Zhou, H.L.; Premont, R.T.; Stamler, J.S. AKR1A1 is a novel mammalian S-nitroso-glutathione reductase. J. Biol. Chem. 2019, 294, 18285–18293. [Google Scholar] [CrossRef]
- Pawlowski, K.; Muszewska, A.; Lenart, A.; Szczepinska, T.; Godzik, A.; Grynberg, M. A widespread peroxiredoxin-like domain present in tumor suppression-and progression-implicated proteins. BMC Genom. 2010, 11, 590. [Google Scholar] [CrossRef] [PubMed] [Green Version]
- Lee, H.K.; Koh, S.; Lo, D.C.; Marchuk, D.A. Neuronal IL-4Rα modulates neuronal apoptosis and cell viability during the acute phases of cerebral ischemia. FEBS J. 2018, 285, 2785–2798. [Google Scholar] [CrossRef] [PubMed]
- Seifer, D.B.; Merhi, Z. Is AMH a regulator of follicular atresia? J. Assist. Reprod. Genet. 2014, 31, 1403–1407. [Google Scholar] [CrossRef] [Green Version]
- Zhu, Y.; Pu, Z.; Wang, G.; Li, Y.; Wang, Y.; Li, N.; Peng, F. FAM3C: An emerging biomarker and potential therapeutic target for cancer. Biomark. Med. 2021, 15, 373–384. [Google Scholar] [CrossRef] [PubMed]
- Kusano, H.; Shimizu, S.; Koya, R.C.; Fujita, H.; Kamada, S.; Kuzumaki, N.; Tsujimoto, Y. Human gelsolin prevents apoptosis by inhibiting apoptotic mitochondrial changes via closing VDAC. Oncogene 2000, 19, 4807–4814. [Google Scholar] [CrossRef] [PubMed] [Green Version]
- Urbanska, K.; Orzechowski, A. Unappreciated role of LDHA and LDHB to control apoptosis and autophagy in tumor cells. Int. J. Mol. Sci. 2019, 20, 2085. [Google Scholar] [CrossRef] [Green Version]
- Yang, S.; Luo, A.; Hao, X.; Lai, Z.; Ding, T.; Ma, X.; Mayinuer, M.; Shen, W.; Wang, X.; Lu, Y.; et al. Peroxiredoxin 2 inhibits granulosa cell apoptosis during follicle atresia through the NFKB pathway in mice. Biol. Reprod. 2011, 84, 1182–1189. [Google Scholar] [CrossRef] [PubMed] [Green Version]
- Miyakoshi, K.; Murphy, M.J.; Yeoman, R.R.; Mitra, S.; Dubay, C.J.; Hennebold, J.D. The identification of novel ovarian proteases through the use of genomic and bioinformatic methodologies. Biol. Reprod. 2006, 75, 823–835. [Google Scholar] [CrossRef]
- Li, L.; Liao, J.; Yuan, Q.; Hong, X.; Li, J.; Peng, Y.; He, M.; Zhu, H.; Zhu, M.; Hou, F.F.; et al. Fibrillin-1–enriched microenvironment drives endothelial injury and vascular rarefaction in chronic kidney disease. Sci. Adv. 2021, 7, eabc7170. [Google Scholar] [CrossRef]
- Zhai, B.; Liu, H.; Li, X.; Dai, L.; Gao, Y.; Li, C.; Zhang, L.; Ding, Y.; Yu, X.; Zhang, J. BMP15 prevents cumulus cell apoptosis through CCL2 and FBN1 in porcine ovaries. Cell Physiol. Biochem. 2013, 32, 264–278. [Google Scholar] [CrossRef]
- Chen, C.; Ahmad, M.J.; Ye, T.; Du, C.; Zhang, X.; Liang, A.; Yang, L. Cathepsin B Regulates Mice Granulosa Cells’ Apoptosis and Proliferation In Vitro. Int. J. Mol. Sci. 2021, 22, 11827. [Google Scholar] [CrossRef] [PubMed]
- Kveiborg, M.; Frohlich, C.; Albrechtsen, R.; Tischler, V.; Dietrich, N.; Holck, P.; Kronqvist, P.; Rank, F.; Mercurio, A.M.; Wewer, U.M. A role for ADAM12 in breast tumor progression and stromal cell apoptosis. Cancer Res. 2005, 65, 4754–4761. [Google Scholar] [CrossRef] [PubMed] [Green Version]
- Pena, O.; Palumbo, A.; Gonzalez-Fernandez, R.; Hernandez, J.; Naftolin, F.; Avila, J. Expression of angiotensin II type 1 (AT1) and angiotensin II type 2 (AT2) receptors in human granulosa-lutein (GL) cells: Correlation with infertility diagnoses. Fertil. Steril. 2010, 93, 1601–1608. [Google Scholar] [CrossRef] [PubMed]
- Ciscato, F.; Sciacovelli, M.; Villano, G.; Turato, C.; Bernardi, P.; Rasola, A.; Pontisso, P. SERPINB3 protects from oxidative damage by chemotherapeutics through inhibition of mitochondrial respiratory complex. Oncotarget 2014, 5, 2418–2427. [Google Scholar] [CrossRef]
- Vidalino, L.; Doria, A.; Quarta, S.; Zen, M.; Gatta, A.; Pontisso, P. SERPINB3, apoptosis and autoimmunity. Autoimmun. Rev. 2009, 9, 108–112. [Google Scholar] [CrossRef] [PubMed]
- Noreen, S.; Akhtar, S.; Batool, T.; Gardner, Q.A.; Akhtar, M.W. Tubulin Beta 2C Chain (TBB2C), a Potential Marker of Ovarian Cancer, an Insight from Ovarian Cancer Proteome Profile. ACS Omega 2021, 6, 10506–10514. [Google Scholar] [CrossRef]
- Li, Y.; Huang, C.; Kavlashvili, T.; Fronk, A.; Zhang, Y.; Wei, Y.; Dai, D.; Devor, E.J.; Meng, X.; Thiel, K.W.; et al. Loss of progesterone receptor through epigenetic regulation is associated with poor prognosis in solid tumors. Am. J. Cancer Res. 2020, 10, 1827–1843. [Google Scholar]


| CTRL | LH | ||||||
|---|---|---|---|---|---|---|---|
| 2 h | 12 h | 24 h | 2 h | 12 h | 24 h | ||
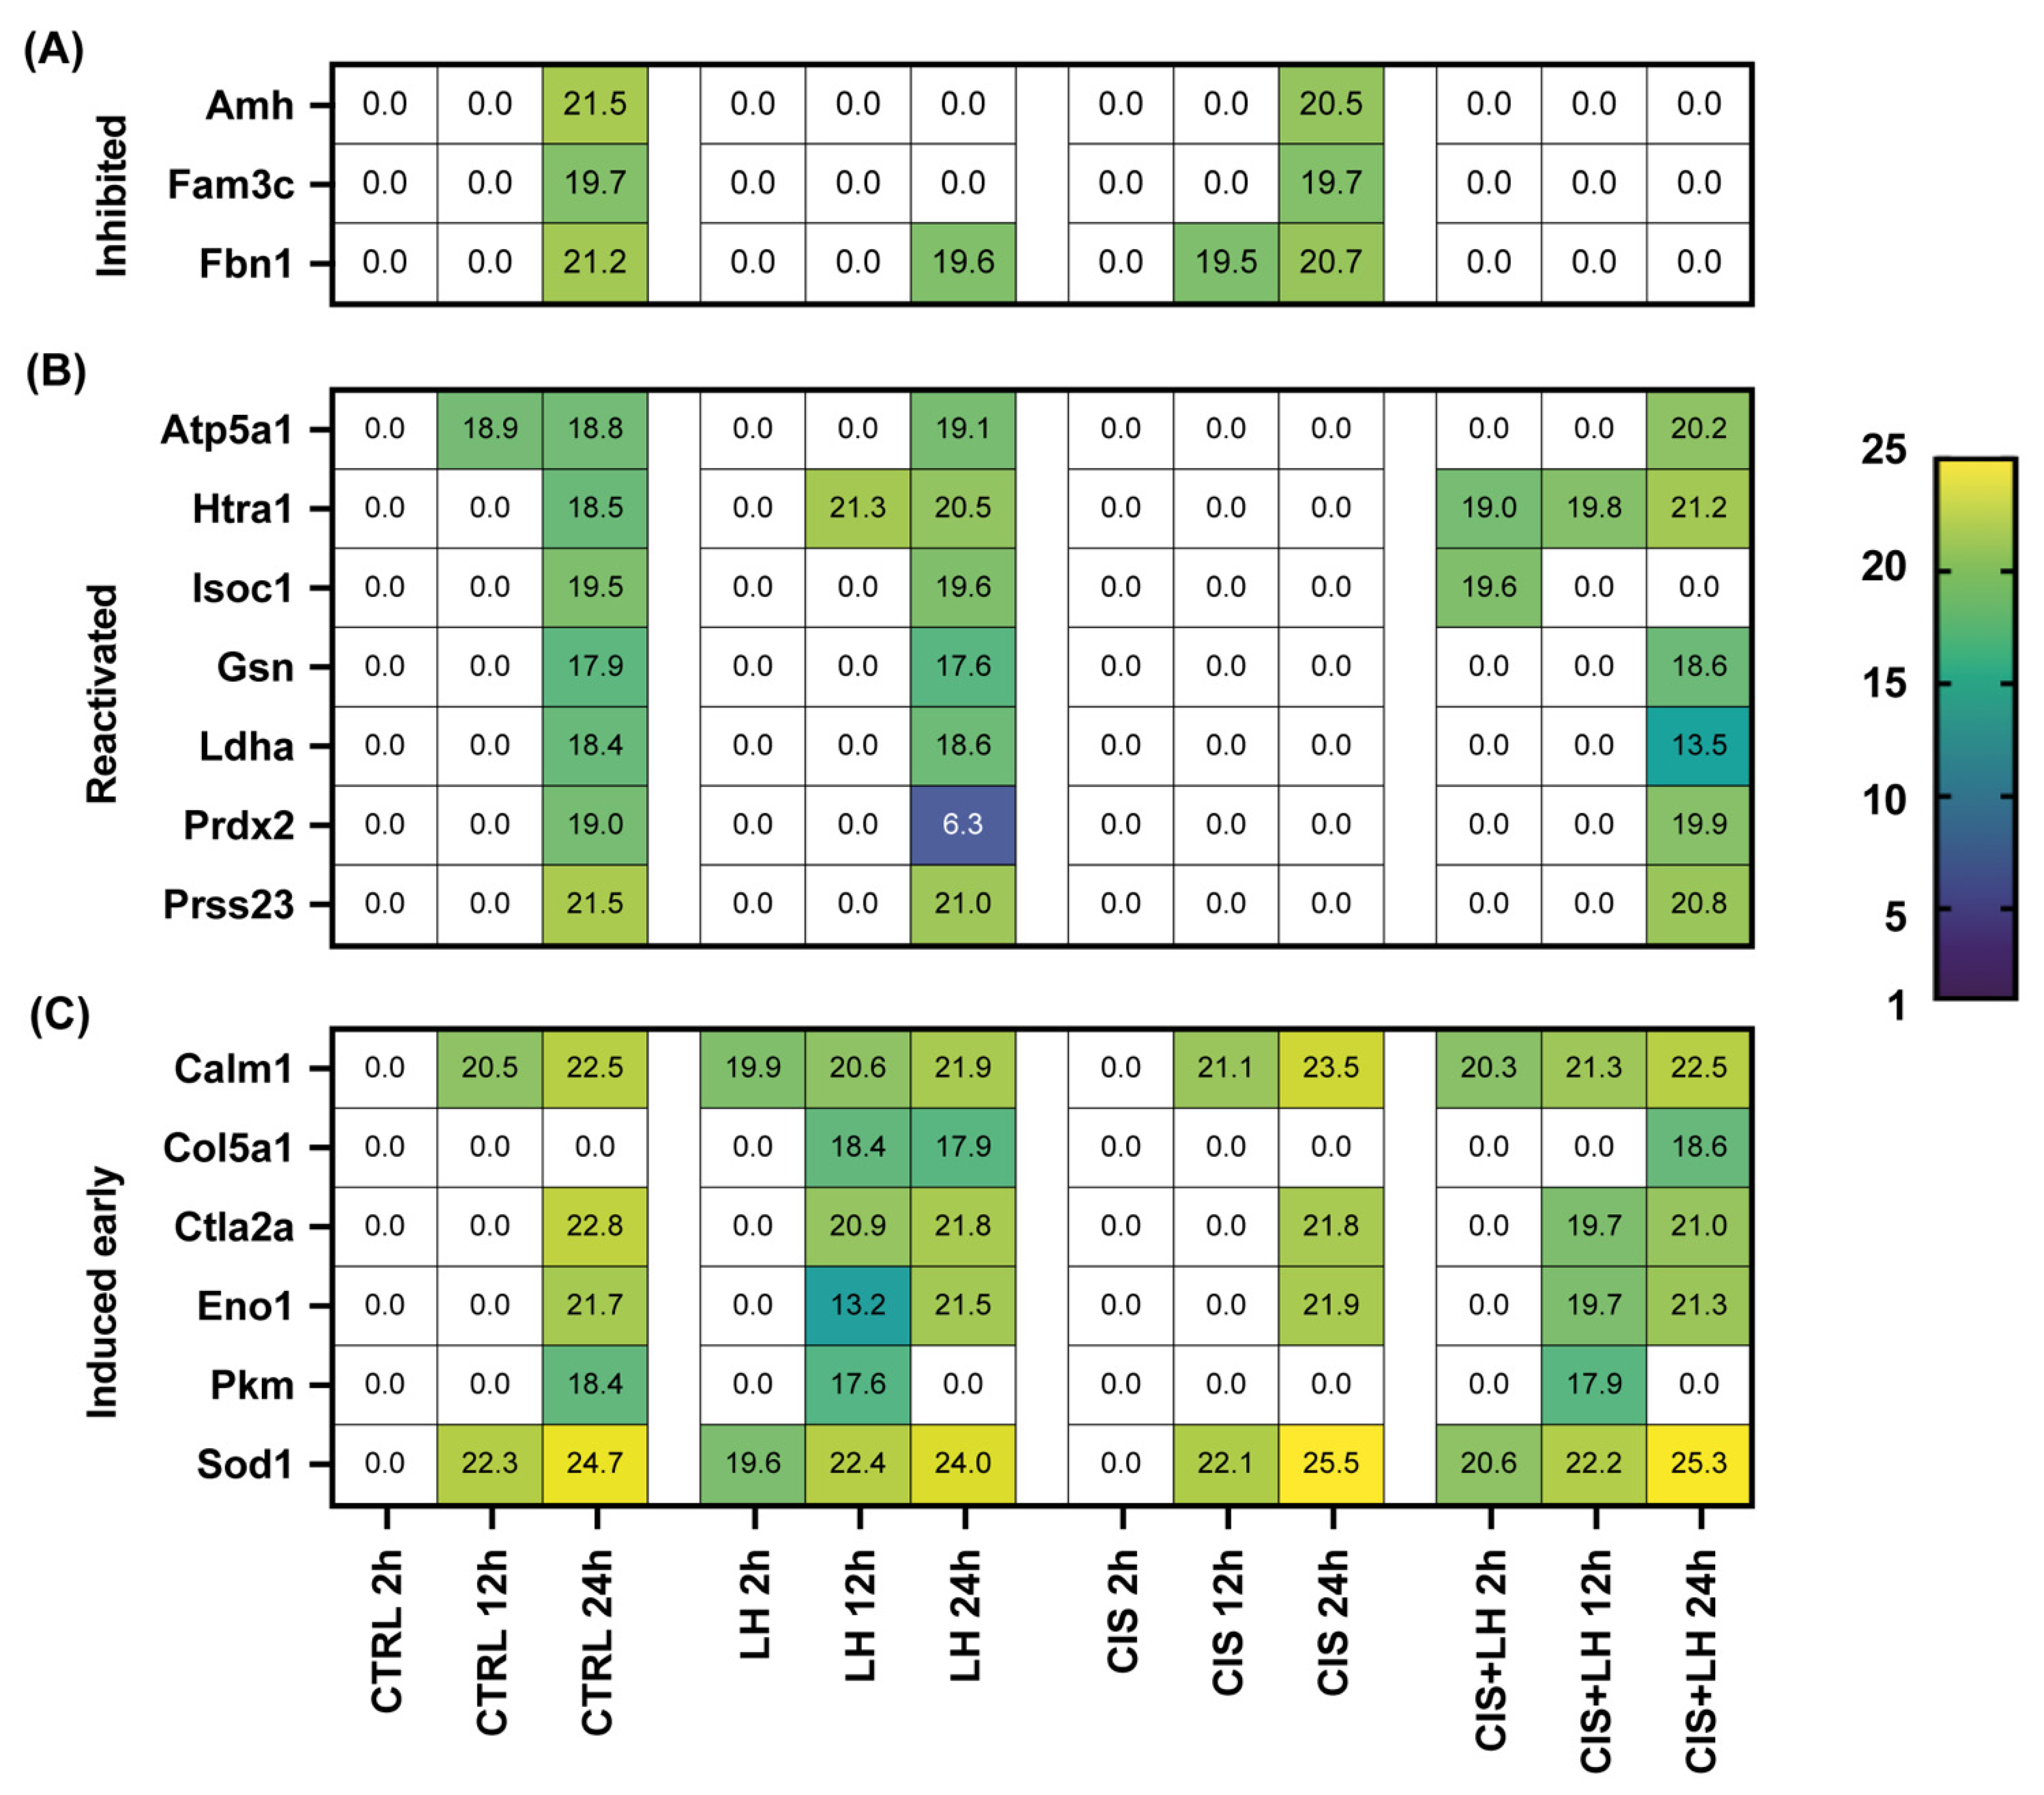
| Inhibited | Amh | 0 ± 0 | 0 ± 0 | 21.41 ± 0.76 | 0 ± 0 | 0 ± 0 | 0 ± 0 |
| Fam3c | 0 ± 0 | 0 ± 0 | 19.69 ± 0.48 | 0 ± 0 | 0 ± 0 | 0 ± 0 | |
| Fbn1 | 0 ± 0 | 0 ± 0 | 21.18 ± 0.69 | 0 ± 0 | 0 ± 0 | 19.65 ± 0.88 | |
| Reactivated | Atp5a1 | 0 ± 0 | 18.94 ± 1.59 | 18.84 ± 1.55 | 0 ± 0 | 0 ± 0 | 19.01 ± 1.96 |
| Htra1 | 0 ± 0 | 0 ± 0 | 18.48 ± 0.86 | 0 ± 0 | 21.03 ± 0.31 | 20.47 ± 1.98 | |
| Isoc1 | 0 ± 0 | 0 ± 0 | 19.05 ± 0.25 | 0 ± 0 | 0 ± 0 | 19.62 ± 0.96 | |
| Gsn | 0 ± 0 | 0 ± 0 | 17.94 ± 0.98 | 0 ± 0 | 0 ± 0 | 17.58 ± 0.51 | |
| Ldha | 0 ± 0 | 0 ± 0 | 18.37 ± 0.02 | 0 ± 0 | 0 ± 0 | 18.63 ± 0.68 | |
| Prdx2 | 0 ± 0 | 0 ± 0 | 18.99 ± 0.81 | 0 ± 0 | 0 ± 0 | 6.25 ± 0.0 | |
| Prss23 | 0 ± 0 | 0 ± 0 | 21.53 ± 0.18 | 0 ± 0 | 0 ± 0 | 20.98 ± 0.88 | |
| Induced early | Calm1 | 0 ± 0 | 20.53 ± 0.33 | 22.48 ± 1.16 | 19.89 ± 0.20 | 20.56 ± 0.57 | 21.81 ± 0.80 |
| Col5a1 | 0 ± 0 | 0 ± 0 | 0 ± 0 | 0 ± 0 | 18.39 ± 0.25 | 17.90 ± 1.08 | |
| Ctla2a | 0 ± 0 | 0 ± 0 | 22.84 ± 0.47 | 0 ± 0 | 20.87 ± 0.25 | 21.84 ± 0.63 | |
| Eno1 | 0 ± 0 | 0 ± 0 | 21.69 ± 0.58 | 0 ± 0 | 13.24 ± 0.13 | 21.52 ± 0.19 | |
| Pkm | 0 ± 0 | 0 ± 0 | 18.39 ± 0.75 | 0 ± 0 | 17.63 ± 0.61 | 0 ± 0 | |
| Sod1 | 0 ± 0 | 22.03 ± 1.53 | 24.68 ± 0.96 | 19.63 ± 0.32 | 22.40 ± 1.07 | 23.99 ± 1.44 | |
| CIS | CIS + LH | ||||||
|---|---|---|---|---|---|---|---|
| 2 h | 12 h | 24 h | 2 h | 12 h | 24 h | ||
| Inhibited | Amh | 0 ± 0 | 0 ± 0 | 20.52 ± 0.77 | 0 ± 0 | 0 ± 0 | 0 ± 0 |
| Fam3c | 0 ± 0 | 0 ± 0 | 19.69 ± 0.68 | 0 ± 0 | 0 ± 0 | 0 ± 0 | |
| Fbn1 | 0 ± 0 | 19.50 ± 1.39 | 20.70 ± 1.06 | 0 ± 0 | 0 ± 0 | 0 ± 0 | |
| Reactivated | Atp5a1 | 0 ± 0 | 0 ± 0 | 0 ± 0 | 0 ± 0 | 0 ± 0 | 20.11 ± 0.48 |
| Htra1 | 0 ± 0 | 0 ± 0 | 0 ± 0 | 18.98 ± 1.62 | 19.71 ± 2.97 | 21.15 ± 0.60 | |
| Isoc1 | 0 ± 0 | 0 ± 0 | 0 ± 0 | 19.63 ± 0.06 | 0 ± 0 | 0 ± 0 | |
| Gsn | 0 ± 0 | 0 ± 0 | 0 ± 0 | 0 ± 0 | 0 ± 0 | 18.59 ± 1.93 | |
| Ldha | 0 ± 0 | 0 ± 0 | 0 ± 0 | 0 ± 0 | 0 ± 0 | 13.45 ± 0.03 | |
| Prdx2 | 0 ± 0 | 0 ± 0 | 0 ± 0 | 0 ± 0 | 0 ± 0 | 19.81 ± 0.76 | |
| Prss23 | 0 ± 0 | 0 ± 0 | 0 ± 0 | 0 ± 0 | 0 ± 0 | 20.80 ± 0.30 | |
| Induced early | Calm1 | 0 ± 0 | 21.11 ± 1.33 | 23.46 ± 0.30 | 20.28 ± 0.47 | 21.30 ± 1.32 | 22.44 ± 0.77 |
| Col5a1 | 0 ± 0 | 0 ± 0 | 0 ± 0 | 0 ± 0 | 0 ± 0 | 18.60 ± 0.48 | |
| Ctla2a | 0 ± 0 | 0 ± 0 | 21.78 ± 0.72 | 0 ± 0 | 19.75 ± 2.01 | 20.98 ± 1.62 | |
| Eno1 | 0 ± 0 | 0 ± 0 | 21.86 ± 0.43 | 0 ± 0 | 19.70 ± 1.37 | 21.26 ± 1.02 | |
| Pkm | 0 ± 0 | 0 ± 0 | 18.39 ± 0.75 | 0 ± 0 | 17.63 ± 0.61 | 0 ± 0 | |
| Sod1 | 0 ± 0 | 22.03 ± 1.53 | 24.68 ± 0.96 | 19.63 ± 0.32 | 22.40 ± 1.07 | 23.99 ± 1.44 | |
Publisher’s Note: MDPI stays neutral with regard to jurisdictional claims in published maps and institutional affiliations. |
© 2022 by the authors. Licensee MDPI, Basel, Switzerland. This article is an open access article distributed under the terms and conditions of the Creative Commons Attribution (CC BY) license (https://creativecommons.org/licenses/by/4.0/).
Share and Cite
Marcozzi, S.; Ciccosanti, F.; Fimia, G.M.; Piacentini, M.; Caggiano, C.; Sette, C.; De Felici, M.; Klinger, F.G. Analysis of Secreted Proteins from Prepubertal Ovarian Tissues Exposed In Vitro to Cisplatin and LH. Cells 2022, 11, 1208. https://doi.org/10.3390/cells11071208
Marcozzi S, Ciccosanti F, Fimia GM, Piacentini M, Caggiano C, Sette C, De Felici M, Klinger FG. Analysis of Secreted Proteins from Prepubertal Ovarian Tissues Exposed In Vitro to Cisplatin and LH. Cells. 2022; 11(7):1208. https://doi.org/10.3390/cells11071208
Chicago/Turabian StyleMarcozzi, Serena, Fabiola Ciccosanti, Gian Maria Fimia, Mauro Piacentini, Cinzia Caggiano, Claudio Sette, Massimo De Felici, and Francesca Gioia Klinger. 2022. "Analysis of Secreted Proteins from Prepubertal Ovarian Tissues Exposed In Vitro to Cisplatin and LH" Cells 11, no. 7: 1208. https://doi.org/10.3390/cells11071208
APA StyleMarcozzi, S., Ciccosanti, F., Fimia, G. M., Piacentini, M., Caggiano, C., Sette, C., De Felici, M., & Klinger, F. G. (2022). Analysis of Secreted Proteins from Prepubertal Ovarian Tissues Exposed In Vitro to Cisplatin and LH. Cells, 11(7), 1208. https://doi.org/10.3390/cells11071208