
Mass Cytometric Analysis of Early-Stage Mycosis Fungoides


 and
and 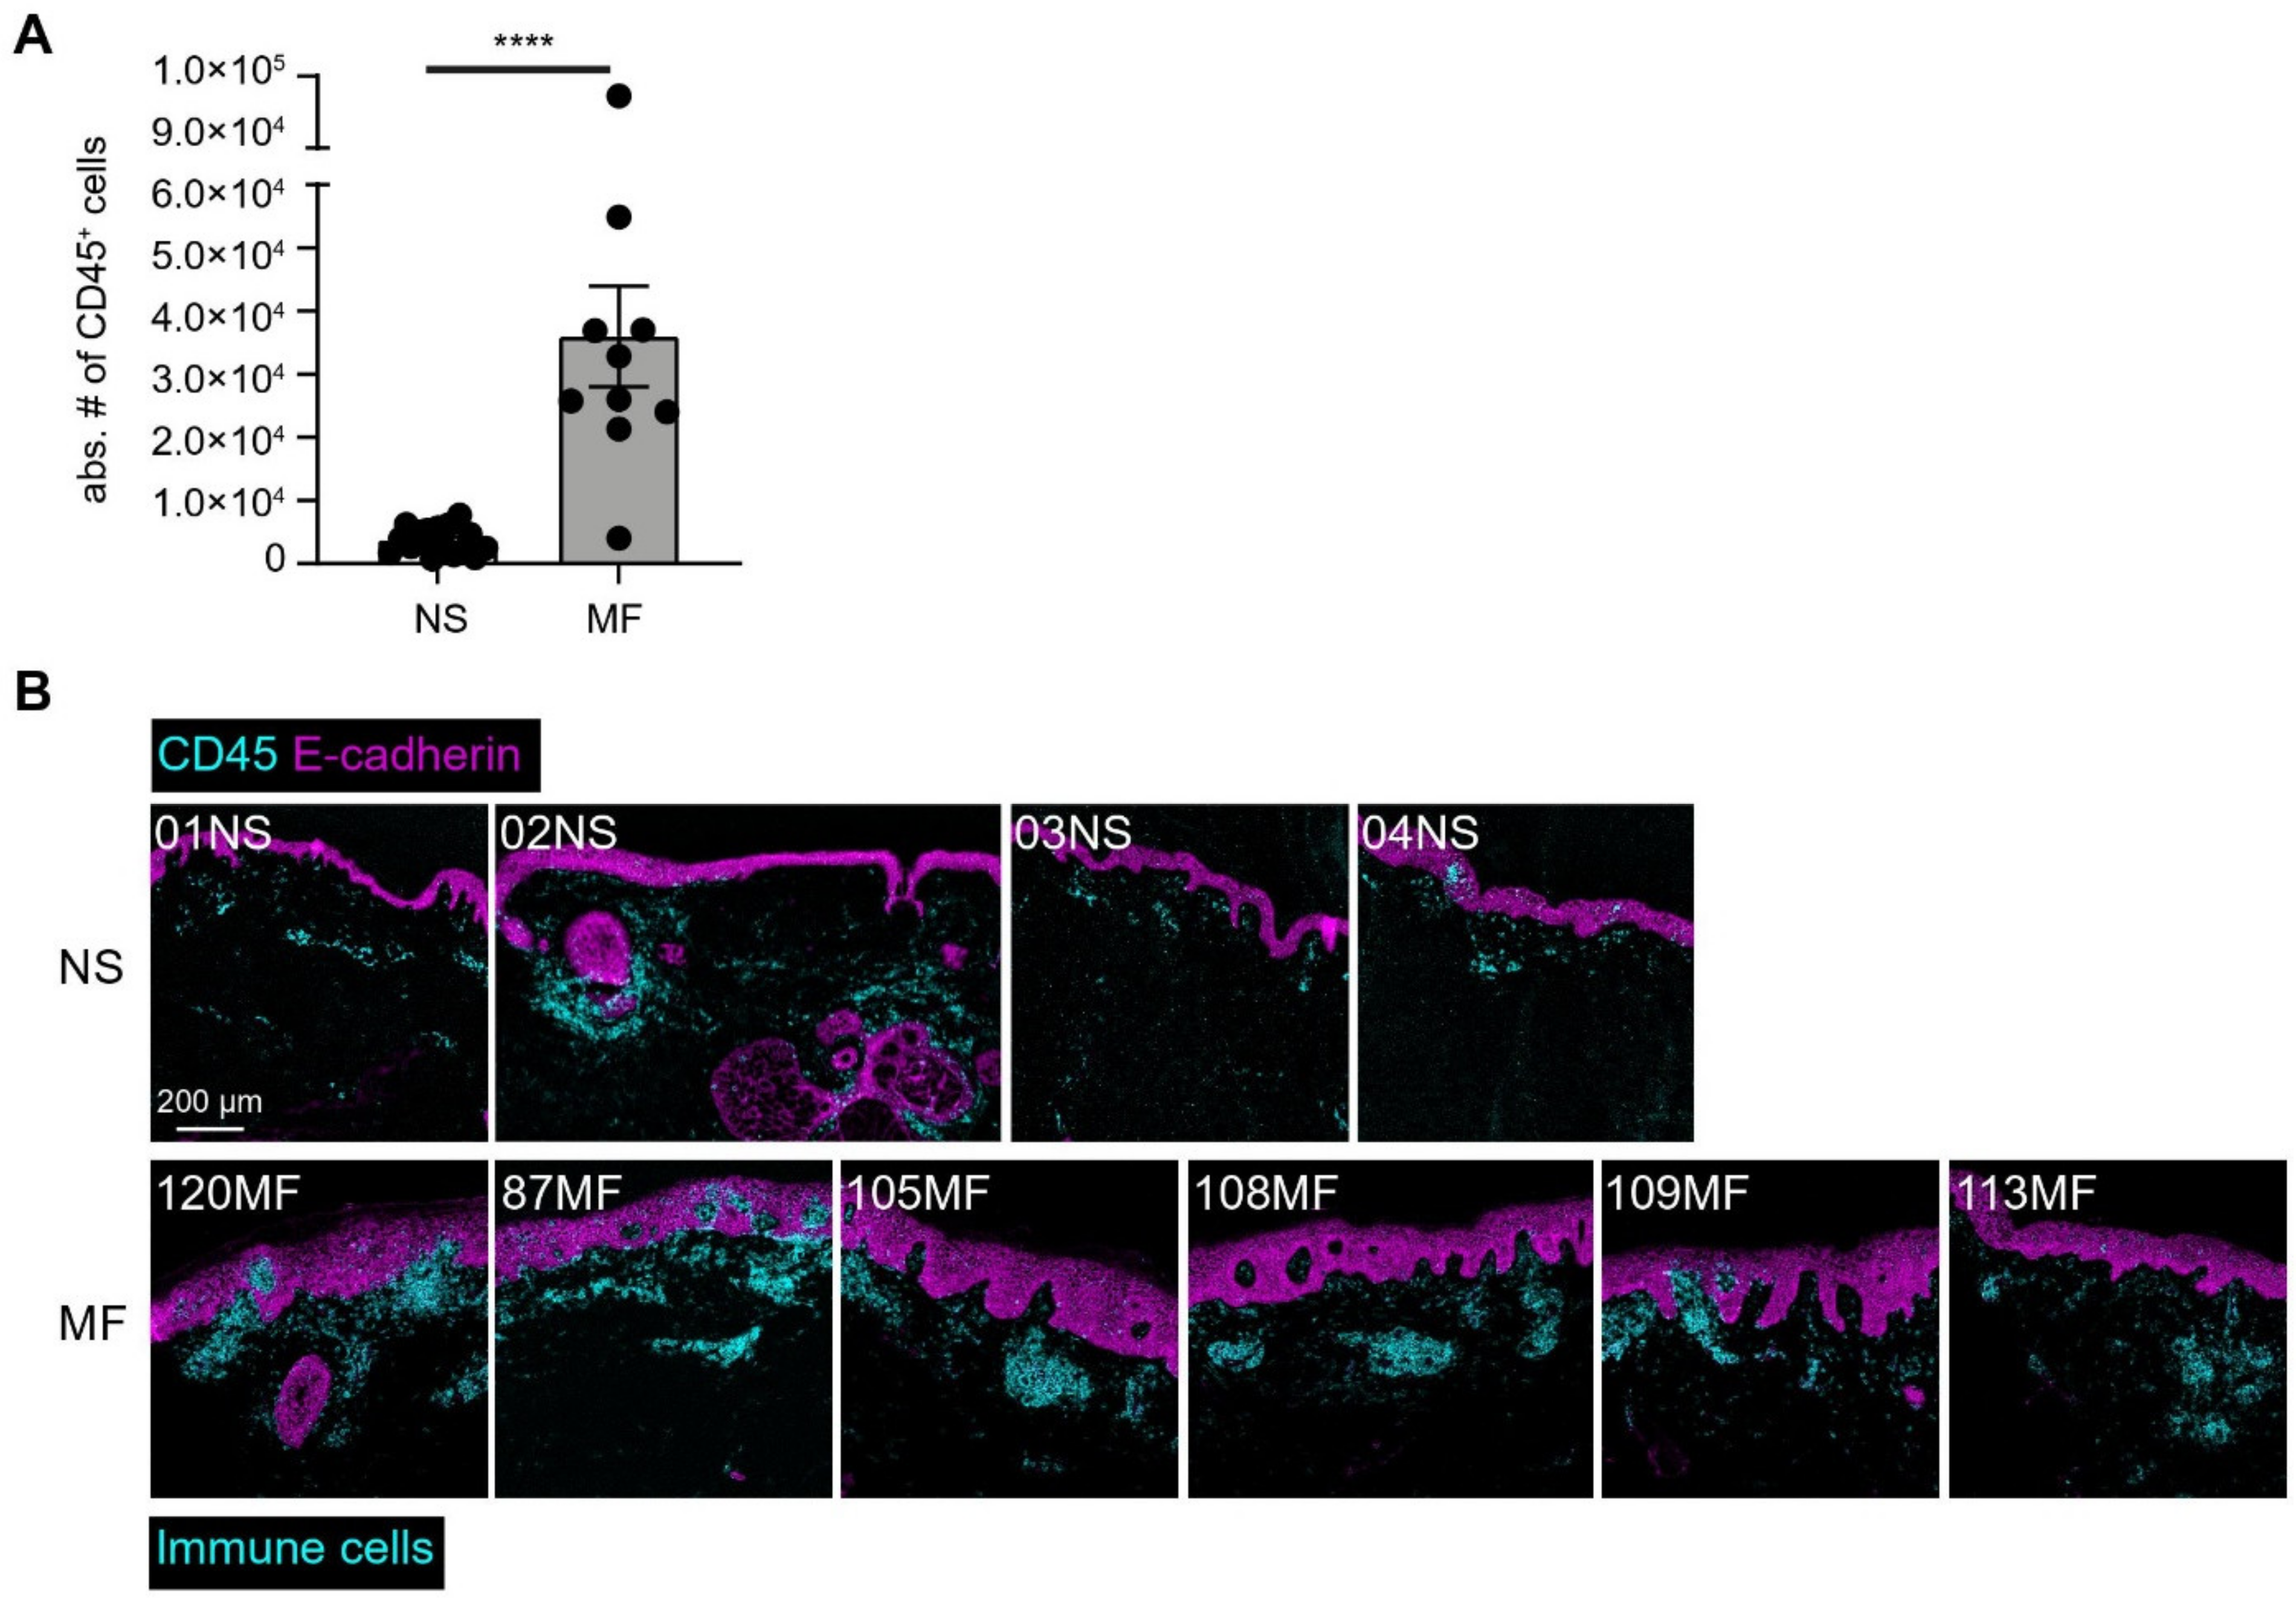
Abstract
1. Introduction
2. Material and Methods
2.1. Patient Selection
2.2. Skin Biopsy Processing
2.3. Suspension Mass Cytometry Antibody Staining and Data Acquisition
2.4. Imaging Mass Cytometry Staining and Data Acquisition
2.5. Data Analysis
3. Results
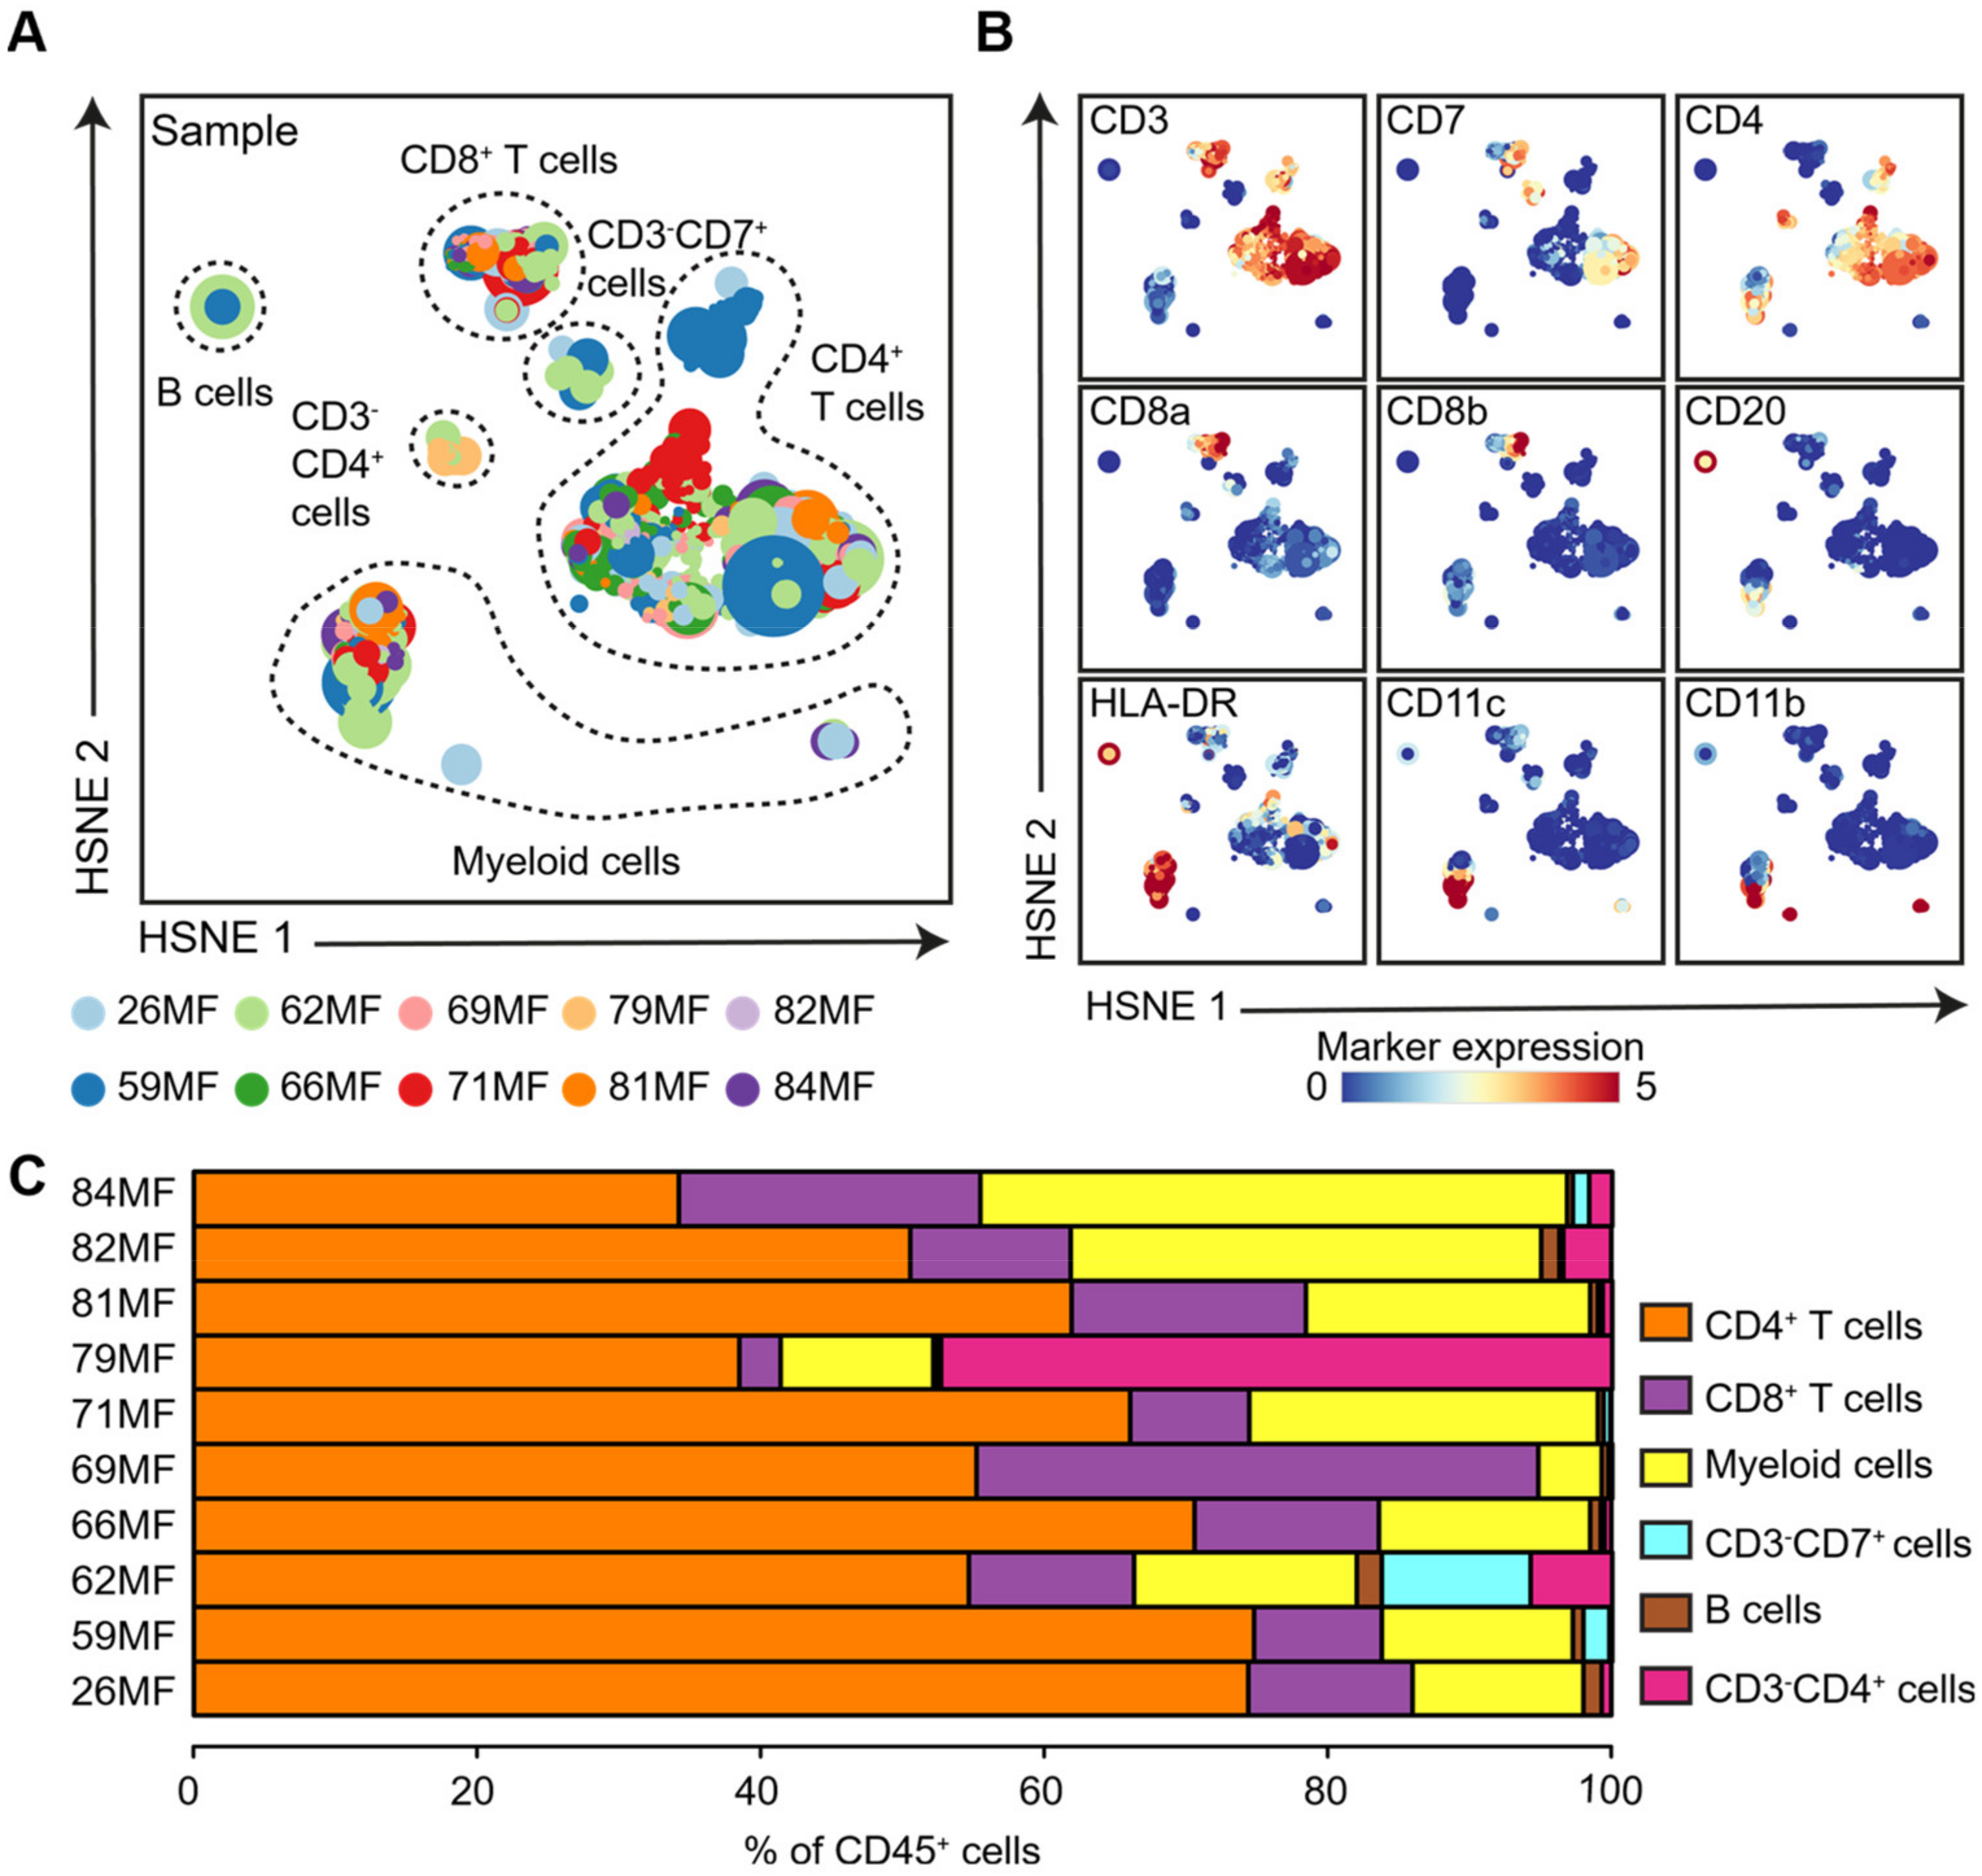
3.1. Identification of Major Immune Lineages
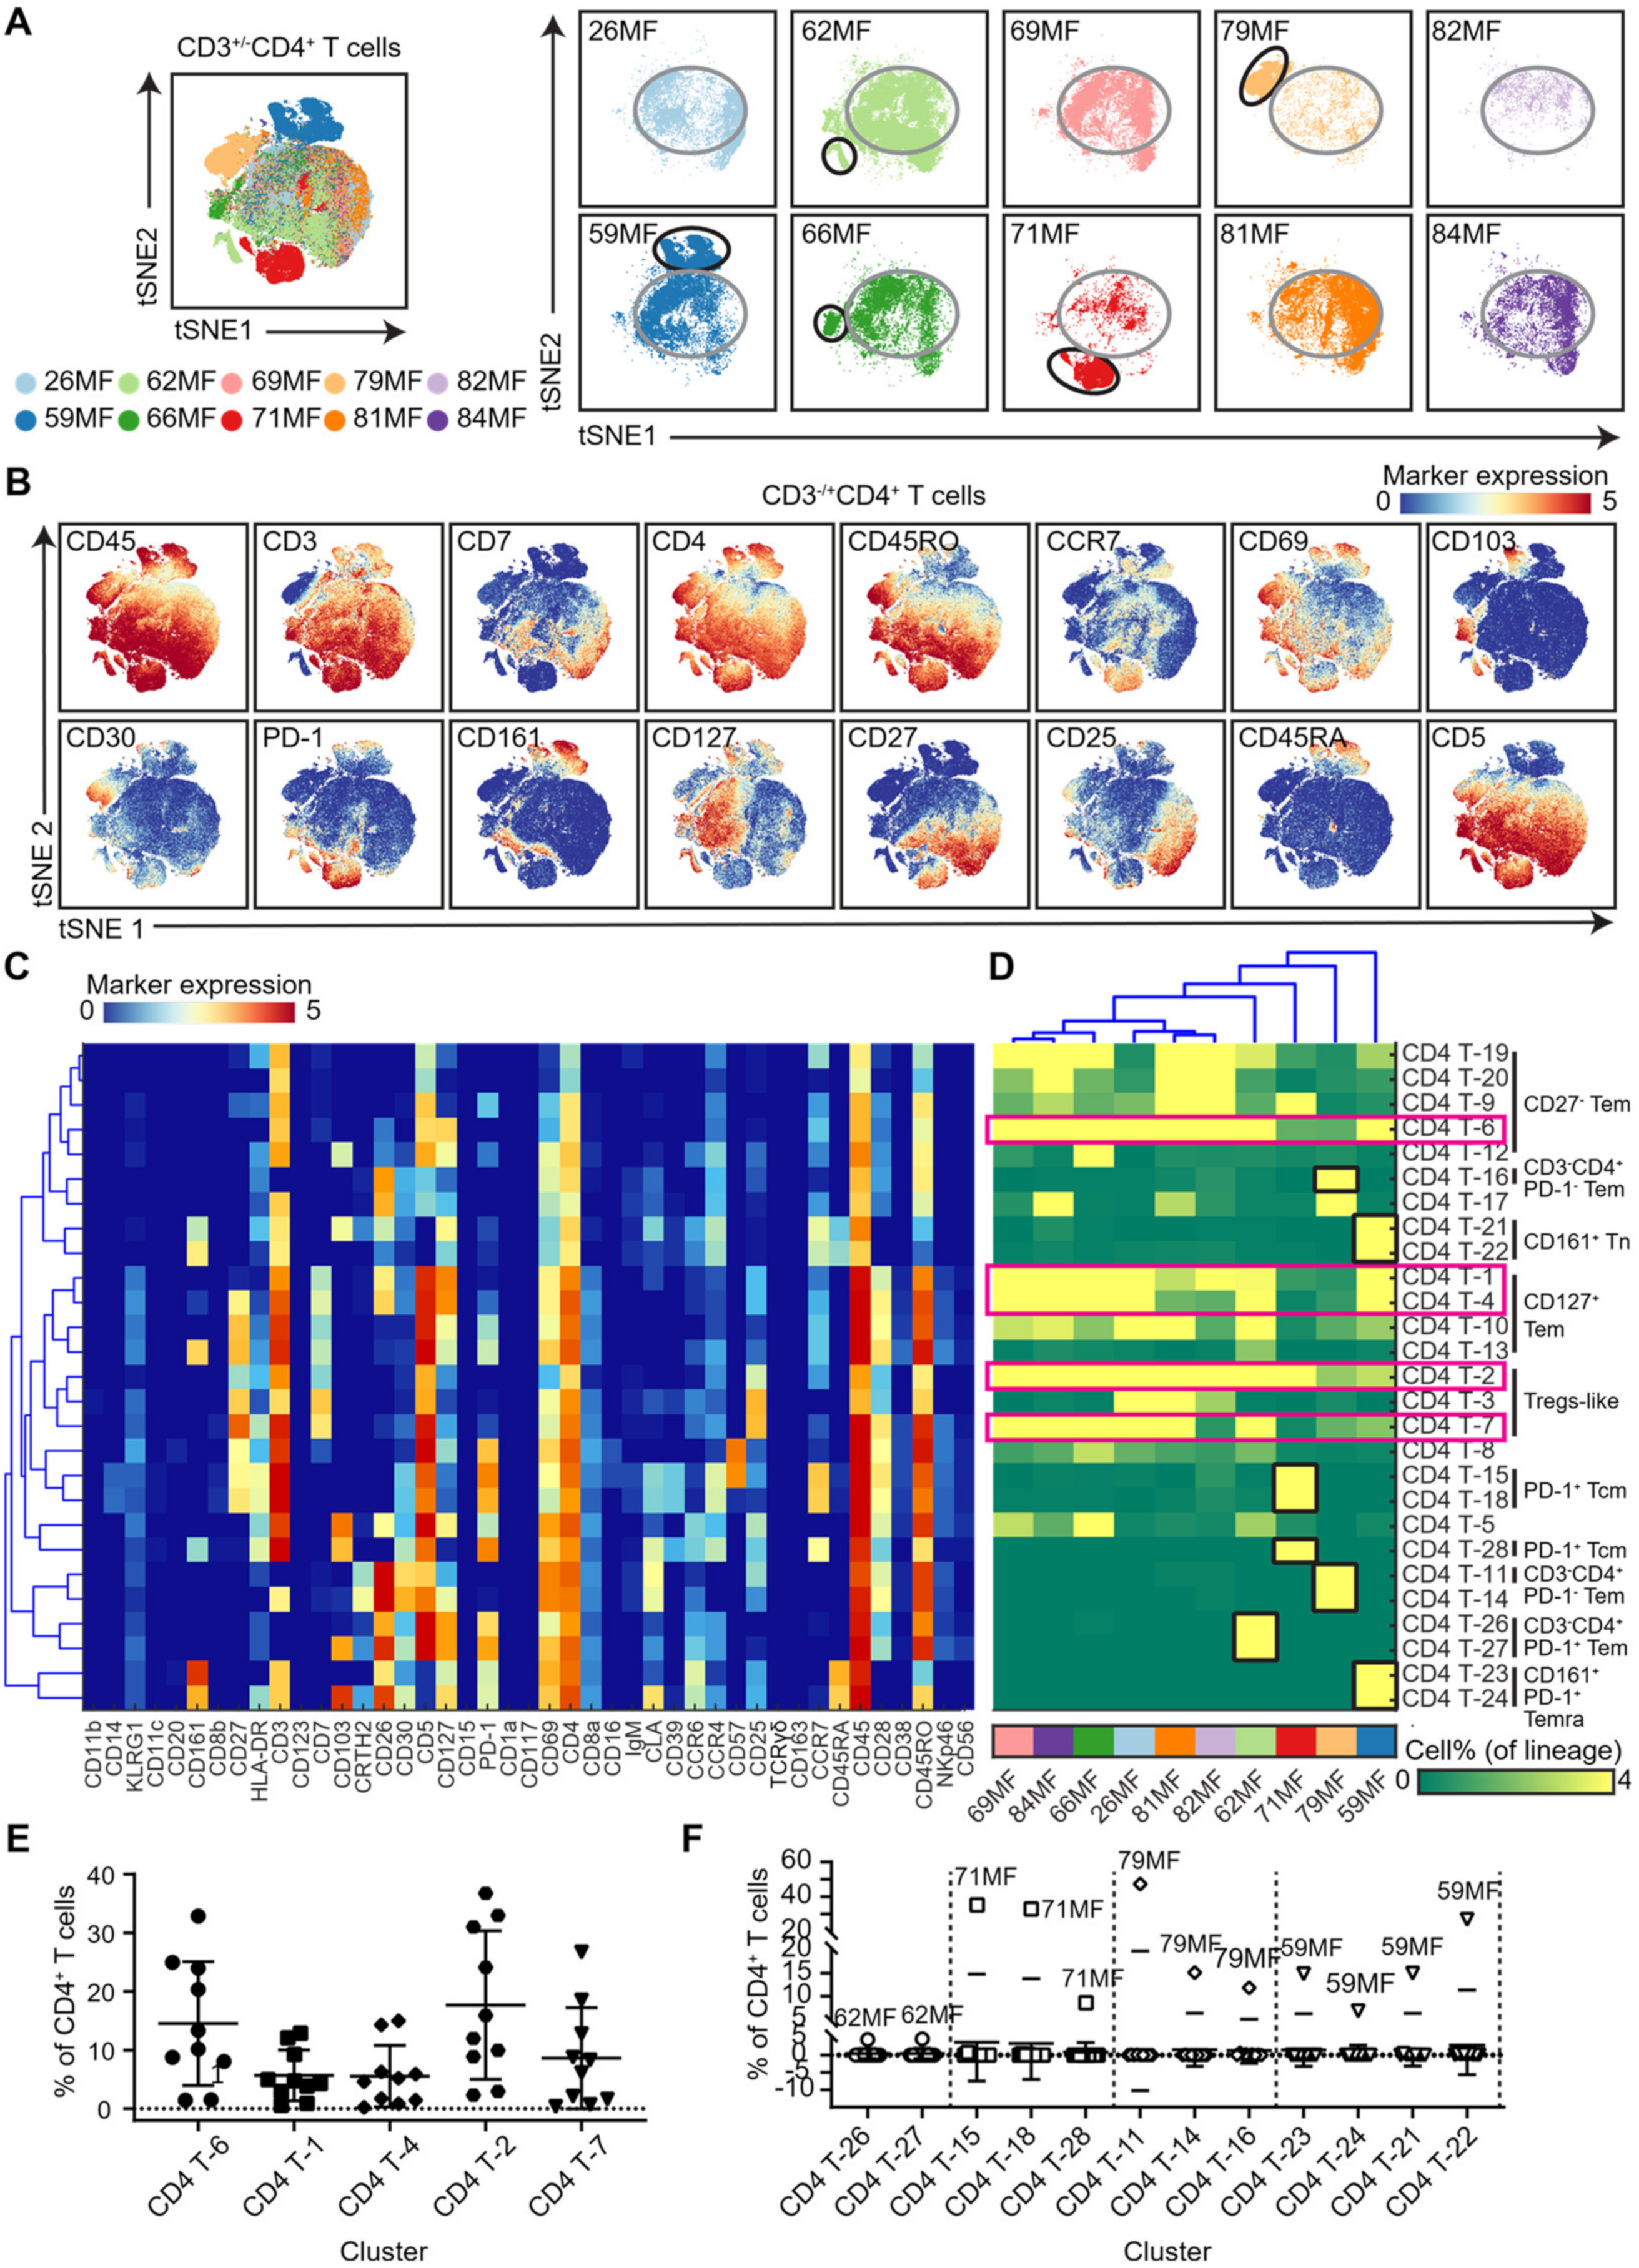
3.2. Analysis of the CD4 T-Cell Compartment Revealed Shared and Patient-Unique Features
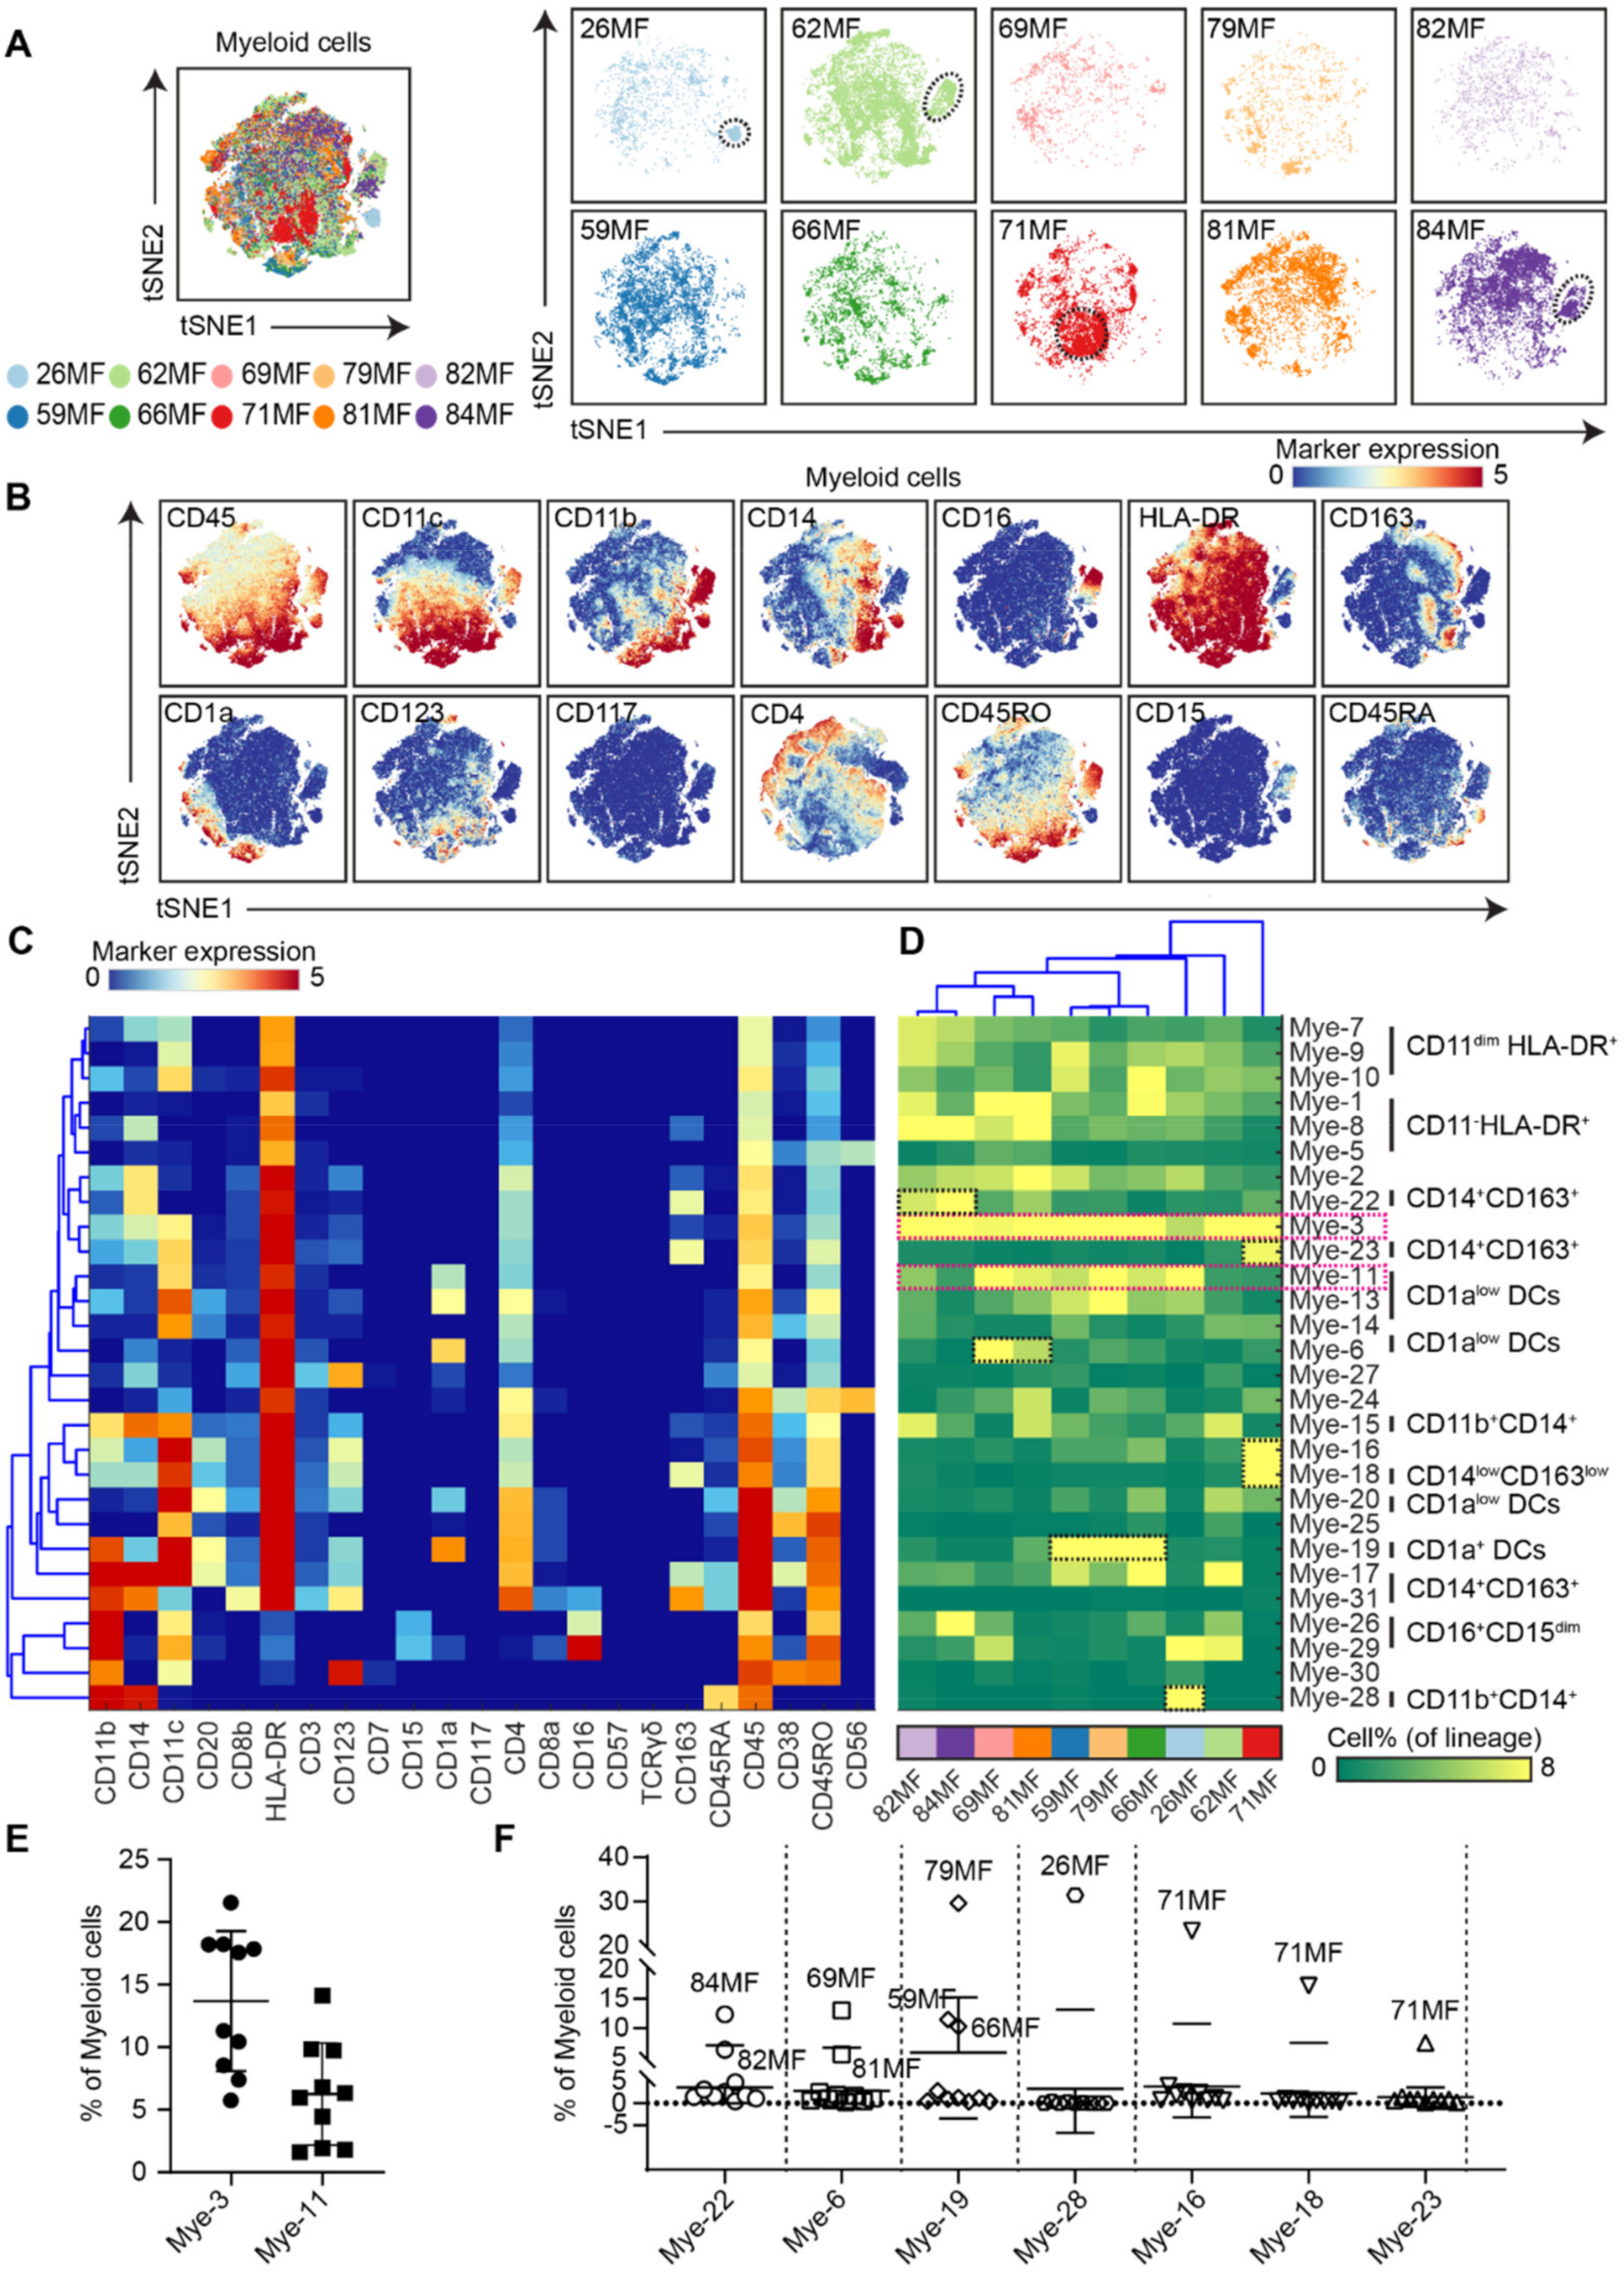
3.3. Analysis of the Myeloid Compartment Revealed Shared and Patient-Unique Features
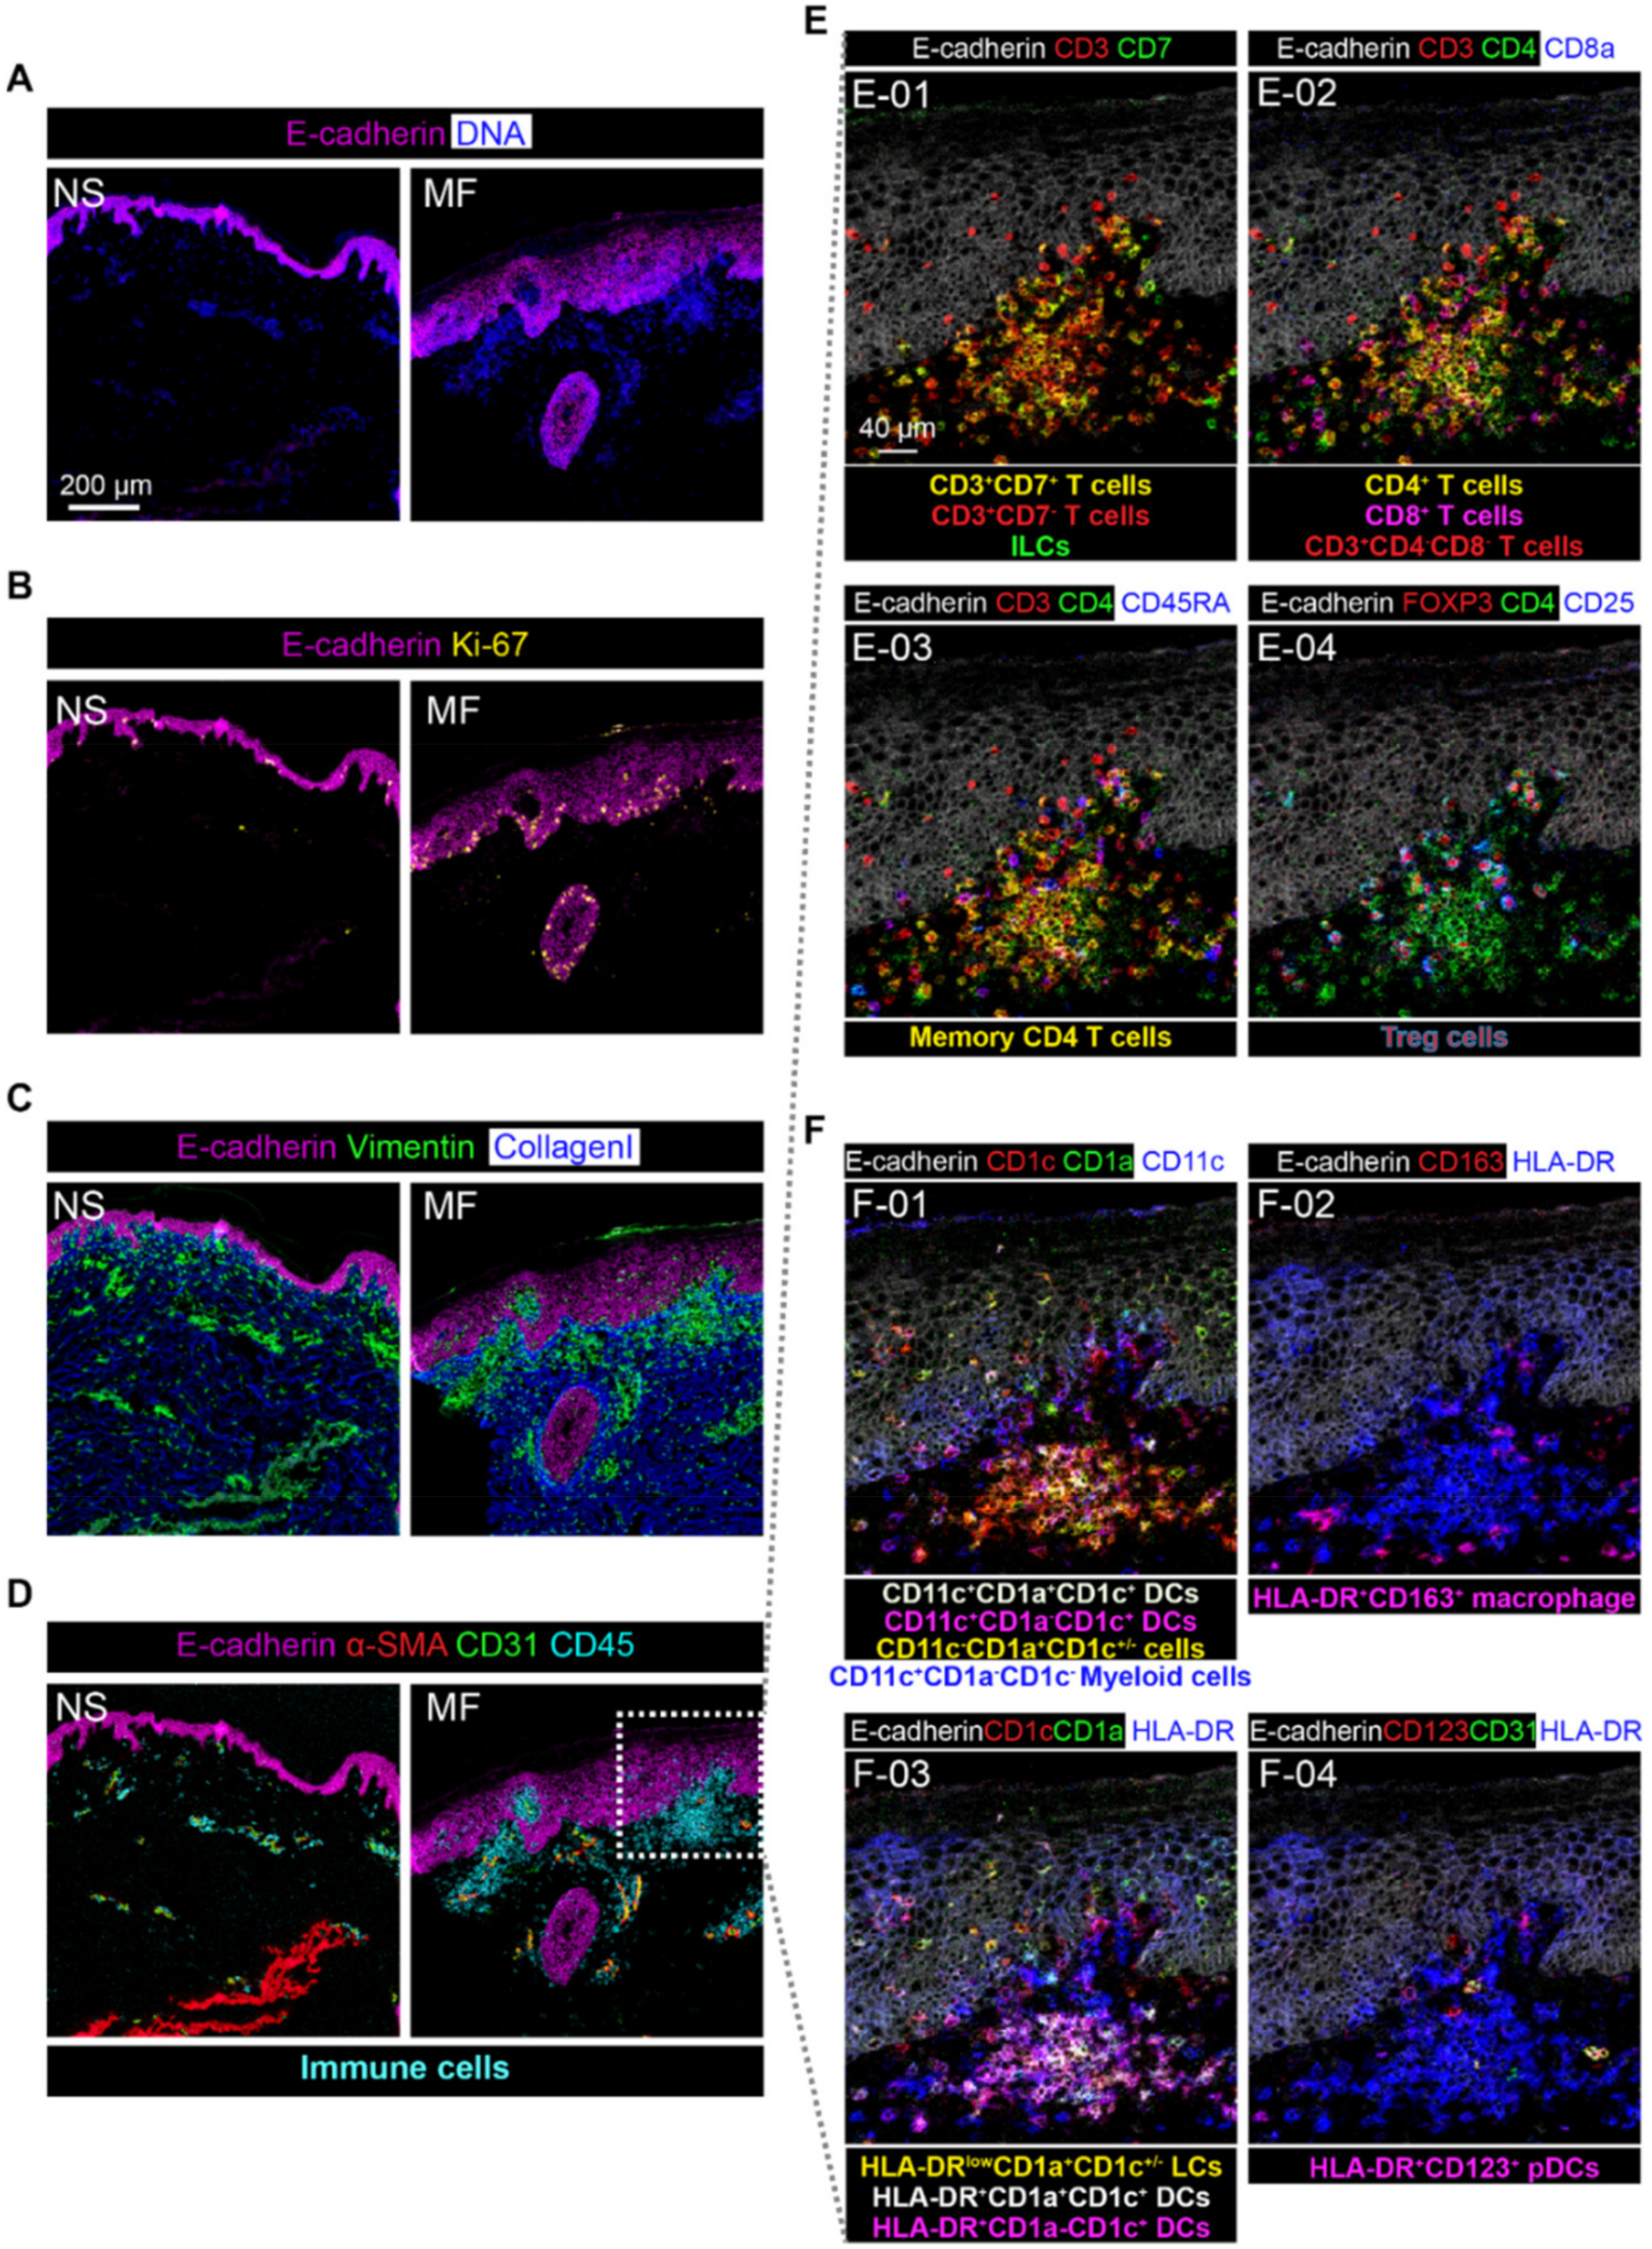
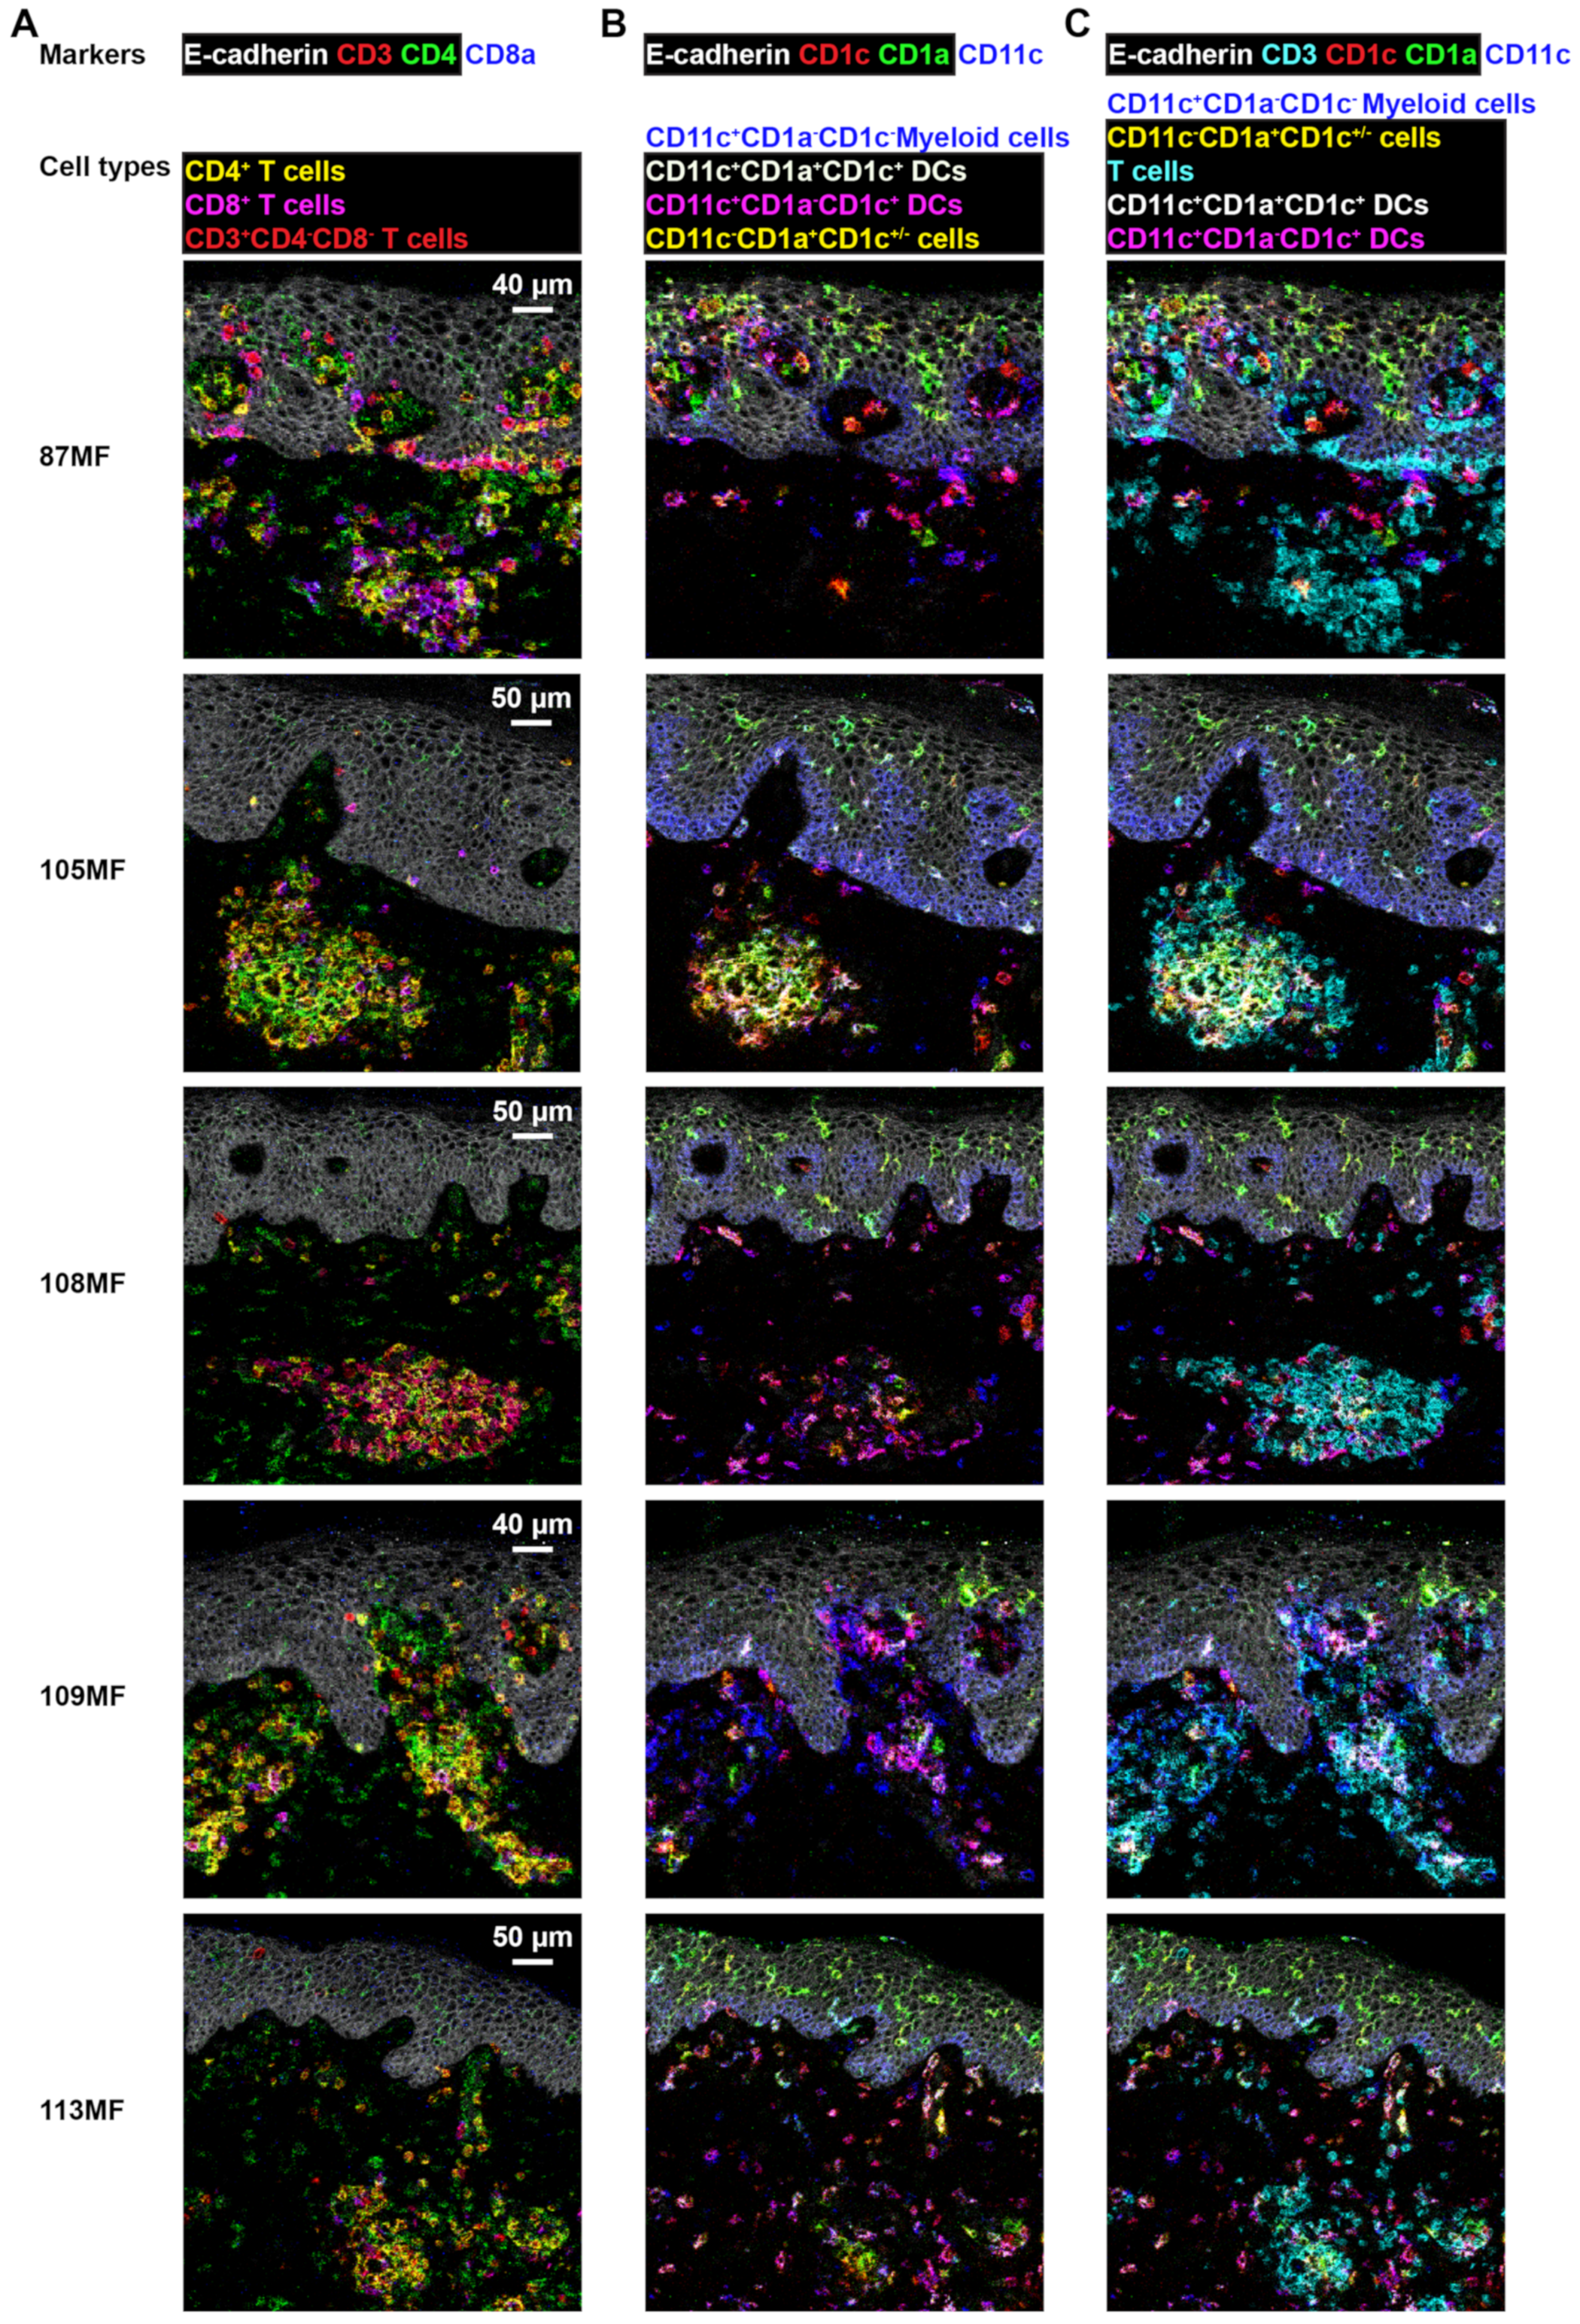
3.4. Imaging Mass Cytometry Revealed Spatial Signatures In Situ
4. Discussion
Supplementary Materials
Author Contributions
Funding
Institutional Review Board Statement
Informed Consent Statement
Data Availability Statement
Acknowledgments
Conflicts of Interest
References
- Willemze, R.; Jaffe, E.S.; Burg, G.; Cerroni, L.; Berti, E.; Swerdlow, S.H.; Ralfkiaer, E.; Chimenti, S.; Diaz-Perez, J.L.; Duncan, L.M.; et al. WHO-EORTC classification for cutaneous lymphomas. Blood 2005, 105, 3768–3785. [Google Scholar] [CrossRef] [PubMed]
- Willemze, R.; Cerroni, L.; Kempf, W.; Berti, E.; Facchetti, F.; Swerdlow, S.H.; Jaffe, E.S. The 2018 update of the WHO-EORTC classification for primary cutaneous lymphomas. Blood 2019, 133, 1703–1714. [Google Scholar] [CrossRef] [PubMed]
- Reddy, K.; Bhawan, J. Histologic mimickers of mycosis fungoides: A review. J. Cutan. Pathol. 2007, 34, 519–525. [Google Scholar] [CrossRef] [PubMed]
- Chiba, T.; Nagai, T.; Osada, S.I.; Manabe, M. Diagnosis of Mycosis Fungoides Following Administration of Dupilumab for Misdiagnosed Atopic Dermatitis. Acta Derm.-Venereol. 2019, 99, 818–819. [Google Scholar] [CrossRef] [PubMed]
- Massone, C.; Kodama, K.; Kerl, H.; Cerroni, L. Histopathologic features of early (patch) lesions of mycosis fungoides: A morphologic study on 745 biopsy specimens from 427 patients. Am. J. Surg. Pathol. 2005, 29, 550–560. [Google Scholar] [CrossRef] [PubMed]
- Berger, C.; Hanlon, D.; Kanada, D.; Dhodapkar, M.; Lombillo, V.; Wang, N.; Christensen, I.; Howe, G.; Crouch, J.; El-Fishawy, P.; et al. The growth of cutaneous T-cell lymphoma is stimulated by immature dendritic cells. Blood 2002, 99, 2929–2939. [Google Scholar] [CrossRef]
- Berger, C.L.; Tigelaar, R.; Cohen, J.; Mariwalla, K.; Trinh, J.; Wang, N.; Edelson, R.L. Cutaneous T-cell lymphoma: Malignant proliferation of T-regulatory cells. Blood 2005, 105, 1640–1647. [Google Scholar] [CrossRef]
- Gaydosik, A.M.; Tabib, T.; Geskin, L.J.; Bayan, C.A.; Conway, J.F.; Lafyatis, R.; Fuschiotti, P. Single-Cell Lymphocyte Heterogeneity in Advanced Cutaneous T-cell Lymphoma Skin Tumors. Clin. Cancer Res. 2019, 25, 4443–4454. [Google Scholar] [CrossRef]
- Li, N.; van Unen, V.; Guo, N.; Abdelaal, T.; Somarakis, A.; Eggermont, J.; Mahfouz, A.; Chuva de Sousa Lopes, S.M.; Lelieveldt, B.P.F.; Koning, F. Early-Life Compartmentalization of Immune Cells in Human Fetal Tissues Revealed by High-Dimensional Mass Cytometry. Front. Immunol. 2019, 10, 1932. [Google Scholar] [CrossRef]
- Li, N.; van Unen, V.; Hollt, T.; Thompson, A.; van Bergen, J.; Pezzotti, N.; Eisemann, E.; Vilanova, A.; Chuva de Sousa Lopes, S.M.; Lelieveldt, B.P.F.; et al. Mass cytometry reveals innate lymphoid cell differentiation pathways in the human fetal intestine. J. Exp. Med. 2018, 215, 1383–1396. [Google Scholar] [CrossRef]
- De Vries, N.L.; van Unen, V.; Ijsselsteijn, M.E.; Abdelaal, T.; van der Breggen, R.; Sarasqueta, A.F.; Mahfouz, A.; Peeters, K.C.M.J.; Hollt, T.; Lelieveldt, B.P.F.; et al. High-dimensional cytometric analysis of colorectal cancer reveals novel mediators of antitumour immunity. Gut 2020, 69, 691–703. [Google Scholar] [CrossRef] [PubMed]
- Havel, J.J.; Chowell, D.; Chan, T.A. The evolving landscape of biomarkers for checkpoint inhibitor immunotherapy. Nat. Rev. Cancer 2019, 19, 133–150. [Google Scholar] [CrossRef] [PubMed]
- Bandura, D.R.; Baranov, V.I.; Ornatsky, O.I.; Antonov, A.; Kinach, R.; Lou, X.; Pavlov, S.; Vorobiev, S.; Dick, J.E.; Tanner, S.D. Mass cytometry: Technique for real time single cell multitarget immunoassay based on inductively coupled plasma time-of-flight mass spectrometry. Anal. Chem. 2009, 81, 6813–6822. [Google Scholar] [CrossRef]
- Chang, Q.; Ornatsky, O.I.; Siddiqui, I.; Loboda, A.; Baranov, V.I.; Hedley, D.W. Imaging Mass Cytometry. Cytom. A 2017, 91, 160–169. [Google Scholar] [CrossRef] [PubMed]
- Hollt, T.; Pezzotti, N.; van Unen, V.; Koning, F.; Eisemann, E.; Lelieveldt, B.; Vilanova, A. Cytosplore: Interactive Immune Cell Phenotyping for Large Single-Cell Datasets. Comput. Graph. Forum 2016, 35, 171–180. [Google Scholar] [CrossRef]
- Van Unen, V.; Hollt, T.; Pezzotti, N.; Li, N.; Reinders, M.J.T.; Eisemann, E.; Koning, F.; Vilanova, A.; Lelieveldt, B.P.F. Visual analysis of mass cytometry data by hierarchical stochastic neighbour embedding reveals rare cell types. Nat. Commun. 2017, 8, 1740. [Google Scholar] [CrossRef]
- Wang, Y.J.; Traum, D.; Schug, J.; Gao, L.; Liu, C.; HPAP Consortium; Atkinson, M.A.; Powers, A.C.; Feldman, M.D.; Naji, A.; et al. Multiplexed In Situ Imaging Mass Cytometry Analysis of the Human Endocrine Pancreas and Immune System in Type 1 Diabetes. Cell Metab. 2019, 29, 769–783. [Google Scholar] [CrossRef]
- Jackson, H.W.; Fischer, J.R.; Zanotelli, V.R.T.; Ali, H.R.; Mechera, R.; Soysal, S.D.; Moch, H.; Muenst, S.; Varga, Z.; Weber, W.P.; et al. The single-cell pathology landscape of breast cancer. Nature 2020, 578, 615–620. [Google Scholar] [CrossRef]
- Van Unen, V.; Li, N.; Molendijk, I.; Temurhan, M.; Hollt, T.; van der Meulen-de Jong, A.E.; Verspaget, H.W.; Mearin, M.L.; Mulder, C.J.; van Bergen, J.; et al. Mass Cytometry of the Human Mucosal Immune System Identifies Tissue- and Disease-Associated Immune Subsets. Immunity 2016, 44, 1227–1239. [Google Scholar] [CrossRef]
- Guo, N.; van Unen, V.; Ijsselsteijn, M.E.; Ouboter, L.F.; van der Meulen, A.E.; Chuva de Sousa Lopes, S.M.; de Miranda, N.; Koning, F.; Li, N. A 34-Marker Panel for Imaging Mass Cytometric Analysis of Human Snap-Frozen Tissue. Front. Immunol. 2020, 11, 1466. [Google Scholar] [CrossRef]
- Vermeer, M.H.; van Doorn, R.; Dukers, D.; Bekkenk, M.W.; Meijer, C.J.; Willemze, R. CD8+ T cells in cutaneous T-cell lymphoma: Expression of cytotoxic proteins, Fas Ligand, and killing inhibitory receptors and their relationship with clinical behavior. J. Clin. Oncol. 2001, 19, 4322–4329. [Google Scholar] [CrossRef]
- Rubio Gonzalez, B.; Zain, J.; Rosen, S.T.; Querfeld, C. Tumor microenvironment in mycosis fungoides and Sézary syndrome. Curr. Opin. Oncol. 2016, 28, 88–96. [Google Scholar] [CrossRef] [PubMed]
- Gjerdrum, L.M.; Woetmann, A.; Odum, N.; Burton, C.M.; Rossen, K.; Skovgaard, G.L.; Ryder, L.P.; Ralfkiaer, E. FOXP3+ regulatory T cells in cutaneous T-cell lymphomas: Association with disease stage and survival. Leukemia 2007, 21, 2512–2518. [Google Scholar] [CrossRef] [PubMed]
- Tiemessen, M.M.; Mitchell, T.J.; Hendry, L.; Whittaker, S.J.; Taams, L.S.; John, S. Lack of suppressive CD4+CD25+FOXP3+ T cells in advanced stages of primary cutaneous T-cell lymphoma. J. Invest. Dermatol. 2006, 126, 2217–2223. [Google Scholar] [CrossRef] [PubMed][Green Version]
- Borcherding, N.; Voigt, A.P.; Liu, V.; Link, B.K.; Zhang, W.; Jabbari, A. Single-Cell Profiling of Cutaneous T-Cell Lymphoma Reveals Underlying Heterogeneity Associated with Disease Progression. Clin. Cancer Res. 2019, 25, 2996–3005. [Google Scholar] [CrossRef] [PubMed]
- Furudate, S.; Fujimura, T.; Kakizaki, A.; Hidaka, T.; Asano, M.; Aiba, S. Tumor-associated M2 macrophages in mycosis fungoides acquire immunomodulatory function by interferon alpha and interferon gamma. J. Dermatol. Sci. 2016, 83, 182–189. [Google Scholar] [CrossRef] [PubMed]
- Mendez-Enriquez, E.; García-Zepeda, E.A. The multiple faces of CCL13 in immunity and inflammation. Inflammopharmacology 2013, 21, 397–406. [Google Scholar] [CrossRef]
- Tiemessen, M.M.; Jagger, A.L.; Evans, H.G.; van Herwijnen, M.J.; John, S.; Taams, L.S. CD4+CD25+Foxp3+ regulatory T cells induce alternative activation of human monocytes/macrophages. Proc. Natl. Acad. Sci. USA 2007, 104, 19446–19451. [Google Scholar] [CrossRef]
- Francisco, L.M.; Sage, P.T.; Sharpe, A.H. The PD-1 pathway in tolerance and autoimmunity. Immunol. Rev. 2010, 236, 219–242. [Google Scholar] [CrossRef]
- Samimi, S.; Benoit, B.; Evans, K.; Wherry, E.J.; Showe, L.; Wysocka, M.; Rook, A.H. Increased programmed death-1 expression on CD4+ T cells in cutaneous T-cell lymphoma: Implications for immune suppression. Arch. Dermatol. 2010, 146, 1382–1388. [Google Scholar] [CrossRef]
- Wartewig, T.; Ruland, J. PD-1 Tumor Suppressor Signaling in T Cell Lymphomas. Trends Immunol. 2019, 40, 403–414. [Google Scholar] [CrossRef] [PubMed]
- Iyer, A.; Hennessey, D.; O’Keefe, S.; Patterson, J.; Wang, W.; Salopek, T.; Wong, G.K.; Gniadecki, R. Clonotypic heterogeneity in cutaneous T-cell lymphoma (mycosis fungoides) revealed by comprehensive whole-exome sequencing. Blood Adv. 2019, 3, 1175–1184. [Google Scholar] [CrossRef] [PubMed]
- Hamrouni, A.; Fogh, H.; Zak, Z.; Ødum, N.; Gniadecki, R. Clonotypic Diversity of the T-cell Receptor Corroborates the Immature Precursor Origin of Cutaneous T-cell Lymphoma. Clin. Cancer Res. 2019, 25, 3104–3114. [Google Scholar] [CrossRef] [PubMed]
- Herrera, A.; Cheng, A.; Mimitou, E.P.; Seffens, A.; George, D.; Bar-Natan, M.; Heguy, A.; Ruggles, K.V.; Scher, J.U.; Hymes, K.; et al. Multimodal single-cell analysis of cutaneous T-cell lymphoma reveals distinct subclonal tissue-dependent signatures. Blood 2021, 138, 1456–1464. [Google Scholar] [CrossRef]
- Litvinov, I.V.; Tetzlaff, M.T.; Thibault, P.; Gangar, P.; Moreau, L.; Watters, A.K.; Netchiporouk, E.; Pehr, K.; Prieto, V.G.; Rahme, E.; et al. Gene expression analysis in Cutaneous T-Cell Lymphomas (CTCL) highlights disease heterogeneity and potential diagnostic and prognostic indicators. Oncoimmunology 2017, 6, e1306618. [Google Scholar] [CrossRef]
- Stoeckius, M.; Hafemeister, C.; Stephenson, W.; Houck-Loomis, B.; Chattopadhyay, P.K.; Swerdlow, H.; Satija, R.; Smibert, P. Simultaneous epitope and transcriptome measurement in single cells. Nat. Methods 2017, 14, 865–868. [Google Scholar] [CrossRef]
- Yao, L.; Jayasinghe, R.G.; Thomas, B.E.; Bhasin, S.S.; Fernandez, N.; Kourelis, T.; Doxie, D.; Avigan, D.E.; Dhodapkar, M.V.; Kumar, S.K.; et al. Integrated Cytof, Scrna-Seq and Cite-Seq Analysis of Bone Marrow Immune Microenvironment in the Mmrf Commpass Study. Blood 2020, 136, 28–29. [Google Scholar] [CrossRef]
- Zhang, Q.; Wang, H.Y.; Wei, F.; Liu, X.; Paterson, J.C.; Roy, D.; Mihova, D.; Woetmann, A.; Ptasznik, A.; Odum, N.; et al. Cutaneous T cell lymphoma expresses immunosuppressive CD80 (B7-1) cell surface protein in a STAT5-dependent manner. J. Immunol. 2014, 192, 2913–2919. [Google Scholar] [CrossRef]
- Wong, H.K.; Wilson, A.J.; Gibson, H.M.; Hafner, M.S.; Hedgcock, C.J.; Berger, C.L.; Edelson, R.L.; Lim, H.W. Increased expression of CTLA-4 in malignant T cells from patients with mycosis fungoides—Cutaneous T-cell lymphoma. J. Investig. Dermatol. 2006, 126, 212–219. [Google Scholar] [CrossRef]
- Kamijo, H.; Miyagaki, T.; Shishido-Takahashi, N.; Nakajima, R.; Oka, T.; Suga, H.; Sugaya, M.; Sato, S. Aberrant CD137 ligand expression induced by GATA6 overexpression promotes tumor progression in cutaneous T-cell lymphoma. Blood 2018, 132, 1922–1935. [Google Scholar] [CrossRef]
- Jones, D.; Fletcher, C.D.; Pulford, K.; Shahsafaei, A.; Dorfman, D.M. The T-cell activation markers CD30 and OX40/CD134 are expressed in nonoverlapping subsets of peripheral T-cell lymphoma. Blood 1999, 93, 3487–3493. [Google Scholar] [CrossRef] [PubMed]
- Amatore, F.; Ortonne, N.; Lopez, M.; Orlanducci, F.; Castellano, R.; Ingen-Housz-Oro, S.; De Croos, A.; Salvado, C.; Gorvel, L.; Goubard, A.; et al. ICOS is widely expressed in cutaneous T-cell lymphoma, and its targeting promotes potent killing of malignant cells. Blood Adv. 2020, 4, 5203–5214. [Google Scholar] [CrossRef] [PubMed]
- Lu, D.; Duvic, M.; Medeiros, L.J.; Luthra, R.; Dorfman, D.M.; Jones, D. The T-cell chemokine receptor CXCR3 is expressed highly in low-grade mycosis fungoides. Am. J. Clin. Pathol. 2001, 115, 413–421. [Google Scholar] [CrossRef] [PubMed]
- Durgin, J.S.; Weiner, D.M.; Wysocka, M.; Rook, A.H. The immunopathogenesis and immunotherapy of cutaneous T cell lymphoma: Pathways and targets for immune restoration and tumor eradication. J. Am. Acad. Dermatol. 2021, 84, 587–595. [Google Scholar] [CrossRef] [PubMed]
- Sommer, C.; Straehle, C.; Köthe, U.; Hamprecht, F.A. Ilastik: Interactive learning and segmentation toolkit. In Proceedings of the 2011 IEEE International Symposium on Biomedical Imaging: From Nano to Macro, Chicago, IL, USA, 30 March–2 April 2011; pp. 230–233. [Google Scholar] [CrossRef]
- Jones, T.R.; Kang, I.H.; Wheeler, D.B.; Lindquist, R.A.; Papallo, A.; Sabatini, D.M.; Golland, P.; Carpenter, A.E. CellProfiler Analyst: Data exploration and analysis software for complex image-based screens. BMC Bioinform. 2008, 9, 482. [Google Scholar] [CrossRef] [PubMed]
- Somarakis, A.; Van Unen, V.; Koning, F.; Lelieveldt, B.; Hollt, T. ImaCytE: Visual Exploration of Cellular Micro-Environments for Imaging Mass Cytometry Data. IEEE Trans. Vis. Comput. Graph. 2021, 27, 98–110. [Google Scholar] [CrossRef] [PubMed]
- Schapiro, D.; Jackson, H.W.; Raghuraman, S.; Fischer, J.R.; Zanotelli, V.R.T.; Schulz, D.; Giesen, C.; Catena, R.; Varga, Z.; Bodenmiller, B. histoCAT: Analysis of cell phenotypes and interactions in multiplex image cytometry data. Nat. Methods 2017, 14, 873–876. [Google Scholar] [CrossRef] [PubMed]
- Ijsselsteijn, M.E.; Somarakis, A.; Lelieveldt, B.P.F.; Höllt, T.; de Miranda, N.F.C.C. Semi-automated background removal limits data loss and normalizes imaging mass cytometry data. Cytom. A 2021, 99, 1187–1197. [Google Scholar] [CrossRef]
- Schulz, D.; Zanotelli, V.R.T.; Fischer, J.R.; Schapiro, D.; Engler, S.; Lun, X.-K.; Jackson, H.W.; Bodenmiller, B. Simultaneous Multiplexed Imaging of mRNA and Proteins with Subcellular Resolution in Breast Cancer Tissue Samples by Mass Cytometry. Cell Syst. 2018, 6, 25–36.e25. [Google Scholar] [CrossRef]


Publisher’s Note: MDPI stays neutral with regard to jurisdictional claims in published maps and institutional affiliations. |
© 2022 by the authors. Licensee MDPI, Basel, Switzerland. This article is an open access article distributed under the terms and conditions of the Creative Commons Attribution (CC BY) license (https://creativecommons.org/licenses/by/4.0/).
Share and Cite
Guo, N.; Jia, L.; Out-Luiting, C.; Miranda, N.F.C.C.d.; Willemze, R.; Koning, F.; Vermeer, M.; Quint, K. Mass Cytometric Analysis of Early-Stage Mycosis Fungoides. Cells 2022, 11, 1062. https://doi.org/10.3390/cells11071062
Guo N, Jia L, Out-Luiting C, Miranda NFCCd, Willemze R, Koning F, Vermeer M, Quint K. Mass Cytometric Analysis of Early-Stage Mycosis Fungoides. Cells. 2022; 11(7):1062. https://doi.org/10.3390/cells11071062
Chicago/Turabian StyleGuo, Nannan, Li Jia, Coby Out-Luiting, Noel F. C. C. de Miranda, Rein Willemze, Frits Koning, Maarten Vermeer, and Koen Quint. 2022. "Mass Cytometric Analysis of Early-Stage Mycosis Fungoides" Cells 11, no. 7: 1062. https://doi.org/10.3390/cells11071062
APA StyleGuo, N., Jia, L., Out-Luiting, C., Miranda, N. F. C. C. d., Willemze, R., Koning, F., Vermeer, M., & Quint, K. (2022). Mass Cytometric Analysis of Early-Stage Mycosis Fungoides. Cells, 11(7), 1062. https://doi.org/10.3390/cells11071062