
Evaluation of Neurofilament Light Chain as a Biomarker of Neurodegeneration in X-Linked Childhood Cerebral Adrenoleukodystrophy

 , , , ,
Abstract
:1. Introduction
2. Materials and Methods
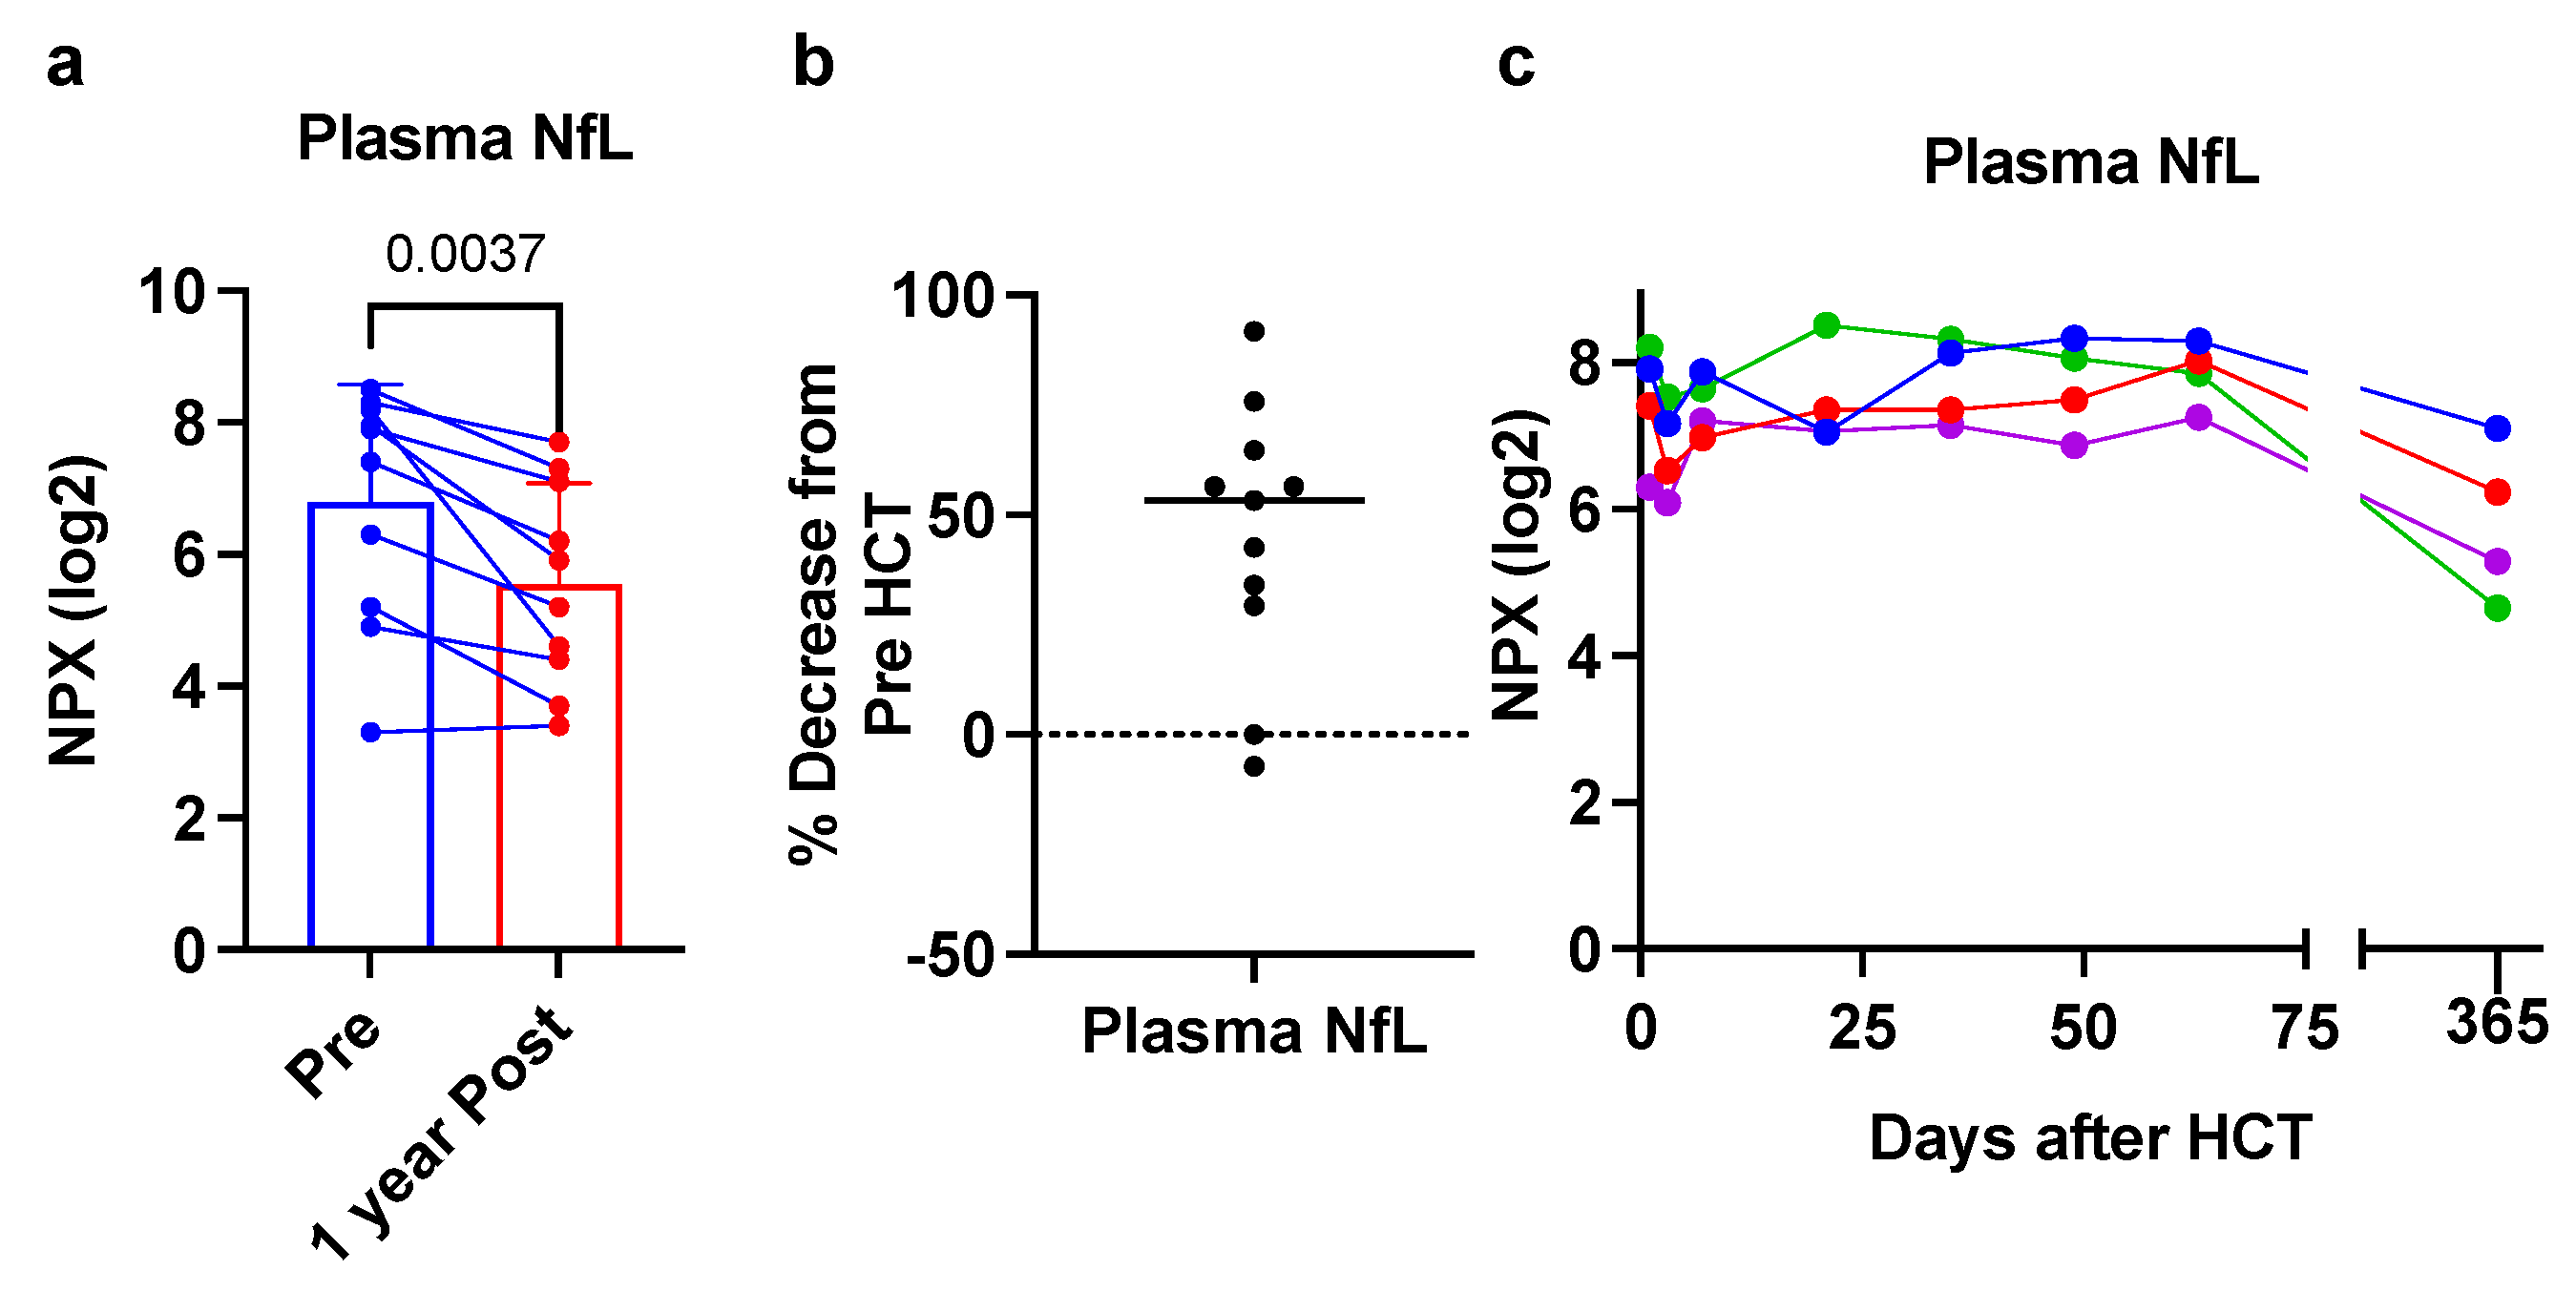
3. Results
4. Discussion
Author Contributions
Funding
Institutional Review Board Statement
Informed Consent Statement
Data Availability Statement
Conflicts of Interest
References
- Engelen, M.; Kemp, S.; de Visser, M.; van Geel, B.M.; Wanders, R.J.; Aubourg, P.; Poll-The, B.T. X-linked adrenoleukodystrophy (X-ALD): Clinical presentation and guidelines for diagnosis, follow-up and management. Orphanet J. Rare Dis. 2012, 7, 51. [Google Scholar] [CrossRef]
- Pasco, A.; Kalifa, G.; Sarrazin, J.L.; Adamsbaum, C.; Aubourg, P. Contribution of MRI to the diagnosis of cerebral lesions of adrenoleukodystrophy. Pediatr. Radiol. 1991, 21, 161–163. [Google Scholar] [CrossRef] [PubMed]
- Mahmood, A.; Raymond, G.V.; Dubey, P.; Peters, C.; Moser, H.W. Survival analysis of haematopoietic cell transplantation for childhood cerebral X-linked adrenoleukodystrophy: A comparison study. Lancet Neurol. 2007, 6, 687–692. [Google Scholar] [CrossRef]
- Orchard, P.J.; Nascene, D.R.; Miller, W.P.; Gupta, A.; Kenney-Jung, D.; Lund, T.C. Successful donor engraftment and repair of the blood-brain barrier in cerebral adrenoleukodystrophy. Blood 2019, 133, 1378–1381. [Google Scholar] [CrossRef] [PubMed] [Green Version]
- Miller, W.P.; Rothman, S.M.; Nascene, D.; Kivisto, T.; DeFor, T.E.; Ziegler, R.S.; Eisengart, J.; Leiser, K.; Raymond, G.; Lund, T.C.; et al. Outcomes after allogeneic hematopoietic cell transplantation for childhood cerebral adrenoleukodystrophy: The largest single-institution cohort report. Blood 2011, 118, 1971–1978. [Google Scholar] [CrossRef] [PubMed]
- Eichler, F.; Duncan, C.; Musolino, P.L.; Orchard, P.J.; De Oliveira, S.; Thrasher, A.J.; Armant, M.; Dansereau, C.; Lund, T.C.; Miller, W.P.; et al. Hematopoietic Stem-Cell Gene Therapy for Cerebral Adrenoleukodystrophy. N. Engl. J. Med. 2017, 377, 1630–1638. [Google Scholar] [CrossRef] [Green Version]
- Loes, D.J.; Hite, S.; Moser, H.; Stillman, A.E.; Shapiro, E.; Lockman, L.; Latchaw, R.E.; Krivit, W. Adrenoleukodystrophy: A scoring method for brain MR observations. AJNR. Am. J. Neuroradiol. 1994, 15, 1761–1766. [Google Scholar] [PubMed]
- Lund, T.C.; Ng, M.; Orchard, P.J.; Loes, D.J.; Raymond, G.V.; Gupta, A.; Kenny-Jung, D.; Nascene, D.R. Volume of Gadolinium Enhancement and Successful Repair of the Blood-Brain Barrier in Cerebral Adrenoleukodystrophy. Biol. Blood Marrow Transplant. J. Am. Soc. Blood Marrow Transplant. 2020, 26, 1894–1899. [Google Scholar] [CrossRef]
- Thibert, K.A.; Raymond, G.V.; Nascene, D.R.; Miller, W.P.; Tolar, J.; Orchard, P.J.; Lund, T.C. Cerebrospinal fluid matrix metalloproteinases are elevated in cerebral adrenoleukodystrophy and correlate with MRI severity and neurologic dysfunction. PLoS ONE 2012, 7, e50430. [Google Scholar] [CrossRef] [PubMed] [Green Version]
- Lund, T.C.; Stadem, P.S.; Panoskaltsis-Mortari, A.; Raymond, G.; Miller, W.P.; Tolar, J.; Orchard, P.J. Elevated cerebral spinal fluid cytokine levels in boys with cerebral adrenoleukodystrophy correlates with MRI severity. PLoS ONE 2012, 7, e32218. [Google Scholar] [CrossRef] [PubMed] [Green Version]
- Orchard, P.J.; Lund, T.; Miller, W.; Rothman, S.M.; Raymond, G.; Nascene, D.; Basso, L.; Cloyd, J.; Tolar, J. Chitotriosidase as a biomarker of cerebral adrenoleukodystrophy. J. Neuroinflamm. 2011, 8, 144. [Google Scholar] [CrossRef] [PubMed] [Green Version]
- Weinhofer, I.; Rommer, P.; Zierfuss, B.; Altmann, P.; Foiani, M.; Heslegrave, A.; Zetterberg, H.; Gleiss, A.; Musolino, P.L.; Gong, Y.; et al. Neurofilament light chain as a potential biomarker for monitoring neurodegeneration in X-linked adrenoleukodystrophy. Nat. Commun. 2021, 12, 1816. [Google Scholar] [CrossRef] [PubMed]
- Ramani, S.; Berard, J.A.; Walker, L.A.S. The relationship between neurofilament light chain and cognition in neurological disorders: A scoping review. J. Neurol. Sci. 2021, 420, 117229. [Google Scholar] [CrossRef] [PubMed]
- Assarsson, E.; Lundberg, M.; Holmquist, G.; Bjorkesten, J.; Thorsen, S.B.; Ekman, D.; Eriksson, A.; Rennel Dickens, E.; Ohlsson, S.; Edfeldt, G.; et al. Homogenous 96-plex PEA immunoassay exhibiting high sensitivity, specificity, and excellent scalability. PLoS ONE 2014, 9, e95192. [Google Scholar] [CrossRef] [Green Version]
- Jabbari, E.; Woodside, J.; Guo, T.; Magdalinou, N.K.; Chelban, V.; Athauda, D.; Lees, A.J.; Foltynie, T.; Houlden, H.; Church, A.; et al. Proximity extension assay testing reveals novel diagnostic biomarkers of atypical parkinsonian syndromes. J. Neurol. Neurosurg. Psychiatry 2019, 90, 768–773. [Google Scholar] [CrossRef] [PubMed] [Green Version]
- Huttenrauch, M.; Ogorek, I.; Klafki, H.; Otto, M.; Stadelmann, C.; Weggen, S.; Wiltfang, J.; Wirths, O. Glycoprotein NMB: A novel Alzheimer’s disease associated marker expressed in a subset of activated microglia. Acta Neuropathol. Commun. 2018, 6, 108. [Google Scholar] [CrossRef] [Green Version]
- Zigdon, H.; Savidor, A.; Levin, Y.; Meshcheriakova, A.; Schiffmann, R.; Futerman, A.H. Identification of a biomarker in cerebrospinal fluid for neuronopathic forms of Gaucher disease. PLoS ONE 2015, 10, e0120194. [Google Scholar] [CrossRef]
- Khalil, M.; Teunissen, C.E.; Otto, M.; Piehl, F.; Sormani, M.P.; Gattringer, T.; Barro, C.; Kappos, L.; Comabella, M.; Fazekas, F.; et al. Neurofilaments as biomarkers in neurological disorders. Nat. Rev. Neurol. 2018, 14, 577–589. [Google Scholar] [CrossRef] [PubMed]
- Falzone, Y.M.; Russo, T.; Domi, T.; Pozzi, L.; Quattrini, A.; Filippi, M.; Riva, N. Current application of neurofilaments in amyotrophic lateral sclerosis and future perspectives. Neural. Regen. Res. 2021, 16, 1985–1991. [Google Scholar] [CrossRef] [PubMed]
- Shahim, P.; Politis, A.; van der Merwe, A.; Moore, B.; Chou, Y.Y.; Pham, D.L.; Butman, J.A.; Diaz-Arrastia, R.; Gill, J.M.; Brody, D.L.; et al. Neurofilament light as a biomarker in traumatic brain injury. Neurology 2020, 95, e610–e622. [Google Scholar] [CrossRef]
- Pekny, M.; Wilhelmsson, U.; Stokowska, A.; Tatlisumak, T.; Jood, K.; Pekna, M. Neurofilament Light Chain (NfL) in Blood-A Biomarker Predicting Unfavourable Outcome in the Acute Phase and Improvement in the Late Phase after Stroke. Cells 2021, 10, 1537. [Google Scholar] [CrossRef] [PubMed]
- Khalil, M.; Pirpamer, L.; Hofer, E.; Voortman, M.M.; Barro, C.; Leppert, D.; Benkert, P.; Ropele, S.; Enzinger, C.; Fazekas, F.; et al. Serum neurofilament light levels in normal aging and their association with morphologic brain changes. Nat. Commun. 2020, 11, 812. [Google Scholar] [CrossRef] [PubMed] [Green Version]
- Nitz, E.; Smitka, M.; Schallner, J.; Akgun, K.; Ziemssen, T.; von der Hagen, M.; Tungler, V. Serum neurofilament light chain in pediatric spinal muscular atrophy patients and healthy children. Ann. Clin. Transl. Neurol. 2021, 8, 2013–2024. [Google Scholar] [CrossRef] [PubMed]
- Yilmaz, A.; Blennow, K.; Hagberg, L.; Nilsson, S.; Price, R.W.; Schouten, J.; Spudich, S.; Underwood, J.; Zetterberg, H.; Gisslen, M. Neurofilament light chain protein as a marker of neuronal injury: Review of its use in HIV-1 infection and reference values for HIV-negative controls. Expert Rev. Mol. Diagn. 2017, 17, 761–770. [Google Scholar] [CrossRef] [PubMed]
- Masvekar, R.R.; Kosa, P.; Jin, K.; Dobbs, K.; Stack, M.A.; Castagnoli, R.; Quaresima, V.; Su, H.C.; Imberti, L.; Notarangelo, L.D.; et al. Prognostic Value of Serum/Plasma Neurofilament Light Chain for COVID-19 Associated Mortality. medRxiv 2022. [Google Scholar] [CrossRef]
- Frontera, J.A.; Boutajangout, A.; Masurkar, A.V.; Betensky, R.A.; Ge, Y.; Vedvyas, A.; Debure, L.; Moreira, A.; Lewis, A.; Huang, J.; et al. Comparison of serum neurodegenerative biomarkers among hospitalized COVID-19 patients versus non-COVID subjects with normal cognition, mild cognitive impairment, or Alzheimer’s dementia. Alzheimer’s Dement. J. Alzheimer’s Assoc. 2022, in press. [Google Scholar] [CrossRef]
- Barro, C.; Benkert, P.; Disanto, G.; Tsagkas, C.; Amann, M.; Naegelin, Y.; Leppert, D.; Gobbi, C.; Granziera, C.; Yaldizli, O.; et al. Serum neurofilament as a predictor of disease worsening and brain and spinal cord atrophy in multiple sclerosis. Brain A J. Neurol. 2018, 141, 2382–2391. [Google Scholar] [CrossRef] [PubMed]
- Canto, E.; Barro, C.; Zhao, C.; Caillier, S.J.; Michalak, Z.; Bove, R.; Tomic, D.; Santaniello, A.; Haring, D.A.; Hollenbach, J.; et al. Association Between Serum Neurofilament Light Chain Levels and Long-term Disease Course Among Patients With Multiple Sclerosis Followed up for 12 Years. JAMA Neurol. 2019, 76, 1359–1366. [Google Scholar] [CrossRef] [PubMed]
- Lu, X.; Zhang, D.; Shoji, H.; Duan, C.; Zhang, G.; Isaji, T.; Wang, Y.; Fukuda, T.; Gu, J. Deficiency of alpha1,6-fucosyltransferase promotes neuroinflammation by increasing the sensitivity of glial cells to inflammatory mediators. Biochim. Biophys. Acta (BBA)-Gen. Subj. 2019, 1863, 598–608. [Google Scholar] [CrossRef]
- Schmidtko, A.; Gao, W.; Sausbier, M.; Rauhmeier, I.; Sausbier, U.; Niederberger, E.; Scholich, K.; Huber, A.; Neuhuber, W.; Allescher, H.D.; et al. Cysteine-rich protein 2, a novel downstream effector of cGMP/cGMP-dependent protein kinase I-mediated persistent inflammatory pain. J. Neurosci. Off. J. Soc. Neurosci. 2008, 28, 1320–1330. [Google Scholar] [CrossRef] [PubMed]
- Wei, J.; Gorman, T.E.; Liu, X.; Ith, B.; Tseng, A.; Chen, Z.; Simon, D.I.; Layne, M.D.; Yet, S.F. Increased neointima formation in cysteine-rich protein 2-deficient mice in response to vascular injury. Circ. Res. 2005, 97, 1323–1331. [Google Scholar] [CrossRef] [PubMed] [Green Version]
- Wang, M.; Li, Z.; Zuo, Q. miR-194-5p inhibits LPS-induced astrocytes activation by directly targeting neurexophilin 1. Mol. Cell. Biochem. 2020, 471, 203–213. [Google Scholar] [CrossRef] [PubMed]
- Orchard, P.J.; Nascene, D.R.; Gupta, A.; Taisto, M.E.; Higgins, L.; Markowski, T.W.; Lund, T.C. Cerebral adrenoleukodystrophy is associated with loss of tolerance to profilin. Eur. J. Immunol. 2019, 49, 947–953. [Google Scholar] [CrossRef] [PubMed]


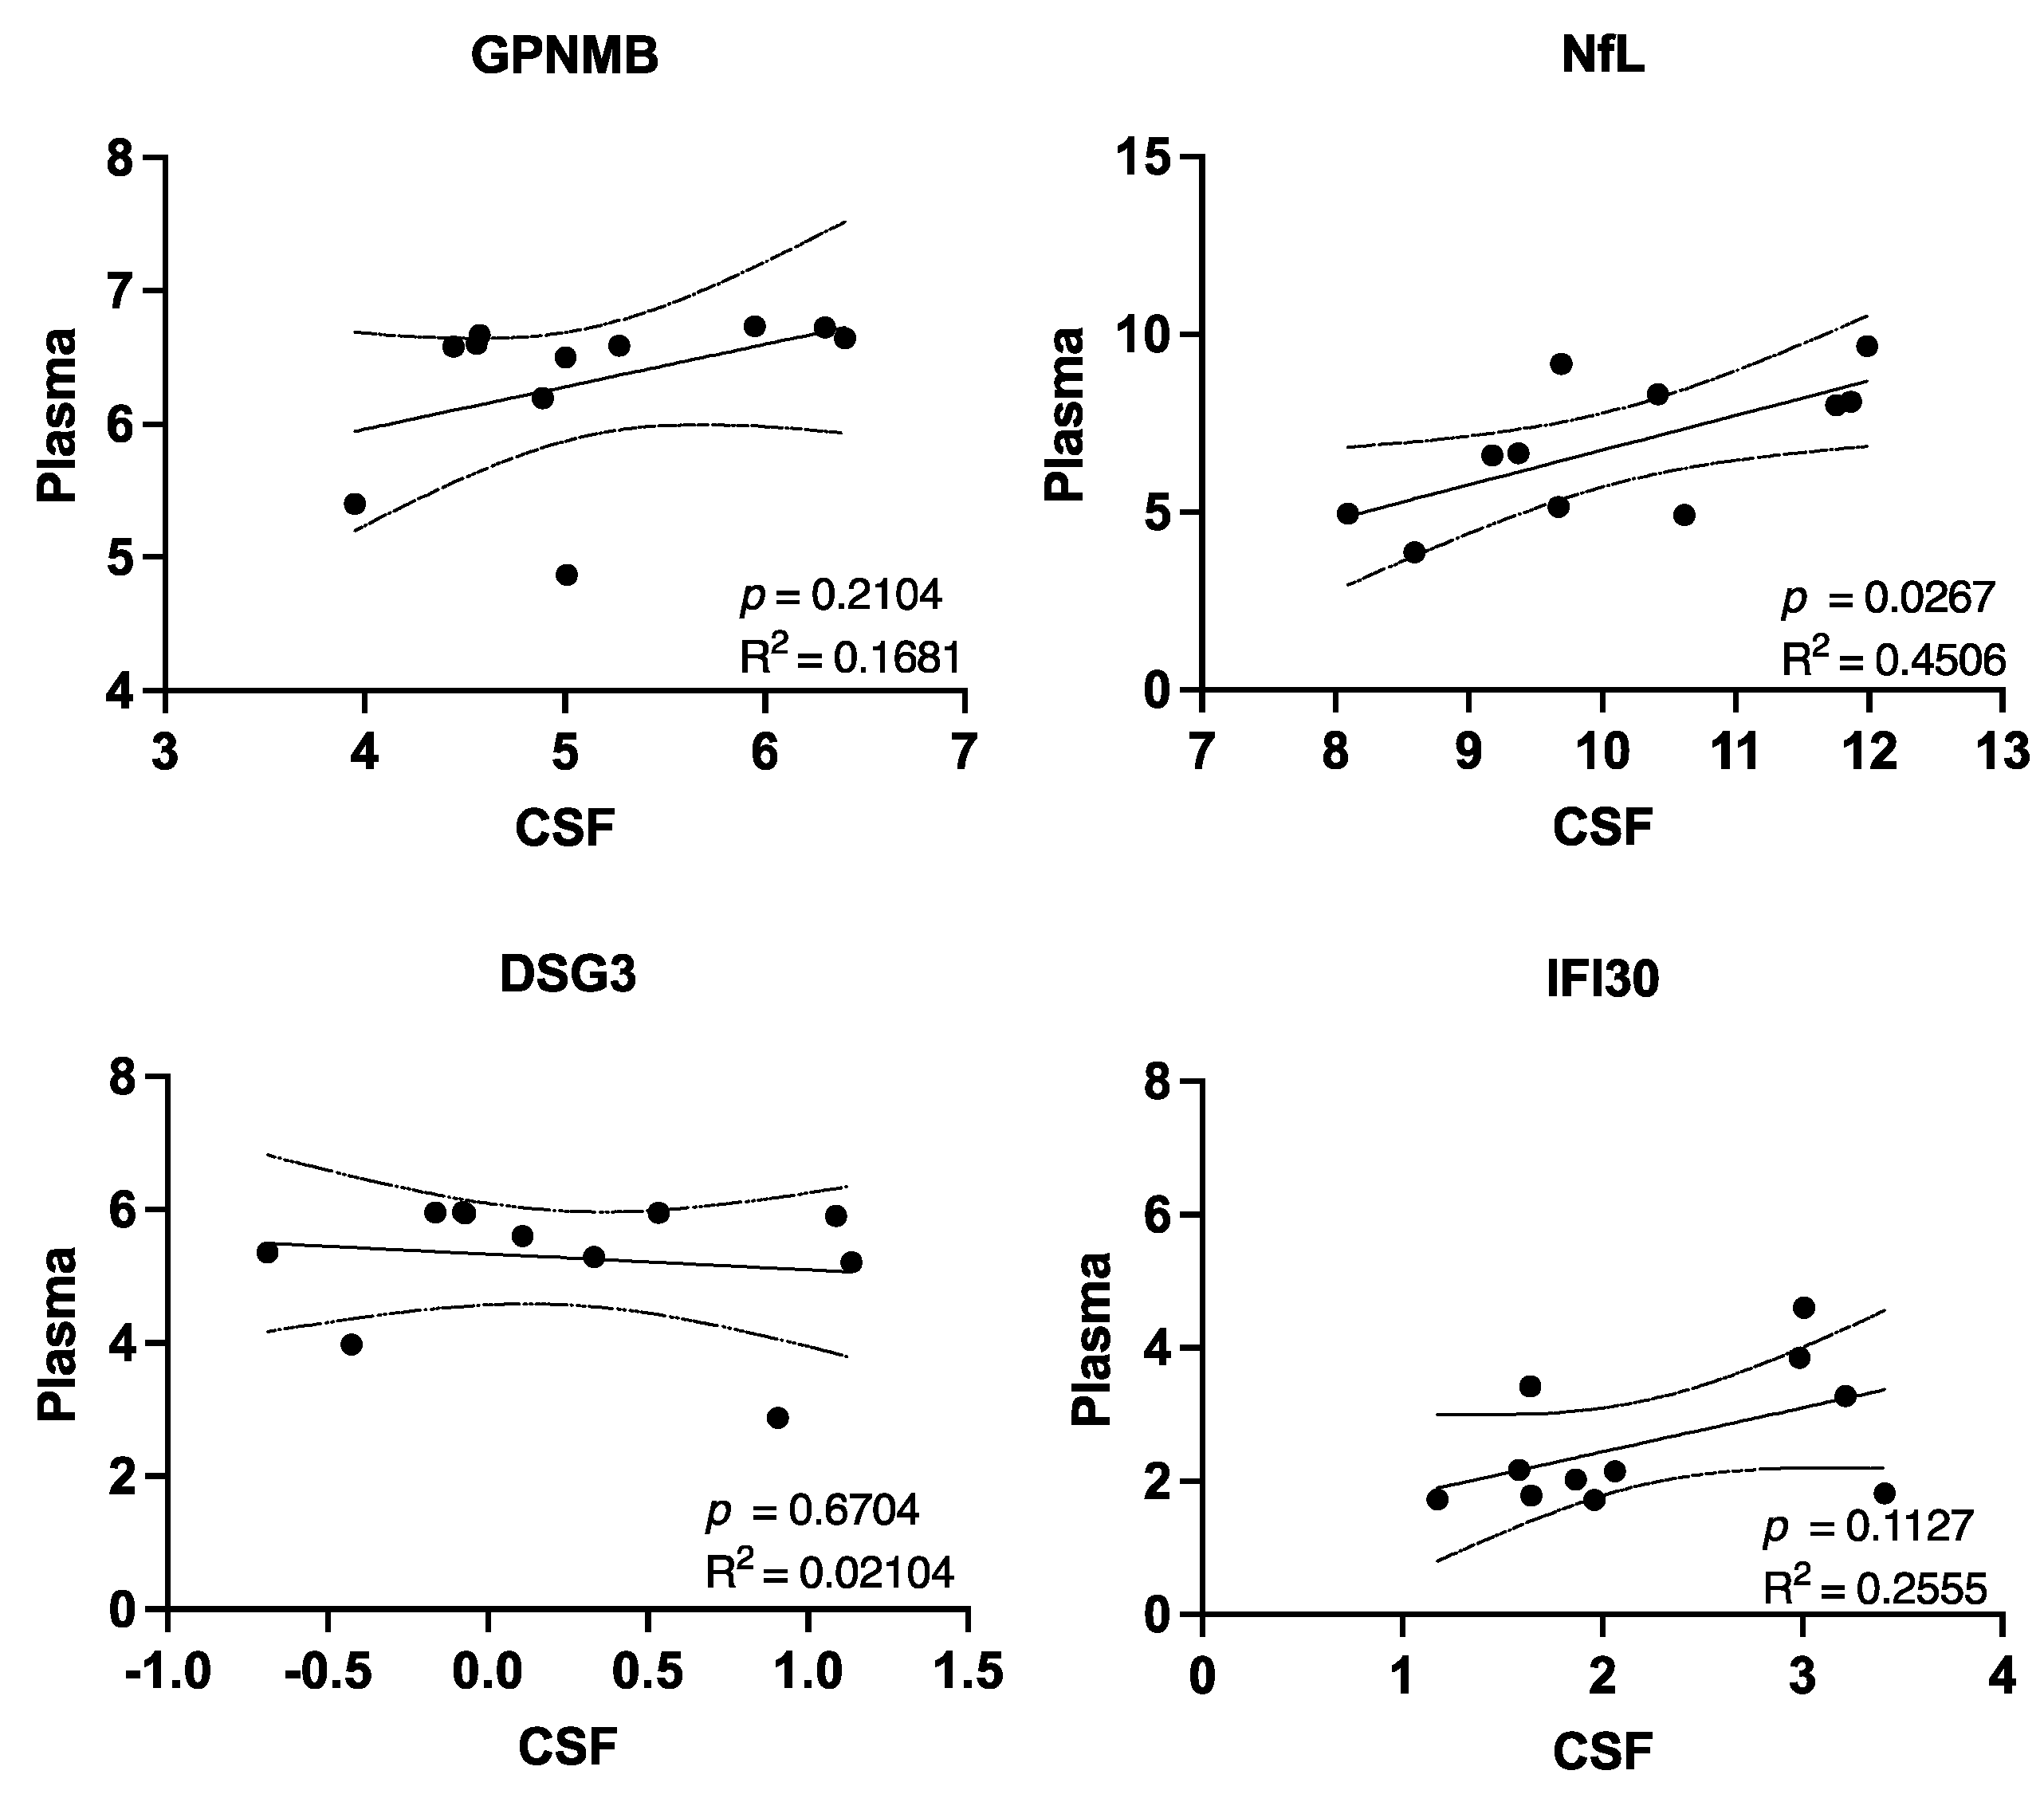
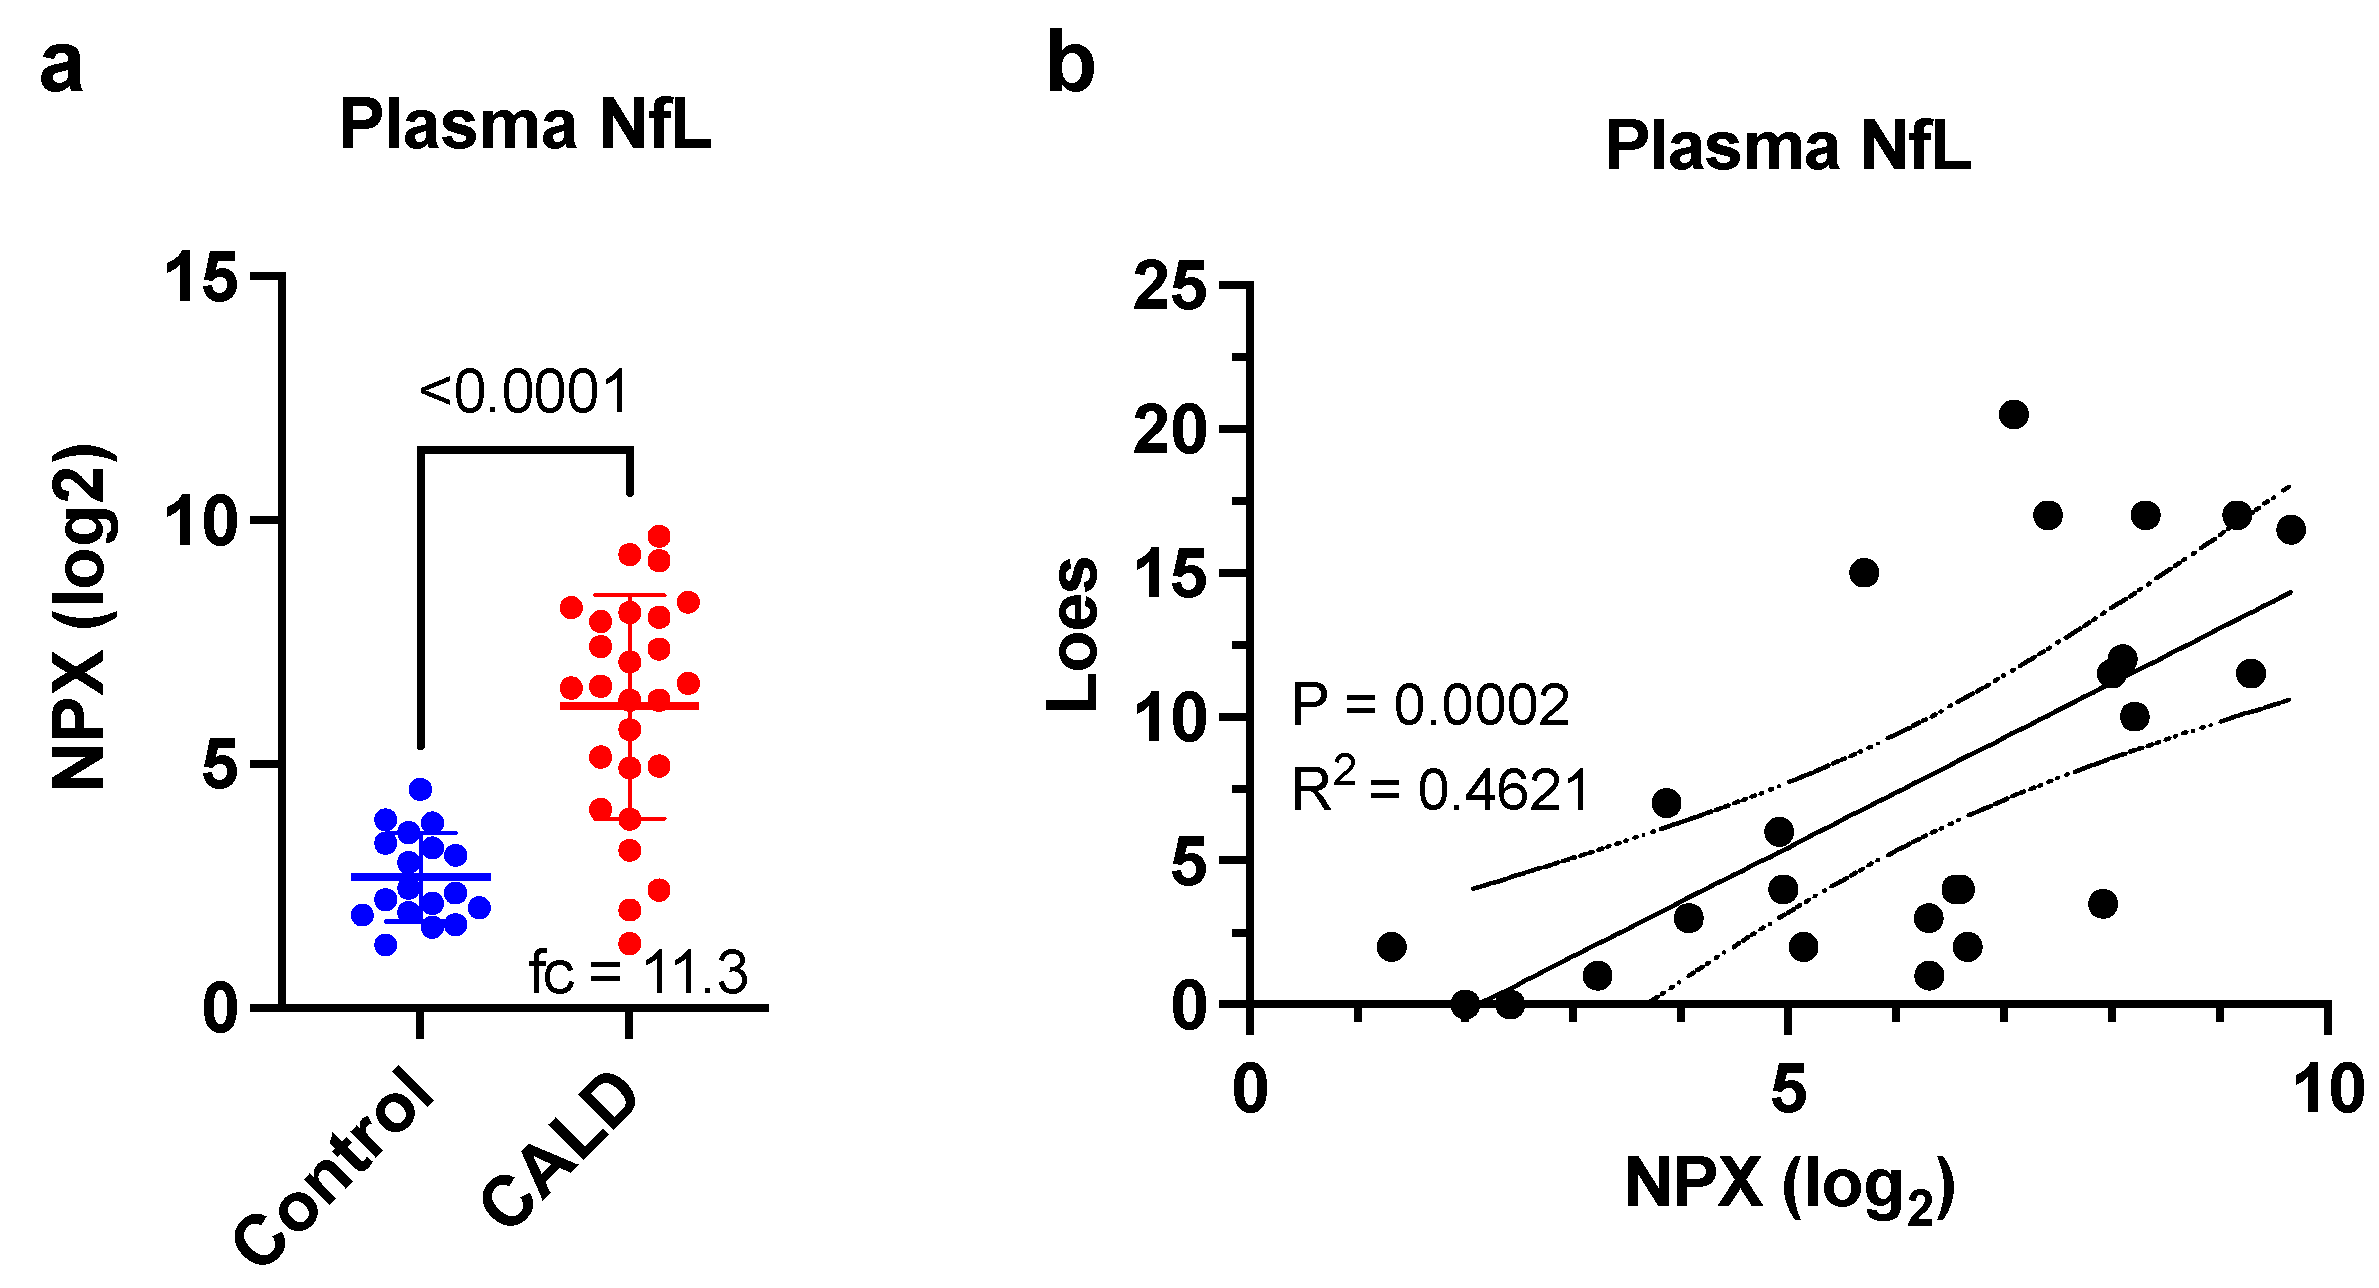
| Group | CSF CALD Baseline | CSF Control (Adult) | Plasma CALD Baseline | Plasma Control (Pediatric) |
|---|---|---|---|---|
| n | 11 | 18 | 26 | 18 |
| Age, years | 8.4 (4.5–15.5) | 43 (23–68) | 6.9 (4–15.5) | 7 (4–16) |
| Sex | Male | Male | Male | Male |
| Loes Score | 8.3 (2–17) | NA | 4 (0–20.5) | NA |
| NfL, NPX (IQR) 1 | 9.7 (9.2–12.0) | 7.5 (6.8–7.9) | 6.6 (4.7–8.3) | 2.4 (1.9–3.4) |
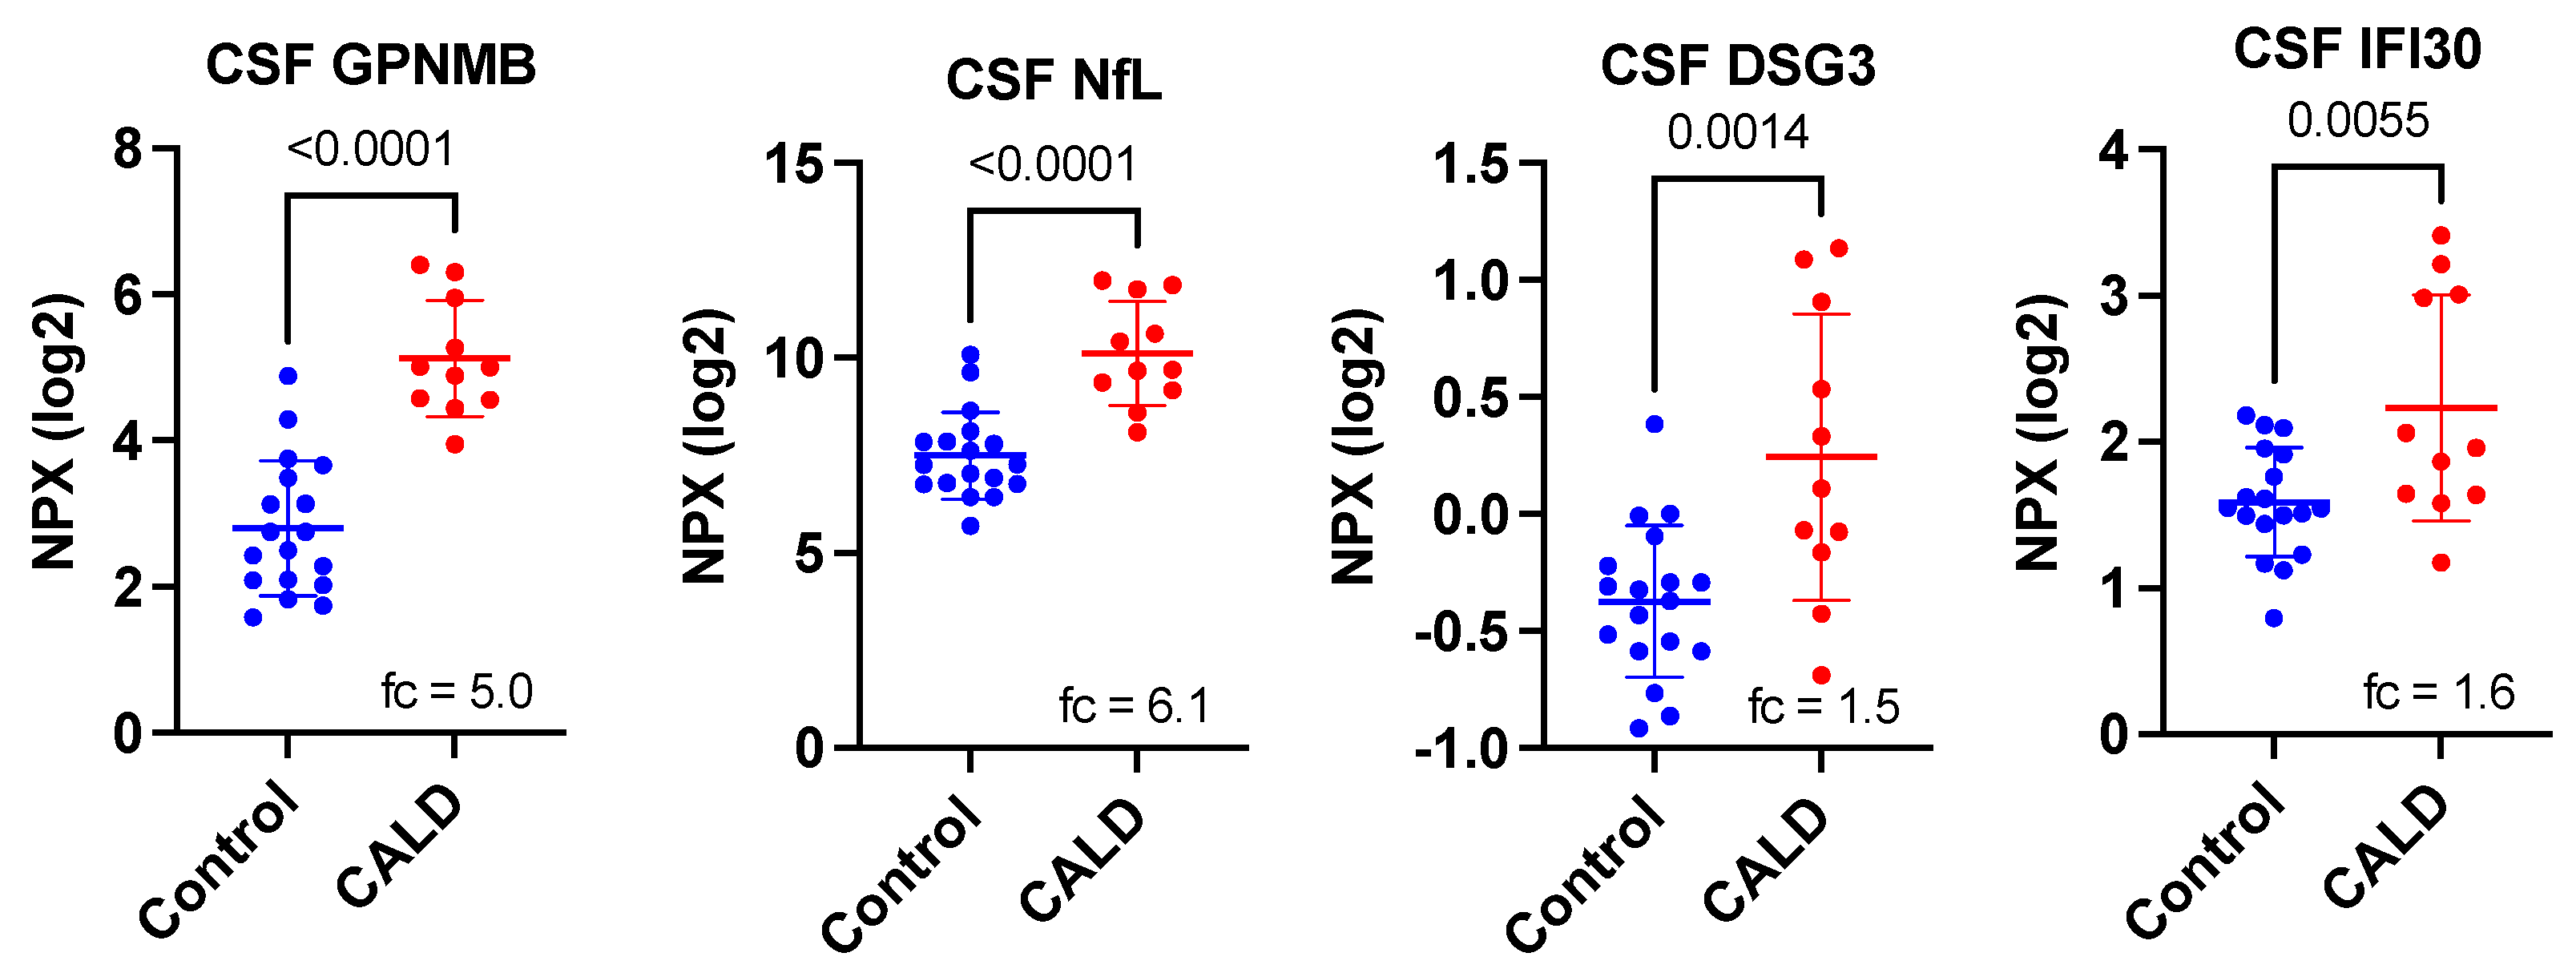
| Protein Symbol | Uniprot ID | Name | p-Value 1 | Corrected p-Value 2 | Fold-Change 3 |
|---|---|---|---|---|---|
| GPNMB | Q14956 | transmembrane glycoprotein NMB | 2.01 × 10⁻⁷ | 1.85 × 10⁻⁵ | 5.00 |
| NXPH1 | P58417 | neurexophilin 1 | 1.11 × 10⁻⁶ | 0.0001 | −4.55 |
| NEFL | P07196 | neurofilament light chain | 4.74 × 10⁻⁶ | 0.0004 | 6.13 |
| CRIP2 | P52943 | Cysteine-rich protein 2 | 8.13 × 10⁻⁶ | 0.0007 | −2.94 |
| TDGF1 | P13385 | teratocarcinoma-derived growth factor 1 | 2.97 × 10⁻⁵ | 0.0027 | −4.55 |
| FUT8 | Q9BYC5 | fucosyltransferase 8 | 8.28 × 10⁻⁵ | 0.0076 | −1.49 |
| NPM1 | P06748 | nucleophosmin 1 | 0.0001 | 0.0092 | −3.03 |
| SMOC1 | Q9H4F8 | SPARC Related Modular Calcium Binding 1 | 0.0004 | 0.0368 | −1.75 |
| ADAM15 | Q13444 | disintegrin and metalloproteinase domain-containing protein 15 | 0.0009 | 0.0828 | −1.92 |
| DSG3 | P32926 | desmoglein-3 | 0.0014 | 0.1288 | 1.54 |
| TBCB | Q99426 | tubulin-folding cofactor B | 0.0018 | 0.1656 | −1.45 |
| PLA2G10 | O15496 | group 10 secretory phospholipase A2 preproprotein | 0.0025 | 0.2300 | −1.75 |
| LTBP3 | Q9NS15 | latent-transforming growth factor beta-binding protein 3 | 0.0027 | 0.2484 | −1.20 |
| AKT1S1 | Q96B36 | proline-rich AKT1 substrate 1 | 0.0027 | 0.2484 | −1.19 |
| IFI30 | P13284 | Gamma-interferon-inducible lysosomal thiol reductase | 0.0055 | 0.5060 | 1.56 |
| FKBP7 | Q9Y680 | peptidyl-prolyl cis-trans isomerase FKBP7 | 0.0059 | 0.5888 | −1.22 |
| TNFRSF13C | Q96RJ3 | tumor necrosis factor receptor superfamily member 13C | 0.0064 | 0.6624 | −1.52 |
| GGT5 | P36269 | glutathione hydrolase 5 proenzyme | 0.0072 | 0.7084 | −1.39 |
| FGFR2 | P21802 | fibroblast growth factor receptor 2 | 0.0077 | 0.9384 | −1.45 |
| EIF4B | P23588 | eukaryotic translation initiation factor 4B | 0.0102 | 1.0000 | −1.64 |
| EPHA10 | Q5JZY3 | ephrin type-A receptor 10 | 0.0126 | 1.0000 | −2.17 |
| PRTFDC1 | Q9NRG1 | phosphoribosyltransferase domain-containing protein 1 | 0.0168 | 1.0000 | −1.52 |
| IL3RA | P26951 | interleukin-3 receptor subunit alpha | 0.0172 | 1.0000 | −1.12 |
| IL15 | P40933 | interleukin-15 | 0.0193 | 1.0000 | −1.27 |
| PHOSPHO1 | Q8TCT1 | phosphoethanolamine/phosphocholine phosphatase | 0.0194 | 1.0000 | −1.30 |
| SRP14 | P37108 | signal recognition particle 14 kDa protein | 0.0196 | 1.0000 | −1.27 |
| ASGR1 | P07306 | asialoglycoprotein receptor 1 | 0.0427 | 1.0000 | −1.09 |
| WWP2 | O00308 | NEDD4-like E3 ubiquitin-protein ligase WWP2 | 0.0481 | 1.0000 | −1.22 |
Publisher’s Note: MDPI stays neutral with regard to jurisdictional claims in published maps and institutional affiliations. |
© 2022 by the authors. Licensee MDPI, Basel, Switzerland. This article is an open access article distributed under the terms and conditions of the Creative Commons Attribution (CC BY) license (https://creativecommons.org/licenses/by/4.0/).
Share and Cite
Wang, H.; Davison, M.D.; Kramer, M.L.; Qiu, W.; Gladysheva, T.; Chiang, R.M.S.; Kayatekin, C.; Nascene, D.R.; Taghizadeh, L.A.; King, C.J.; et al. Evaluation of Neurofilament Light Chain as a Biomarker of Neurodegeneration in X-Linked Childhood Cerebral Adrenoleukodystrophy. Cells 2022, 11, 913. https://doi.org/10.3390/cells11050913
Wang H, Davison MD, Kramer ML, Qiu W, Gladysheva T, Chiang RMS, Kayatekin C, Nascene DR, Taghizadeh LA, King CJ, et al. Evaluation of Neurofilament Light Chain as a Biomarker of Neurodegeneration in X-Linked Childhood Cerebral Adrenoleukodystrophy. Cells. 2022; 11(5):913. https://doi.org/10.3390/cells11050913
Chicago/Turabian StyleWang, Hongge, Matthew D. Davison, Martin L. Kramer, Weiliang Qiu, Tatiana Gladysheva, Ruby M. S. Chiang, Can Kayatekin, David R. Nascene, Leyla A. Taghizadeh, Carina J. King, and et al. 2022. "Evaluation of Neurofilament Light Chain as a Biomarker of Neurodegeneration in X-Linked Childhood Cerebral Adrenoleukodystrophy" Cells 11, no. 5: 913. https://doi.org/10.3390/cells11050913
APA StyleWang, H., Davison, M. D., Kramer, M. L., Qiu, W., Gladysheva, T., Chiang, R. M. S., Kayatekin, C., Nascene, D. R., Taghizadeh, L. A., King, C. J., Nolan, E. E., Gupta, A. O., Orchard, P. J., & Lund, T. C. (2022). Evaluation of Neurofilament Light Chain as a Biomarker of Neurodegeneration in X-Linked Childhood Cerebral Adrenoleukodystrophy. Cells, 11(5), 913. https://doi.org/10.3390/cells11050913