
Insights into the Histone Acetylation-Mediated Regulation of the Transcription Factor Genes That Control the Embryogenic Transition in the Somatic Cells of Arabidopsis

 , ,
, ,  , , ,
, , ,  ,
, 
Abstract
:1. Introduction
2. Materials and Methods
2.1. Plant Material
2.2. Plant Growth and In Vitro Culture Conditions
2.3. In Vitro Culture of the Explants
2.4. Histone Extraction
2.5. ELISA
2.6. ChIP-qPCR
2.7. Immunohistochemistry
2.8. Reverse Transcription and RT-qPCR Analyses
2.9. RNA Isolation, Library Preparation and Sequencing
2.10. RNA-seq Data Analysis
2.11. Statistical Analysis
3. Results
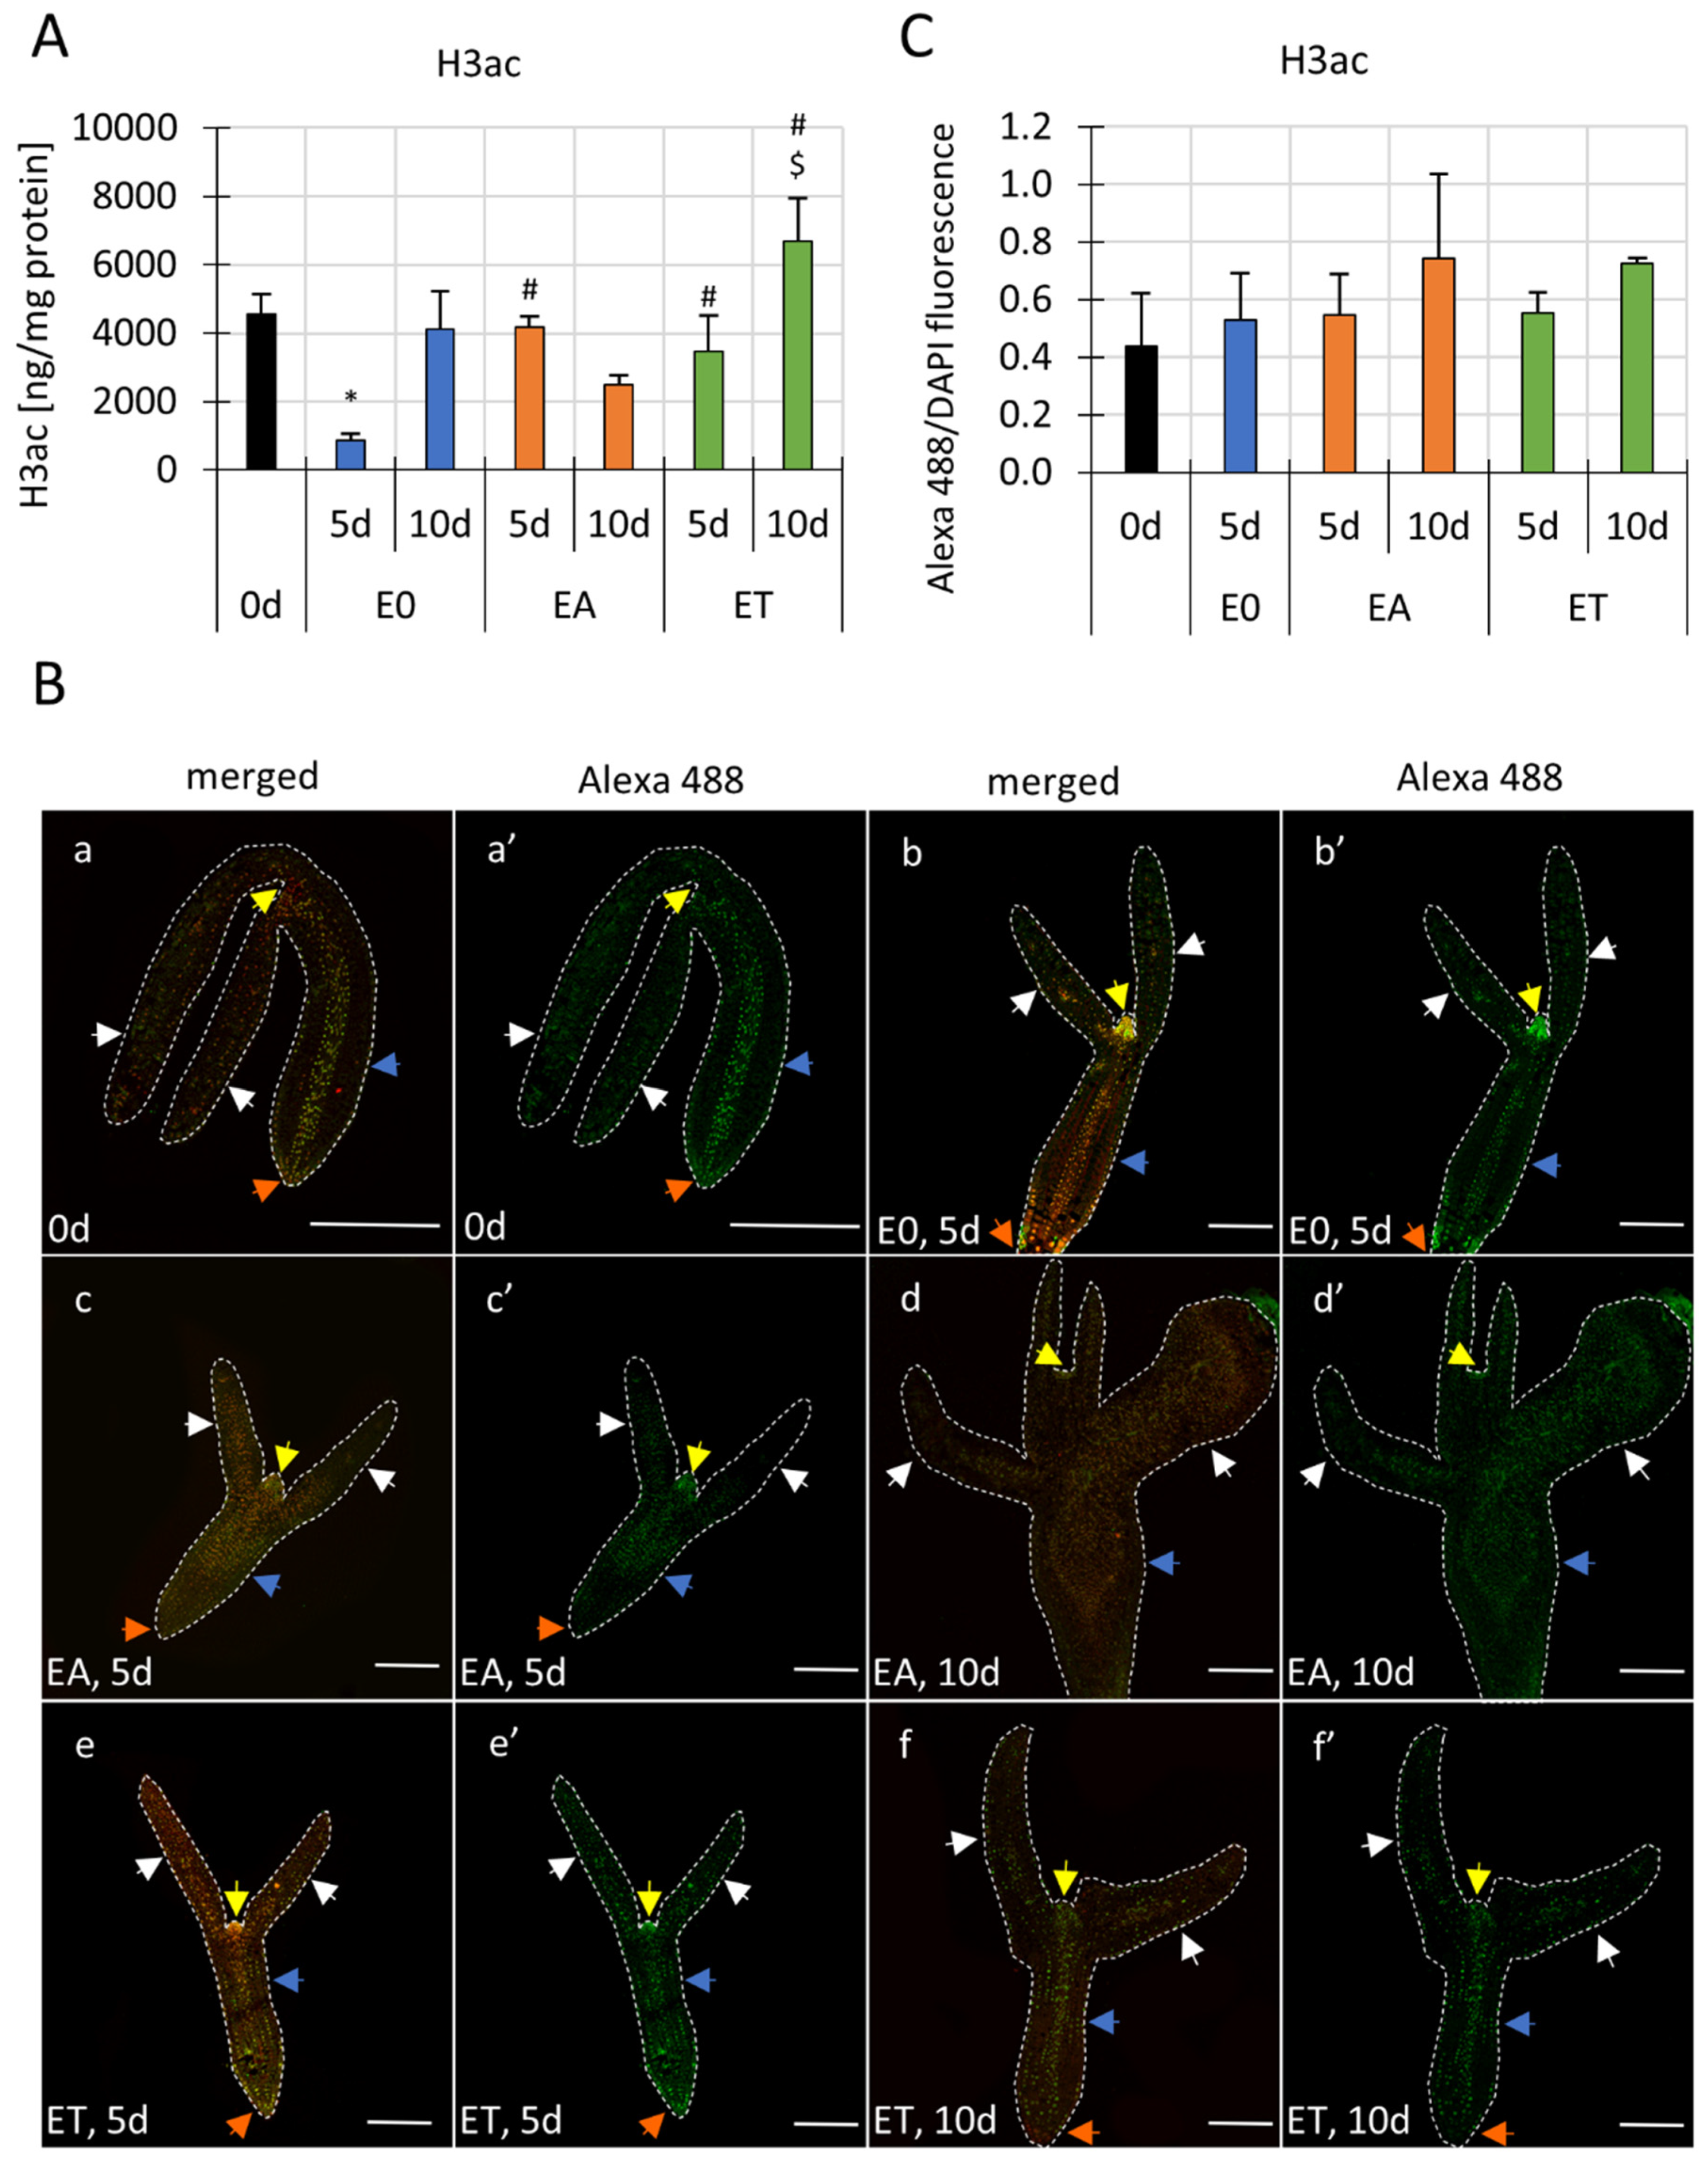
3.1. An Increased H3ac Level Accompanies SE Induction
3.2. The Differential Spatio-Temporal Histone H3ac Pattern in the SE-Induced Explants
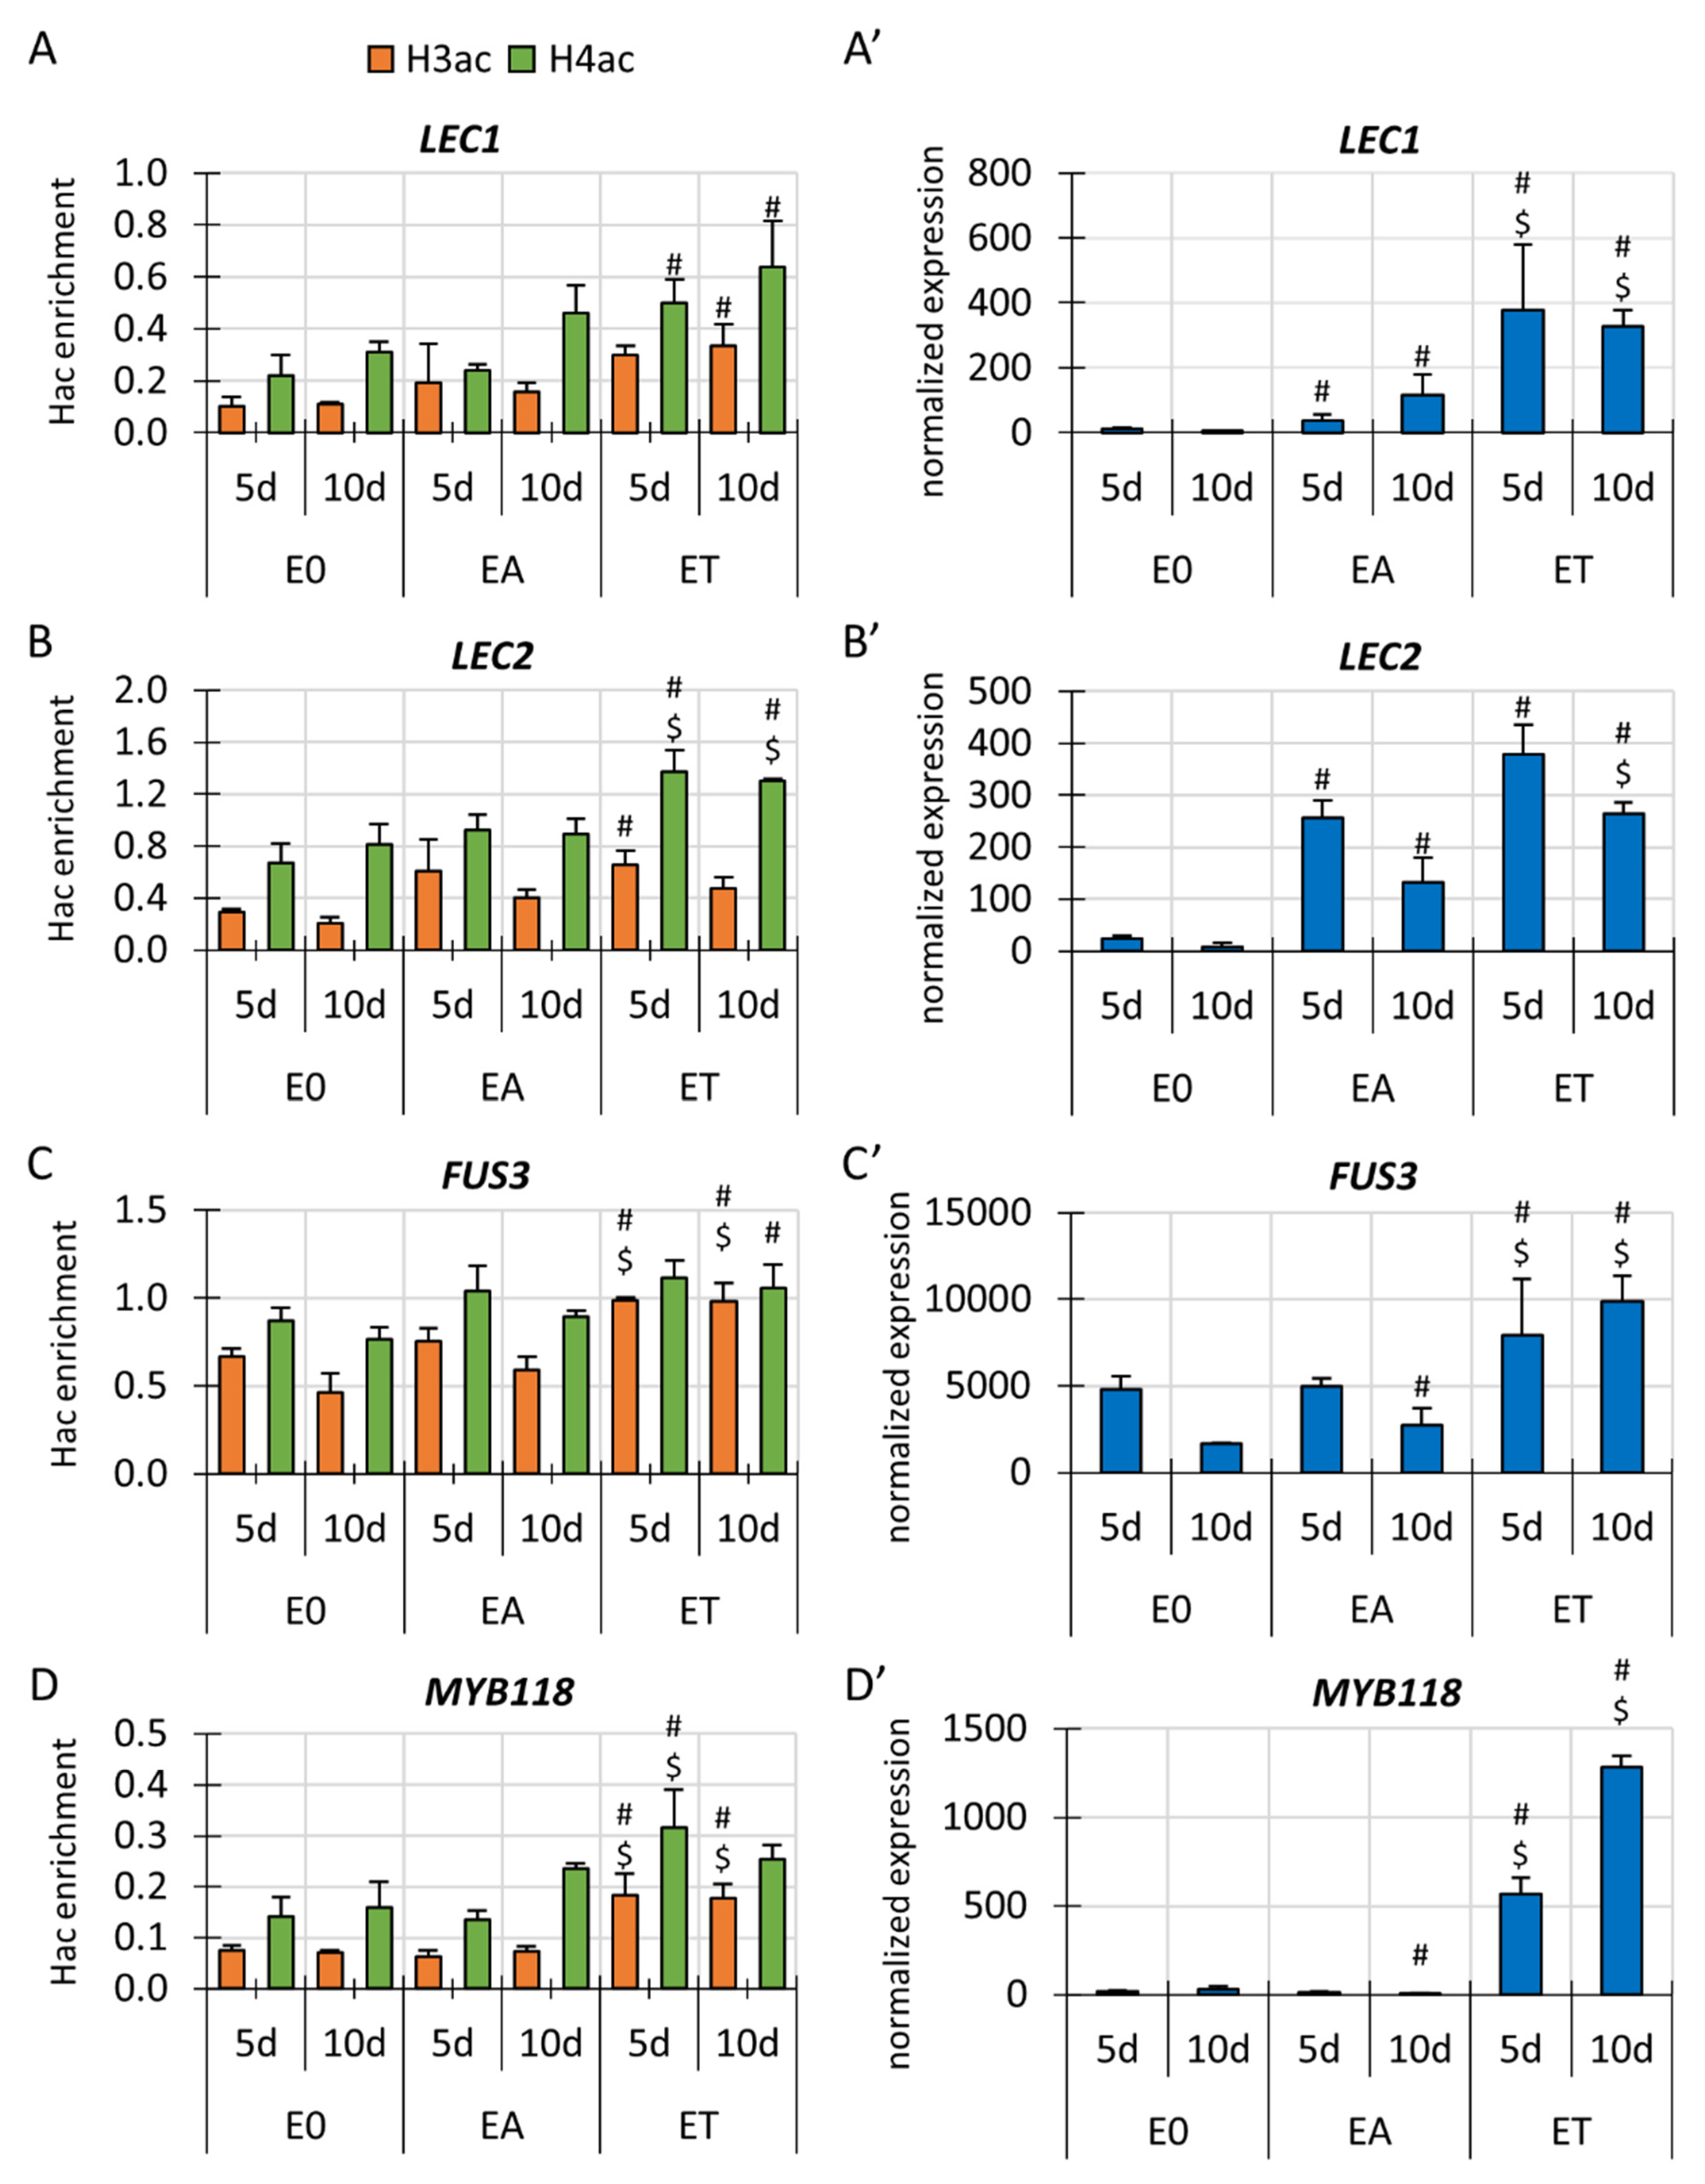
3.3. Changes in H3 and H4 Acetylation in Gene-Bound Chromatin Are Associated with the Differential Transcription of the Key SE-Involved TF Genes in TSA-Induced SE
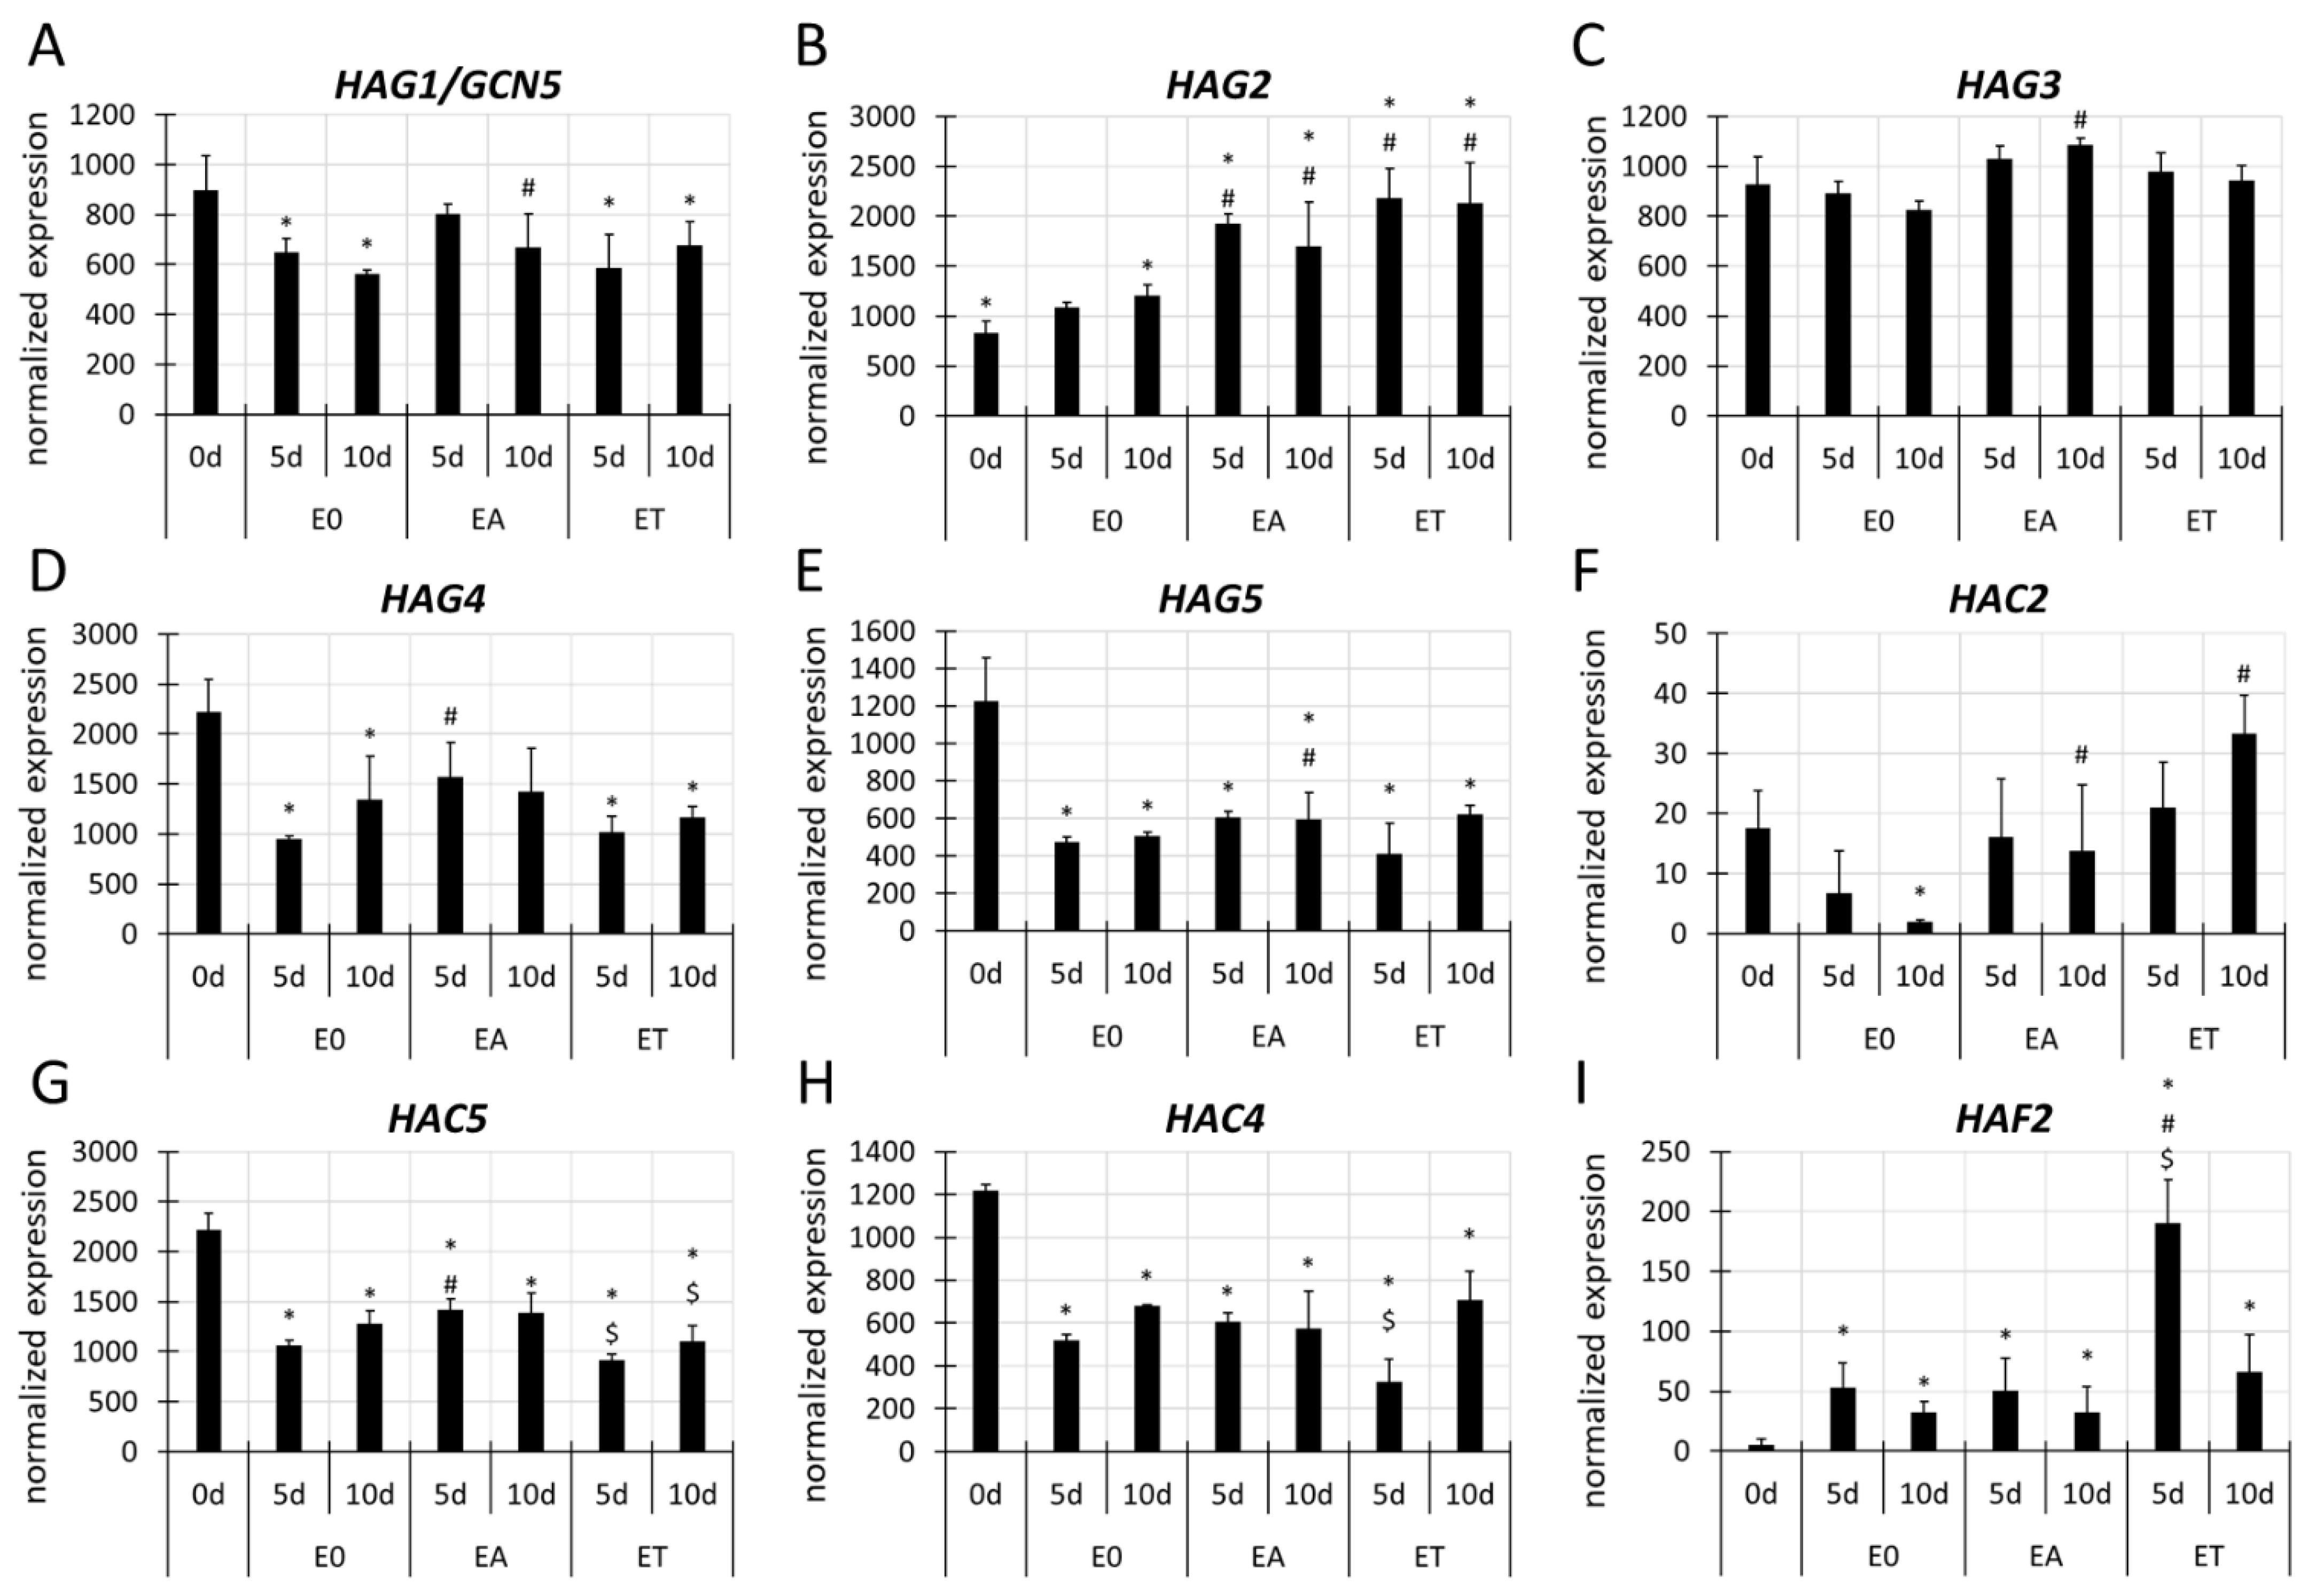
3.4. Different Genes Encoding the Histone Acetyltransferase (HATs) and Deacetylases (HDACs) Are Involved in SE Induction
3.4.1. HAT Genes
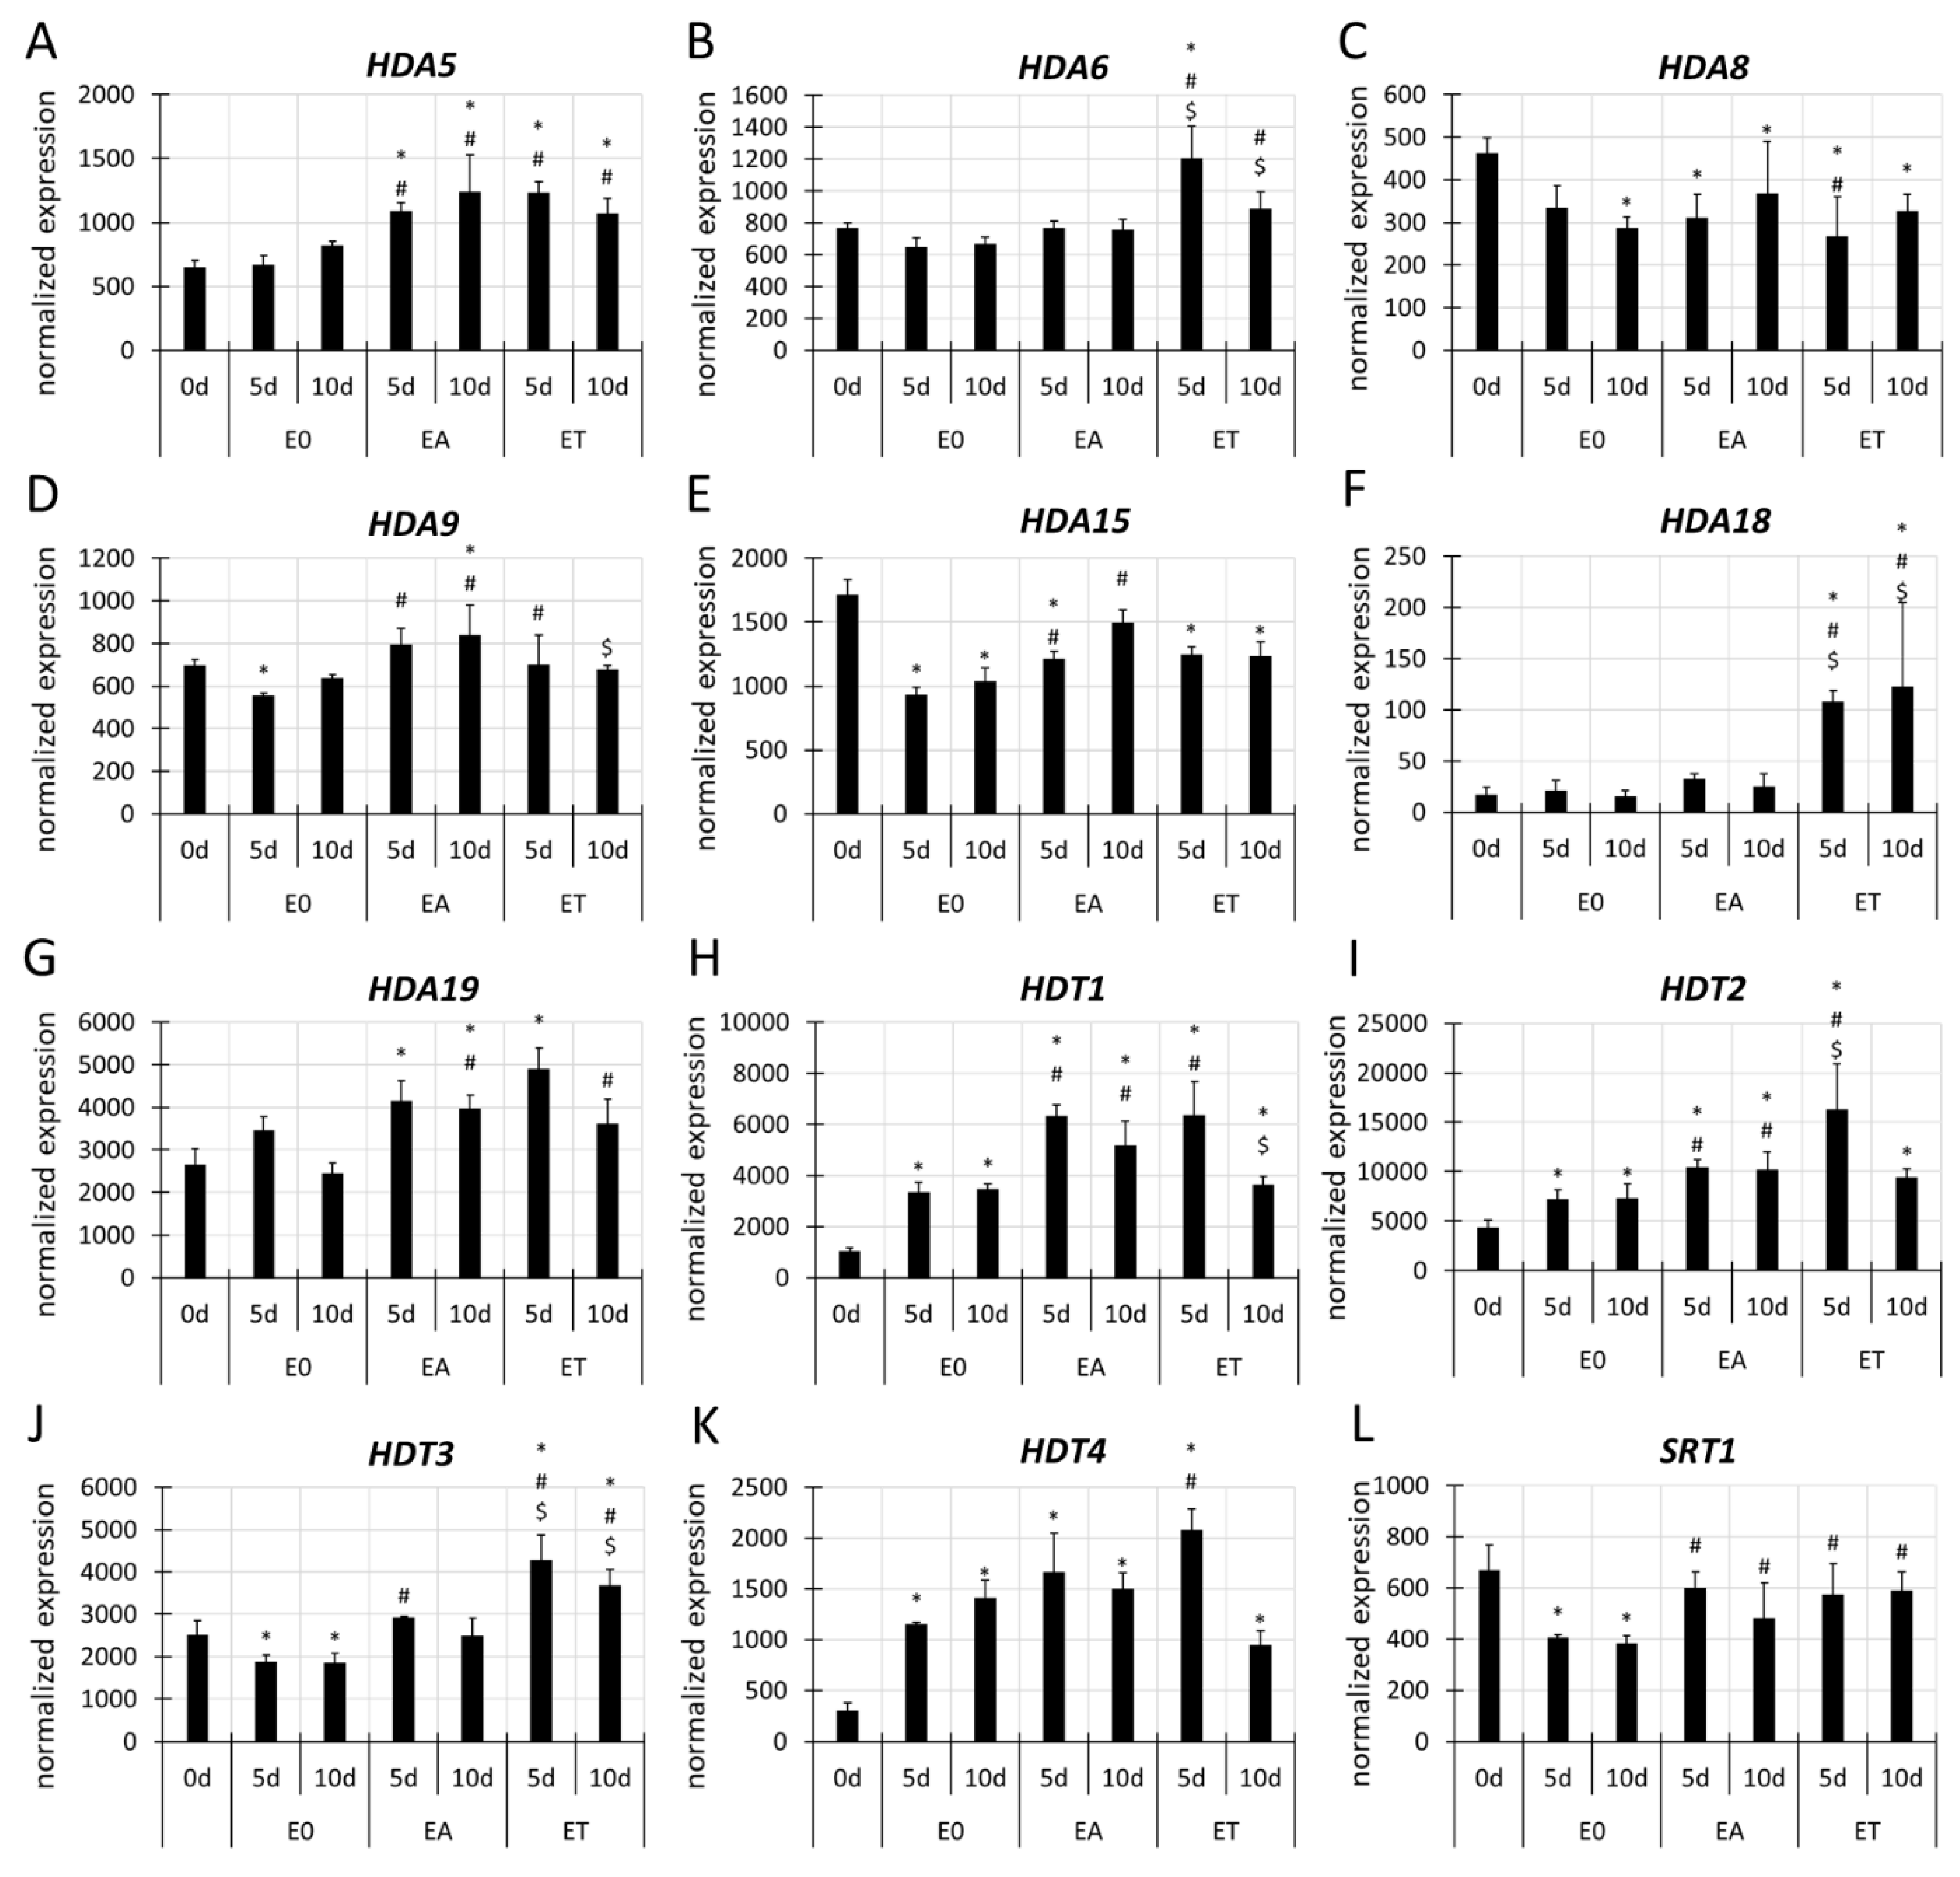
3.4.2. HDAC Genes
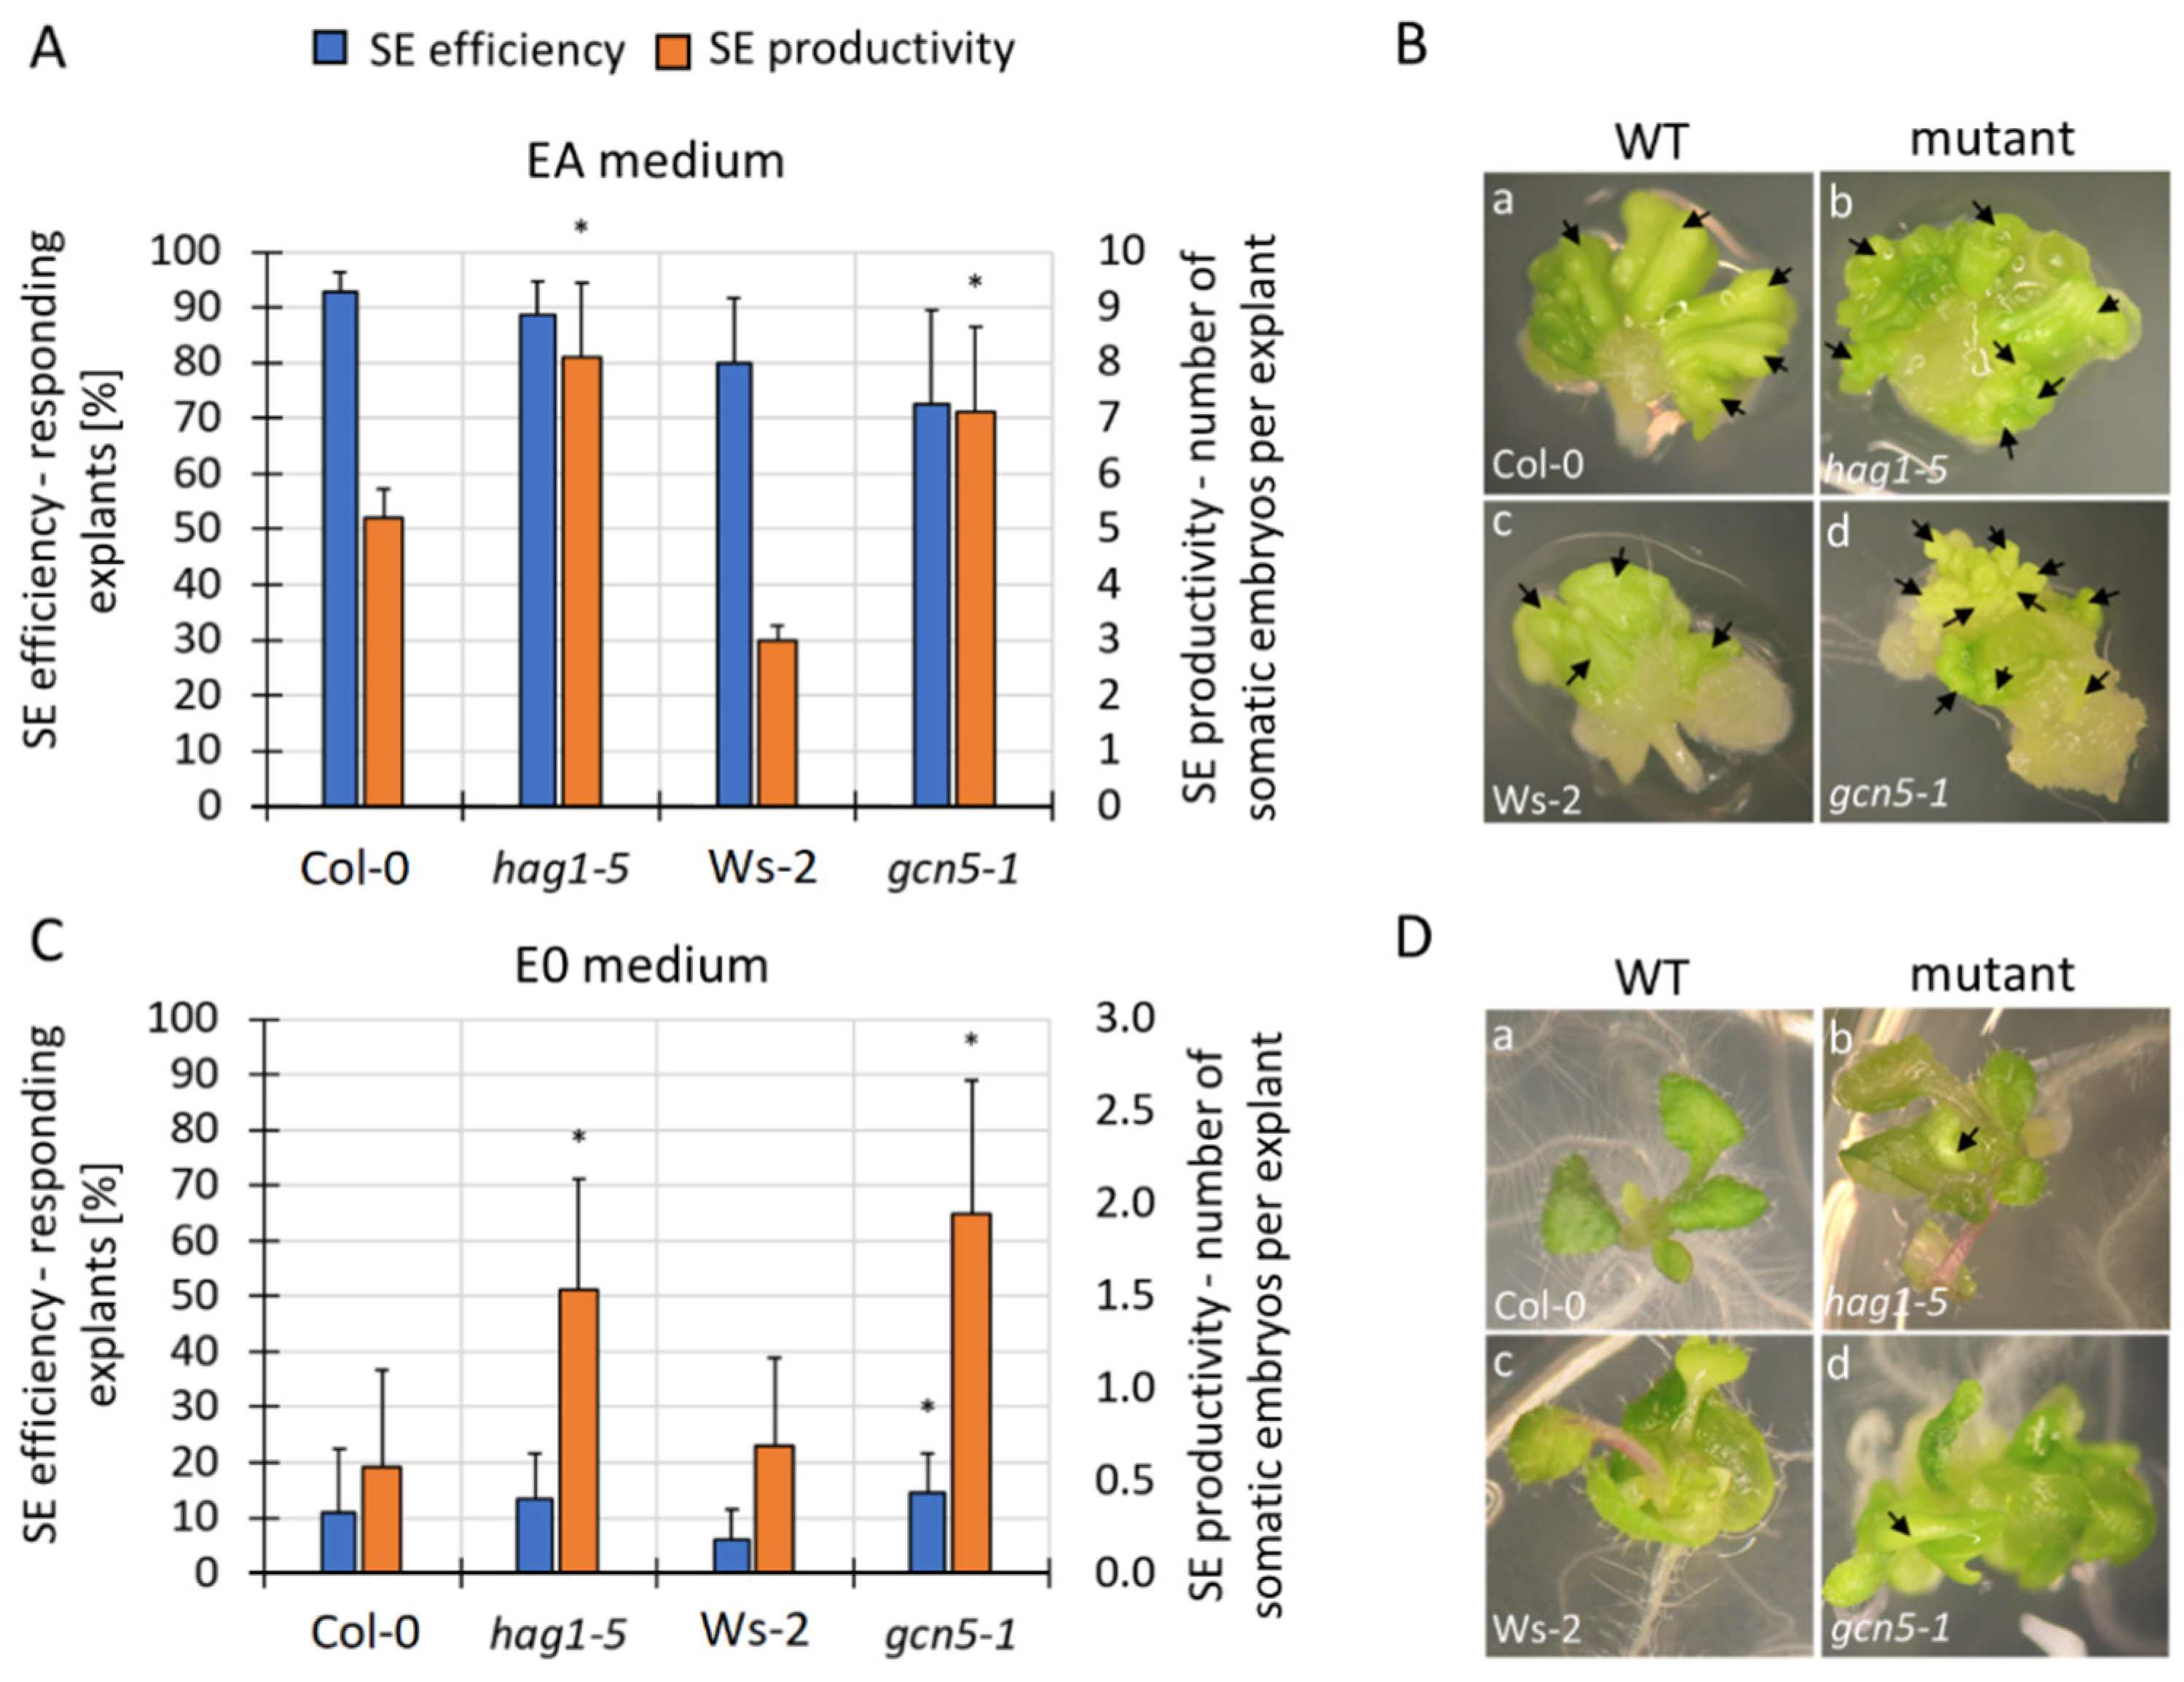
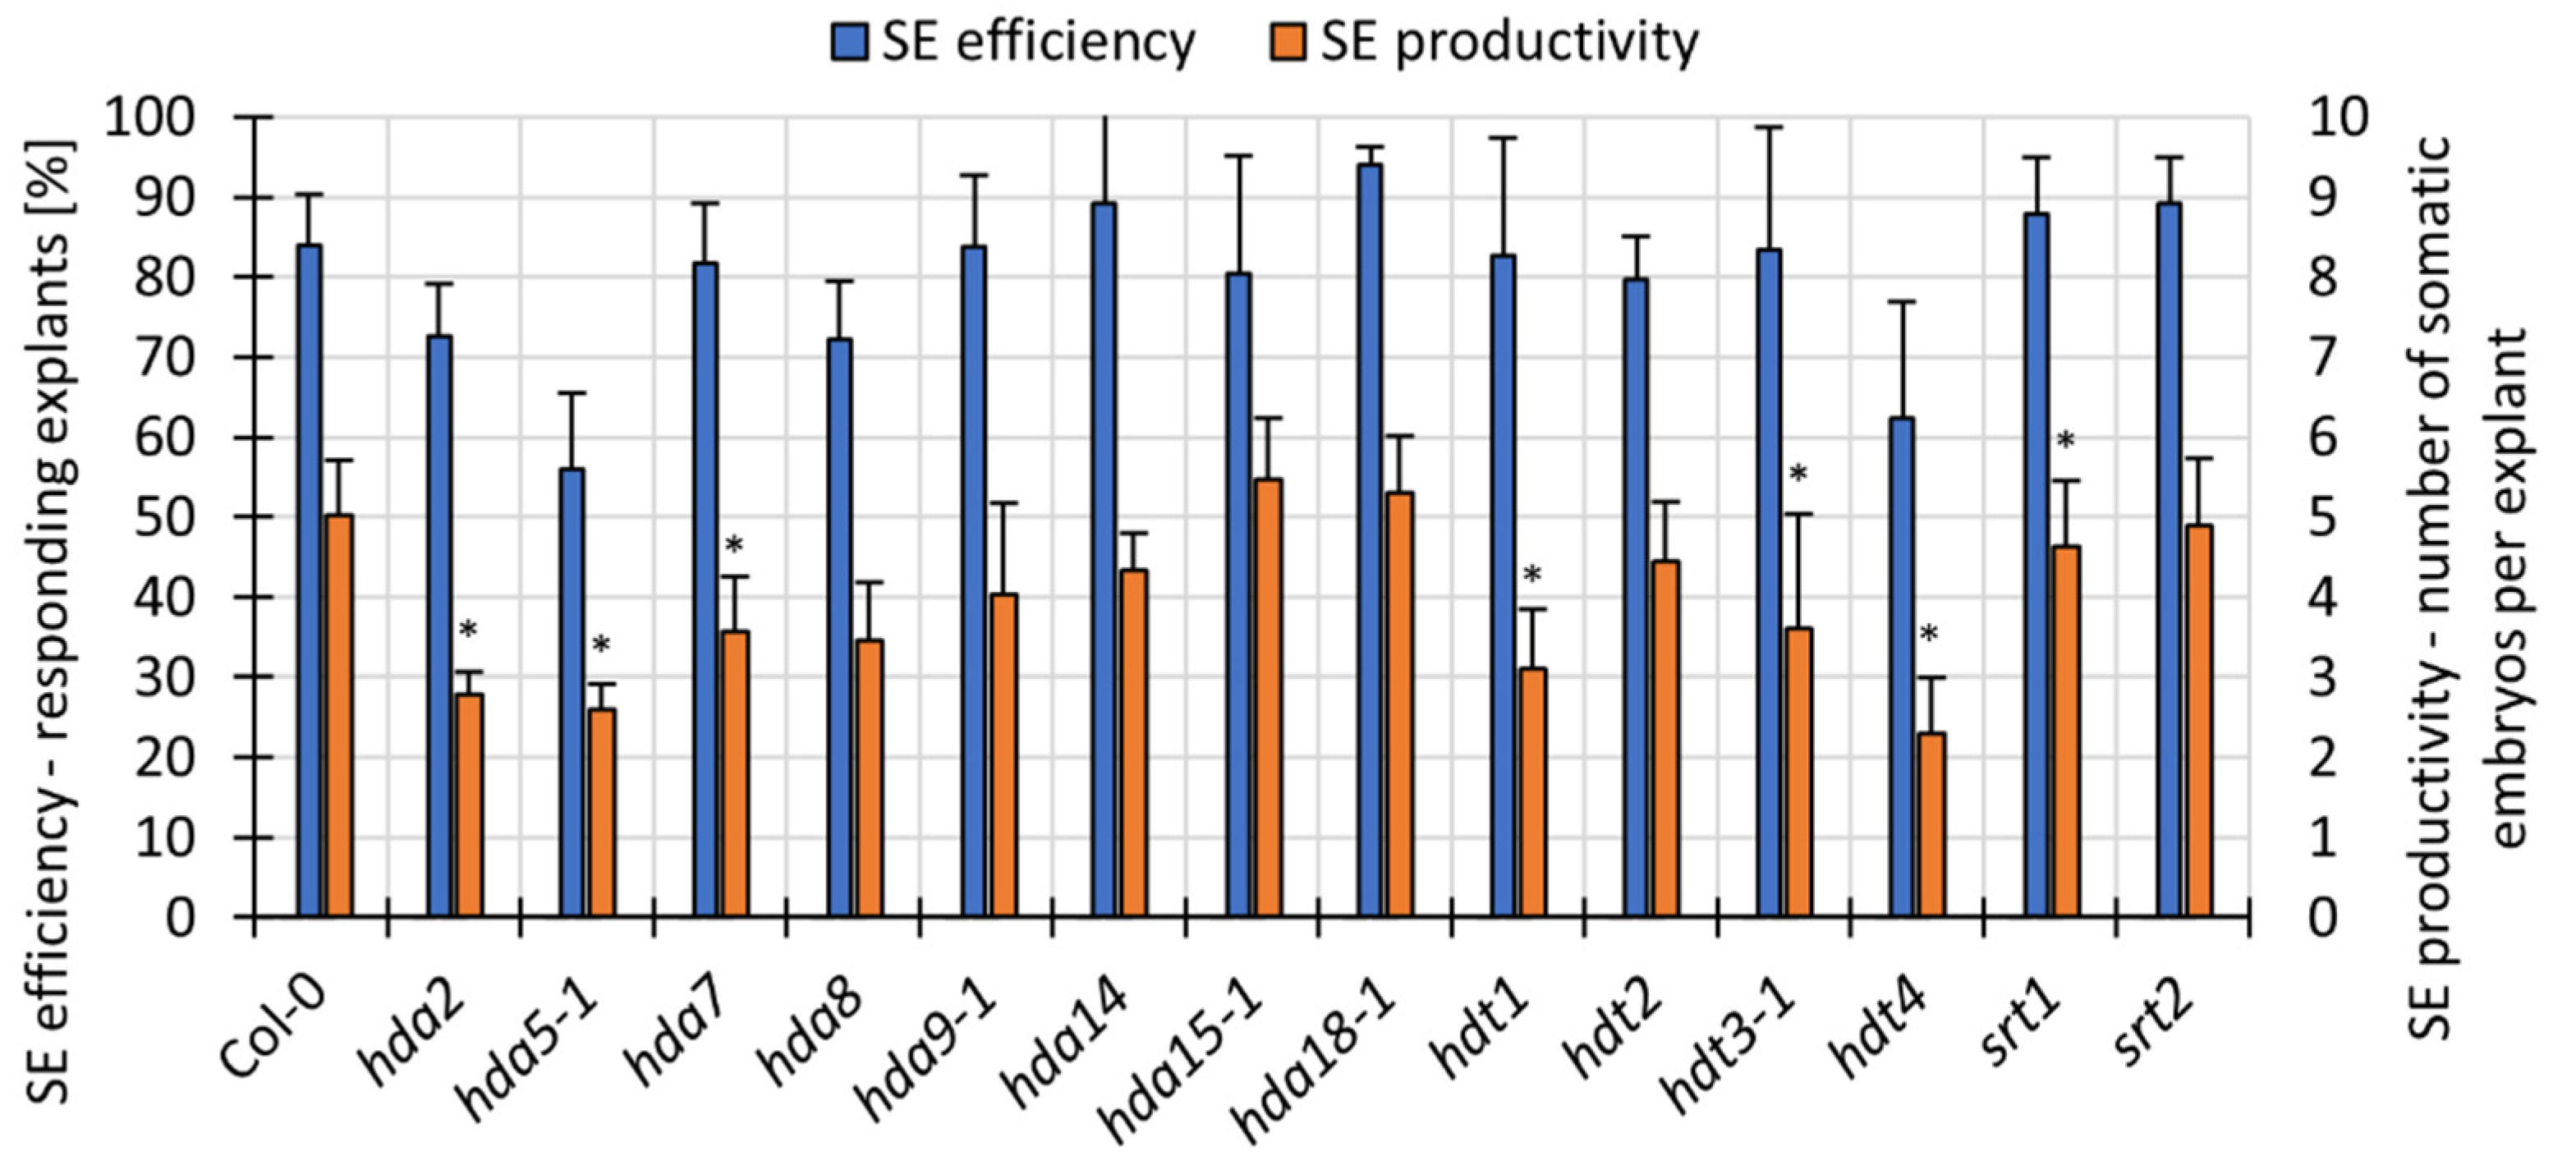
3.5. Mutations in HAT and HDACs Affect the Expression of Essential SE-TF Genes
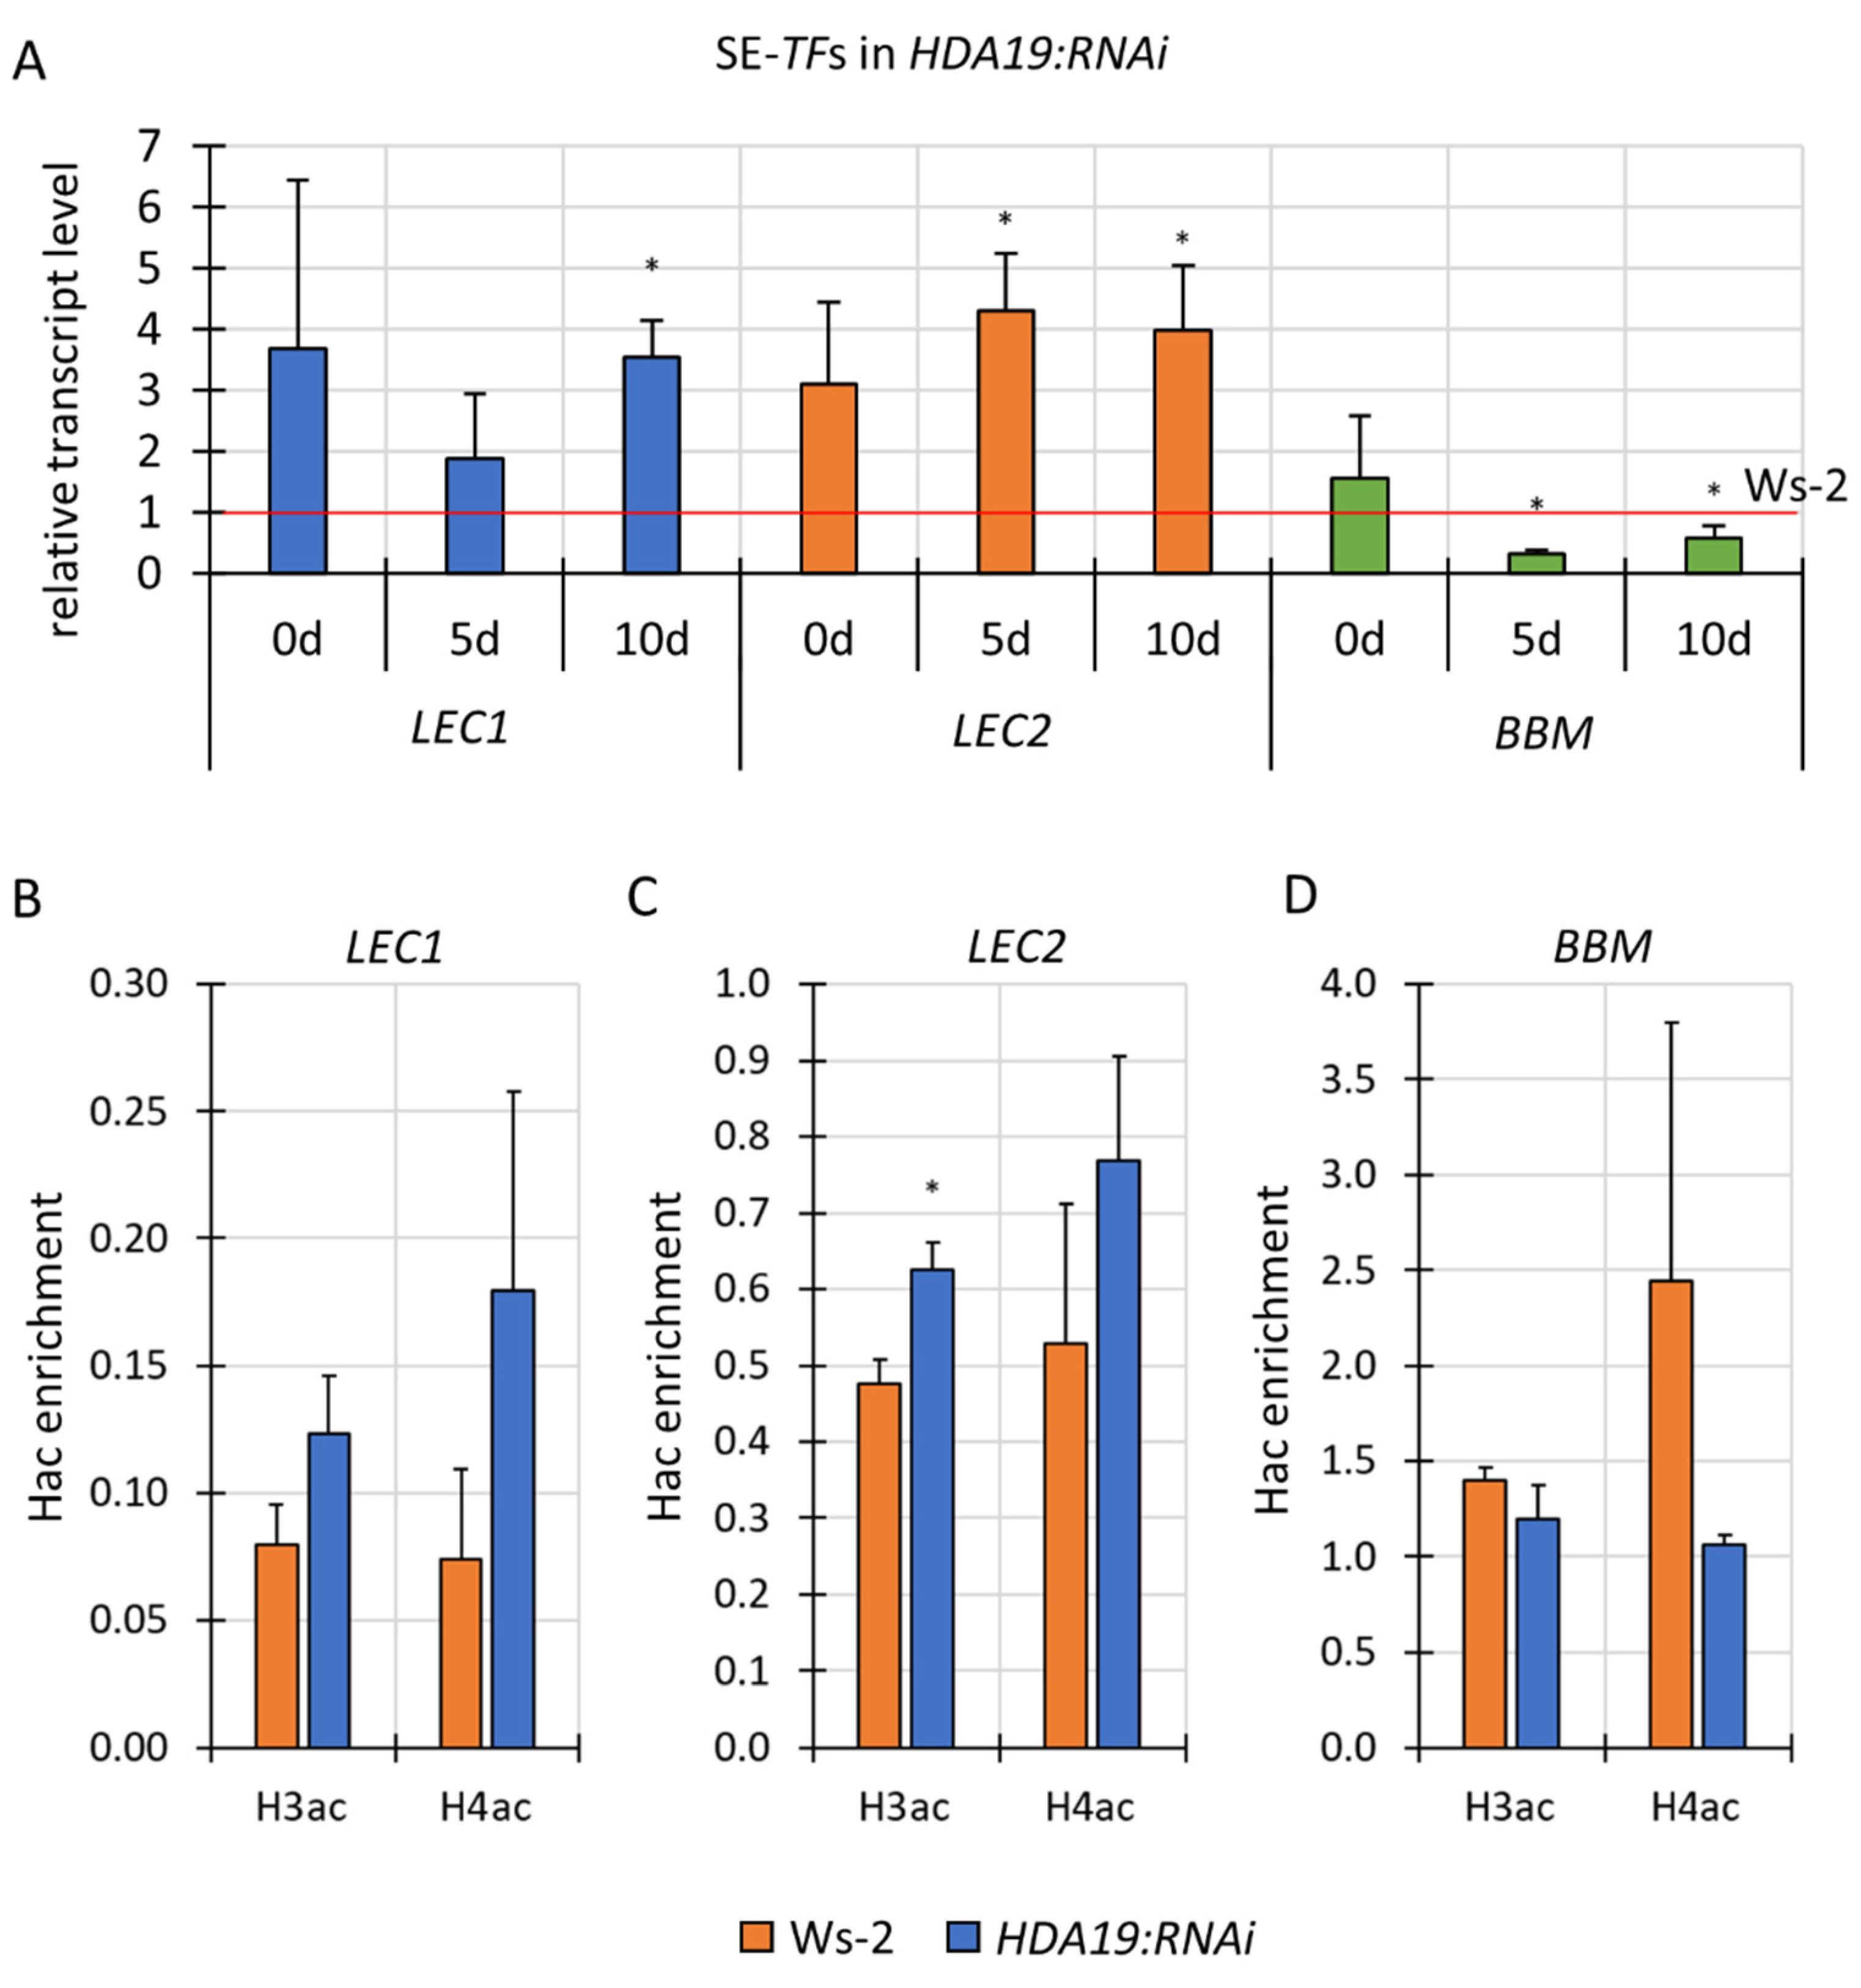
3.6. HDA19 Might Negatively Control LEC2 in SE Induction via Histone Deacetylation
4. Discussion
4.1. Changes in Histone Acetylation Accompany SE Induction
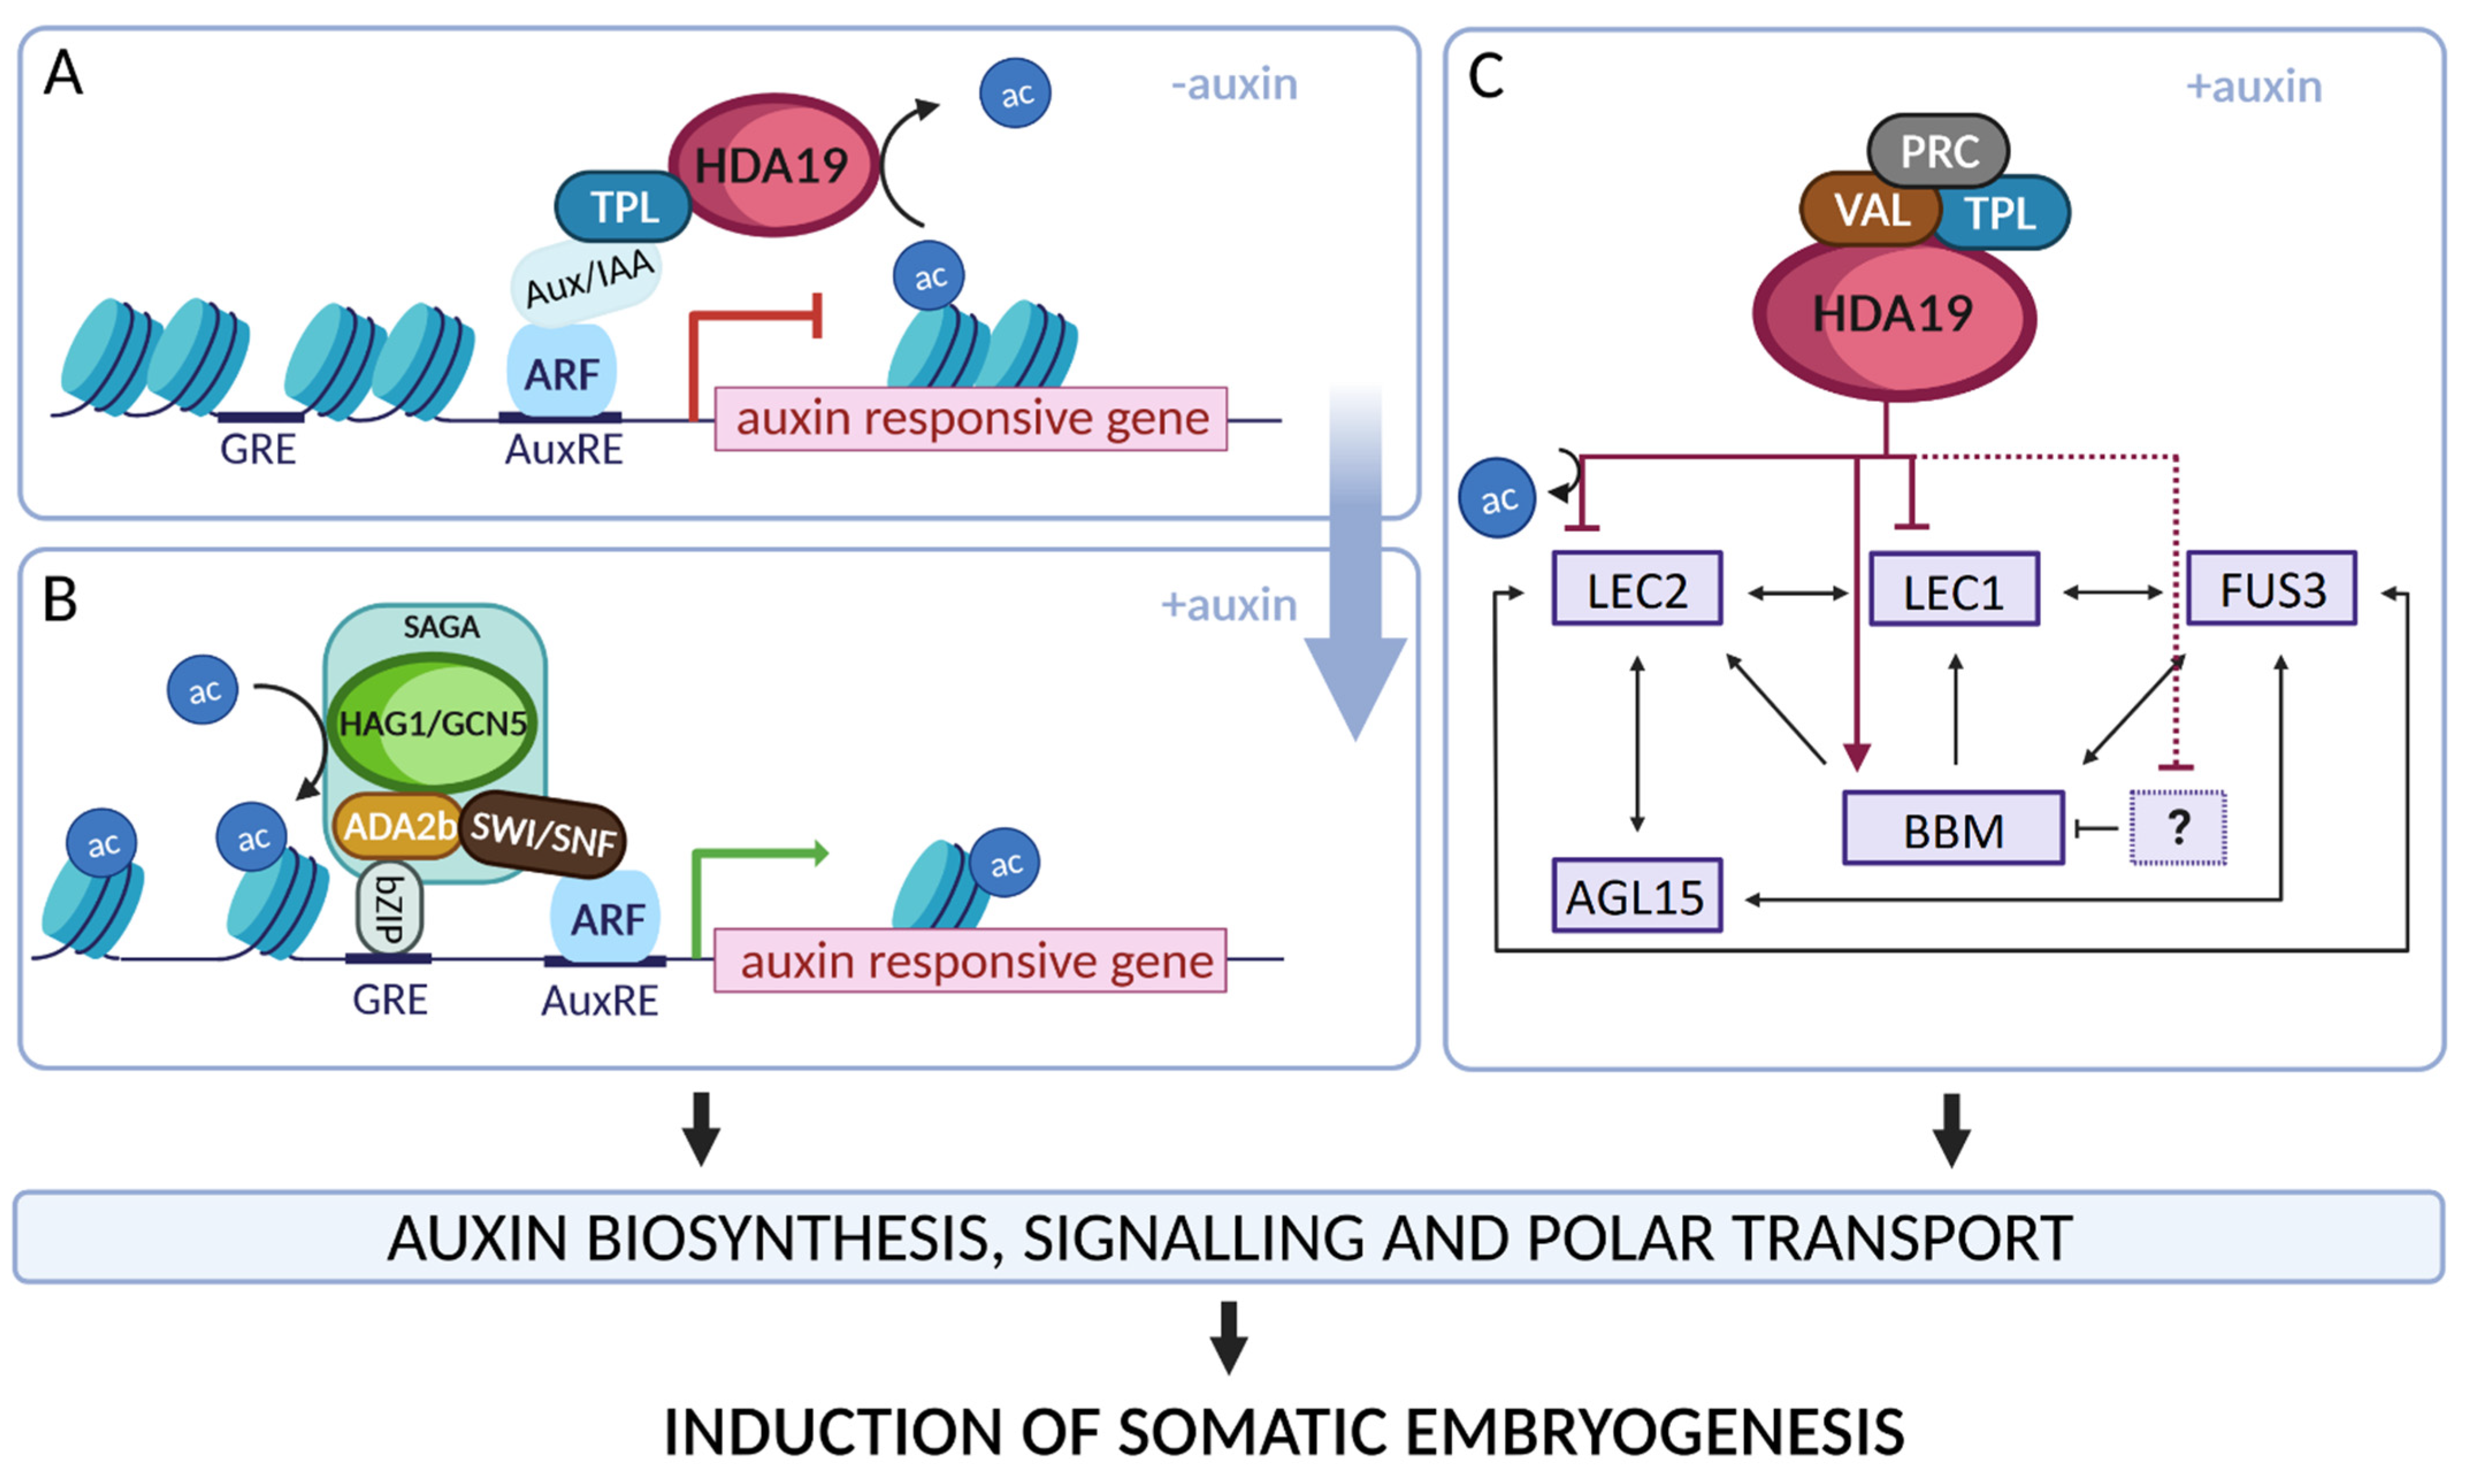
4.2. Hac Controls LEC1, LEC2 and BBM during TSA-Induced Embryogenic Reprogramming
4.3. Numerous HATs and HDACs Control SE Induction
5. Conclusions
Supplementary Materials
Author Contributions
Funding
Data Availability Statement
Acknowledgments
Conflicts of Interest
References
- Klemm, S.L.; Shipony, Z.; Greenleaf, W.J. Chromatin accessibility and the regulatory epigenome. Nat. Rev. Genet. 2019, 20, 207–220. [Google Scholar] [CrossRef] [PubMed]
- Zentner, G.E.; Henikoff, S. Regulation of nucleosome dynamics by histone modifications. Nat. Struct. Mol. Biol. 2013, 20, 259–266. [Google Scholar] [CrossRef] [PubMed]
- Verdin, E.; Ott, M. 50 years of protein acetylation: From gene regulation to epigenetics, metabolism and beyond. Nat. Rev. Mol. Cell. Biol. 2015, 16, 258–264. [Google Scholar] [CrossRef]
- Lu, L.; Chen, X.; Sanders, D.; Qian, S.; Zhong, X. High-resolution mapping of H4K16 and H3K23 acetylation reveals conserved and unique distribution patterns in Arabidopsis and rice. Epigenetics 2015, 10, 1044–1053. [Google Scholar] [CrossRef] [Green Version]
- Wang, L.; Zhang, F.; Rode, S.; Chin, K.K.; Ko, E.E.; Kim, J.; Iyer, V.R.; Qiao, H. Ethylene induces combinatorial effects of histone H3 acetylation in gene expression in Arabidopsis. BMC Genom. 2017, 18, 538. [Google Scholar] [CrossRef] [PubMed]
- Lee, K.K.; Workman, J.L. Histone acetyltransferase complexes: One size doesn’t fit all. Nat. Rev. Mol. Cell. Biol. 2007, 8, 284–295. [Google Scholar] [CrossRef]
- Park, S.Y.; Kim, J.S. A short guide to histone deacetylases including recent progress on class II enzymes. Exp. Mol. Med. 2020, 52, 204–212. [Google Scholar] [CrossRef]
- Kumar, V.; Thakur, J.K.; Prasad, M. Histone acetylation dynamics regulating plant development and stress responses. Cell. Mol. Life Sci. 2021, 78, 4467–4486. [Google Scholar] [CrossRef]
- Narita, T.; Weinert, B.T.; Choudhary, C. Functions and mechanisms of non-histone protein acetylation. Nat. Rev. Mol. Cell. Biol. 2019, 20, 156–174. [Google Scholar] [CrossRef]
- Wang, F.X.; Shang, G.D.; Wu, L.Y.; Xu, Z.G.; Zhao, X.Y.; Wang, J.W. Chromatin accessibility dynamics and a hierarchical transcriptional regulatory network structure for plant somatic embryogenesis. Dev. Cell. 2020, 54, 742–757 e748. [Google Scholar] [CrossRef]
- Kinoshita, M.; Barber, M.; Mansfield, W.; Cui, Y.; Spindlow, D.; Stirparo, G.G.; Dietmann, S.; Nichols, J.; Smith, A. Capture of mouse and human stem cells with features of formative pluripotency. Cell Stem Cell 2021, 28, 453–471 e458. [Google Scholar] [CrossRef] [PubMed]
- Chen, T.; Dent, S.Y. Chromatin modifiers and remodellers: Regulators of cellular differentiation. Nat. Rev. Genet. 2014, 15, 93–106. [Google Scholar] [CrossRef] [PubMed] [Green Version]
- Ikeuchi, M.; Favero, D.S.; Sakamoto, Y.; Iwase, A.; Coleman, D.; Rymen, B.; Sugimoto, K. Molecular mechanisms of plant regeneration. Annu. Rev. Plant Biol. 2019, 70, 377–406. [Google Scholar] [CrossRef] [PubMed]
- Loyola-Vargas, V.M.; De-la-Peña, C.; Galaz-Avalos, R.; Quiroz-Figueroa, F.R. Plant tissue culture. In Molecular Biomethods Handbook, 2nd ed.; Walker, J.M., Rapley, R., Eds.; Humana Press: Totowa, NJ, USA, 2008; pp. 875–904. [Google Scholar]
- Birnbaum, K.D.; Roudier, F. Epigenetic memory and cell fate reprogramming in plants. Regeneration 2017, 4, 15–20. [Google Scholar] [CrossRef]
- Wójcikowska, B.; Wójcik, A.M.; Gaj, M.D. Epigenetic regulation of auxin-induced somatic embryogenesis in plants. Int. J. Mol. Sci. 2020, 21, 2307. [Google Scholar] [CrossRef] [Green Version]
- Osorio-Montalvo, P.; Saenz-Carbonell, L.; De-la-Pena, C. 5-azacytidine: A promoter of epigenetic changes in the quest to improve plant somatic embryogenesis. Int. J. Mol. Sci. 2018, 19, 3182. [Google Scholar] [CrossRef] [Green Version]
- Chakrabarty, D.; Yu, K.W.; Paek, K.Y. Detection of DNA methylation changes during somatic embryogenesis of Siberian ginseng (Eleuterococcus senticosus). Plant Sci. 2003, 165, 61–68. [Google Scholar] [CrossRef]
- Nic-Can, G.I.; Lopez-Torres, A.; Barredo-Pool, F.; Wrobel, K.; Loyola-Vargas, V.M.; Rojas-Herrera, R.; De-la-Pena, C. New insights into somatic embryogenesis: LEAFY COTYLEDON1, BABY BOOM1 and WUSCHEL-RELATED HOMEOBOX4 are epigenetically regulated in Coffea canephora. PLoS ONE 2013, 8, e72160. [Google Scholar] [CrossRef] [Green Version]
- Grzybkowska, D.; Nowak, K.; Gaj, M.D. Hypermethylation of auxin-responsive motifs in the promoters of the transcription factor genes accompanies the somatic embryogenesis induction in Arabidopsis. Int. J. Mol. Sci. 2020, 21, 6849. [Google Scholar] [CrossRef]
- Li, W.; Liu, H.; Cheng, Z.J.; Su, Y.H.; Han, H.N.; Zhang, Y.; Zhang, X.S. DNA methylation and histone modifications regulate de novo shoot regeneration in Arabidopsis by modulating WUSCHEL expression and auxin signaling. PLoS Genet. 2011, 7, e1002243. [Google Scholar] [CrossRef] [Green Version]
- Du, J.; Johnson, L.M.; Jacobsen, S.E.; Patel, D.J. DNA methylation pathways and their crosstalk with histone methylation. Nat. Rev. Mol. Cell. Biol. 2015, 16, 519–532. [Google Scholar] [CrossRef] [PubMed] [Green Version]
- Ishihara, H.; Sugimoto, K.; Tarr, P.T.; Temman, H.; Kadokura, S.; Inui, Y.; Sakamoto, T.; Sasaki, T.; Aida, M.; Suzuki, T.; et al. Primed histone demethylation regulates shoot regenerative competency. Nat. Commun. 2019, 10, 1786. [Google Scholar] [CrossRef] [PubMed] [Green Version]
- Lee, K.; Seo, P.J. Dynamic epigenetic changes during plant regeneration. Trends Plant Sci. 2018, 23, 235–247. [Google Scholar] [CrossRef] [PubMed]
- Lee, K.; Park, O.S.; Jung, S.J.; Seo, P.J. Histone deacetylation-mediated cellular dedifferentiation in Arabidopsis. J. Plant Physiol. 2016, 191, 95–100. [Google Scholar] [CrossRef]
- Kim, J.Y.; Yang, W.; Forner, J.; Lohmann, J.U.; Noh, B.; Noh, Y.S. Epigenetic reprogramming by histone acetyltransferase HAG1/AtGCN5 is required for pluripotency acquisition in Arabidopsis. EMBO J. 2018, 37, e98726. [Google Scholar] [CrossRef]
- Rymen, B.; Kawamura, A.; Lambolez, A.; Inagaki, S.; Takebayashi, A.; Iwase, A.; Sakamoto, Y.; Sako, K.; Favero, D.S.; Ikeuchi, M.; et al. Histone acetylation orchestrates wound-induced transcriptional activation and cellular reprogramming in Arabidopsis. Commun. Biol. 2019, 2, 404. [Google Scholar] [CrossRef] [Green Version]
- Zhang, H.; Guo, F.; Qi, P.; Huang, Y.; Xie, Y.; Xu, L.; Han, N.; Xu, L.; Bian, H. OsHDA710-mediated histone deacetylation regulates callus formation of rice mature embryo. Plant Cell. Physiol. 2020, 61, 1646–1660. [Google Scholar] [CrossRef]
- Wickramasuriya, A.M.; Dunwell, J.M. Global scale transcriptome analysis of Arabidopsis embryogenesis in vitro. BMC Genom. 2015, 16, 301. [Google Scholar] [CrossRef] [Green Version]
- Li, H.-L.; Guo, D.; Zhu, J.-H.; Wang, Y.; Peng, S.-Q. Identification and expression analysis of genes involved in histone acetylation in Hevea brasiliensis. Tree Genet. Genomes 2017, 13, 98. [Google Scholar] [CrossRef]
- Rodriguez-Sanz, H.; Moreno-Romero, J.; Solis, M.T.; Kohler, C.; Risueno, M.C.; Testillano, P.S. Changes in histone methylation and acetylation during microspore reprogramming to embryogenesis occur concomitantly with Bn HKMT and Bn HAT expression and are associated with cell totipotency, proliferation, and differentiation in Brassica napus. Cytogenet. Genome Res. 2014, 143, 209–218. [Google Scholar] [CrossRef] [Green Version]
- Valledor, L.; Meijon, M.; Hasbun, R.; Jesus Canal, M.; Rodriguez, R. Variations in DNA methylation, acetylated histone H4, and methylated histone H3 during Pinus radiata needle maturation in relation to the loss of in vitro organogenic capability. J. Plant Physiol. 2010, 167, 351–357. [Google Scholar] [CrossRef]
- Finnin, M.S.; Donigian, J.R.; Cohen, A.; Richon, V.M.; Rifkind, R.A.; Marks, P.A.; Breslow, R.; Pavletich, N.P. Structures of a histone deacetylase homologue bound to the TSA and SAHA inhibitors. Nature 1999, 401, 188–193. [Google Scholar] [CrossRef]
- Abrahamsson, M.; Valladares, S.; Merino, I.; Larsson, E.; von Arnold, S. Degeneration pattern in somatic embryos of Pinus sylvestris L. Vitr. Cell. Dev. Biol. Plant 2017, 53, 86–96. [Google Scholar] [CrossRef] [Green Version]
- Wang, H.; Enns, J.; Nelson, K.; Brost, J.; Orr, T.; Ferrie, A. Improving the efficiency of wheat microspore culture methodology: Evaluation of pretreatments, gradients, and epigenetic chemicals. Plant Cell Tissue Organ. Cult. 2019, 139, 589–599. [Google Scholar] [CrossRef]
- Martinez, O.; Arjones, V.; Gonzalez, M.V.; Rey, M. Histone deacetylase inhibitors increase the embryogenic potential and alter the expression of embryogenesis-related and HDAC-encoding genes in grapevine (Vitis vinifera L., cv. Mencia). Plants 2021, 10, 1164. [Google Scholar] [CrossRef]
- Tanaka, M.; Kikuchi, A.; Kamada, H. The Arabidopsis histone deacetylases HDA6 and HDA19 contribute to the repression of embryonic properties after germination. Plant Physiol. 2008, 146, 149–161. [Google Scholar] [CrossRef] [Green Version]
- Wójcikowska, B.; Botor, M.; Morończyk, J.; Wójcik, A.M.; Nodzyński, T.; Karcz, J.; Gaj, M.D. Trichostatin A triggers an embryogenic transition in Arabidopsis explants via an auxin-related pathway. Front. Plant Sci. 2018, 9, 1353. [Google Scholar] [CrossRef]
- Salaun, C.; Lepiniec, L.; Dubreucq, B. Genetic and molecular control of somatic embryogenesis. Plants 2021, 10, 1467. [Google Scholar] [CrossRef]
- Tian, R.; Paul, P.; Joshi, S.; Perry, S.E. Genetic activity during early plant embryogenesis. Biochem. J. 2020, 477, 3743–3767. [Google Scholar] [CrossRef]
- Lotan, T.; Ohto, M.-A.; Yee, K.M.; West, M.A.; Lo, R.; Kwong, R.W.; Yamagishi, K.; Fischer, R.L.; Goldberg, R.B.; Harada, J.J. Arabidopsis LEAFY COTYLEDON1 is sufficient to induce embryo development in vegetative cells. Cell 1998, 93, 1195–1205. [Google Scholar] [CrossRef] [Green Version]
- Stone, S.L.; Kwong, L.W.; Yee, K.M.; Pelletier, J.; Lepiniec, L.; Fischer, R.L.; Goldberg, R.B.; Harada, J.J. LEAFY COTYLEDON2 encodes a B3 domain transcription factor that induces embryo development. Proc. Natl. Acad. Sci. USA 2001, 98, 11806–11811. [Google Scholar] [CrossRef] [Green Version]
- Stone, S.L.; Braybrook, S.A.; Paula, S.L.; Kwong, L.W.; Meuser, J.; Pelletier, J.; Hsieh, T.-F.; Fischer, R.L.; Goldberg, R.B.; Harada, J.J. Arabidopsis LEAFY COTYLEDON2 induces maturation traits and auxin activity: Implications for somatic embryogenesis. Proc. Natl. Acad. Sci. USA 2008, 105, 3151–3156. [Google Scholar] [CrossRef] [Green Version]
- Junker, A.; Monke, G.; Rutten, T.; Keilwagen, J.; Seifert, M.; Thi, T.M.; Renou, J.P.; Balzergue, S.; Viehover, P.; Hahnel, U.; et al. Elongation-related functions of LEAFY COTYLEDON1 during the development of Arabidopsis thaliana. Plant J. 2012, 71, 427–442. [Google Scholar] [CrossRef] [Green Version]
- Wójcikowska, B.; Jaskóła, K.; Gąsiorek, P.; Meus, M.; Nowak, K.; Gaj, M.D. LEAFY COTYLEDON2 (LEC2) promotes embryogenic induction in somatic tissues of Arabidopsis, via YUCCA-mediated auxin biosynthesis. Planta 2013, 238, 425–440. [Google Scholar] [CrossRef] [Green Version]
- Horstman, A.; Li, M.; Heidmann, I.; Weemen, M.; Chen, B.; Muino, J.M.; Angenent, G.C.; Boutilier, K. The BABY BOOM transcription factor activates the LEC1-ABI3-FUS3-LEC2 network to induce somatic embryogenesis. Plant Physiol. 2017, 175, 848–857. [Google Scholar] [CrossRef] [PubMed] [Green Version]
- Braybrook, S.A.; Harada, J.J. LECs go crazy in embryo development. Trends Plant Sci. 2008, 13, 624–630. [Google Scholar] [CrossRef]
- Wang, H.; Caruso, L.V.; Downie, A.B.; Perry, S.E. The embryo MADS domain protein AGAMOUS-Like 15 directly regulates expression of a gene encoding an enzyme involved in gibberellin metabolism. Plant Cell 2004, 16, 1206–1219. [Google Scholar] [CrossRef] [Green Version]
- Harding, E.W.; Tang, W.; Nichols, K.W.; Fernandez, D.E.; Perry, S.E. Expression and maintenance of embryogenic potential is enhanced through constitutive expression of AGAMOUS-Like 15. Plant Physiol. 2003, 133, 653–663. [Google Scholar] [CrossRef] [Green Version]
- Zheng, Q.; Zheng, Y.; Ji, H.; Burnie, W.; Perry, S.E. Gene regulation by the AGL15 transcription factor reveals hormone interactions in somatic embryogenesis. Plant Physiol. 2016, 172, 2374–2387. [Google Scholar] [CrossRef] [Green Version]
- Zhang, Y.; Cao, G.; Qu, L.J.; Gu, H. Involvement of an R2R3-MYB transcription factor gene AtMYB118 in embryogenesis in Arabidopsis. Plant Cell. Rep. 2009, 28, 337–346. [Google Scholar] [CrossRef]
- Barthole, G.; To, A.; Marchive, C.; Brunaud, V.; Soubigou-Taconnat, L.; Berger, N.; Dubreucq, B.; Lepiniec, L.; Baud, S. MYB118 represses endosperm maturation in seeds of Arabidopsis. Plant Cell 2014, 26, 3519–3537. [Google Scholar] [CrossRef] [PubMed] [Green Version]
- Wang, X.; Niu, Q.W.; Teng, C.; Li, C.; Mu, J.; Chua, N.H.; Zuo, J. Overexpression of PGA37/MYB118 and MYB115 promotes vegetative-to-embryonic transition in Arabidopsis. Cell. Res. 2009, 19, 224–235. [Google Scholar] [CrossRef] [PubMed] [Green Version]
- Zuo, J.; Niu, Q.W.; Frugis, G.; Chua, N.H. The WUSCHEL gene promotes vegetative-to-embryonic transition in Arabidopsis. Plant J. 2002, 30, 349–359. [Google Scholar] [CrossRef] [PubMed]
- Sablowski, R. Cytokinin and WUSCHEL tie the knot around plant stem cells. Proc. Natl. Acad. Sci. USA 2009, 106, 16016–16017. [Google Scholar] [CrossRef] [Green Version]
- Su, Y.H.; Zhao, X.Y.; Liu, Y.B.; Zhang, C.L.; O’Neill, S.D.; Zhang, X.S. Auxin-induced WUS expression is essential for embryonic stem cell renewal during somatic embryogenesis in Arabidopsis. Plant J. 2009, 59, 448–460. [Google Scholar] [CrossRef] [Green Version]
- Zhou, Y.; Tan, B.; Luo, M.; Li, Y.; Liu, C.; Chen, C.; Yu, C.-W.; Yang, S.; Dong, S.; Ruan, J. HISTONE DEACETYLASE19 interacts with HSL1 and participates in the repression of seed maturation genes in Arabidopsis seedlings. Plant Cell 2013, 25, 134–148. [Google Scholar] [CrossRef] [Green Version]
- Ryu, H.; Cho, H.; Bae, W.; Hwang, I. Control of early seedling development by BES1/TPL/HDA19-mediated epigenetic regulation of ABI3. Nat. Commun. 2014, 5, 4138. [Google Scholar] [CrossRef] [Green Version]
- Chhun, T.; Chong, S.Y.; Park, B.S.; Wong, E.C.; Yin, J.L.; Kim, M.; Chua, N.H. HSI2 repressor recruits MED13 and HDA6 to down-regulate seed maturation gene expression directly during Arabidopsis early seedling growth. Plant Cell Physiol. 2016, 57, 1689–1706. [Google Scholar] [CrossRef] [Green Version]
- Gaj, M.D. Direct somatic embryogenesis as a rapid and efficient system for in vitro regeneration of Arabidopsis thaliana. Plant Cell Tissue Organ. Cult. 2001, 64, 39–46. [Google Scholar] [CrossRef]
- Nowak, K.; Morończyk, J.; Wójcik, A.; Gaj, M.D. AGL15 controls the embryogenic reprogramming of somatic cells in Arabidopsis through the histone acetylation-mediated repression of the miRNA biogenesis genes. Int. J. Mol. Sci. 2020, 21, 6733. [Google Scholar] [CrossRef]
- Untergasser, A.; Nijveen, H.; Rao, X.; Bisseling, T.; Geurts, R.; Leunissen, J.A. Primer3Plus, an enhanced web interface to Primer3. Nucleic Acids Res. 2007, 35, W71–W74. [Google Scholar] [CrossRef] [PubMed] [Green Version]
- Luo, M.; Tai, R.; Yu, C.W.; Yang, S.; Chen, C.Y.; Lin, W.D.; Schmidt, W.; Wu, K. Regulation of flowering time by the histone deacetylase HDA5 in Arabidopsis. Plant J. 2015, 82, 925–936. [Google Scholar] [CrossRef]
- Wójcikowska, B.; Gaj, M.D. Expression profiling of AUXIN RESPONSE FACTOR genes during somatic embryogenesis induction in Arabidopsis. Plant Cell Rep. 2017, 36, 843–858. [Google Scholar] [CrossRef] [PubMed] [Green Version]
- Ruijter, J.M.; Ramakers, C.; Hoogaars, W.M.; Karlen, Y.; Bakker, O.; van den Hoff, M.J.; Moorman, A.F. Amplification efficiency: Linking baseline and bias in the analysis of quantitative PCR data. Nucleic Acids Res. 2009, 37, e45. [Google Scholar] [CrossRef] [PubMed] [Green Version]
- Wolny, E.; Brąszewska-Zalewska, A.; Hasterok, R. Spatial distribution of epigenetic modifications in Brachypodium distachyon embryos during seed maturation and germination. PLoS ONE 2014, 9, e101246. [Google Scholar] [CrossRef] [Green Version]
- Brąszewska-Zalewska, A.; Bernas, T.; Małuszynska, J. Epigenetic chromatin modifications in Brassica genomes. Genome 2010, 53, 203–210. [Google Scholar] [CrossRef]
- Thellin, O.; Zorzi, W.; Lakaye, B.; De Borman, B.; Coumans, B.; Hennen, G.; Grisar, T.; Igout, A.; Heinen, E. Housekeeping genes as internal standards: Use and limits. J. Biotechnol. 1999, 75, 291–295. [Google Scholar] [CrossRef] [Green Version]
- Ewels, P.; Magnusson, M.; Lundin, S.; Kaller, M. MultiQC: Summarize analysis results for multiple tools and samples in a single report. Bioinformatics 2016, 32, 3047–3048. [Google Scholar] [CrossRef] [Green Version]
- Joshi, N.; Fass, J. Sickle: A Sliding-Window, Adaptive, Quality-Based Trimming Tool for FastQ Files; Version 1.33; GitHub: San Francisco, CA, USA, 2011. [Google Scholar]
- Kopylova, E.; Noe, L.; Touzet, H. SortMeRNA: Fast and accurate filtering of ribosomal RNAs in metatranscriptomic data. Bioinformatics 2012, 28, 3211–3217. [Google Scholar] [CrossRef]
- Dobin, A.; Davis, C.A.; Schlesinger, F.; Drenkow, J.; Zaleski, C.; Jha, S.; Batut, P.; Chaisson, M.; Gingeras, T.R. STAR: Ultrafast universal RNA-seq aligner. Bioinformatics 2013, 29, 15–21. [Google Scholar] [CrossRef]
- Lassmann, T.; Hayashizaki, Y.; Daub, C.O. SAMStat: Monitoring biases in next generation sequencing data. Bioinformatics 2011, 27, 130–131. [Google Scholar] [CrossRef] [Green Version]
- Okonechnikov, K.; Conesa, A.; Garcia-Alcalde, F. Qualimap 2: Advanced multi-sample quality control for high-throughput sequencing data. Bioinformatics 2016, 32, 292–294. [Google Scholar] [CrossRef] [PubMed]
- Li, H.; Handsaker, B.; Wysoker, A.; Fennell, T.; Ruan, J.; Homer, N.; Marth, G.; Abecasis, G.; Durbin, R.; Genome Project Data Processing, S. The sequence alignment/map format and SAMtools. Bioinformatics 2009, 25, 2078–2079. [Google Scholar] [CrossRef] [PubMed] [Green Version]
- Thorvaldsdottir, H.; Robinson, J.T.; Mesirov, J.P. Integrative Genomics Viewer (IGV): High-performance genomics data visualization and exploration. Brief. Bioinform. 2013, 14, 178–192. [Google Scholar] [CrossRef] [PubMed] [Green Version]
- Love, M.I.; Huber, W.; Anders, S. Moderated estimation of fold change and dispersion for RNA-seq data with DESeq2. Genome Biol. 2014, 15, 550. [Google Scholar] [CrossRef] [PubMed] [Green Version]
- Benjamini, Y.; Hochberg, Y. Controlling the false discovery rate: A practical and powerful approach to multiple testing. J. R Stat. Soc. Ser. B Stat. Methodol. 1995, 57, 289–300. [Google Scholar] [CrossRef]
- Kurczyńska, E.U.; Gaj, M.D.; Ujczak, A.; Mazur, E. Histological analysis of direct somatic embryogenesis in Arabidopsis thaliana (L.) Heynh. Planta 2007, 226, 619–628. [Google Scholar] [CrossRef]
- Pandey, R.; Müller, A.; Napoli, C.A.; Selinger, D.A.; Pikaard, C.S.; Richards, E.J.; Bender, J.; Mount, D.W.; Jorgensen, R.A. Analysis of histone acetyltransferase and histone deacetylase families of Arabidopsis thaliana suggests functional diversification of chromatin modification among multicellular eukaryotes. Nucleic Acids Res. 2002, 30, 5036–5055. [Google Scholar] [CrossRef] [Green Version]
- Gaspar-Maia, A.; Alajem, A.; Meshorer, E.; Ramalho-Santos, M. Open chromatin in pluripotency and reprogramming. Nat. Rev. Mol. Cell. Biol. 2011, 12, 36–47. [Google Scholar] [CrossRef] [Green Version]
- Sun, L.; Fu, X.; Ma, G.; Hutchins, A.P. Chromatin and epigenetic rearrangements in embryonic stem cell fate transitions. Front. Cell Dev. Biol. 2021, 9, 637309. [Google Scholar] [CrossRef]
- Horstman, A.; Bemer, M.; Boutilier, K. A transcriptional view on somatic embryogenesis. Regeneration 2017, 4, 201–216. [Google Scholar] [CrossRef] [PubMed]
- Khan, I.U.; Ali, A.; Khan, H.A.; Baek, D.; Park, J.; Lim, C.J.; Zareen, S.; Jan, M.; Lee, S.Y.; Pardo, J.M.; et al. PWR/HDA9/ABI4 complex epigenetically regulates ABA dependent drought stress tolerance in Arabidopsis. Front. Plant Sci. 2020, 11, 623. [Google Scholar] [CrossRef] [PubMed]
- Mengel, A.; Ageeva, A.; Georgii, E.; Bernhardt, J.; Wu, K.; Durner, J.; Lindermayr, C. Nitric oxide modulates histone acetylation at stress genes by inhibition of histone deacetylases. Plant Physiol. 2017, 173, 1434–1452. [Google Scholar] [CrossRef] [Green Version]
- Yang, F.; Zhang, L.; Li, J.; Huang, J.; Wen, R.; Ma, L.; Zhou, D.; Li, L. Trichostatin A and 5-azacytidine both cause an increase in global histone H4 acetylation and a decrease in global DNA and H3K9 methylation during mitosis in maize. BMC Plant Biol. 2010, 10, 178. [Google Scholar] [CrossRef] [PubMed] [Green Version]
- Li, H.; Soriano, M.; Cordewener, J.; Muino, J.M.; Riksen, T.; Fukuoka, H.; Angenent, G.C.; Boutilier, K. The histone deacetylase inhibitor trichostatin a promotes totipotency in the male gametophyte. Plant Cell 2014, 26, 195–209. [Google Scholar] [CrossRef] [Green Version]
- Jung, M.; Hoffmann, K.; Brosch, G.; Loidl, P. Analogues of trichostatin A and trapoxin B as histone deacetylase inhibitors. Bioorg. Med. Chem. Lett. 1997, 7, 1655–1658. [Google Scholar] [CrossRef]
- Brosch, G.; Lusser, A.; Goralik-Schramel, M.; Loidl, P. Purification and characterization of a high molecular weight histone deacetylase complex (HD2) of maize embryos. Biochemistry 1996, 35, 15907–15914. [Google Scholar] [CrossRef]
- Rodríguez, J.L.; Valledor, L.; Hasbún, R.; Sánchez, P.; Rodríguez, R.; Cañal, M.J. The effects of hormone treatment on epigenetic marks during organogenesis in Pinus radiata D. Don embryos. J. Plant Growth Regul. 2016, 35, 97–108. [Google Scholar] [CrossRef]
- Law, R.D.; Suttle, J.C. Chromatin remodeling in plant cell culture: Patterns of DNA methylation and histone H3 and H4 acetylation vary during growth of asynchronous potato cell suspensions. Plant Physiol. Biochem. 2005, 43, 527–534. [Google Scholar] [CrossRef]
- Anzola, J.M.; Sieberer, T.; Ortbauer, M.; Butt, H.; Korbei, B.; Weinhofer, I.; Mullner, A.E.; Luschnig, C. Putative Arabidopsis transcriptional adaptor protein (PROPORZ1) is required to modulate histone acetylation in response to auxin. Proc. Natl. Acad. Sci. USA 2010, 107, 10308–10313. [Google Scholar] [CrossRef] [Green Version]
- Weiste, C.; Droge-Laser, W. The Arabidopsis transcription factor bZIP11 activates auxin-mediated transcription by recruiting the histone acetylation machinery. Nat. Commun. 2014, 5, 3883. [Google Scholar] [CrossRef] [Green Version]
- Kuhn, A.; Ramans Harborough, S.; McLaughlin, H.M.; Natarajan, B.; Verstraeten, I.; Friml, J.; Kepinski, S.; Ostergaard, L. Direct ETTIN-auxin interaction controls chromatin states in gynoecium development. Elife 2020, 9, e51787. [Google Scholar] [CrossRef] [PubMed]
- Nguyen, C.T.; Tran, G.B.; Nguyen, N.H. Homeostasis of histone acetylation is critical for auxin signaling and root morphogenesis. Plant Mol. Biol. 2020, 103, 1–7. [Google Scholar] [CrossRef] [PubMed]
- Brąszewska-Zalewska, A.J.; Wolny, E.A.; Śmiałek, Ł.; Hasterok, R. Tissue-specific epigenetic modifications in root apical meristem cells of Hordeum vulgare. PLoS ONE 2013, 8, e69204. [Google Scholar] [CrossRef] [PubMed]
- Santamaria, M.E.; Hasbun, R.; Valera, M.J.; Meijon, M.; Valledor, L.; Rodriguez, J.L.; Toorop, P.E.; Canal, M.J.; Rodriguez, R. Acetylated H4 histone and genomic DNA methylation patterns during bud set and bud burst in Castanea sativa. J. Plant Physiol. 2009, 166, 1360–1369. [Google Scholar] [CrossRef] [PubMed]
- Meijón, M.; Feito, I.; Valledor, L.; Rodríguez, R.; Cañal, M.J. Dynamics of DNA methylation and Histone H4 acetylation during floral bud differentiation in azalea. BMC Plant Biol. 2010, 10, 1–14. [Google Scholar] [CrossRef] [Green Version]
- Kawakatsu, T.; Stuart, T.; Valdes, M.; Breakfield, N.; Schmitz, R.J.; Nery, J.R.; Urich, M.A.; Han, X.; Lister, R.; Benfey, P.N.; et al. Unique cell-type-specific patterns of DNA methylation in the root meristem. Nat. Plants 2016, 2, 16058. [Google Scholar] [CrossRef] [PubMed] [Green Version]
- You, Y.; Sawikowska, A.; Neumann, M.; Pose, D.; Capovilla, G.; Langenecker, T.; Neher, R.A.; Krajewski, P.; Schmid, M. Temporal dynamics of gene expression and histone marks at the Arabidopsis shoot meristem during flowering. Nat. Commun. 2017, 8, 15120. [Google Scholar] [CrossRef]
- Elhiti, M.; Stasolla, C. Ectopic expression of the Brassica SHOOTMERISTEMLESS attenuates the deleterious effects of the auxin transport inhibitor TIBA on somatic embryo number and morphology. Plant Sci. 2011, 180, 383–390. [Google Scholar] [CrossRef]
- Thomas, C.; Bronner, R.; Molinier, J.; Prinsen, E.; van Onckelen, H.; Hahne, G. Immuno-cytochemical localization of indole-3-acetic acid during induction of somatic embryogenesis in cultured sunflower embryos. Planta 2002, 215, 577–583. [Google Scholar] [CrossRef]
- Karami, O.; Philipsen, C.; Rahimi, A.; Nurillah, A.R.; Boutilier, K.; Offringa, R. Endogenous auxin directs development of embryonic stem cells into somatic proembryos in Arabidopsis. bioRxiv 2021. [Google Scholar] [CrossRef]
- Peng, M.; Li, Z.; Zhou, N.; Ma, M.; Jiang, Y.; Dong, A.; Shen, W.H.; Li, L. Linking PHYTOCHROME-INTERACTING FACTOR to histone modification in plant shade avoidance. Plant Physiol. 2018, 176, 1341–1351. [Google Scholar] [CrossRef] [PubMed]
- van der Woude, L.C.; Perrella, G.; Snoek, B.L.; van Hoogdalem, M.; Novak, O.; van Verk, M.C.; van Kooten, H.N.; Zorn, L.E.; Tonckens, R.; Dongus, J.A.; et al. HISTONE DEACETYLASE 9 stimulates auxin-dependent thermomorphogenesis in Arabidopsis thaliana by mediating H2A.Z depletion. Proc. Natl. Acad. Sci. USA 2019, 116, 25343–25354. [Google Scholar] [CrossRef] [PubMed]
- Karami, O.; Rahimi, A.; Mak, P.; Horstman, A.; Boutilier, K.; Compier, M.; van der Zaal, B.; Offringa, R. An Arabidopsis AT-hook motif nuclear protein mediates somatic embryogenesis and coinciding genome duplication. Nat. Commun. 2021, 12, 2508. [Google Scholar] [CrossRef]
- Wang, L.; Qiao, H. Chromatin regulation in plant hormone and plant stress responses. Curr. Opin. Plant Biol. 2020, 57, 164–170. [Google Scholar] [CrossRef]
- Yang, H.; Liu, X.; Xin, M.; Du, J.; Hu, Z.; Peng, H.; Rossi, V.; Sun, Q.; Ni, Z.; Yao, Y. Genome-wide mapping of targets of maize histone deacetylase HDA101 reveals its function and regulatory mechanism during seed development. Plant Cell 2016, 28, 629–645. [Google Scholar] [CrossRef] [Green Version]
- Boycheva, I.; Vassileva, V.; Iantcheva, A. Histone acetyltransferases in plant development and plasticity. Curr. Genom. 2014, 15, 28. [Google Scholar] [CrossRef] [Green Version]
- Chen, X.; Ding, A.B.; Zhong, X. Functions and mechanisms of plant histone deacetylases. Sci. China Life Sci. 2020, 63, 206–216. [Google Scholar] [CrossRef] [Green Version]
- Zhou, L.; Yarra, R.; Jin, L.; Yang, Y.; Cao, H.; Zhao, Z. Identification and expression analysis of histone modification gene (HM) family during somatic embryogenesis of oil palm. BMC Genom. 2022, 23. [Google Scholar] [CrossRef]
- Ma, X.; Zhang, C.; Zhang, B.; Yang, C.; Li, S. Identification of genes regulated by histone acetylation during root development in Populus trichocarpa. BMC Genom. 2016, 17, 96. [Google Scholar] [CrossRef] [Green Version]
- Imran, M.; Shafiq, S.; Farooq, M.A.; Naeem, M.K.; Widemann, E.; Bakhsh, A.; Jensen, K.B.; Wang, R.R. Comparative genome-wide analysis and expression profiling of histone acetyltransferase (HAT) gene family in response to hormonal applications, metal and abiotic stresses in cotton. Int. J. Mol. Sci. 2019, 20, 5311. [Google Scholar] [CrossRef] [PubMed] [Green Version]
- Imran, M.; Shafiq, S.; Naeem, M.K.; Widemann, E.; Munir, M.Z.; Jensen, K.B.; Wang, R.R. Histone deacetylase (HDAC) gene family in allotetraploid cotton and its diploid progenitors: In silico identification, molecular characterization, and gene expression analysis under multiple abiotic stresses, DNA damage and phytohormone treatments. Int. J. Mol. Sci. 2020, 21, 321. [Google Scholar] [CrossRef] [PubMed] [Green Version]
- Chow, C.N.; Lee, T.Y.; Hung, Y.C.; Li, G.Z.; Tseng, K.C.; Liu, Y.H.; Kuo, P.L.; Zheng, H.Q.; Chang, W.C. PlantPAN3.0: A new and updated resource for reconstructing transcriptional regulatory networks from ChIP-seq experiments in plants. Nucleic Acids Res. 2019, 47, D1155–D1163. [Google Scholar] [CrossRef] [PubMed] [Green Version]
- Wójcik, A.M.; Wójcikowska, B.; Gaj, M.D. Current perspectives on the auxin-mediated genetic network that controls the induction of somatic embryogenesis in plants. Int. J. Mol. Sci. 2020, 21, 1333. [Google Scholar] [CrossRef] [PubMed] [Green Version]
- Cigliano, R.A.; Cremona, G.; Paparo, R.; Termolino, P.; Perrella, G.; Gutzat, R.; Consiglio, M.F.; Conicella, C. Histone deacetylase AtHDA7 is required for female gametophyte and embryo development in Arabidopsis. Plant Physiol. 2013, 163, 431–440. [Google Scholar] [CrossRef] [Green Version]
- Boycheva, I.; Vassileva, V.; Revalska, M.; Zehirov, G.; Iantcheva, A. Different functions of the histone acetyltransferase HAC1 gene traced in the model species Medicago truncatula, Lotus japonicus and Arabidopsis thaliana. Protoplasma 2017, 254, 697–711. [Google Scholar] [CrossRef]
- Zhou, C.; Labbe, H.; Sridha, S.; Wang, L.; Tian, L.; Latoszek-Green, M.; Yang, Z.; Brown, D.; Miki, B.; Wu, K. Expression and function of HD2-type histone deacetylases in Arabidopsis development. Plant J. 2004, 38, 715–724. [Google Scholar] [CrossRef]
- Kim, W.; Latrasse, D.; Servet, C.; Zhou, D.X. Arabidopsis histone deacetylase HDA9 regulates flowering time through repression of AGL19. Biochem. Biophys. Res. Commun. 2013, 432, 394–398. [Google Scholar] [CrossRef]
- Zhang, F.; Wang, L.; Ko, E.E.; Shao, K.; Qiao, H. Histone deacetylases SRT1 and SRT2 interact with ENAP1 to mediate ethylene-induced transcriptional repression. Plant Cell 2018, 30, 153–166. [Google Scholar] [CrossRef] [Green Version]
- Xiao, J.; Zhang, H.; Xing, L.; Xu, S.; Liu, H.; Chong, K.; Xu, Y. Requirement of histone acetyltransferases HAM1 and HAM2 for epigenetic modification of FLC in regulating flowering in Arabidopsis. J. Plant Physiol. 2013, 170, 444–451. [Google Scholar] [CrossRef]
- Gliwicka, M.; Nowak, K.; Balazadeh, S.; Mueller-Roeber, B.; Gaj, M.D. Extensive modulation of the transcription factor transcriptome during somatic embryogenesis in Arabidopsis thaliana. PLoS ONE 2013, 8, e69261. [Google Scholar] [CrossRef] [PubMed] [Green Version]
- Servet, C.; Conde e Silva, N.; Zhou, D.X. Histone acetyltransferase AtGCN5/HAG1 is a versatile regulator of developmental and inducible gene expression in Arabidopsis. Mol. Plant 2010, 3, 670–677. [Google Scholar] [CrossRef] [PubMed]
- Vlachonasios, K.; Poulios, S.; Mougiou, N. The histone acetyltransferase GCN5 and the associated coactivators ADA2: From evolution of the SAGA complex to the biological roles in plants. Plants 2021, 10, 308. [Google Scholar] [CrossRef] [PubMed]
- Gao, M.J.; Li, X.; Huang, J.; Gropp, G.M.; Gjetvaj, B.; Lindsay, D.L.; Wei, S.; Coutu, C.; Chen, Z.; Wan, X.C.; et al. SCARECROW-LIKE15 interacts with HISTONE DEACETYLASE19 and is essential for repressing the seed maturation programme. Nat. Commun. 2015, 6, 7243. [Google Scholar] [CrossRef] [Green Version]
- Vlachonasios, K.E.; Thomashow, M.F.; Triezenberg, S.J. Disruption mutations of ADA2b and GCN5 transcriptional adaptor genes dramatically affect Arabidopsis growth, development, and gene expression. Plant Cell 2003, 15, 626–638. [Google Scholar] [CrossRef] [Green Version]
- Tian, L.; Fong, M.P.; Wang, J.J.; Wei, N.E.; Jiang, H.; Doerge, R.; Chen, Z.J. Reversible histone acetylation and deacetylation mediate genome-wide, promoter-dependent and locus-specific changes in gene expression during plant development. Genetics 2005, 169, 337–345. [Google Scholar] [CrossRef] [Green Version]
- Poulios, S.; Vlachonasios, K.E. Synergistic action of GCN5 and CLAVATA1 in the regulation of gynoecium development in Arabidopsis thaliana. New Phytol. 2018, 220, 593–608. [Google Scholar] [CrossRef] [Green Version]
- Benhamed, M.; Martin-Magniette, M.L.; Taconnat, L.; Bitton, F.; Servet, C.; De Clercq, R.; De Meyer, B.; Buysschaert, C.; Rombauts, S.; Villarroel, R.; et al. Genome-scale Arabidopsis promoter array identifies targets of the histone acetyltransferase GCN5. Plant J. 2008, 56, 493–504. [Google Scholar] [CrossRef] [Green Version]
- Aquea, F.; Timmermann, T.; Herrera-Vasquez, A. Chemical inhibition of the histone acetyltransferase activity in Arabidopsis thaliana. Biochem. Biophys. Res. Commun. 2017, 483, 664–668. [Google Scholar] [CrossRef]
- Benhamed, M.; Bertrand, C.; Servet, C.; Zhou, D.X. Arabidopsis GCN5, HD1, and TAF1/HAF2 interact to regulate histone acetylation required for light-responsive gene expression. Plant Cell 2006, 18, 2893–2903. [Google Scholar] [CrossRef] [Green Version]
- Szemenyei, H.; Hannon, M.; Long, J.A. TOPLESS mediates auxin-dependent transcriptional repression during Arabidopsis embryogenesis. Science 2008, 319, 1384–1386. [Google Scholar] [CrossRef] [PubMed]
- Wu, M.F.; Yamaguchi, N.; Xiao, J.; Bargmann, B.; Estelle, M.; Sang, Y.; Wagner, D. Auxin-regulated chromatin switch directs acquisition of flower primordium founder fate. Elife 2015, 4, e09269. [Google Scholar] [CrossRef] [PubMed]
- Chung, Y.; Zhu, Y.; Wu, M.F.; Simonini, S.; Kuhn, A.; Armenta-Medina, A.; Jin, R.; Ostergaard, L.; Gillmor, C.S.; Wagner, D. Auxin Response Factors promote organogenesis by chromatin-mediated repression of the pluripotency gene SHOOTMERISTEMLESS. Nat. Commun. 2019, 10, 886. [Google Scholar] [CrossRef] [PubMed] [Green Version]
- Roosjen, M.; Paque, S.; Weijers, D. Auxin Response Factors: Output control in auxin biology. J. Exp. Bot 2018, 69, 179–188. [Google Scholar] [CrossRef]
- Causier, B.; Ashworth, M.; Guo, W.; Davies, B. The TOPLESS interactome: A framework for gene repression in Arabidopsis. Plant Physiol. 2012, 158, 423–438. [Google Scholar] [CrossRef] [Green Version]


Publisher’s Note: MDPI stays neutral with regard to jurisdictional claims in published maps and institutional affiliations. |
© 2022 by the authors. Licensee MDPI, Basel, Switzerland. This article is an open access article distributed under the terms and conditions of the Creative Commons Attribution (CC BY) license (https://creativecommons.org/licenses/by/4.0/).
Share and Cite
Morończyk, J.; Brąszewska, A.; Wójcikowska, B.; Chwiałkowska, K.; Nowak, K.; Wójcik, A.M.; Kwaśniewski, M.; Gaj, M.D. Insights into the Histone Acetylation-Mediated Regulation of the Transcription Factor Genes That Control the Embryogenic Transition in the Somatic Cells of Arabidopsis. Cells 2022, 11, 863. https://doi.org/10.3390/cells11050863
Morończyk J, Brąszewska A, Wójcikowska B, Chwiałkowska K, Nowak K, Wójcik AM, Kwaśniewski M, Gaj MD. Insights into the Histone Acetylation-Mediated Regulation of the Transcription Factor Genes That Control the Embryogenic Transition in the Somatic Cells of Arabidopsis. Cells. 2022; 11(5):863. https://doi.org/10.3390/cells11050863
Chicago/Turabian StyleMorończyk, Joanna, Agnieszka Brąszewska, Barbara Wójcikowska, Karolina Chwiałkowska, Katarzyna Nowak, Anna M. Wójcik, Mirosław Kwaśniewski, and Małgorzata D. Gaj. 2022. "Insights into the Histone Acetylation-Mediated Regulation of the Transcription Factor Genes That Control the Embryogenic Transition in the Somatic Cells of Arabidopsis" Cells 11, no. 5: 863. https://doi.org/10.3390/cells11050863
APA StyleMorończyk, J., Brąszewska, A., Wójcikowska, B., Chwiałkowska, K., Nowak, K., Wójcik, A. M., Kwaśniewski, M., & Gaj, M. D. (2022). Insights into the Histone Acetylation-Mediated Regulation of the Transcription Factor Genes That Control the Embryogenic Transition in the Somatic Cells of Arabidopsis. Cells, 11(5), 863. https://doi.org/10.3390/cells11050863