
PINK1 Protects against Staurosporine-Induced Apoptosis by Interacting with Beclin1 and Impairing Its Pro-Apoptotic Cleavage

 ,
,  , , and
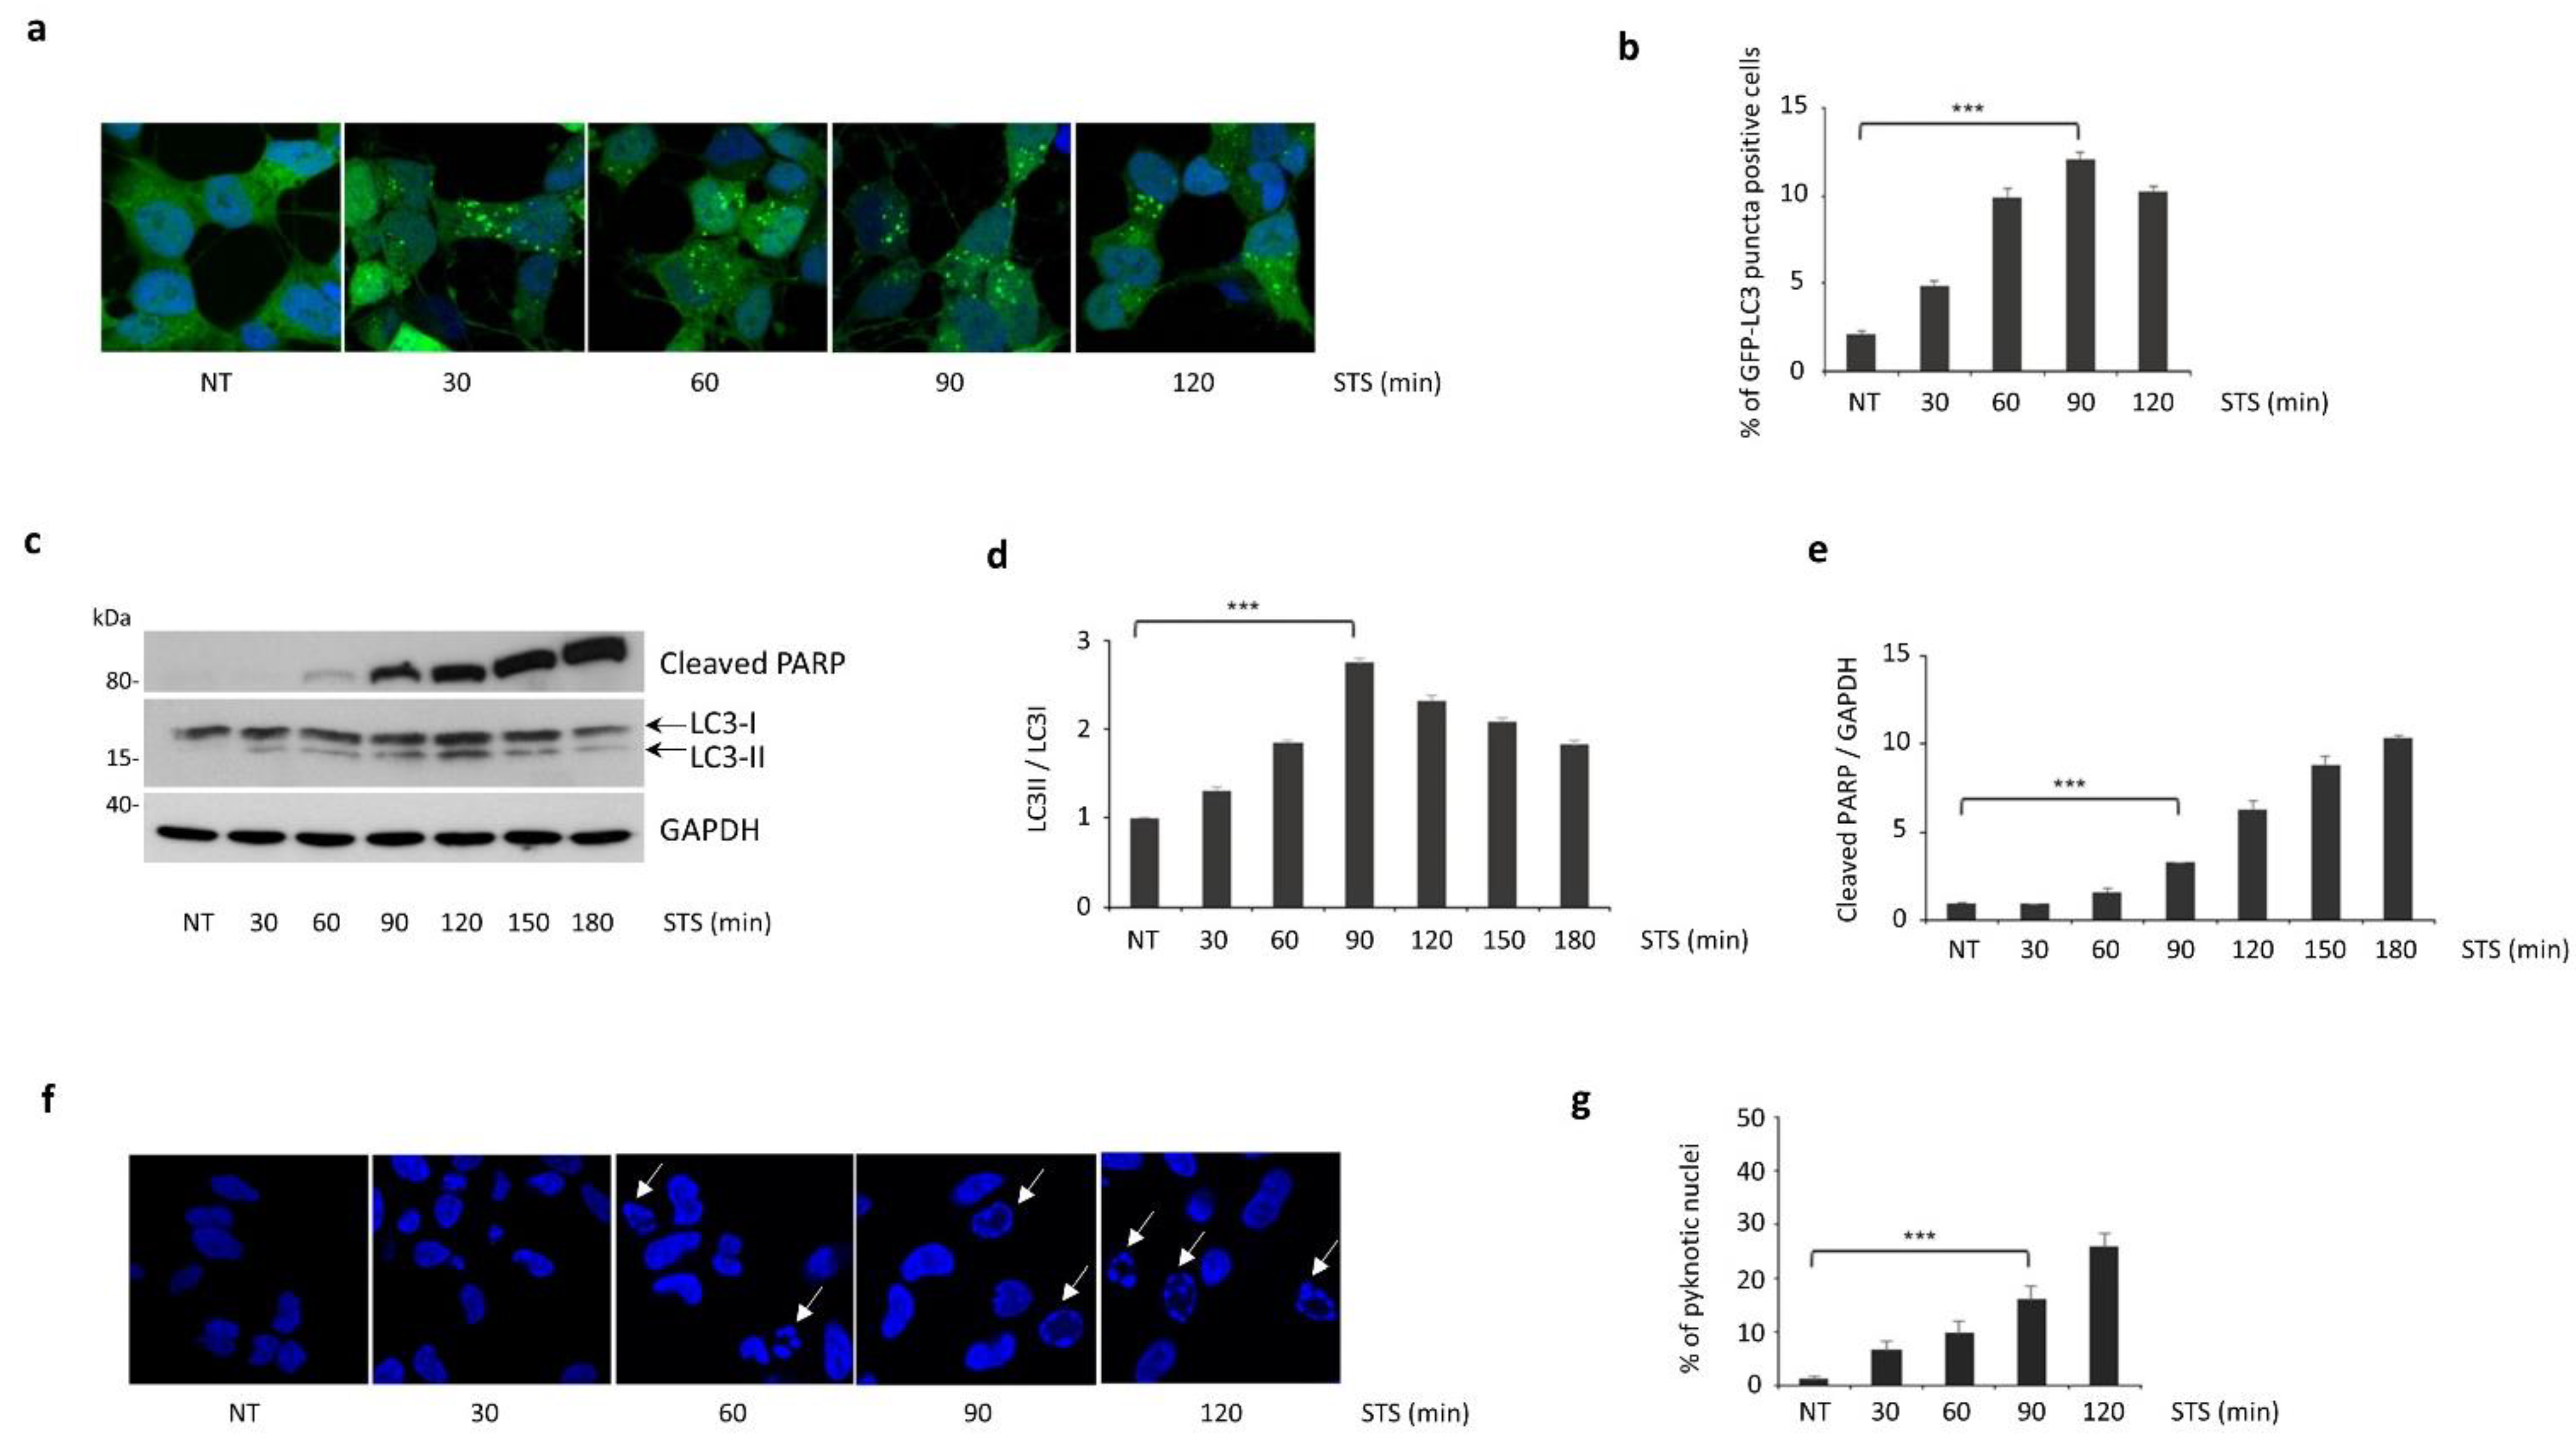
Abstract
:1. Introduction
2. Materials and Methods
2.1. Eukaryotic Expression Vectors and shRNA Constructs
2.2. Cell Cultures
2.3. Transfections and Transductions
2.4. Treatments
2.5. Antibodies
2.6. Western Blotting Analysis
2.7. Immunofluorescence and Confocal Microscopy
2.8. RNA Extraction and RT-qPCR
2.9. Statistical Analysis
3. Results
3.1. Autophagy Induced by STS Treatment Precedes Apoptotic Cell Death
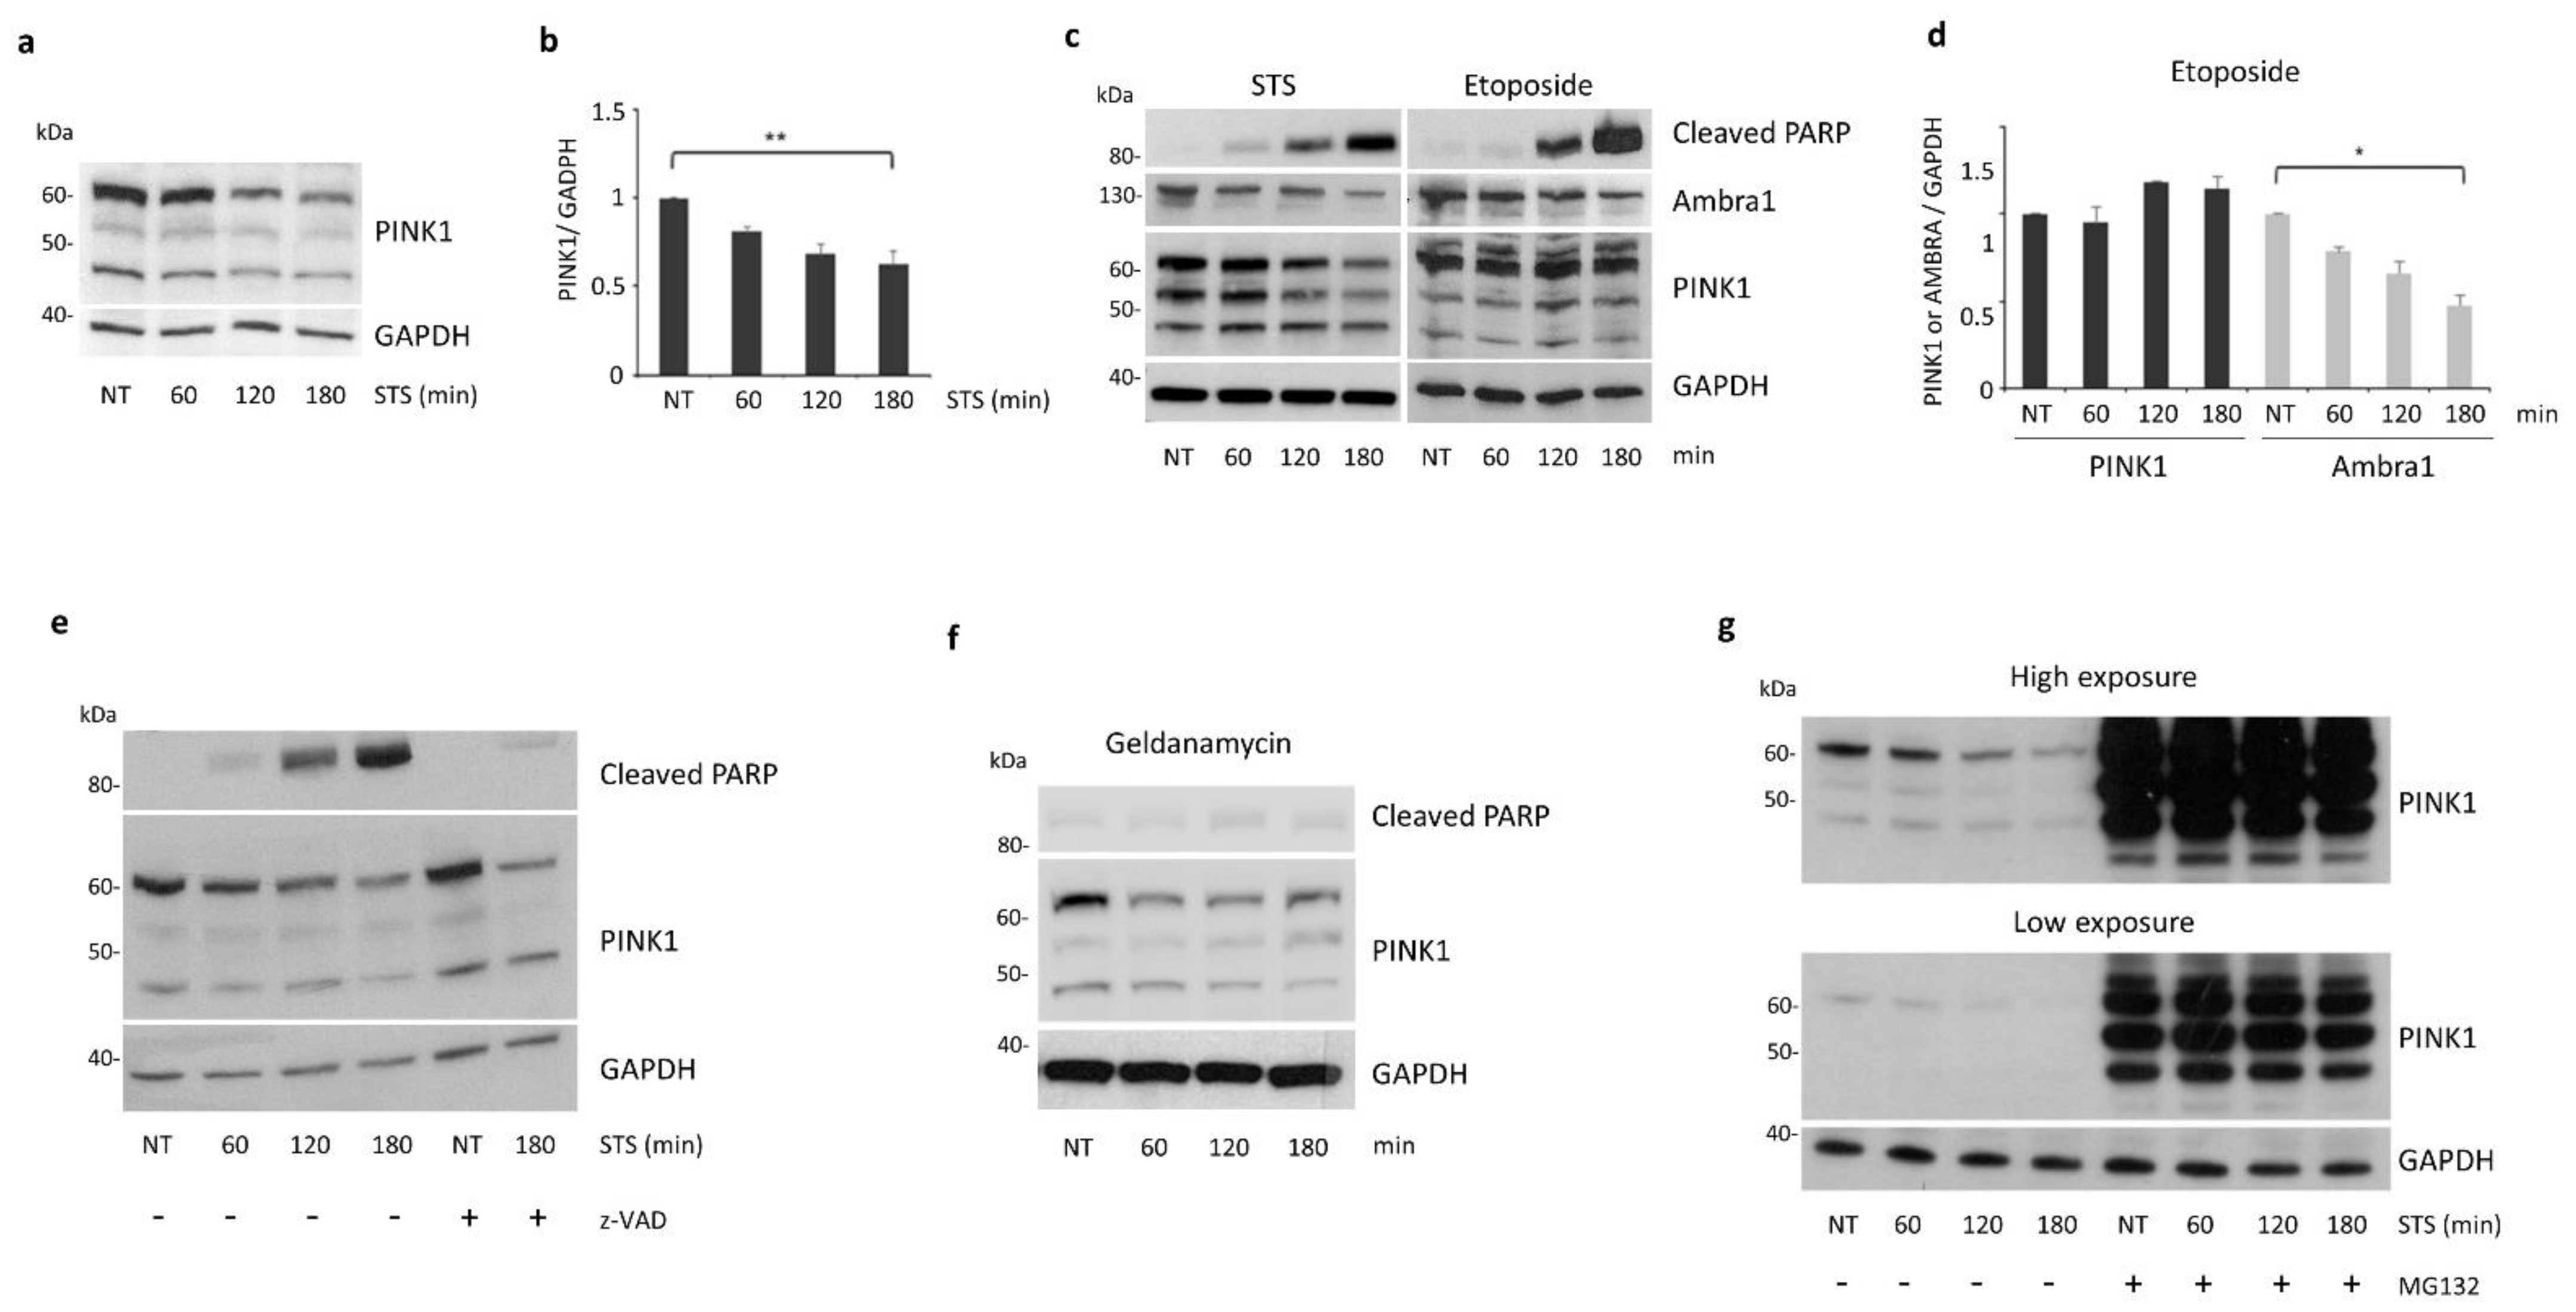
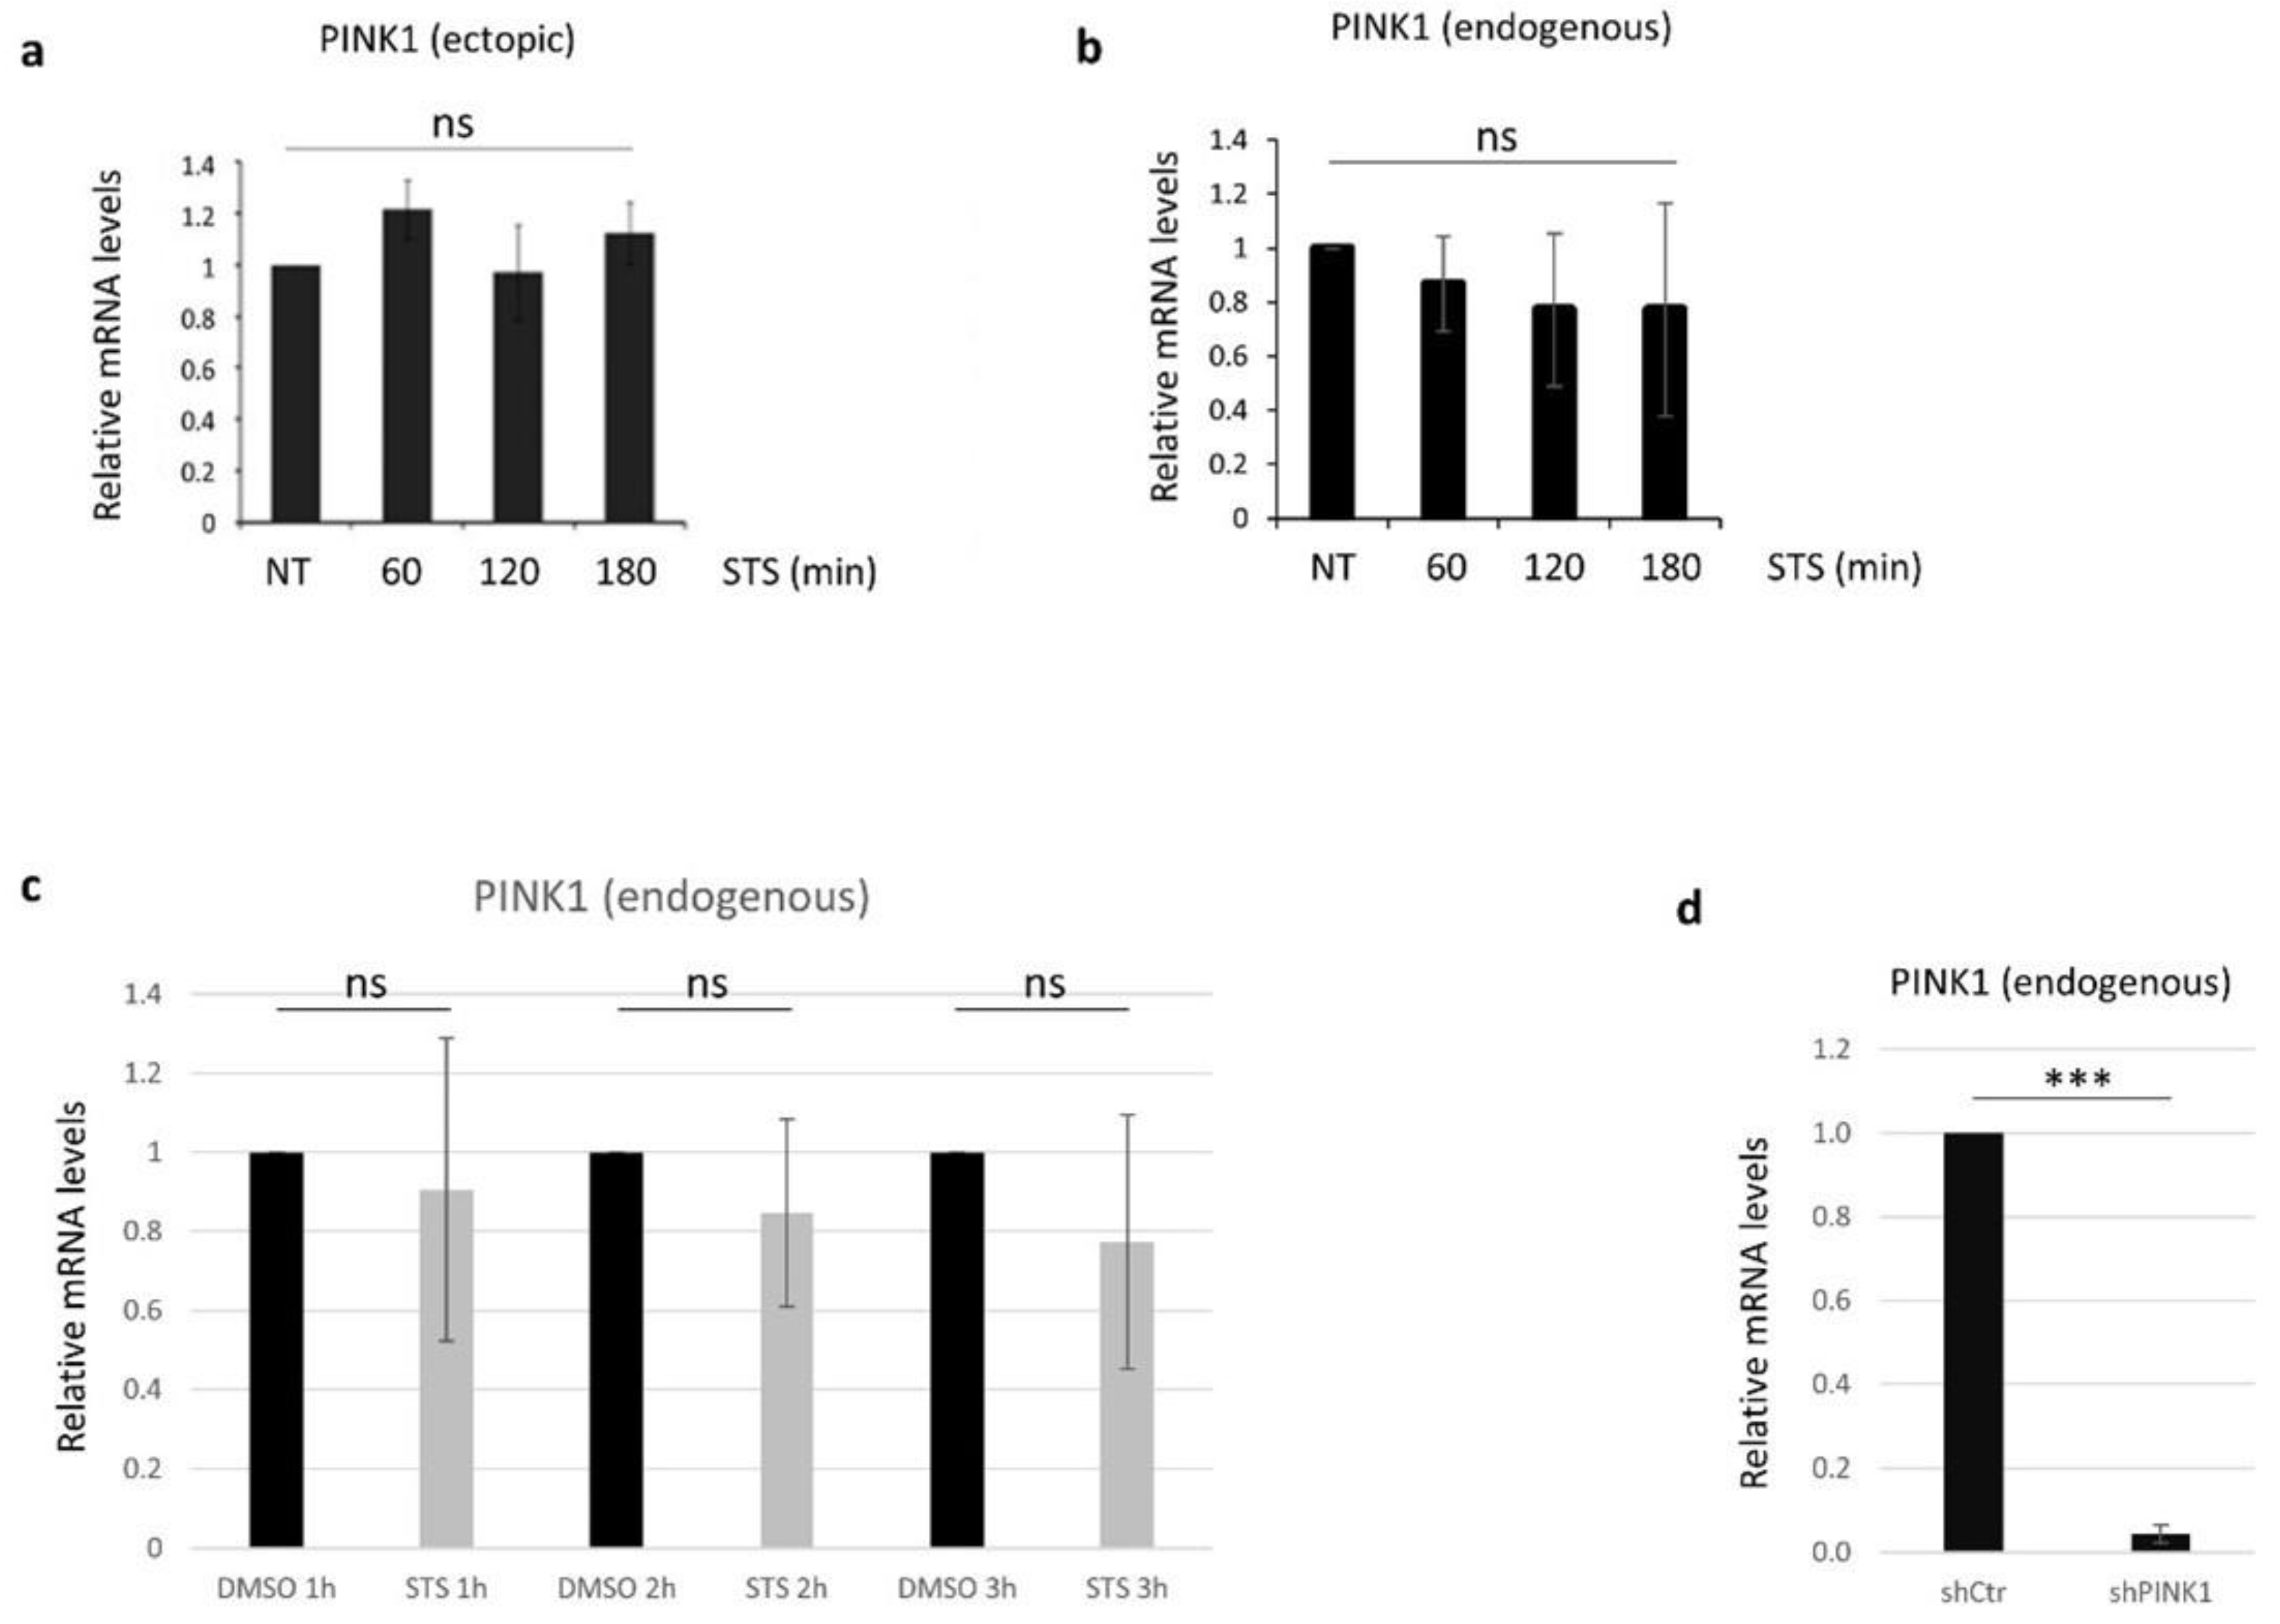
3.2. PINK1 Protein Levels Decrease during STS Treatment
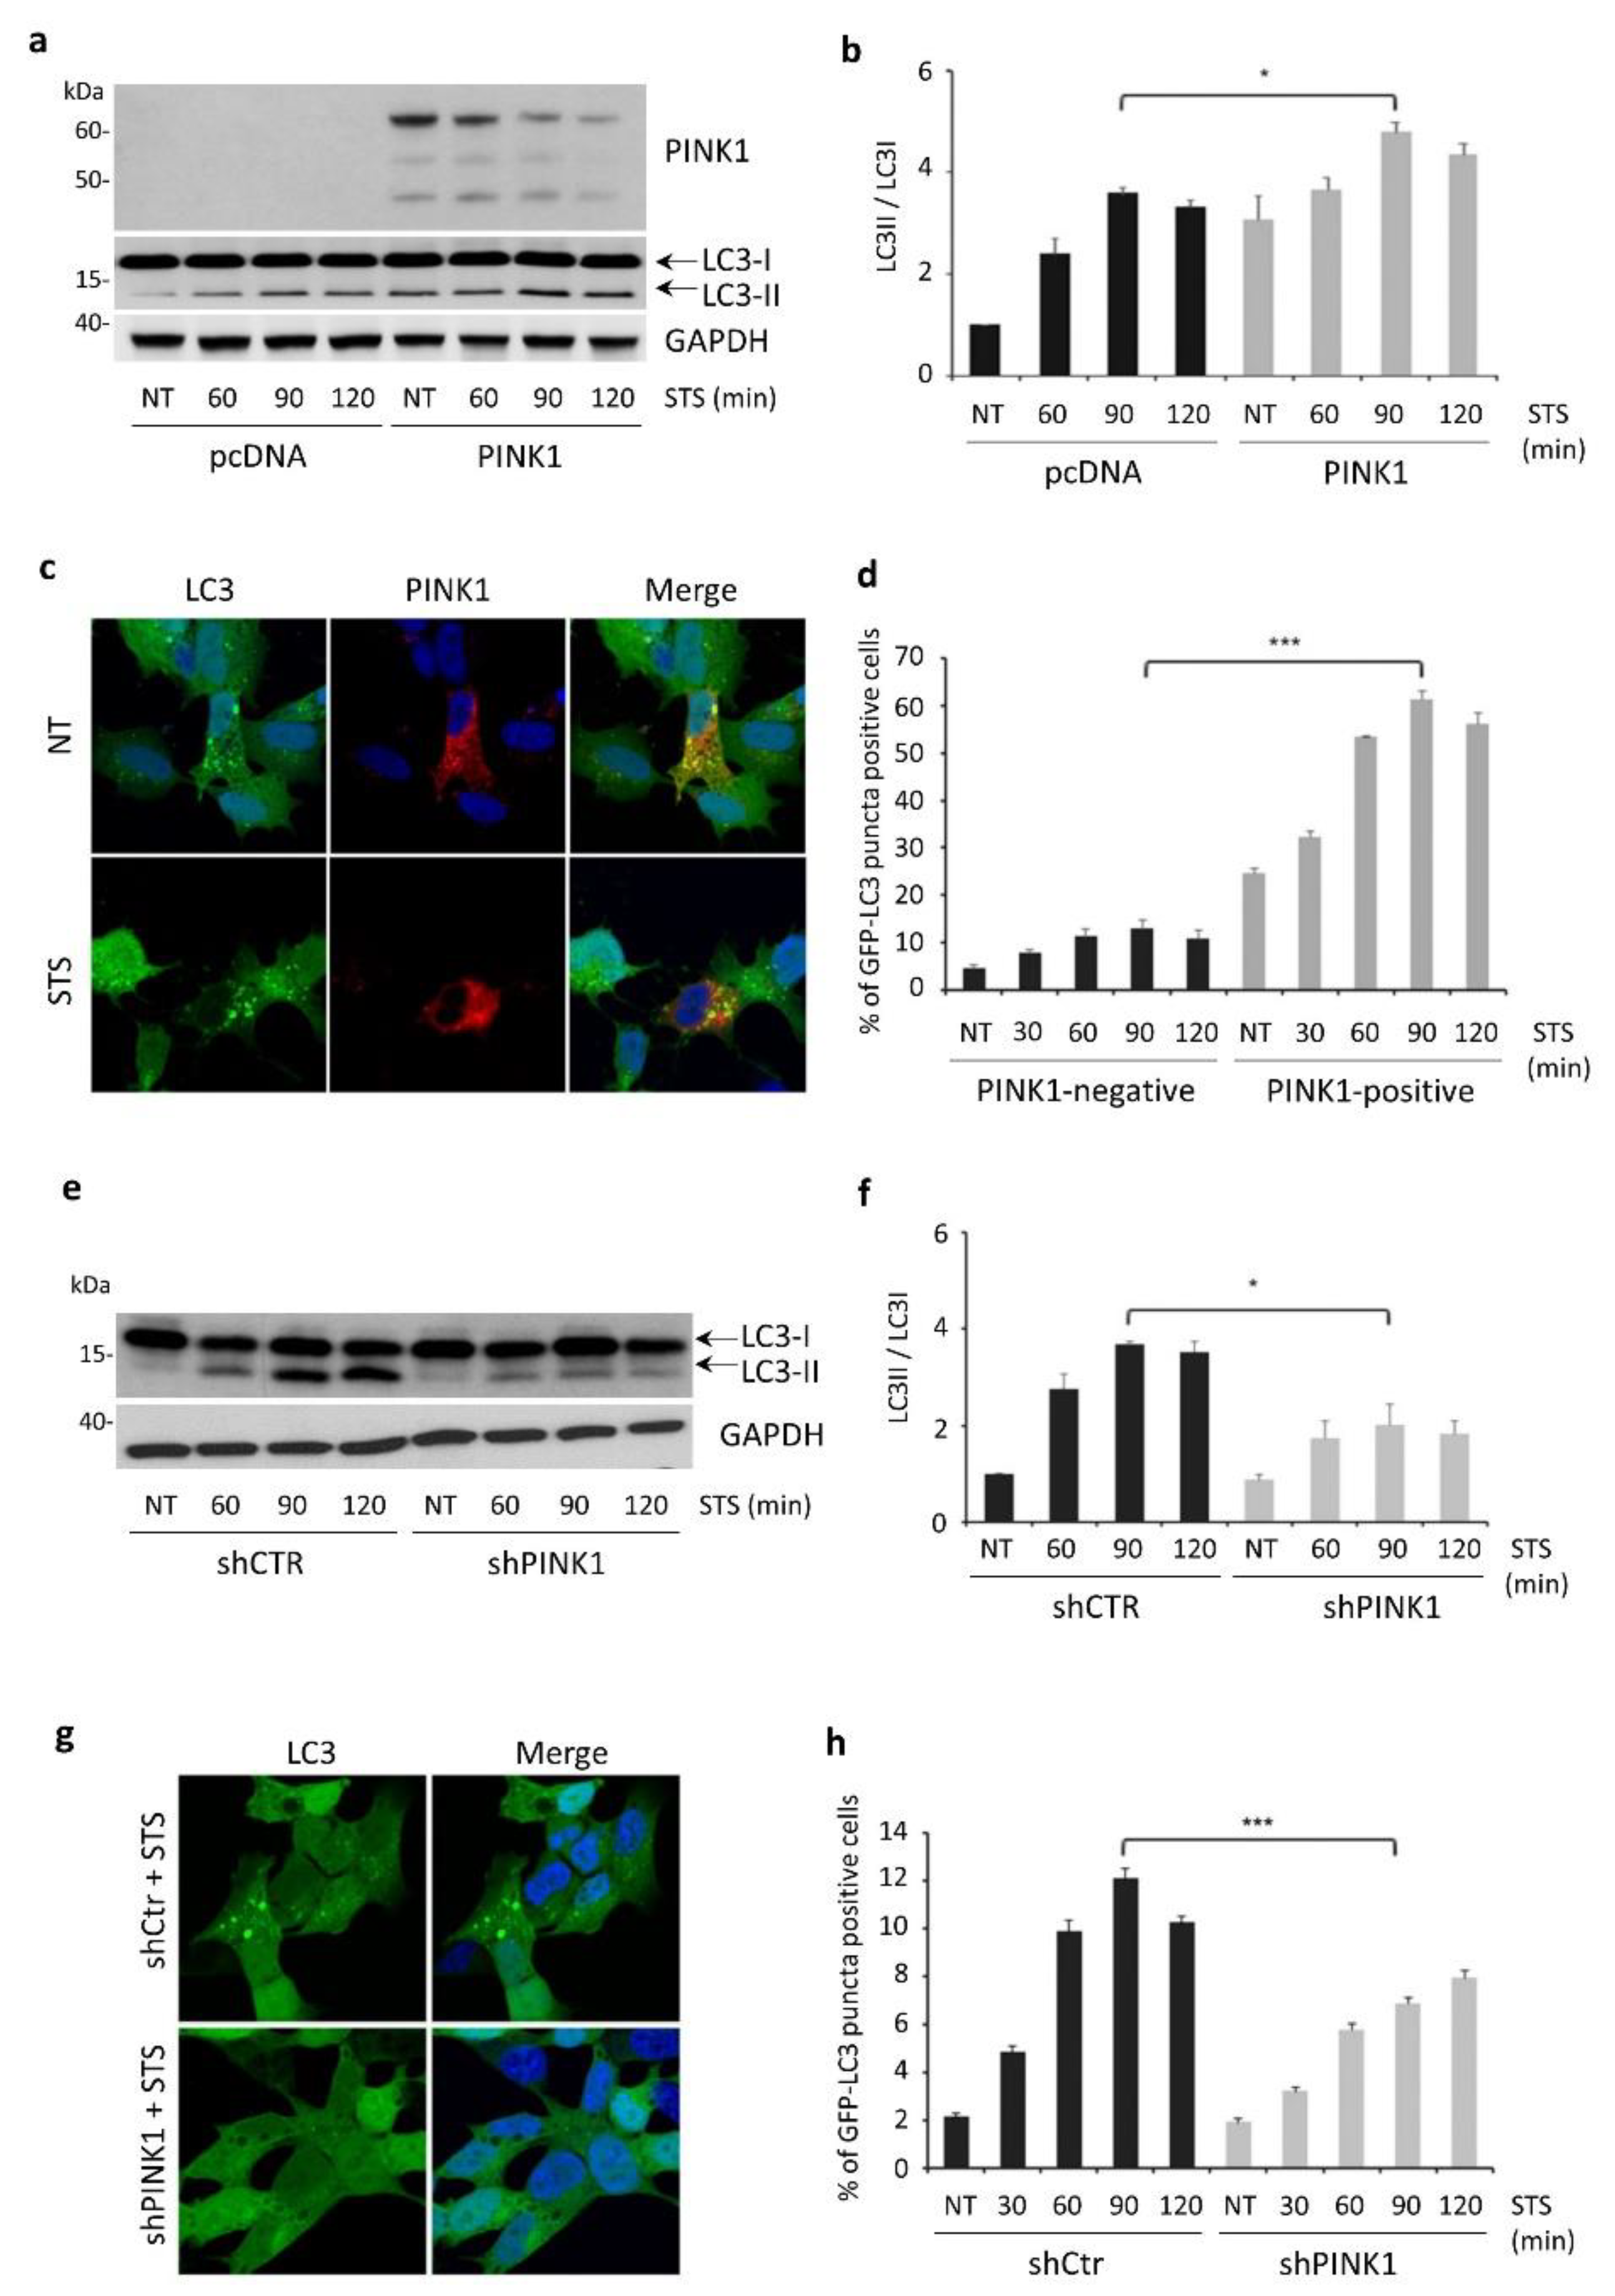
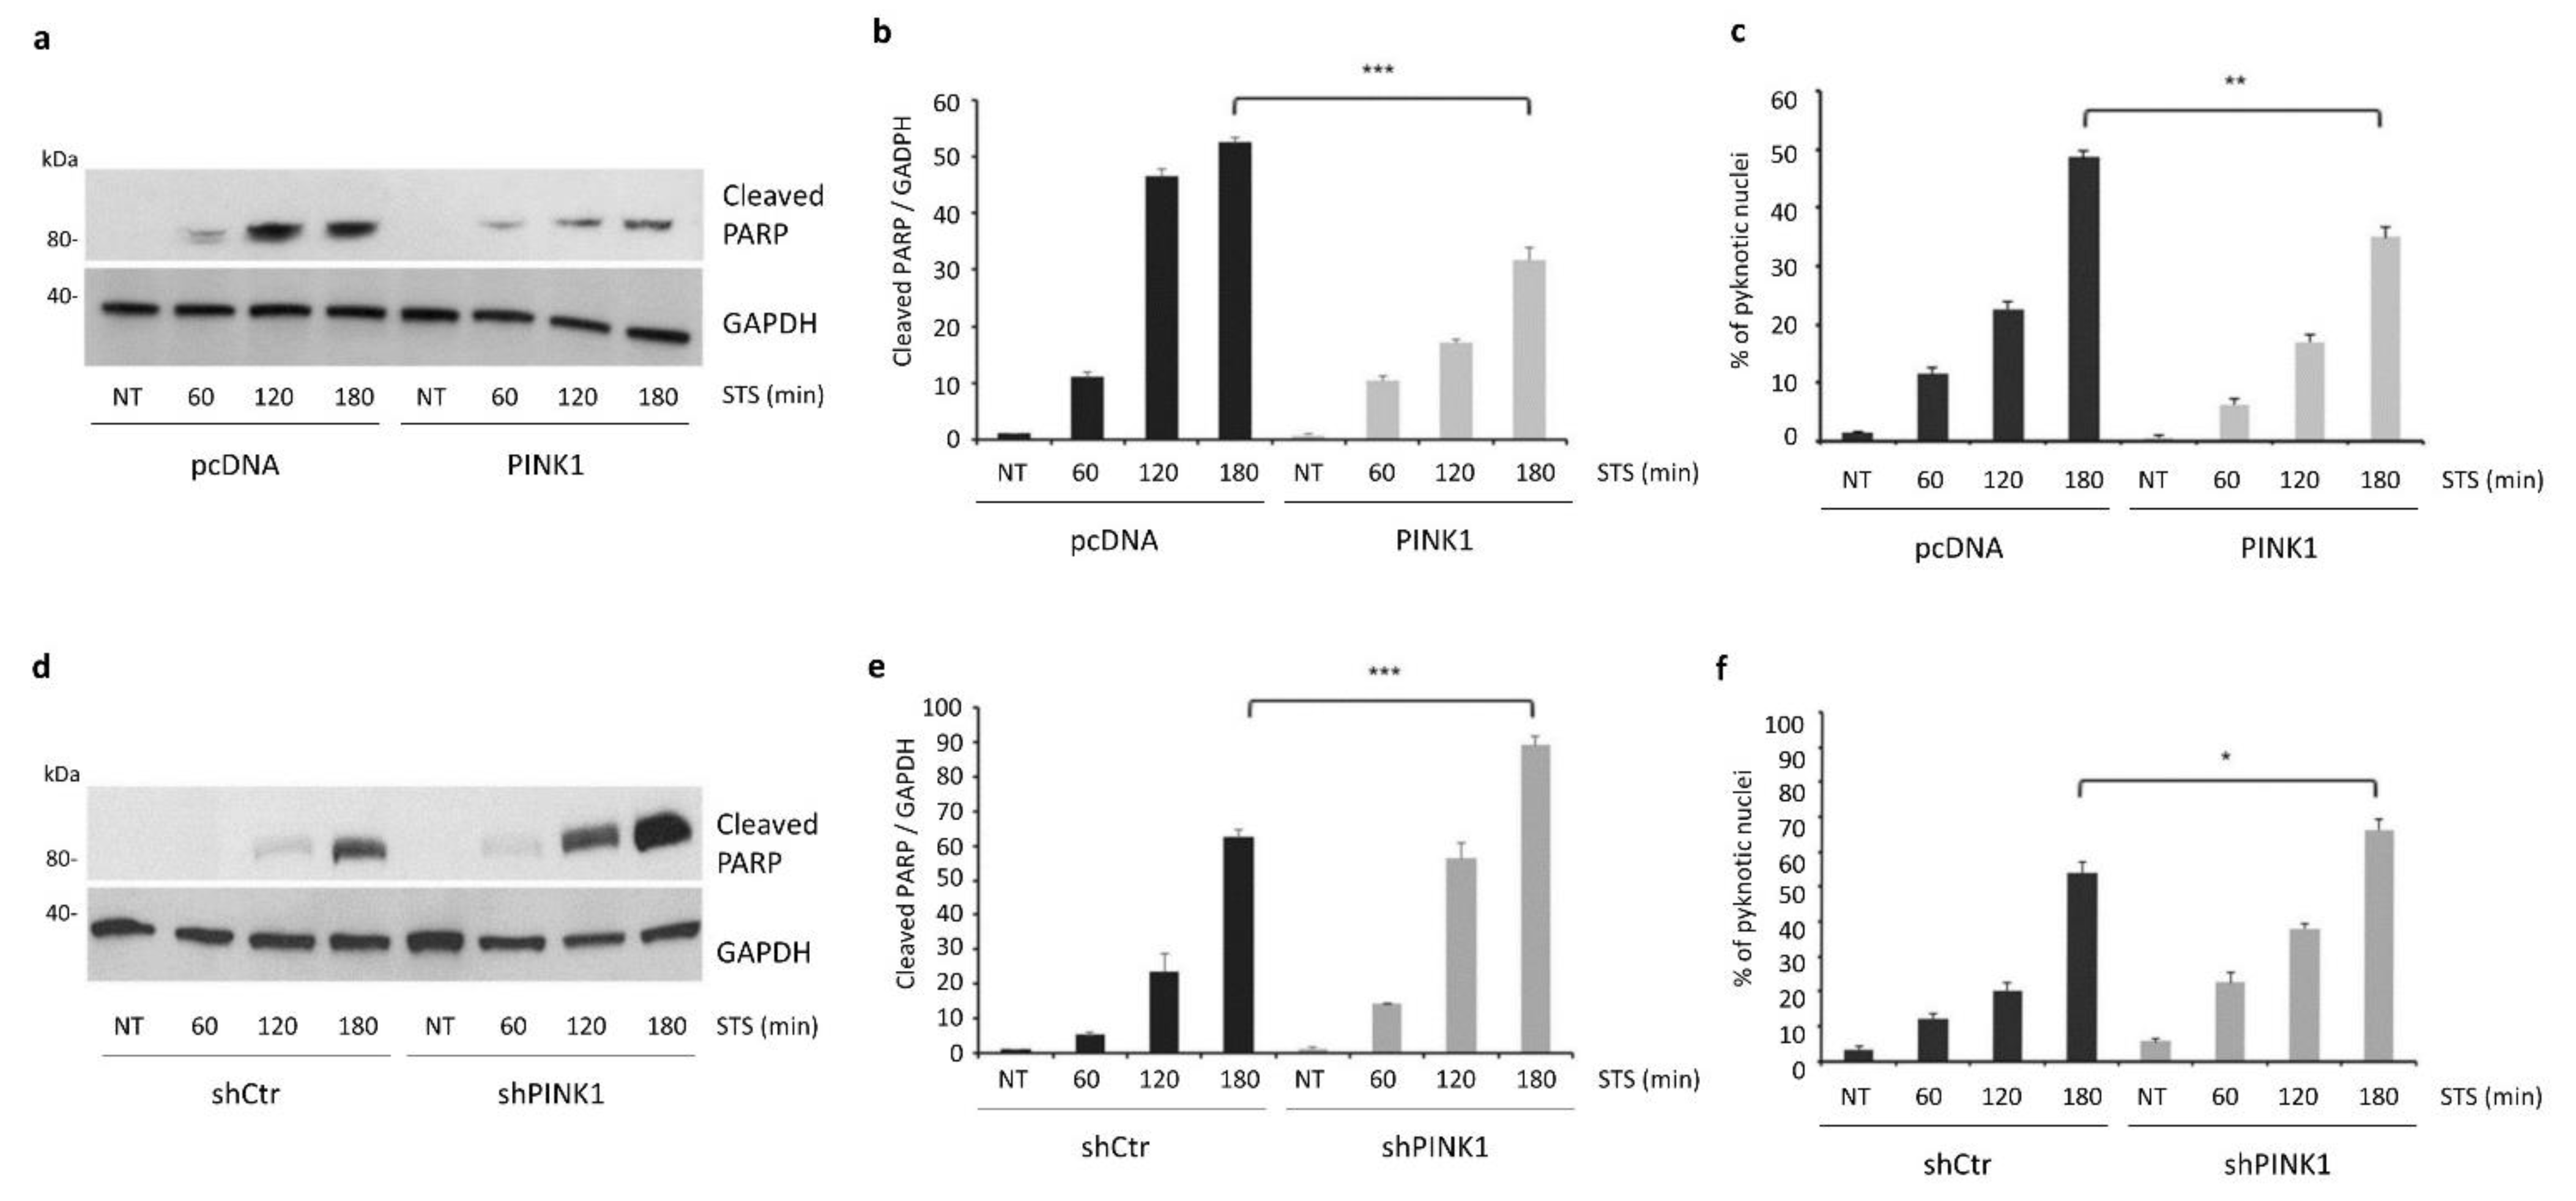
3.3. PINK1 Degradation Controls the Switch between STS-Induced Autophagy and Apoptosis
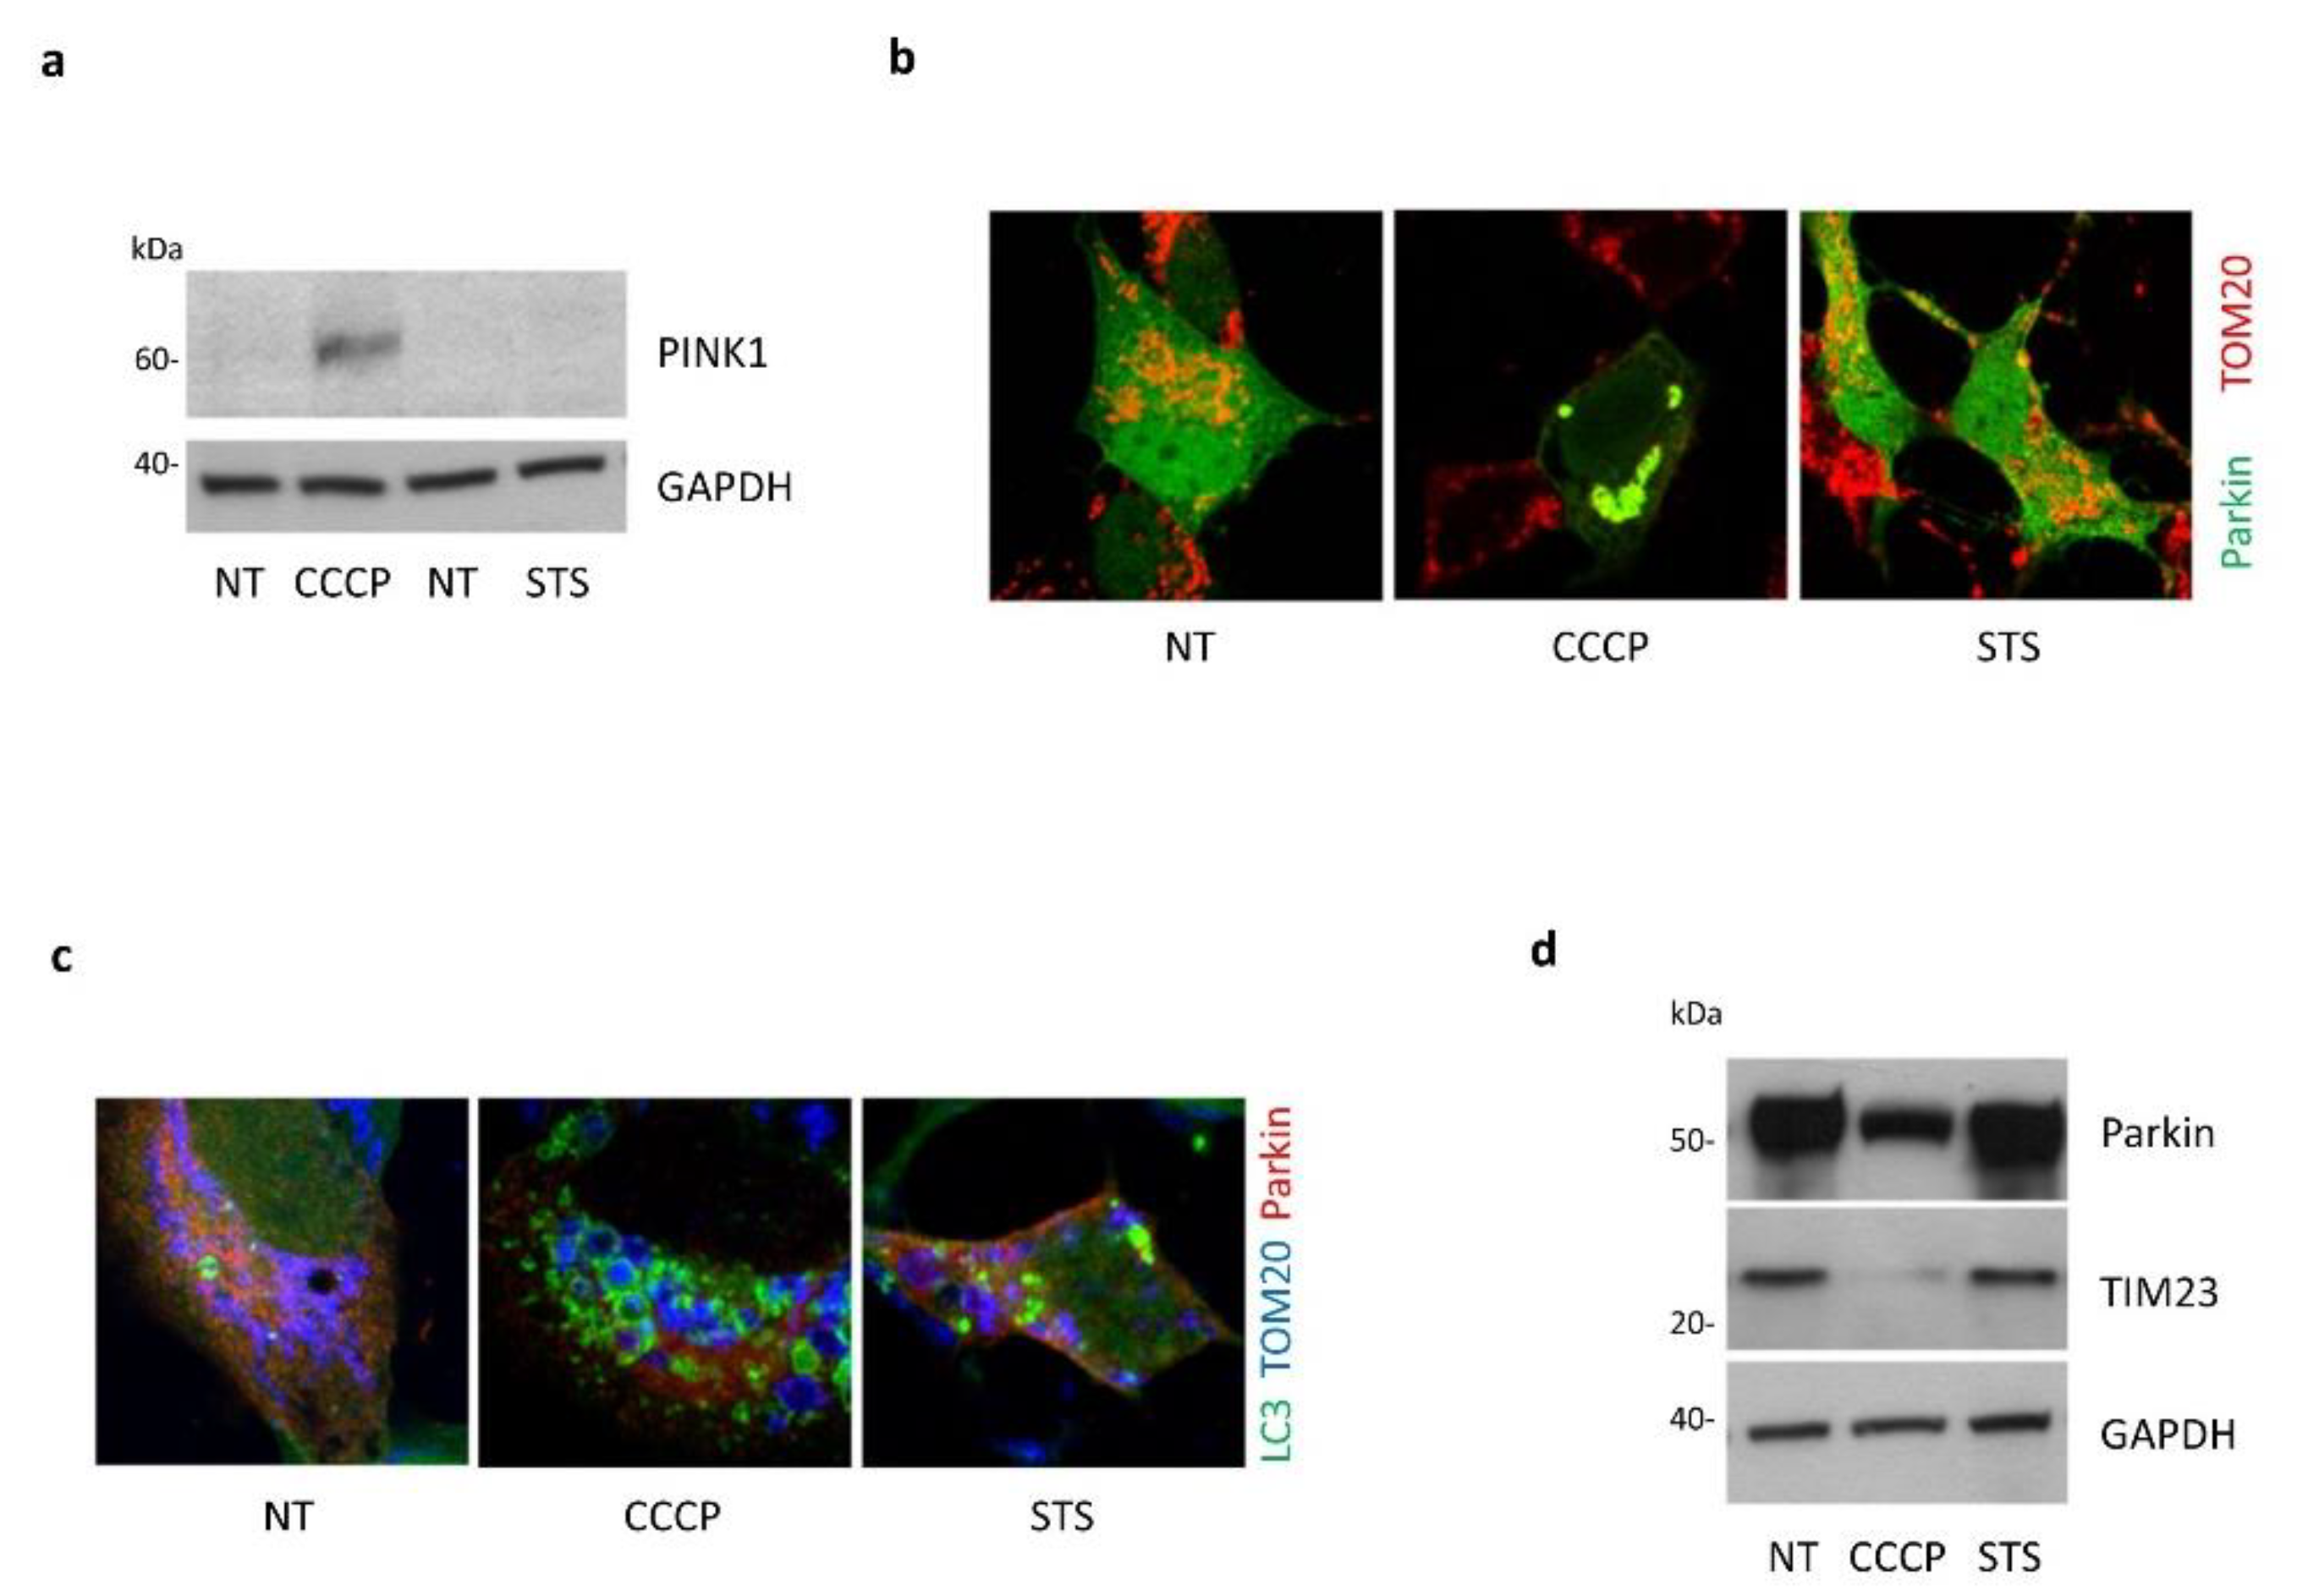
3.4. Absence of Mitophagy Induction in Response to STS Treatment
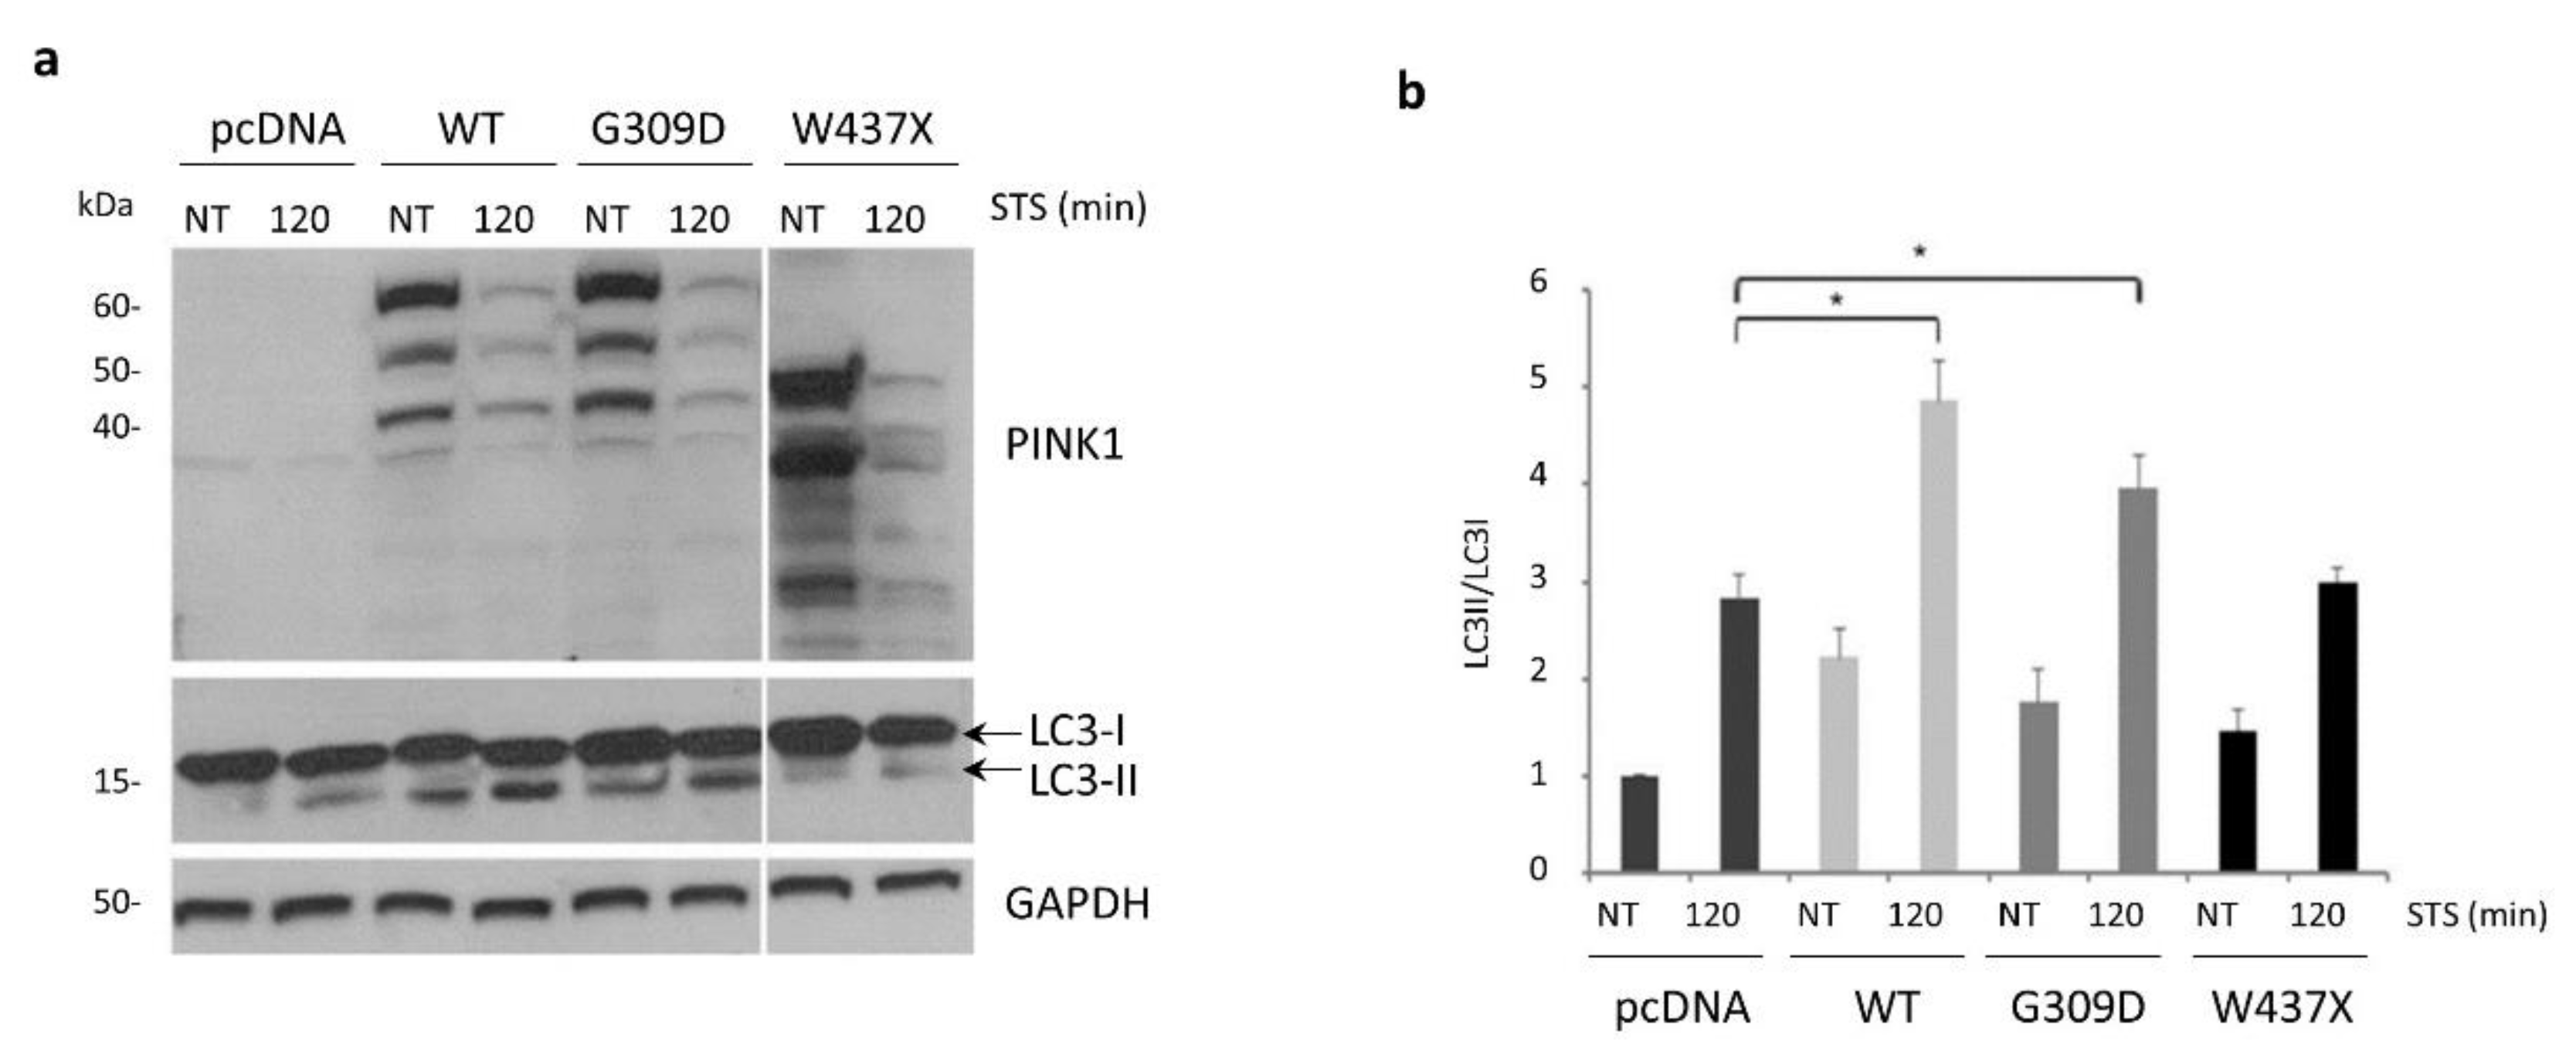
3.5. STS-Induced Autophagy Is Regulated by PINK1–Beclin1 Interaction
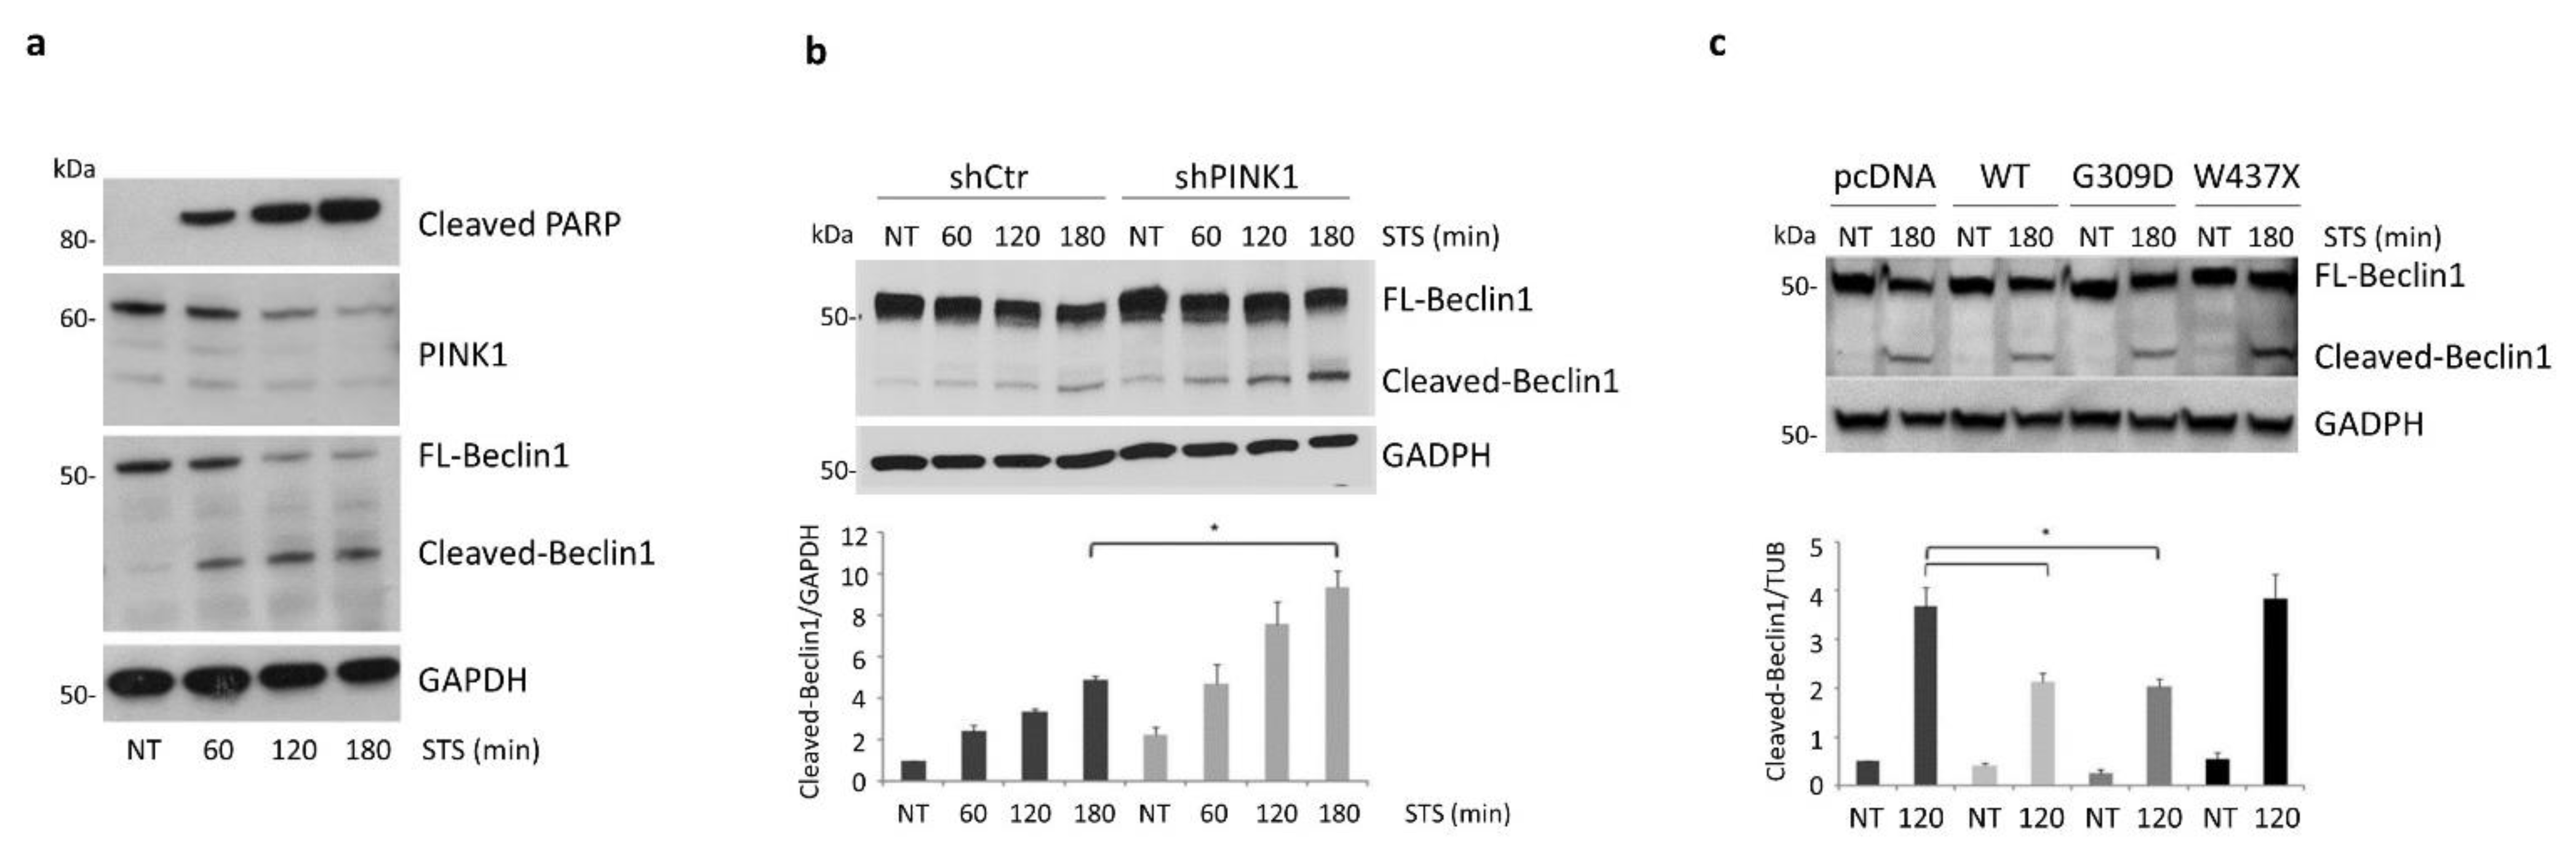
3.6. PINK1 Impairs the Pro-Apoptotic Cleavage of Beclin1 upon STS Treatment
4. Discussion
Author Contributions
Funding
Institutional Review Board Statement
Informed Consent Statement
Data Availability Statement
Acknowledgments
Conflicts of Interest
Appendix A
References
- Ghavami, S.; Shojaei, S.; Yeganeh, B.; Ande, S.R.; Jangamreddy, J.R.; Mehrpour, M.; Christoffersson, J.; Chaabane, W.; Moghadam, A.R.; Kashani, H.H.; et al. Autophagy and Apoptosis Dysfunction in Neurodegenerative Disorders. Prog. Neurobiol. 2014, 112, 24–49. [Google Scholar] [CrossRef] [PubMed] [Green Version]
- Salminen, A.; Kaarniranta, K.; Kauppinen, A.; Ojala, J.; Haapasalo, A.; Soininen, H.; Hiltunen, M. Impaired Autophagy and APP Processing in Alzheimer’s Disease: The Potential Role of Beclin 1 Interactome. Prog. Neurobiol. 2013, 106–107, 33–54. [Google Scholar] [CrossRef] [PubMed]
- Dorsey, E.R.; Bloem, B.R. The Parkinson Pandemic—A Call to Action. JAMA Neurol. 2018, 75, 9. [Google Scholar] [CrossRef] [PubMed]
- Arena, G.; Valente, E.M. PINK1 in the Limelight: Multiple Functions of an Eclectic Protein in Human Health and Disease: Functions of PINK1 in Human Pathology. J. Pathol. 2017, 241, 251–263. [Google Scholar] [CrossRef]
- O’Flanagan, C.H.; Morais, V.A.; Wurst, W.; De Strooper, B.; O’Neill, C. The Parkinson’s Gene PINK1 Regulates Cell Cycle Progression and Promotes Cancer-Associated Phenotypes. Oncogene 2015, 34, 1363–1374. [Google Scholar] [CrossRef] [Green Version]
- Gandhi, S.; Wood-Kaczmar, A.; Yao, Z.; Plun-Favreau, H.; Deas, E.; Klupsch, K.; Downward, J.; Latchman, D.S.; Tabrizi, S.J.; Wood, N.W.; et al. PINK1-Associated Parkinson’s Disease Is Caused by Neuronal Vulnerability to Calcium-Induced Cell Death. Mol. Cell 2009, 33, 627–638. [Google Scholar] [CrossRef] [Green Version]
- Huang, E.; Qu, D.; Huang, T.; Rizzi, N.; Boonying, W.; Krolak, D.; Ciana, P.; Woulfe, J.; Klein, C.; Slack, R.S.; et al. PINK1-Mediated Phosphorylation of LETM1 Regulates Mitochondrial Calcium Transport and Protects Neurons against Mitochondrial Stress. Nat. Commun. 2017, 8, 1399. [Google Scholar] [CrossRef]
- Morais, V.A.; Haddad, D.; Craessaerts, K.; De Bock, P.-J.; Swerts, J.; Vilain, S.; Aerts, L.; Overbergh, L.; Grünewald, A.; Seibler, P.; et al. PINK1 Loss-of-Function Mutations Affect Mitochondrial Complex I Activity via NdufA10 Ubiquinone Uncoupling. Science 2014, 344, 203–207. [Google Scholar] [CrossRef]
- Xiong, H.; Wang, D.; Chen, L.; Choo, Y.S.; Ma, H.; Tang, C.; Xia, K.; Jiang, W.; Ronai, Z.; Zhuang, X.; et al. Parkin, PINK1, and DJ-1 Form a Ubiquitin E3 Ligase Complex Promoting Unfolded Protein Degradation. J. Clin. Investig. 2009, 119, 650–660. [Google Scholar] [CrossRef] [Green Version]
- Du, F.; Yu, Q.; Yan, S.; Hu, G.; Lue, L.-F.; Walker, D.G.; Wu, L.; Yan, S.F.; Tieu, K.; Yan, S.S. PINK1 Signalling Rescues Amyloid Pathology and Mitochondrial Dysfunction in Alzheimer’s Disease. Brain 2017, 140, 3233–3251. [Google Scholar] [CrossRef] [Green Version]
- Zheng, X.; Hunter, T. Pink1, the First Ubiquitin Kinase. EMBO J. 2014, 33, 1621–1623. [Google Scholar] [CrossRef] [Green Version]
- Houck, A.L.; Seddighi, S.; Driver, J.A. At the Crossroads Between Neurodegeneration and Cancer: A Review of Overlapping Biology and Its Implications. CAS 2019, 11, 77–89. [Google Scholar] [CrossRef]
- Staropoli, J.F. Tumorigenesis and Neurodegeneration: Two Sides of the Same Coin? Bioessays 2008, 30, 719–727. [Google Scholar] [CrossRef]
- Ganguli, M. Cancer and Dementia: It’s Complicated. Alzheimer Dis. Assoc. Disord. 2015, 29, 177–182. [Google Scholar] [CrossRef]
- Inzelberg, R.; Jankovic, J. Are Parkinson Disease Patients Protected from Some but Not All Cancers? Neurology 2007, 69, 1542–1550. [Google Scholar] [CrossRef]
- Shi, H.; Tang, B.; Liu, Y.-W.; Wang, X.-F.; Chen, G.-J. Alzheimer Disease and Cancer Risk: A Meta-Analysis. J. Cancer Res. Clin. Oncol. 2015, 141, 485–494. [Google Scholar] [CrossRef]
- Bernardini, J.P.; Lazarou, M.; Dewson, G. Parkin and Mitophagy in Cancer. Oncogene 2017, 36, 1315–1327. [Google Scholar] [CrossRef]
- O’Flanagan, C.H.; Morais, V.A.; O’Neill, C. PINK1, Cancer and Neurodegeneration. Oncoscience 2016, 3, 1–2. [Google Scholar] [CrossRef]
- Levy, J.M.M.; Towers, C.G.; Thorburn, A. Targeting Autophagy in Cancer. Nat. Rev. Cancer 2017, 17, 528–542. [Google Scholar] [CrossRef]
- White, E. The Role for Autophagy in Cancer. J. Clin. Investig. 2015, 125, 42–46. [Google Scholar] [CrossRef] [Green Version]
- Michiorri, S.; Gelmetti, V.; Giarda, E.; Lombardi, F.; Romano, F.; Marongiu, R.; Nerini-Molteni, S.; Sale, P.; Vago, R.; Arena, G.; et al. The Parkinson-Associated Protein PINK1 Interacts with Beclin1 and Promotes Autophagy. Cell Death Differ. 2010, 17, 962–974. [Google Scholar] [CrossRef] [Green Version]
- Gelmetti, V.; De Rosa, P.; Torosantucci, L.; Marini, E.S.; Romagnoli, A.; Di Rienzo, M.; Arena, G.; Vignone, D.; Fimia, G.M.; Valente, E.M. PINK1 and BECN1 Relocalize at Mitochondria-Associated Membranes during Mitophagy and Promote ER-Mitochondria Tethering and Autophagosome Formation. Autophagy 2017, 13, 654–669. [Google Scholar] [CrossRef] [Green Version]
- Arena, G.; Gelmetti, V.; Torosantucci, L.; Vignone, D.; Lamorte, G.; De Rosa, P.; Cilia, E.; Jonas, E.A.; Valente, E.M. PINK1 Protects against Cell Death Induced by Mitochondrial Depolarization, by Phosphorylating Bcl-XL and Impairing Its pro-Apoptotic Cleavage. Cell Death Differ. 2013, 20, 920–930. [Google Scholar] [CrossRef] [Green Version]
- Geisler, S.; Holmström, K.M.; Skujat, D.; Fiesel, F.C.; Rothfuss, O.C.; Kahle, P.J.; Springer, W. PINK1/Parkin-Mediated Mitophagy Is Dependent on VDAC1 and P62/SQSTM1. Nat. Cell Biol. 2010, 12, 119–131. [Google Scholar] [CrossRef]
- Wood-Kaczmar, A.; Gandhi, S.; Yao, Z.; Abramov, A.S.Y.; Miljan, E.A.; Keen, G.; Stanyer, L.; Hargreaves, I.; Klupsch, K.; Deas, E.; et al. PINK1 Is Necessary for Long Term Survival and Mitochondrial Function in Human Dopaminergic Neurons. PLoS ONE 2008, 3, e2455. [Google Scholar] [CrossRef]
- Akundi, R.S.; Zhi, L.; Büeler, H. PINK1 Enhances Insulin-like Growth Factor-1-Dependent Akt Signaling and Protection against Apoptosis. Neurobiol. Dis. 2012, 45, 469–478. [Google Scholar] [CrossRef] [PubMed] [Green Version]
- Ha, J.-Y.; Kim, J.-S.; Kim, S.-E.; Son, J.H. Simultaneous Activation of Mitophagy and Autophagy by Staurosporine Protects against Dopaminergic Neuronal Cell Death. Neurosci. Lett. 2014, 561, 101–106. [Google Scholar] [CrossRef]
- Grishchuk, Y.; Ginet, V.; Truttmann, A.C.; Clarke, P.G.H.; Puyal, J. Beclin 1-Independent Autophagy Contributes to Apoptosis in Cortical Neurons. Autophagy 2011, 7, 1115–1131. [Google Scholar] [CrossRef] [Green Version]
- Petit, A.; Kawarai, T.; Paitel, E.; Sanjo, N.; Maj, M.; Scheid, M.; Chen, F.; Gu, Y.; Hasegawa, H.; Salehi-Rad, S.; et al. Wild-Type PINK1 Prevents Basal and Induced Neuronal Apoptosis, a Protective Effect Abrogated by Parkinson Disease-Related Mutations. J. Biol. Chem. 2005, 280, 34025–34032. [Google Scholar] [CrossRef] [PubMed] [Green Version]
- Gelmetti, V.; Ferraris, A.; Brusa, L.; Romano, F.; Lombardi, F.; Barzaghi, C.; Stanzione, P.; Garavaglia, B.; Dallapiccola, B.; Valente, E.M. Late Onset Sporadic Parkinson’s Disease Caused by PINK1 Mutations: Clinical and Functional Study: Late Onset Sporadic PD Due to PINK1 Mutations. Mov. Disord. 2008, 23, 881–885. [Google Scholar] [CrossRef]
- Mariño, G.; Niso-Santano, M.; Baehrecke, E.H.; Kroemer, G. Self-Consumption: The Interplay of Autophagy and Apoptosis. Nat. Rev. Mol. Cell Biol. 2014, 15, 81–94. [Google Scholar] [CrossRef] [Green Version]
- Gu, W.; Wan, D.; Qian, Q.; Yi, B.; He, Z.; Gu, Y.; Wang, L.; He, S. Ambra1 Is an Essential Regulator of Autophagy and Apoptosis in SW620 Cells: Pro-Survival Role of Ambra1. PLoS ONE 2014, 9, e90151. [Google Scholar] [CrossRef] [Green Version]
- Weihofen, A.; Ostaszewski, B.; Minami, Y.; Selkoe, D.J. Pink1 Parkinson Mutations, the Cdc37/Hsp90 Chaperones and Parkin All Influence the Maturation or Subcellular Distribution of Pink1. Hum. Mol. Genet. 2008, 17, 602–616. [Google Scholar] [CrossRef]
- Lin, W.; Kang, U.J. Structural Determinants of PINK1 Topology and Dual Subcellular Distribution. BMC Cell Biol. 2010, 11, 90. [Google Scholar] [CrossRef] [Green Version]
- Karaman, M.W.; Herrgard, S.; Treiber, D.K.; Gallant, P.; Atteridge, C.E.; Campbell, B.T.; Chan, K.W.; Ciceri, P.; Davis, M.I.; Edeen, P.T.; et al. A Quantitative Analysis of Kinase Inhibitor Selectivity. Nat. Biotechnol. 2008, 26, 127–132. [Google Scholar] [CrossRef]
- Wirawan, E.; Vande Walle, L.; Kersse, K.; Cornelis, S.; Claerhout, S.; Vanoverberghe, I.; Roelandt, R.; De Rycke, R.; Verspurten, J.; Declercq, W.; et al. Caspase-Mediated Cleavage of Beclin-1 Inactivates Beclin-1-Induced Autophagy and Enhances Apoptosis by Promoting the Release of Proapoptotic Factors from Mitochondria. Cell Death Dis. 2010, 1, e18. [Google Scholar] [CrossRef]
- Kang, R.; Zeh, H.J.; Lotze, M.T.; Tang, D. The Beclin 1 Network Regulates Autophagy and Apoptosis. Cell Death Differ. 2011, 18, 571–580. [Google Scholar] [CrossRef]
- Valente, E.M.; Abou-Sleiman, P.M.; Caputo, V.; Muqit, M.M.K.; Harvey, K.; Gispert, S.; Ali, Z.; Del Turco, D.; Bentivoglio, A.R.; Healy, D.G.; et al. Hereditary Early-Onset Parkinson’s Disease Caused by Mutations in PINK1. Science 2004, 304, 1158–1160. [Google Scholar] [CrossRef] [Green Version]
- Khalil, B.; El Fissi, N.; Aouane, A.; Cabirol-Pol, M.-J.; Rival, T.; Liévens, J.-C. PINK1-Induced Mitophagy Promotes Neuroprotection in Huntington’s Disease. Cell Death Dis. 2015, 6, e1617. [Google Scholar] [CrossRef] [Green Version]
- Panigrahi, D.P.; Praharaj, P.P.; Bhol, C.S.; Mahapatra, K.K.; Patra, S.; Behera, B.P.; Mishra, S.R.; Bhutia, S.K. The Emerging, Multifaceted Role of Mitophagy in Cancer and Cancer Therapeutics. Semin. Cancer Biol. 2020, 66, 45–58. [Google Scholar] [CrossRef]
- Salazar, C.; Ruiz-Hincapie, P.; Ruiz, L. The Interplay among PINK1/PARKIN/Dj-1 Network during Mitochondrial Quality Control in Cancer Biology: Protein Interaction Analysis. Cells 2018, 7, 154. [Google Scholar] [CrossRef] [Green Version]
- Lazarou, M.; Sliter, D.A.; Kane, L.A.; Sarraf, S.A.; Wang, C.; Burman, J.L.; Sideris, D.P.; Fogel, A.I.; Youle, R.J. The Ubiquitin Kinase PINK1 Recruits Autophagy Receptors to Induce Mitophagy. Nature 2015, 524, 309–314. [Google Scholar] [CrossRef] [Green Version]
- Rakovic, A.; Shurkewitsch, K.; Seibler, P.; Grünewald, A.; Zanon, A.; Hagenah, J.; Krainc, D.; Klein, C. Phosphatase and Tensin Homolog (PTEN)-Induced Putative Kinase 1 (PINK1)-Dependent Ubiquitination of Endogenous Parkin Attenuates Mitophagy. J. Biol. Chem. 2013, 288, 2223–2237. [Google Scholar] [CrossRef] [PubMed] [Green Version]
- McWilliams, T.G.; Prescott, A.R.; Montava-Garriga, L.; Ball, G.; Singh, F.; Barini, E.; Muqit, M.M.K.; Brooks, S.P.; Ganley, I.G. Basal Mitophagy Occurs Independently of PINK1 in Mouse Tissues of High Metabolic Demand. Cell Metab. 2018, 27, 439–449.e5. [Google Scholar] [CrossRef] [Green Version]
- Sliter, D.A.; Martinez, J.; Hao, L.; Chen, X.; Sun, N.; Fischer, T.D.; Burman, J.L.; Li, Y.; Zhang, Z.; Narendra, D.P.; et al. Parkin and PINK1 Mitigate STING-Induced Inflammation. Nature 2018, 561, 258–262. [Google Scholar] [CrossRef] [PubMed]
- Xicoy, H.; Wieringa, B.; Martens, G.J.M. The SH-SY5Y Cell Line in Parkinson’s Disease Research: A Systematic Review. Mol. Neurodegener. 2017, 12, 10. [Google Scholar] [CrossRef] [PubMed] [Green Version]
- Haque, M.E.; Thomas, K.J.; D’Souza, C.; Callaghan, S.; Kitada, T.; Slack, R.S.; Fraser, P.; Cookson, M.R.; Tandon, A.; Park, D.S. Cytoplasmic Pink1 Activity Protects Neurons from Dopaminergic Neurotoxin MPTP. Proc. Natl. Acad. Sci. USA 2008, 105, 1716–1721. [Google Scholar] [CrossRef] [Green Version]
- Quinn, P.M.J.; Moreira, P.I.; Ambrósio, A.F.; Alves, C.H. PINK1/PARKIN Signalling in Neurodegeneration and Neuroinflammation. Acta Neuropathol. Commun. 2020, 8, 189. [Google Scholar] [CrossRef]
- Yoo, L.; Chung, K.C. The Ubiquitin E3 Ligase CHIP Promotes Proteasomal Degradation of the Serine/Threonine Protein Kinase PINK1 during Staurosporine-Induced Cell Death. J. Biol. Chem. 2018, 293, 1286–1297. [Google Scholar] [CrossRef] [Green Version]
- Brunelli, F.; Valente, E.M.; Arena, G. Mechanisms of Neurodegeneration in Parkinson’s Disease: Keep Neurons in the PINK1. Mech. Ageing Dev. 2020, 189, 111277. [Google Scholar] [CrossRef]
- Hertz, N.T.; Berthet, A.; Sos, M.L.; Thorn, K.S.; Burlingame, A.L.; Nakamura, K.; Shokat, K.M. A Neo-Substrate That Amplifies Catalytic Activity of Parkinson’s-Disease-Related Kinase PINK1. Cell 2013, 154, 737–747. [Google Scholar] [CrossRef] [Green Version]


Publisher’s Note: MDPI stays neutral with regard to jurisdictional claims in published maps and institutional affiliations. |
© 2022 by the authors. Licensee MDPI, Basel, Switzerland. This article is an open access article distributed under the terms and conditions of the Creative Commons Attribution (CC BY) license (https://creativecommons.org/licenses/by/4.0/).
Share and Cite
Brunelli, F.; Torosantucci, L.; Gelmetti, V.; Franzone, D.; Grünewald, A.; Krüger, R.; Arena, G.; Valente, E.M. PINK1 Protects against Staurosporine-Induced Apoptosis by Interacting with Beclin1 and Impairing Its Pro-Apoptotic Cleavage. Cells 2022, 11, 678. https://doi.org/10.3390/cells11040678
Brunelli F, Torosantucci L, Gelmetti V, Franzone D, Grünewald A, Krüger R, Arena G, Valente EM. PINK1 Protects against Staurosporine-Induced Apoptosis by Interacting with Beclin1 and Impairing Its Pro-Apoptotic Cleavage. Cells. 2022; 11(4):678. https://doi.org/10.3390/cells11040678
Chicago/Turabian StyleBrunelli, Francesco, Liliana Torosantucci, Vania Gelmetti, Davide Franzone, Anne Grünewald, Rejko Krüger, Giuseppe Arena, and Enza Maria Valente. 2022. "PINK1 Protects against Staurosporine-Induced Apoptosis by Interacting with Beclin1 and Impairing Its Pro-Apoptotic Cleavage" Cells 11, no. 4: 678. https://doi.org/10.3390/cells11040678
APA StyleBrunelli, F., Torosantucci, L., Gelmetti, V., Franzone, D., Grünewald, A., Krüger, R., Arena, G., & Valente, E. M. (2022). PINK1 Protects against Staurosporine-Induced Apoptosis by Interacting with Beclin1 and Impairing Its Pro-Apoptotic Cleavage. Cells, 11(4), 678. https://doi.org/10.3390/cells11040678