
Transcriptomic Analysis of Colorectal Cancer Cells Treated with Oil Production Waste Products (OPWPs) Reveals Enrichment of Pathways of Mitochondrial Functionality

 , , , , , ,
  and
and 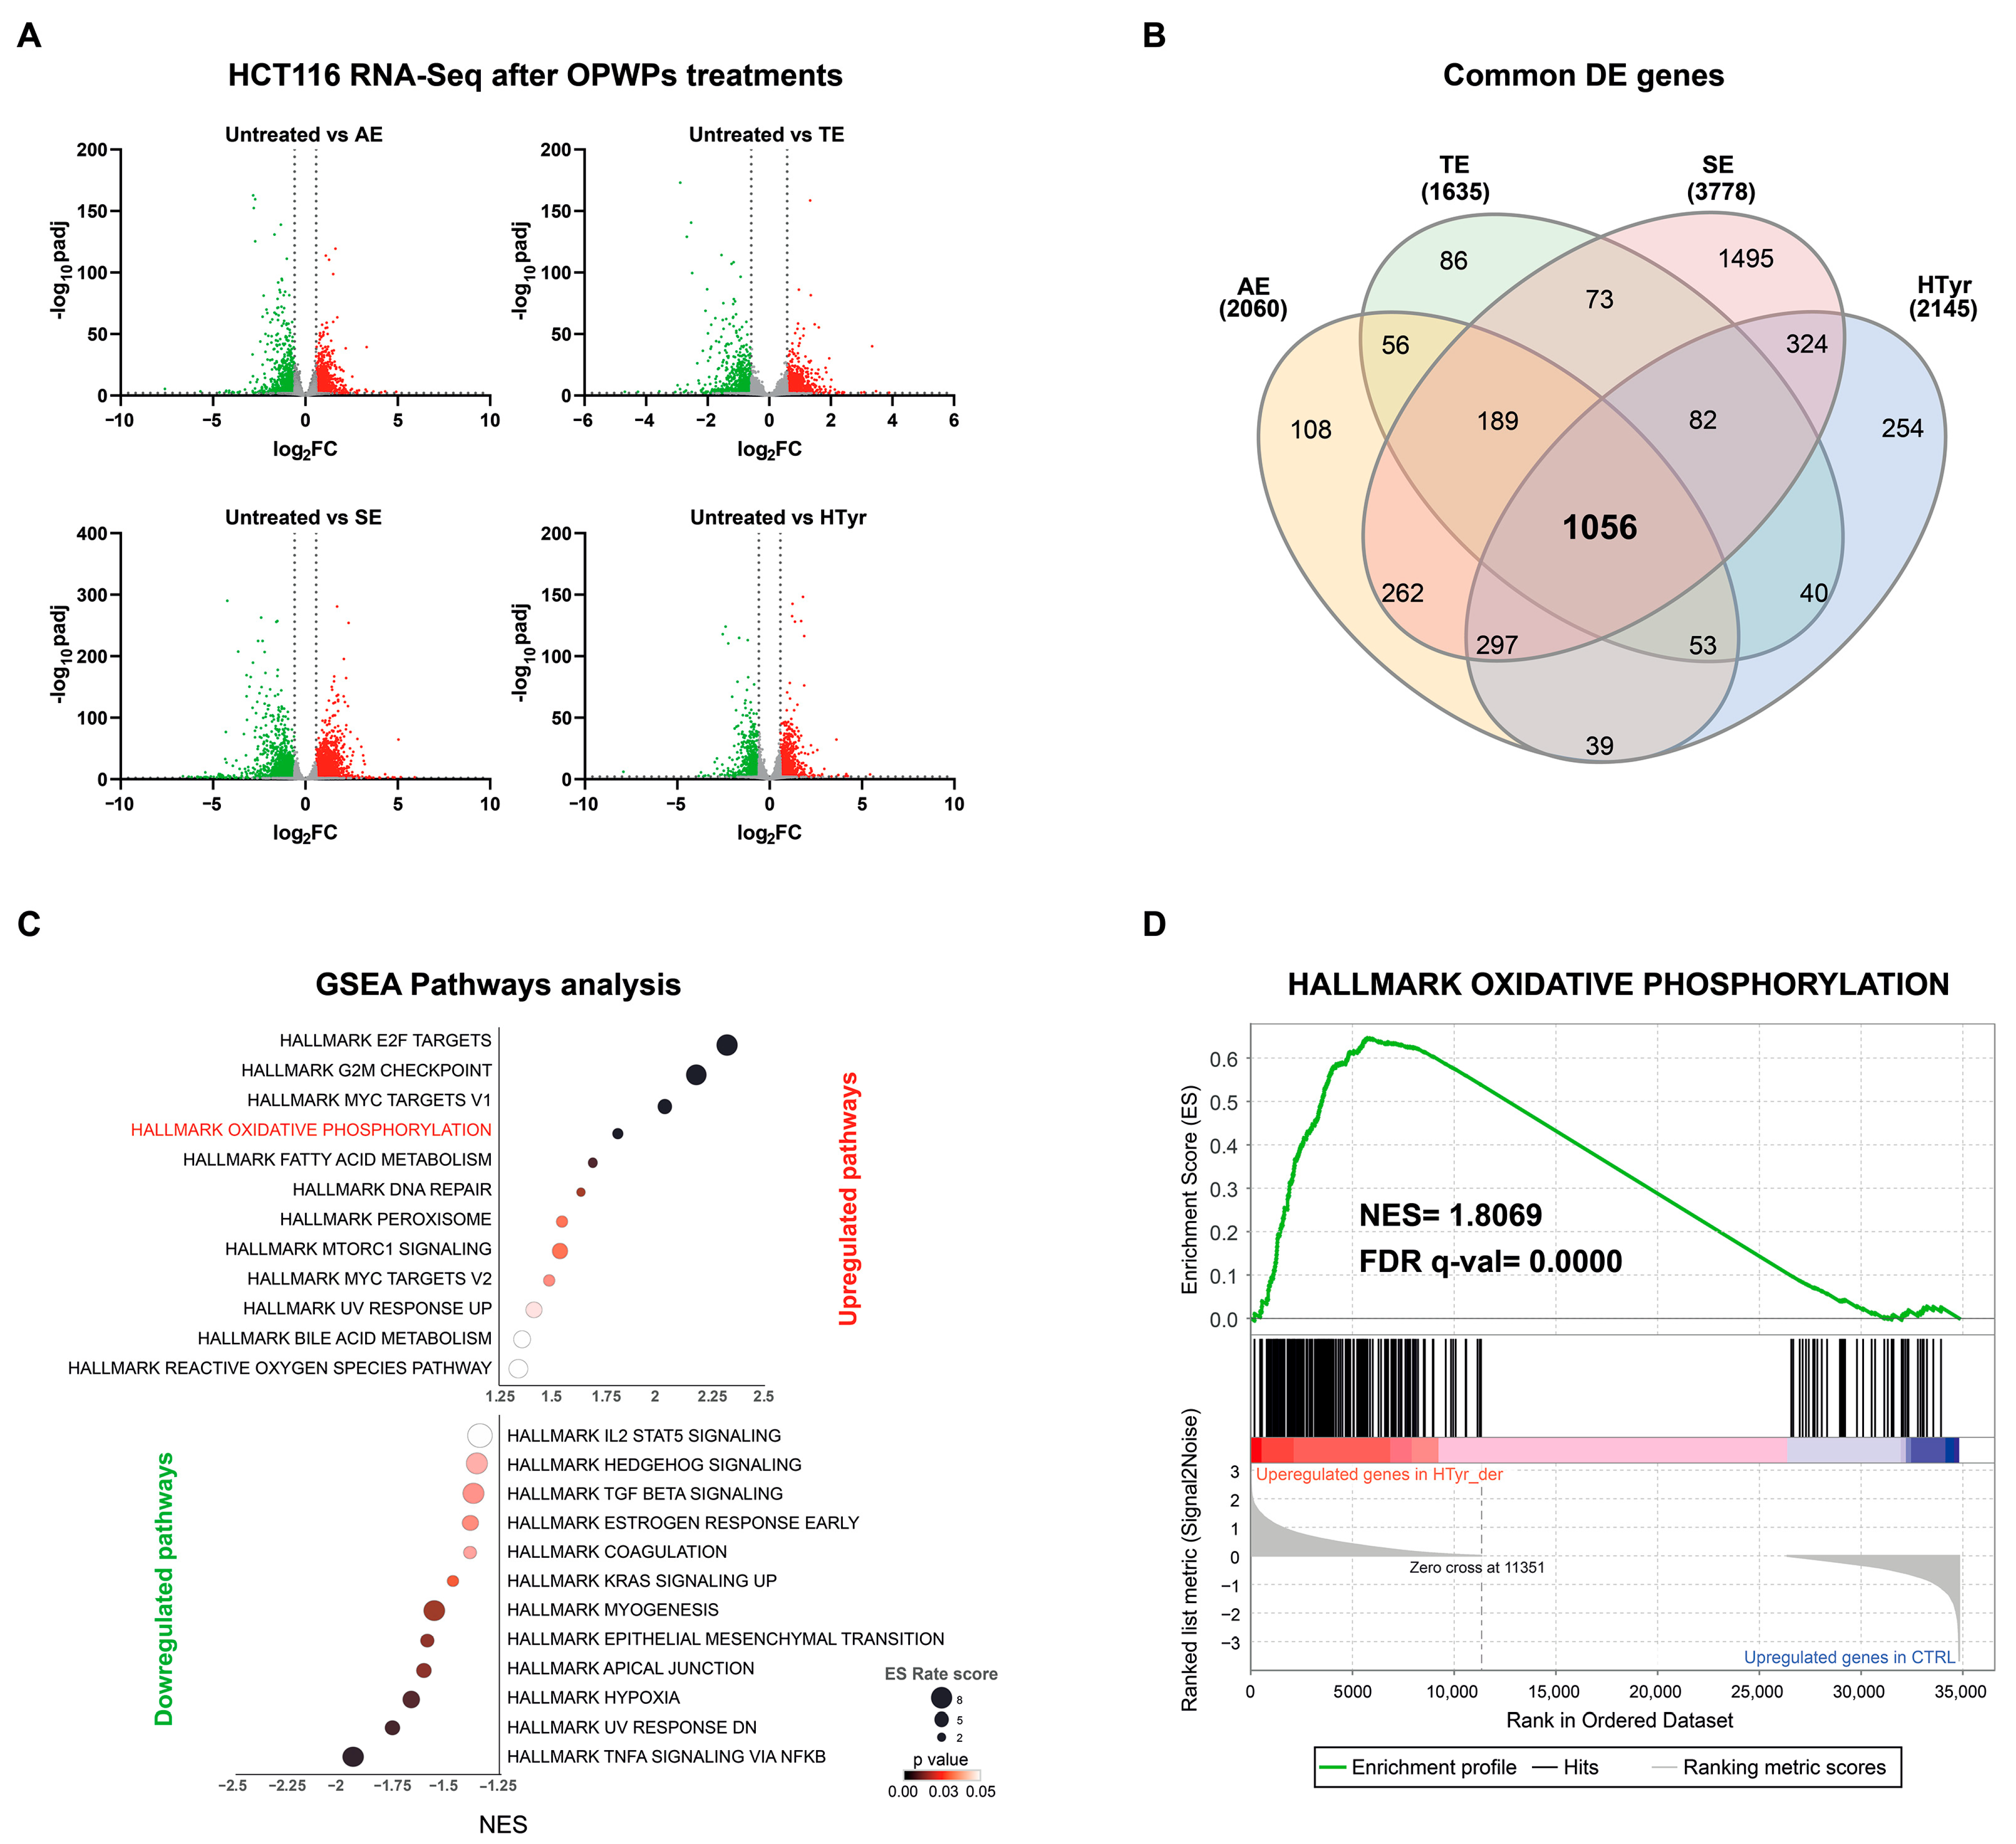
Abstract
1. Introduction
2. Materials and Methods
2.1. OPWPs Extracts
2.2. Cell Culture and Treatments
2.3. RNA Extraction and Sequencing
2.4. Bioinformatic Analysis
2.5. Western Blot Analysis
2.6. ATP Assay
2.7. Flow Cytometry Analysis
2.8. Immunofluorescence and Microscopy
2.9. Statistical Analysis
3. Results
3.1. Transcriptomic Analysis in CRC HCT116 Cells Treated with HTyr or OPWPs Extracts
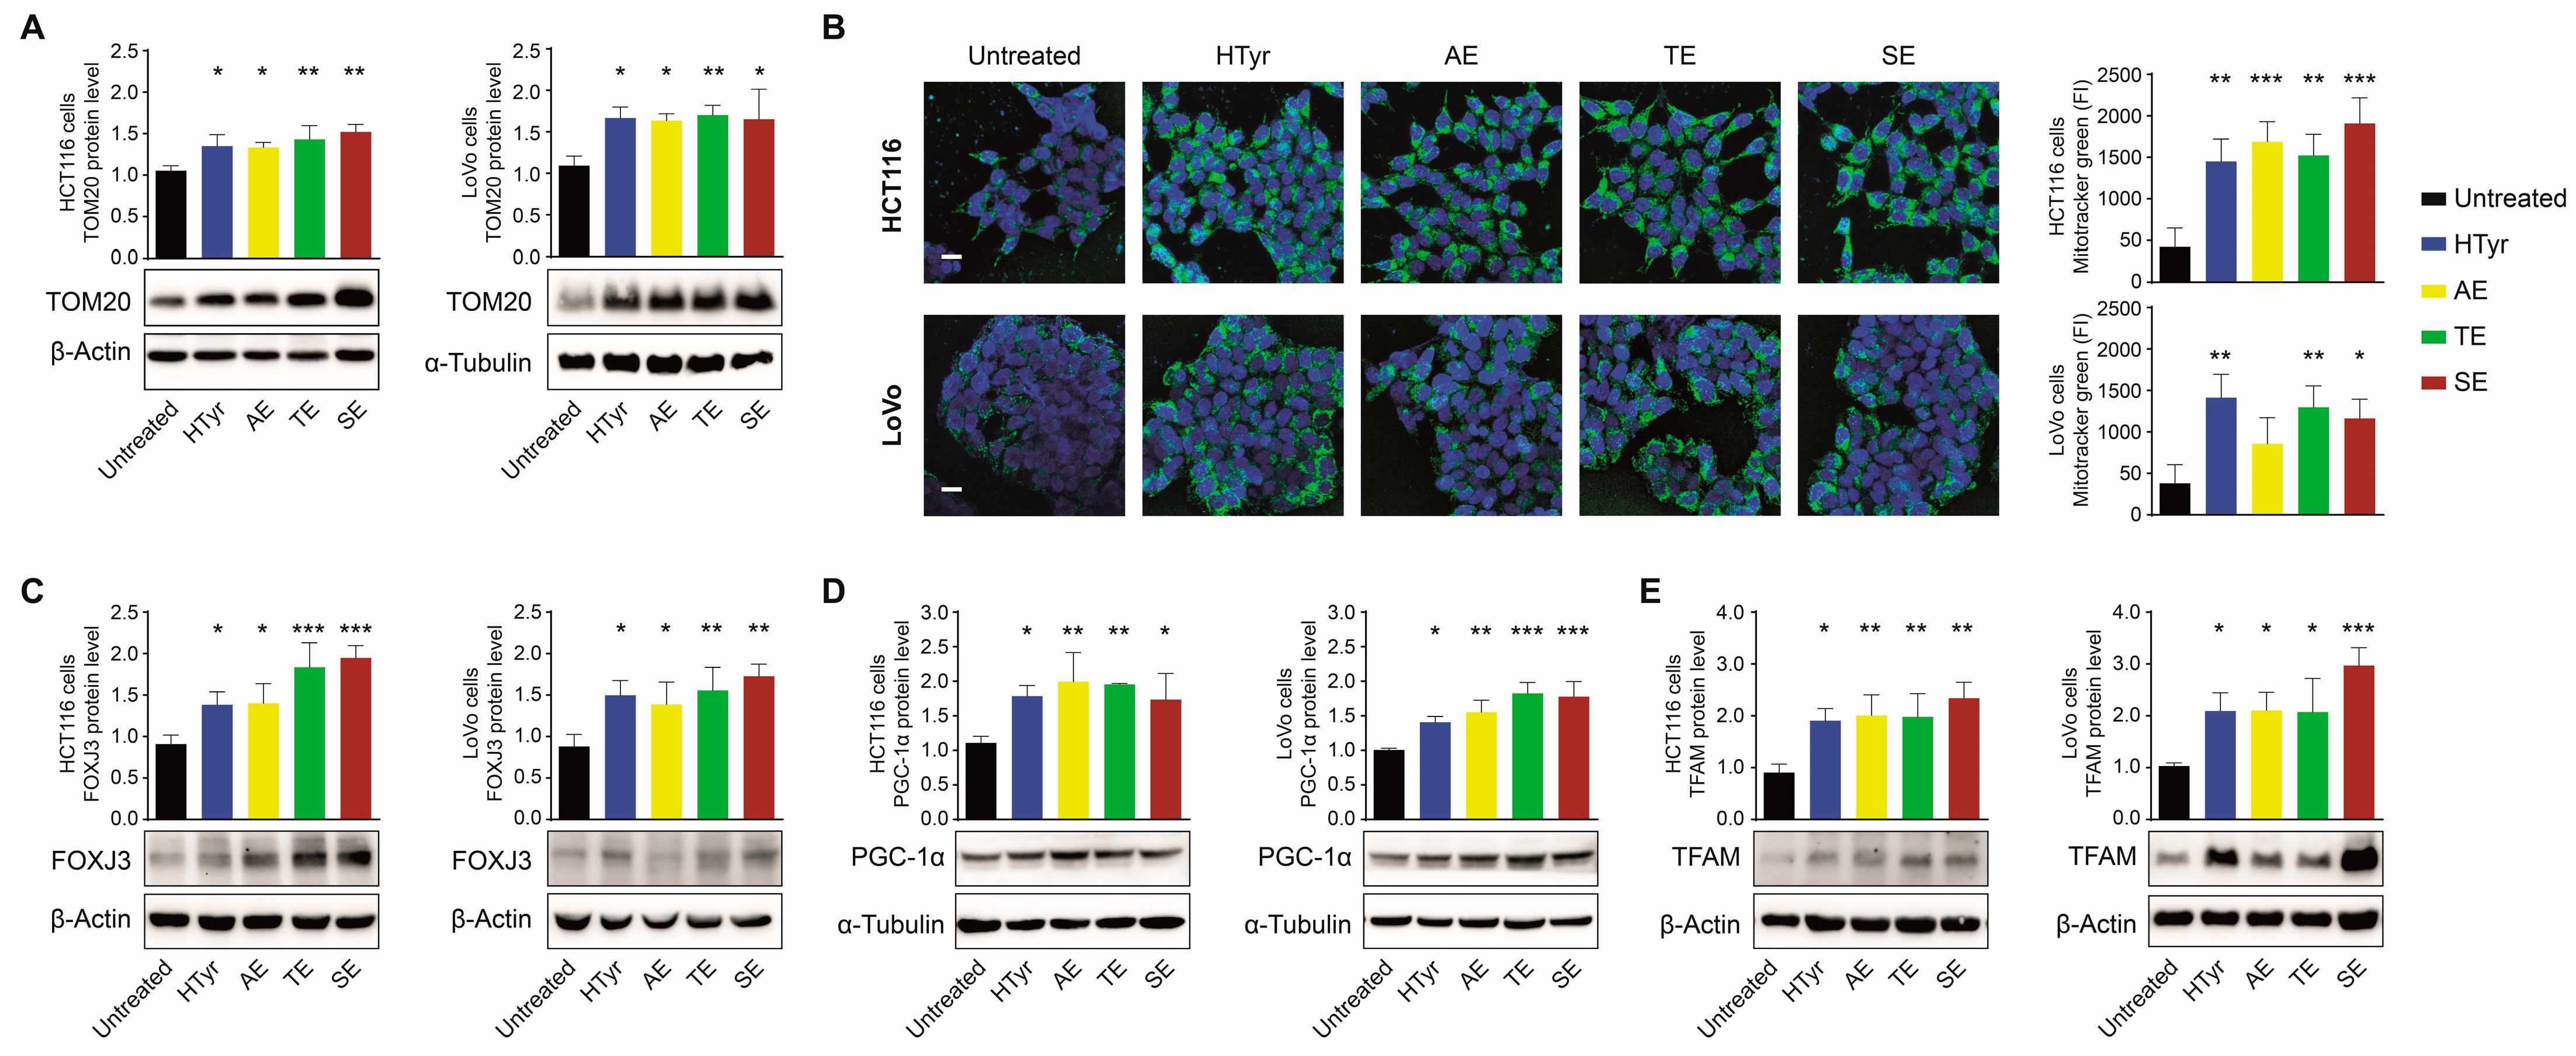
3.2. HTyr and OPWPs Extracts Affect Mitochondrial Functions
3.3. HTyr and OPWPs Extracts Promote Mitochondrial Biogenesis and Influence Dynamics
3.4. PPARγ Mediates the Effects of HTyr on Mitochondrial Biogenesis and Dynamics
4. Discussion
5. Conclusions
Supplementary Materials
Author Contributions
Funding
Institutional Review Board Statement
Informed Consent Statement
Data Availability Statement
Acknowledgments
Conflicts of Interest
References
- Souilem, S.; El-Abbassi, A.; Kiai, H.; Hafidi, A.; Sayadi, S.; Galanakis, C.M. Olive oil production sector: Environmental effects and sustainability challenges. In Olive Mill Waste: Recent Advances for Sustainable Management; Academic Press: Cambridge, MA, USA, 2017; pp. 1–28. [Google Scholar] [CrossRef]
- Rapa, M.; Ciano, S. A Review on Life Cycle Assessment of the Olive Oil Production. Sustainability 2022, 14, 654. [Google Scholar] [CrossRef]
- Casa, R.; D’Annibale, A.; Pieruccetti, F.; Stazi, S.R.; Sermanni, G.G.; Cascio, B.L. Reduction of the phenolic components in olive-mill wastewater by an enzymatic treatment and its impact on durum wheat (Triticum durum Desf.) germinability. Chemosphere 2003, 50, 959–966. [Google Scholar] [CrossRef] [PubMed]
- Ribeiro, T.B.; Oliveira, A.L.; Costa, C.; Nunes, J.; Vicente, A.A.; Pintado, M. Total and Sustainable Valorisation of Olive Pomace Using a Fractionation Approach. Appl. Sci. 2020, 10, 6785. [Google Scholar] [CrossRef]
- Koutsos, T.M.; Chatzistathis, T.; Balampekou, E.I. A new framework proposal, towards a common EU agricultural policy, with the best sustainable practices for the re-use of olive mill wastewater. Sci. Total Environ. 2018, 622–623, 942–953. [Google Scholar] [CrossRef] [PubMed]
- Luzi, F.; Pannucci, E.; Clemente, M.; Grande, E.; Urciuoli, S.; Romani, A.; Torre, L.; Puglia, D.; Bernini, R.; Santi, L. Hydroxytyrosol and Oleuropein-Enriched Extracts Obtained from Olive Oil Wastes and By-Products as Active Antioxidant Ingredients for Poly (Vinyl Alcohol)-Based Films. Molecules 2021, 26, 2104. [Google Scholar] [CrossRef]
- Fernandez-Bolanos, J.; Lopez, O.; Fernandez-Bolanos, J.; Rodriguez-Gutierrez, G. Hydroxytyrosol and Derivatives: Isolation, Synthesis, and Biological Properties. Curr. Org. Chem. 2008, 12, 442–463. [Google Scholar] [CrossRef]
- Bertelli, M.; Kiani, A.K.; Paolacci, S.; Manara, E.; Kurti, D.; Dhuli, K.; Bushati, V.; Miertus, J.; Pangallo, D.; Baglivo, M.; et al. Hydroxytyrosol: A natural compound with promising pharmacological activities. J. Biotechnol. 2020, 309, 29–33. [Google Scholar] [CrossRef]
- Fraga, C.G.; Croft, K.D.; Kennedy, D.O.; Tomás-Barberán, F.A. The effects of polyphenols and other bioactives on human health. Food Funct. 2019, 10, 514–528. [Google Scholar] [CrossRef]
- Belščak-Cvitanović, A.; Durgo, K.; Huđek, A.; Bačun-Družina, V.; Komes, D. Overview of polyphenols and their properties. In Polyphenols: Properties, Recovery, and Applications; Woodhead Publishing: Sawston, UK, 2018; pp. 3–44. [Google Scholar] [CrossRef]
- Hazafa, A.; Rehman, K.U.; Jahan, N.; Jabeen, Z. The Role of Polyphenol (Flavonoids) Compounds in the Treatment of Cancer Cells. Nutr. Cancer 2020, 72, 389–397. [Google Scholar] [CrossRef]
- Lagouge, M.; Argmann, C.; Gerhart-Hines, Z.; Meziane, H.; Lerin, C.; Daussin, F.; Messadeq, N.; Milne, J.; Lambert, P.; Elliott, P.; et al. Resveratrol improves mitochondrial function and protects against metabolic disease by activating SIRT1 and PGC-1alpha. Cell 2006, 127, 1109–1122. [Google Scholar] [CrossRef]
- Obrenovich, M.; Li, Y.; Tayahi, M.; Reddy, V.P. Polyphenols and small phenolic acids as cellular metabolic regulators. Curr. Issues Mol. Biol. 2022, 44, 285. [Google Scholar] [CrossRef] [PubMed]
- Judge, A.; Dodd, M.S. Metabolism. Essays Biochem. 2020, 64, 607–647. [Google Scholar] [CrossRef]
- Metallo, C.M.; Vander Heiden, M.G. Understanding Metabolic Regulation and Its Influence on Cell Physiology. Mol. Cell 2013, 49, 388–398. [Google Scholar] [CrossRef] [PubMed]
- Spinelli, J.B.; Haigis, M.C. The Multifaceted Contributions of Mitochondria to Cellular Metabolism. Nat. Cell Biol. 2018, 7, 745–754. [Google Scholar] [CrossRef]
- Jornayvaz, F.R.; Shulman, G.I. Regulation of mitochondrial biogenesis. Essays Biochem. 2010, 47, 69–84. [Google Scholar] [CrossRef] [PubMed]
- Wai, T.; Langer, T. Mitochondrial Dynamics and Metabolic Regulation. Trends Endocrinol. Metab. 2016, 27, 105–117. [Google Scholar] [CrossRef] [PubMed]
- Van der Bliek, A.M.; Shen, Q.; Kawajiri, S. Mechanisms of mitochondrial fission and fusion. Cold Spring Harb. Perspect. Biol. 2013, 5, a011072. [Google Scholar] [CrossRef]
- Villena, J.A. New insights into PGC-1 coactivators: Redefining their role in the regulation of mitochondrial function and beyond. FEBS J. 2015, 282, 647–672. [Google Scholar] [CrossRef]
- Rius-Pérez, S.; Torres-Cuevas, I.; Millán, I.; Ortega, Á.L.; Pérez, S.; Sandhu, M.A. PGC-1α, Inflammation, and Oxidative Stress: An Integrative View in Metabolism. Oxid. Med. Cell. Longev. 2020, 2020, 1452696. [Google Scholar] [CrossRef]
- Semple, R.K.; Chatterjee, V.K.K.; O’Rahilly, S. PPAR gamma and human metabolic disease. J. Clin. Investig. 2006, 116, 581–589. [Google Scholar] [CrossRef]
- Ahmadian, M.; Myoung Suh, J.; Hah, N.; Liddle, C.; Atkins, A.R.; Downes, M.; Evans, R.M. PPARgamma signaling and metabolism: The good, the bad and the future. Nat. Med. 2013, 19, 557–566. [Google Scholar] [CrossRef] [PubMed]
- Bernini, R.; Crisante, F.; Merendino, N.; Molinari, R.; Soldatelli, M.C.; Velotti, F. Synthesis of a novel ester of hydroxytyrosol and α-lipoic acid exhibiting an antiproliferative effect on human colon cancer HT-29 cells. Eur. J. Med. Chem. 2011, 46, 439–446. [Google Scholar] [CrossRef] [PubMed]
- Leo, M.; Muccillo, L.; Dugo, L.; Bernini, R.; Santi, L.; Sabatino, L. Polyphenols Extracts from Oil Production Waste Products (OPWPs) Reduce Cell Viability and Exert Anti-Inflammatory Activity via PPARγ Induction in Colorectal Cancer Cells. Antioxidants 2022, 11, 624. [Google Scholar] [CrossRef] [PubMed]
- Zhu, A.; Ibrahim, J.G.; Love, M.I. Heavy-Tailed prior distributions for sequence count data: Removing the noise and preserving large differences. Bioinformatics 2019, 35, 2084–2092. [Google Scholar] [CrossRef] [PubMed]
- Barisciano, G.; Leo, M.; Muccillo, L.; Pranzini, E.; Parri, M.; Colantuoni, V.; Taddei, M.L.; Sabatino, L. The mir-27a/foxj3 axis dysregulates mitochondrial homeostasis in colorectal cancer cells. Cancers 2021, 13, 4994. [Google Scholar] [CrossRef]
- Shryock, J.C.; Rubio, R.; Berne, R.M. Extraction of adenine nucleotides from cultured endothelial cells. Anal. Biochem. 1986, 159, 73–81. [Google Scholar] [CrossRef]
- Kent, L.N.; Leone, G. The broken cycle: E2F dysfunction in cancer. Nat. Rev. Cancer 2019, 19, 326–338. [Google Scholar] [CrossRef]
- Polager, S.; Ginsberg, D. E2F mediates sustained G2 arrest and down-regulation of Stathmin and AIM-1 expression in response to genotoxic stress. J. Biol. Chem. 2003, 278, 1443–1449. [Google Scholar] [CrossRef]
- Goldsmith, C.D.; Bond, D.R.; Jankowski, H.; Weidenhofer, J.; Stathopoulos, C.E.; Roach, P.D.; Scarlett, C.J. The olive biophenols oleuropein and hydroxytyrosol selectively reduce proliferation, influence the cell cycle, and induce apoptosis in pancreatic cancer cells. Int. J. Mol. Sci. 2018, 19, 1937. [Google Scholar] [CrossRef]
- Zhu, G.; Pei, L.; Xia, H.; Tang, Q.; Bi, F. Role of oncogenic KRAS in the prognosis, diagnosis and treatment of colorectal cancer. Mol. Cancer 2021, 20, 143. [Google Scholar] [CrossRef]
- Glaus Garzon, J.F.; Pastrello, C.; Jurisica, I.; Hottiger, M.O.; Wenger, R.H.; Borsig, L. Tumor cell endogenous HIF-1α activity induces aberrant angiogenesis and interacts with TRAF6 pathway required for colorectal cancer development. Neoplasia 2020, 22, 745–758. [Google Scholar] [CrossRef] [PubMed]
- Vu, T.; Datta, P.K. Regulation of EMT in colorectal cancer: A culprit in metastasis. Cancers 2017, 9, 171. [Google Scholar] [CrossRef] [PubMed]
- Alexander, M.S.; Shi, X.; Voelker, K.A.; Grange, R.W.; Garcia, J.A.; Hammer, R.E.; Garry, D.J. Foxj3 transcriptionally activates Mef2c and regulates adult skeletal muscle fiber type identity. Dev. Biol. 2010, 337, 396–404. [Google Scholar] [CrossRef] [PubMed]
- Czubryt, M.P.; McAnally, J.; Fishman, G.I.; Olson, E.N. Regulation of peroxisome proliferator-activated receptor γ coactivator 1α (PGC-1α) and mitochondrial function by MEF2 and HDAC5. Proc. Natl. Acad. Sci. USA 2003, 100, 1711–1716. [Google Scholar] [CrossRef]
- Gureev, A.P.; Shaforostova, E.A.; Popov, V.N. Regulation of mitochondrial biogenesis as a way for active longevity: Interaction between the Nrf2 and PGC-1α signaling pathways. Front. Genet. 2019, 10, 435. [Google Scholar] [CrossRef]
- Larsson, N.G.; Wang, J.; Wilhelmsson, H.; Oldfors, A.; Rustin, P.; Lewandoski, M.; Barsh, G.S.; Clayton, D.A. Mitochondrial transcription factor A is necessary for mtDNA maintenance and embryogenesis in mice. Nat. Genet. 1998, 18, 231–236. [Google Scholar] [CrossRef]
- Handschin, C.; Rhee, J.; Lin, J.; Tarr, P.T.; Spiegelman, B.M. An autoregulatory loop controls peroxisome proliferator-activated receptor γ coactivator 1α expression in muscle. Proc. Natl. Acad. Sci. USA 2003, 100, 7111–7116. [Google Scholar] [CrossRef]
- Hong, F.; Pan, S.; Guo, Y.; Xu, P.; Zhai, Y. PPARs as nuclear receptors for nutrient and energy metabolism. Molecules 2019, 24, 2545. [Google Scholar] [CrossRef]
- Prashant, M.; David, C.C. Metabolic regulation of mitochondrial dynamics. J. Cell Biol. 2016, 212, 379–387. [Google Scholar] [CrossRef]
- Youle, R.J.; Van Der Bliek, A.M. Mitochondrial fission, fusion, and stress. Science 2012, 337, 1062–1065. [Google Scholar] [CrossRef]
- Kikusato, M.; Muroi, H.; Uwabe, Y.; Furukawa, K.; Toyomizu, M. Oleuropein induces mitochondrial biogenesis and decreases reactive oxygen species generation in cultured avian muscle cells, possibly via an up-regulation of peroxisome proliferator-activated receptor γ coactivator-1α. Anim. Sci. J. 2016, 87, 1371–1378. [Google Scholar] [CrossRef] [PubMed]
- Hao, J.; Shen, W.; Yu, G.; Jia, H.; Li, X.; Feng, Z.; Wang, Y.; Weber, P.; Wertz, K.; Sharman, E.; et al. Hydroxytyrosol promotes mitochondrial biogenesis and mitochondrial function in 3T3-L1 adipocytes. J. Nutr. Biochem. 2010, 21, 634–644. [Google Scholar] [CrossRef] [PubMed]
- Dong, Y.Z.; Li, L.; Espe, M.; Lu, K.L.; Rahimnejad, S. Hydroxytyrosol attenuates hepatic fat accumulation via activating mitochondrial biogenesis and autophagy through the AMPK pathway. J. Agric. Food Chem. 2020, 68, 9377–9386. [Google Scholar] [CrossRef] [PubMed]
- Jamwal, S.; Blackburn, J.K.; Elsworth, J.D. PPARγ/PGC1α signaling as a potential therapeutic target for mitochondrial biogenesis in neurodegenerative disorders. Pharmacol. Ther. 2021, 219, 107705. [Google Scholar] [CrossRef] [PubMed]
- Benot-Dominguez, R.; Tupone, M.G.; Castelli, V.; d’Angelo, M.; Benedetti, E.; Quintiliani, M.; Cinque, B.; Forte, I.M.; Cifone, M.G.; Ippoliti, R.; et al. Olive leaf extract impairs mitochondria by pro-oxidant activity in MDA-MB-231 and OVCAR-3 cancer cells. Biomed. Pharmacother. 2021, 134, 111139. [Google Scholar] [CrossRef]
- Chen, X.; Ji, Z.; Webber, A.; Sharrocks, A.D. Genome-wide binding studies reveal DNA binding specificity mechanisms and functional interplay amongst Forkhead transcription factors. Nucleic Acids Res. 2016, 44, 1566–1578. [Google Scholar] [CrossRef]
- Shu, Z.W.; Zhang, X.C.; Zheng, L.; Zeng, G.N.; Mo, Y.; Yu, M.; Zhang, X.; Tan, X.R. Epigallocatechin-3-gallate regulates mitofusin 2 expression through the peroxisome proliferator-activated receptor-γ coactivator-1α and estrogen-related receptor-α pathway. J. Cell. Biochem. 2019, 120, 7211–7221. [Google Scholar] [CrossRef]


Publisher’s Note: MDPI stays neutral with regard to jurisdictional claims in published maps and institutional affiliations. |
© 2022 by the authors. Licensee MDPI, Basel, Switzerland. This article is an open access article distributed under the terms and conditions of the Creative Commons Attribution (CC BY) license (https://creativecommons.org/licenses/by/4.0/).
Share and Cite
Leo, M.; Muccillo, L.; Pranzini, E.; Barisciano, G.; Parri, M.; Lopatriello, G.; Carlomagno, M.; Santi, A.; Taddei, M.L.; Sabatino, L. Transcriptomic Analysis of Colorectal Cancer Cells Treated with Oil Production Waste Products (OPWPs) Reveals Enrichment of Pathways of Mitochondrial Functionality. Cells 2022, 11, 3992. https://doi.org/10.3390/cells11243992
Leo M, Muccillo L, Pranzini E, Barisciano G, Parri M, Lopatriello G, Carlomagno M, Santi A, Taddei ML, Sabatino L. Transcriptomic Analysis of Colorectal Cancer Cells Treated with Oil Production Waste Products (OPWPs) Reveals Enrichment of Pathways of Mitochondrial Functionality. Cells. 2022; 11(24):3992. https://doi.org/10.3390/cells11243992
Chicago/Turabian StyleLeo, Manuela, Livio Muccillo, Erica Pranzini, Giovannina Barisciano, Matteo Parri, Giulia Lopatriello, Marco Carlomagno, Alice Santi, Maria Letizia Taddei, and Lina Sabatino. 2022. "Transcriptomic Analysis of Colorectal Cancer Cells Treated with Oil Production Waste Products (OPWPs) Reveals Enrichment of Pathways of Mitochondrial Functionality" Cells 11, no. 24: 3992. https://doi.org/10.3390/cells11243992
APA StyleLeo, M., Muccillo, L., Pranzini, E., Barisciano, G., Parri, M., Lopatriello, G., Carlomagno, M., Santi, A., Taddei, M. L., & Sabatino, L. (2022). Transcriptomic Analysis of Colorectal Cancer Cells Treated with Oil Production Waste Products (OPWPs) Reveals Enrichment of Pathways of Mitochondrial Functionality. Cells, 11(24), 3992. https://doi.org/10.3390/cells11243992