Abstract
Staphylococcus epidermidis is a leading cause of biofilm-associated infections on implanted medical devices. During the treatment of an infection, bacterial cells inside biofilms may be exposed to sublethal concentrations of the antimicrobial agents. In the present study, the effect of subinhibitory concentrations of tigecycline (TC) on biofilms formed by S. epidermidis strain RP62A was investigated using a quantitative global proteomic technique. Sublethal concentrations of TC [1/8 (T1) and 1/4 minimum inhibitory concentration (MIC) (T2)] promoted biofilm production in strain RP62A, but 1/2 MIC TC (T3) significantly inhibited biofilm production. Overall, 413, 429, and 518 proteins were differentially expressed in biofilms grown with 1/8 (T1), 1/4 (T2), and 1/2 (T3) MIC of TC, respectively. As the TC concentration increased, the number of induced proteins in each Cluster of Orthologous Groups (COG) and Kyoto Encyclopedia of Genes and Genomes (KEGG) pathway increased. The TC concentration dependence of the proteome response highlights the diverse mechanisms of adaptive responses in strain RP62A biofilms. In both COG and KEGG functional analyses, most upregulated proteins belong to the metabolism pathway, suggesting that it may play an important role in the defense of strain RP62A biofilm cells against TC stress. Sub-MIC TC treatment of strain RP62A biofilms led to significant changes of protein expression related to biofilm formation, antimicrobial resistance, virulence, quorum sensing, ABC transporters, protein export, purine/pyrimidine biosynthesis, ribosomes, and essential proteins. Interestingly, in addition to tetracycline resistance, proteins involved in resistance of various antibiotics, including aminoglycosides, antimicrobial peptides, β-lactams, erythromycin, fluoroquinolones, fusidic acid, glycopeptides, lipopeptides, mupirocin, rifampicin and trimethoprim were differentially expressed. Our study demonstrates that global protein expression profiling of biofilm cells to antibiotic pressure may improve our understanding of the mechanisms of antibiotic resistance in biofilms.
1. Introduction
Staphylococcus epidermidis is a coagulase-negative staphylococcus that is linked to prosthetic valve endocarditis, prosthetic joint infections, pacemaker electrode infections, and catheter-associated bloodstream infections [1,2]. It can attach to the surface of medical devices and develop biofilms, which are composed of teichoic acids, lipids, exopolysaccharides, proteins, and extracellular DNA [3]. Polysaccharide intercellular adhesin (PIA) (icaA, icaB, icaC, icaD), extracellular matrix binding protein (ebh, embP), accumulation-associated protein (aap, sesF), and biofilm-associated protein homolog (bhp, sesD) are involved in biofilm formation of S. epidermidis [4].
Bacteria within biofilms can be protected from host immune defenses and antibiotic therapies [5]. Compared to planktonic cells, they have been reported to be over 1000 times more resistant to antimicrobial agents [6]. They have subpopulations with different phenotypic levels of antimicrobial or stress resistance, termed persister cells, and slow, nongrowing or viable but nonculturable cells with different metabolic activities because of non-uniform gradients of pH, oxygen, water and nutrients inside the biofilm matrix [7]. In addition, extracellular polymeric substances of biofilms can prevent the penetration of antibiotics into the biofilm interior, causing bacterial cells in this location to be exposed to sublethal concentrations of the antibiotics [8].
Subinhibitory antibiotics, such as azithromycin, cefamandole, ciprofloxacin, clarithromycin, erythromycin, linezolid, ofloxacin, rifampicin, sparfloxacin, tetracycline, and vancomycin, have been known to stimulate biofilm formation [9]. Studies have found that PIA genes were upregulated following treatment with sublethal tetracycline, erythromycin and quinupristin-dalfopristin [9]; however, they were not correlated with increased biofilm production after sublethal erythromycin, azithromycin, and clarithromycin exposure [10]. In addition, sublethal nafcillin and linezolid reduced the expression of Staphylococcus aureus virulence factors such as alpha-toxin, autolysin, coagulase, Panton-Valentine leukocidin, haemolysin, staphylococcal enterotoxin, and toxic-shock syndrome toxin [11]. This activity can lead to bacterial infection complications when biofilms are exposed to sub-minimum inhibitory concentration (MIC) concentrations of antibiotics.
Tigecycline (TC) belongs to the glycylcycline class and is a 9-glycylamido derivative of minocycline [12]. It has a broad spectrum of antibacterial effect against both Gram-positive and -negative bacteria, including methicillin-resistant staphylococci and tetracycline-resistant Enterobacteriaceae [13]. Because TC binds to the 30S ribosomal subunit with higher affinity than does tetracycline, it blocks tRNA from being delivered to the ribosomal A site, thereby impeding translation elongation [14].
Global proteomic analysis and bioinformatics have been employed to identify and characterize hundreds to thousands of differentially expressed proteins (DEPs) [15]. The Q-Exactive HF-X Orbitrap mass spectrometer is equipped with a high-capacity transmission tube that makes extremely sophisticated sensitivities possible, as well as an ultra-high field Orbitrap analyzer that increases resolving power up to 240,000 and scan speed up to 40 Hz [16]. Because a more comprehensive proteomic analysis can provide more direct insight into molecular responses, we employed a label-free quantitative proteome analysis using the Q-Exactive HF-X Orbitrap mass spectrometer to determine cellular response to environmental stresses [15]. The effect of subinhibitory concentrations of TC on protein expression in S. epidermidis strain RP62A biofilms using a proteomic technique was investigated.
2. Materials and Methods
2.1. Bacterial Strain and Growth Conditions
A single colony of S. epidermidis strain RP62A was inoculated in 1 mL of tryptic soy broth (TSB) supplemented with 0.25% glucose (TSBg) and cultured in a shaking incubator (200 rpm) (New Brunswick Scientific Co., New Brunswick, NJ, USA) at 37 °C overnight. The culture was diluted 1:200 in fresh TSBg and grown for 4 h. Bacterial cells were harvested by centrifugation at 20,817× g for 5 min at 4 °C and washed three times with phosphate-buffered saline (PBS). The bacterial suspension was adjusted to an optical density at 600 nm of 0.1 and grown with TSBg with 1/8 (0.031 µg/mL, T1), 1/4 (0.063 µg/mL, T2), and 1/2 (0.125 µg/mL, T3) MIC of TC (MilliporeSigma, St. Louis, MO, USA) or without TC in six-well plates (Corning Inc., Corning, NY, USA) with shaking at 100 rpm for 24 h at 37 °C. Next, planktonic cells were washed with PBS three times and biofilms were scraped using cell scrapers (Corning Inc.) and transferred to a microcentrifuge tube. The cells were centrifuged, washed with PBS, and stored at −80 °C before protein extraction.
2.2. Determination of Minimum Inhibitory Concentration (MIC) and Viable Bacterial Cell Numbers
To measure the MIC of TC, the antibiotic was serially diluted in Mueller-Hinton broth (MHB, Thermo Fisher Scientific, Waltham, MA, USA) in 96-well plates (Corning Inc.). S. epidermidis strain RP62A culture was adjusted to 0.5 McFarland standards and added to each well of the plate containing TC. The plate was placed in a Synergy 2 Multi-Mode Microplate Reader (BIOTEK Instruments, Winooski, VT, USA) at 37 °C and shaken continuously. Bacterial growth was monitored by reading the absorbance at 600 nm every 30 min for 24 h. The lowest concentration of antibiotic with no visible cell growth was defined as the MIC. All experiments were performed in quadruplicate. To measure the viable bacterial cell numbers as colony forming unit (CFU)/mL, biofilms were removed with a sterile cotton swab after washing biofilms with PBS, and suspended in 1 mL of PBS. They were vortexed for 30 s and sonicated at 40 kHz for 3 min. Ten-fold serial dilutions were performed to enumerate the viable cells on tryptic soy agar (TSA) plates in triplicate.
2.3. Confocal Laser Scanning Microscopy (CLSM)
Biofilm cells containing TSBg (control) or subinhibitory concentrations of TC were grown in a tissue culture treated 24 well plate (ibidi, Gräfelfing, Germany) overnight at 37 °C. They were washed with PBS three times and stained for 30 min in the dark at room temperature with the FilmTracer LIVE/DEAD Biofilm Viability Kit (Molecular Probes, Eugene, OR, USA) containing SYTO 9 and propidium iodide. After staining, the biofilms were gently rinsed with filter-sterilized water. Biofilm images were acquired with a Nikon Ti2 inverted microscope with an A1 HD25 confocal scan head, and images were processed using NIS Elements software (Nikon, Tokyo, Japan). Six locations within a well (one treatment group) were quasi-randomly selected at 20× magnification and then z-stack images (20 µm thickness, 0.5 µm slices) were collected using a Plan Flour 40× oil-corrected objective (NA = 1.3). The detection unit was fitted with GaAsP photomultiplier tubes for FITC and TRITC fluorescent signal acquisition. Parameters for the FITC laser were as follows: power = 5.0, gain = 40, and offset = 20. Parameters for the TRIC laser were as follows: power = 5.0, gain = 50, and offset = 20. Thresholding was used to calculate total areas for FITC and TRITC. The ratio of FITC (live cells) to TRITC (dead cells) was log-transformed and data were analyzed via one-way analysis of variance (ANOVA) with a Holm-Sidak correction for multiple comparison tests (α<0.05).
2.4. Field Emission Scanning Electron Microscopy (FESEM)
Biofilm cells were washed with PBS and dehydrated using 15%, 30%, 50%, 70%, 80%, 90%, 95%, and 100% ethanol. Next, samples were dried with hexamethyldisilazane (HMDS, MilliporeSigma) in 100% HMDS and a 1:2, 1:1, and 2:1 mixture of HMDS and ethanol. Finally, biofilms were sputter-coated with gold (Denton Vacuum, Moorestown, NJ, USA), and images were visualized using a Zeiss-Merlin FESEM (Carl Zeiss Microscopy, Thornwood, NY, USA).
2.5. Protein Extraction
Harvested biofilms were added to Lysing Matrix B tubes (MP Biomedicals, Santa Ana, CA, USA) containing 0.1 mm silica spheres. One hundred microliters of BugBuster Plus Lysonase kit (MilliporeSigma) was pipetted to the tube and the biofilms were disrupted by an FP120 reciprocator (MP Biomedicals) at speed 6 for 45 s. Disrupted cells were boiled and vortexed for 5 min and 1 min, respectively. The final protein extract was recovered by centrifuge at maximum speed at 4 °C.
2.6. Ultra-High Performance Liquid Chromatography-Tandem Mass Spectrometry (UHPLC-MS/MS)
Ultra-high performance liquid chromatography-tandem mass spectrometry (UHPLC-MS/MS) was conducted by Bioproximity, LLC (Manassas, VA, USA). The protein samples were suspended in 5% SDS, 50 mM Tris-HCl (pH 8.0), 5 mM Tris (2-carboxyethyl) phosphine (TCEP), and 20 mM 2-chloroacetamide. Protein digestion was achieved using the single-pot solid-phase-enhanced sample preparation (SP3) method [17]. Liquid chromatography (LC) was performed on an EASY-nLC 1200 (Thermo Fisher Scientific) connected to a Q-Exactive HF-X quadrupole-Orbitrap mass spectrometer (Thermo Fisher Scientific). The column was 25 cm × 50 μm I.D. and packed with 2 micron C18 media (Thermo Easy Spray PepMap, Thermo Fisher Scientific). The 20 min LC gradient ran from 10% B to 30% B over 16 min, to 45% B over 4 min, then to 80% B for the remaining 5 min. The mass spectrometer (MS) was set to acquire by data-dependent acquisition and tandem mass spectra from the top 12 ions in the full scan from m/z 350–1400. Normalized collision energy was set at 27, automatic gain control to 3e6, maximum fill MS to 45 ms, and maximum fill MS/MS to 22 ms. Data processing and library searching were performed as described by Burtnick et al. [18]. MS1-based label-free quantification was employed and peptide peak areas were calculated using OpenMS [19]. Proteins were required to have one or more unique peptides across the analyzed samples with E-value scores of 0.0001 or less. The cutoff between control and TC-treated groups was ≥2.0 (up) and ≤−2.0 (down). Functional annotation of the proteins was carried out by Cluster of Orthologous Groups (COG), and the Kyoto Encyclopedia of Genes and Genomes (KEGG) pathway analysis was employed for systematic analysis of gene function [20,21]. Protein interaction network analysis was performed using STRING database version 11.5 and Cytoscape version 3.9.1 [22,23]. Heatmap was generated using the R package ‘pheatmap’ (https://cran.r-project.org/web/packages/pheatmap/pheatmap.pdf) (accessed on 30 September 2022), and the protein expression pattern analysis was conducted in-house python script.
3. Results
3.1. MIC and Biofilm Morphology after TC Treatment
The MIC of TC in S. epidermidis strain RP62A was 0.25 µg/mL (Figure 1). Biofilms of strain RP62A treated with increasing concentrations of TC were imaged via CLSM (Figure 2). Visual inspection of z-stacks suggested that increasing cell death was associated with increasing TC concentration. Semi-quantitative image analysis of the ratio of live to dead bacteria via thresholding (NIS Elements) found a main effect between groups [F(3,23) = 14.831, p < 0.001]. However, multiple comparison tests found no difference among TC treatment groups (1/2 MIC vs. 1/4 MIC, p = 0.900; 1/2 vs. 1/8 MIC, p = 0.064; 1/4 vs. 1/8, p = 0.056; see Supplemental Figure for details), but all TC treatment groups were different from control (all p’s < 0.01). This suggests that in the CLSM experiment, all concentrations of TC led to similar levels of bacterial death. An independent bacterial colony forming unit (CFU) experiment did find a relation between TC treatment and bacterial count (Figure 3).
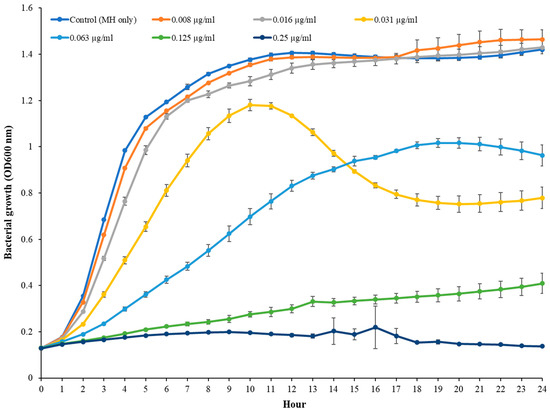
Figure 1.
MIC measurement of TC in S. epidermidis RP62A.
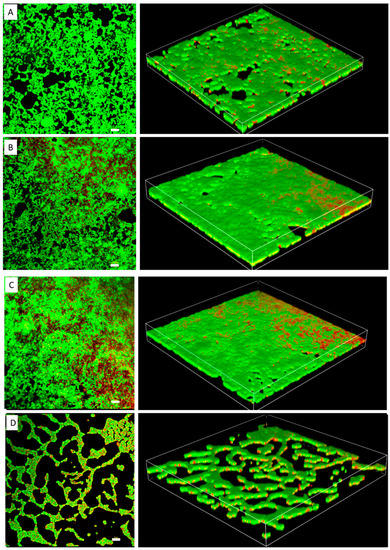
Figure 2.
Confocal laser scanning microscopy images of S. epidermidis strain RP62A biofilms. The scale bar in all the images corresponds to 10 μm. Left panels show an orthogonal view of the top biofilm layer and right panels show 3D images. (A): Control, (B): 1/8 MIC, (C): 1/4 MIC, (D): 1/2 MIC.
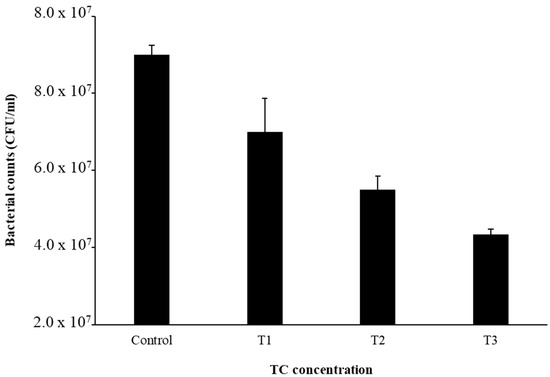
Figure 3.
Bacterial cell counts after TC treatment. Experiments were performed in triplicate to calculate the mean and standard deviation.
FESEM with low magnification clearly showed that 1/8 and 1/4 MIC TC treatment promoted biofilm formation in strain RP62A (Figure 4A). In control biofilms, networks of filamentous structures surrounded the bacterial surface and entangled the bacteria (Figure 4B). Production of extracellular polymeric substances (EPS) was significantly less in the 1/2 MIC-treated biofilm than in the other biofilm samples. In both 1/8 and 1/4 MIC-treated biofilms, a massive, tangled, thread-like matrix covered the surface of the bacteria, making the cells hardly visible.
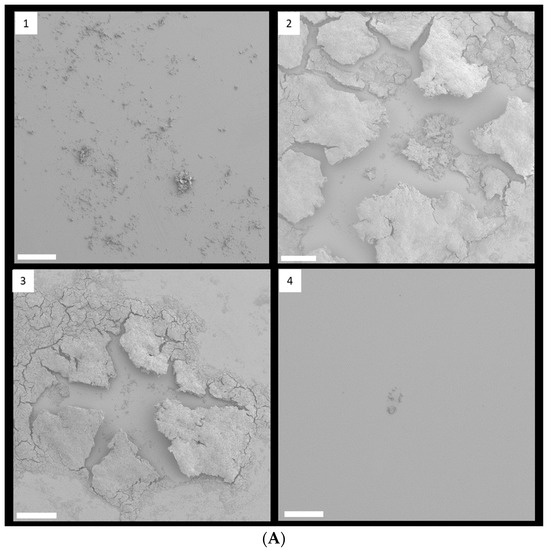
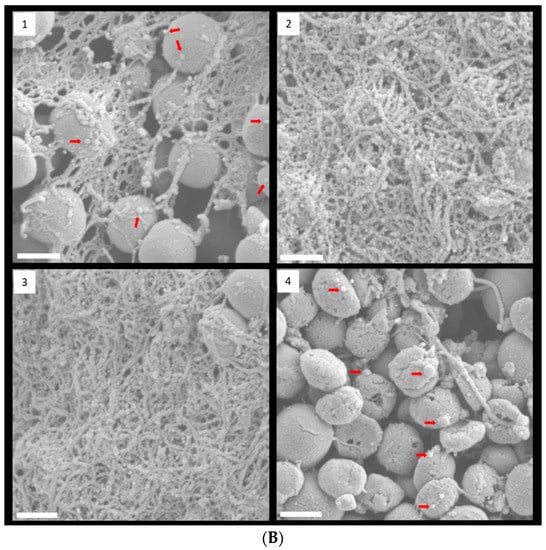
Figure 4.
FESEM images of S. epidermidis strain RP62A biofilms. The scale bar in all the images corresponds to 200 µm (A) and 0.5 µm (B). Arrows indicate membrane vesicles. (1): Control, (2): 1/8 MIC, (3): 1/4 MIC, (4): 1/2 MIC.
Some bacteria have been known to secrete membrane vesicles (MVs) that have round, bilayered, membranous structures from 25 to 250 nm [24]. MVs are composed of proteins, polysaccharides, nucleic acids, and lipids and carry several virulence factors and extracellular enzymes [25]. Particularly, they have been known to be an essential part of EPS and to help build biofilms. We found that S. epidermidis strain RP62A in each sample released MVs, indicated by red arrows in Figure 4B.
3.2. Global Overview of the Proteome Data
Distinct proteomic data sets were induced when strain RP62A biofilms were exposed to increasing levels of TC. From the proteomic data analysis, 484, 480, 530, and 629 proteins were identified from control, T1, T2, and T3 biofilms, respectively (Table S1, Figure 5). A Venn diagram indicated that 303 proteins were commonly observed in all comparison groups, whereas 52, 8, 16, and 107 proteins were uniquely detected in control, T1, T2, and T3 biofilms, respectively (Figure 5). As showed in the heatmap analysis (Figure 6), the proteomic data set revealed an apparent correlation between the profiles of protein expression with respect to TC concentrations. In T1, T2, and T3 biofilms, 413, 429, and 518 proteins were differentially expressed, respectively, containing 165, 243, and 383 upregulated and 248, 186, and 135 downregulated (Figure 7).
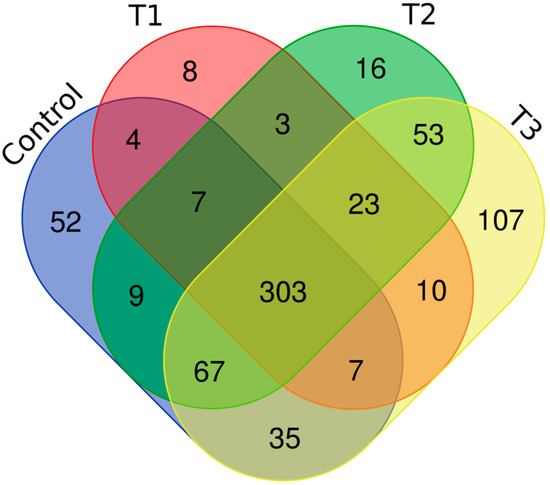
Figure 5.
Venn diagram of the proteomic data in S. epidermidis strain RP62A biofilms. T1: 1/8 MIC, T2: 1/4 MIC, T3: 1/2 MIC.
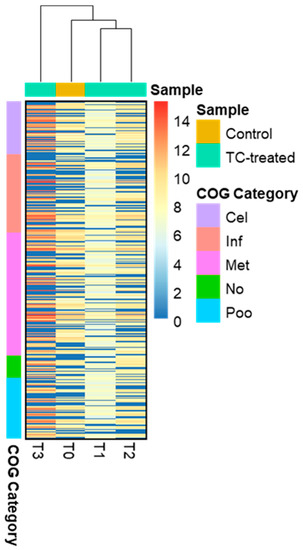
Figure 6.
Heatmap presenting differentially expressed proteins. The proteins in the heatmap analysis were clustered according to five COG functional groups; Cel (Cellular process and signaling), Inf (Information storage and processing), Met (Metabolism), No (No COG annotation), and Poo (Poorly characterized).
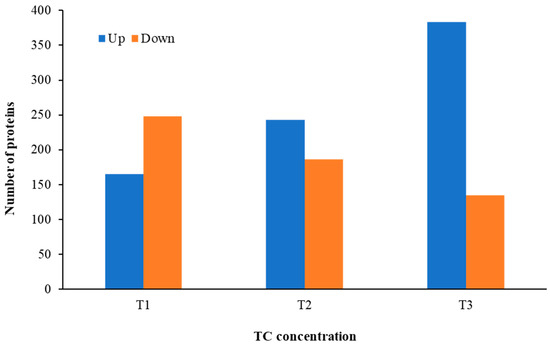
Figure 7.
The number of differentially expressed proteins identified from S. epidermidis strain RP62A biofilms grown with sublethal MIC of TC. T1: 1/8 MIC, T2: 1/4 MIC, T3: 1/2 MIC.
According to COG functional category analysis [26], there are four main categories, including: (i) cellular processes and signaling, (ii) information storage and processing, (iii) metabolism, and (iv) poorly characterized. As the TC concentration increased, the number of upregulated proteins in each category increased, but the number of downregulated proteins decreased (Figure 8). This result indicates that strain RP62A biofilm cells sense and respond to TC in a different way, depending on the antibiotic concentration. Additionally, “information storage and processing” and “metabolism” were the most affected COG categories in upregulated proteins (Figure 8A).
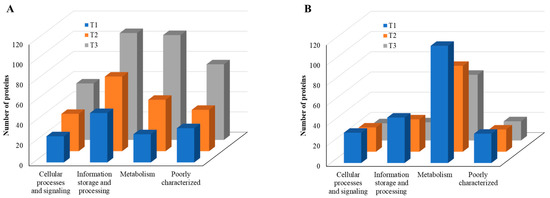
Figure 8.
COG functional classification of four major categories in differentially expressed proteins identified from S. epidermidis strain RP62A biofilms grown with sublethal MIC of TC. (A): upregulated proteins, (B): downregulated proteins, T1: 1/8 MIC, T2: 1/4 MIC, T3: 1/2 MIC.
When compared with the number of upregulated proteins, the distribution of the number of downregulated proteins was significantly different. The number (18 in T3 biofilm) of downregulated proteins in “information storage and processing” was significantly lower compared to the number (106 in T3 biofilm) of upregulated proteins (Figure 8B). The number (116 in T1 biofilm) of downregulated proteins was highest in “metabolism.” Apart from the “function unknown (S)” category of proteins, “translation, ribosomal structure and biogenesis (J)” class of proteins was identified as the most prevalent COG across upregulated proteins (Figure 9A). Again, apart from the “function unknown (S),” the main COGs categories of suppressed proteins functionally enriched were in “translation, ribosomal structure and biogenesis (J)”, “energy production and conversion (C), and “nucleotide transport and metabolism (F)”, as well as in “amino acid transport and metabolism (E)” (Figure 9B). Various functional protein groups in strain RP62A biofilms were differentially activated according to TC concentrations, a finding which could help predict differences in cellular phenotypes. A lot of upregulated and downregulated proteins belonged to “function unknown (S),” indicating there were difficulties in interpreting the proteome data.
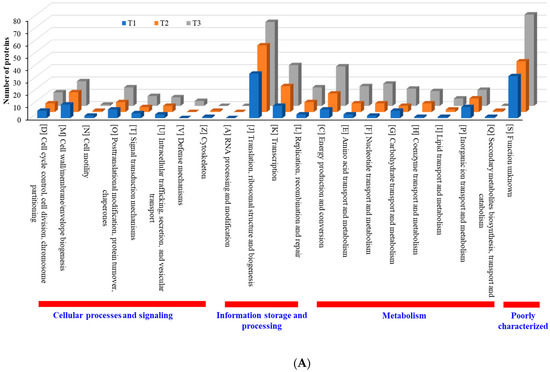
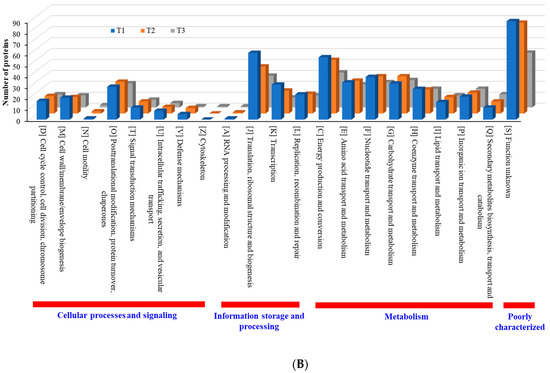
Figure 9.
Detailed COG functional classification in differentially expressed proteins identified from S. epidermidis strain RP62A biofilms grown with sublethal MIC of TC. (A): upregulated proteins, (B): downregulated proteins, T1: 1/8 MIC, T2: 1/4 MIC, T3: 1/2 MIC.
As the TC concentration increased, the number of induced proteins in each KEGG category increased, but the number of repressed proteins decreased, a similar trend to that observed with COG data, indicating elevated dynamic cellular responses of biofilm cells to sub-MIC TC concentrations (Figure 10, Tables S2 and S3). Among five main KEGG categories including “metabolism,” “cellular processes,” “environmental information processing,” “genetic information processing,” and “human diseases,” the “metabolism” pathway accounted for most DEPs in both upregulated and downregulated proteins. Within the metabolism group, in addition to the “global and overview map” category, the “carbohydrate metabolism” and “amino acid metabolism” categories were the most populated in both upregulated and downregulated proteins (Figure 11, Table S2). Within the two categories, a significant numbers of the differentially expressed proteins associated with glycolysis (39 proteins), the tricarboxylic acid (TCA) and pentose phosphate pathways (51 proteins), pyruvate oxidation (51 proteins), purine and pyrimidine metabolism (56 proteins), and amino acid and cofactor biosynthesis (219 proteins) were identified after TC treatment, indicating that these protein groups may play key roles assisting strain RP62A in defending against antibiotic pressure.
Figure 10.
KEGG pathways of five major groups in differentially expressed proteins identified from S. epidermidis strain RP62A biofilms grown with sublethal MIC of TC. (A): upregulated proteins, (B): downregulated proteins, T1: 1/8 MIC, T2: 1/4 MIC, T3: 1/2 MIC.
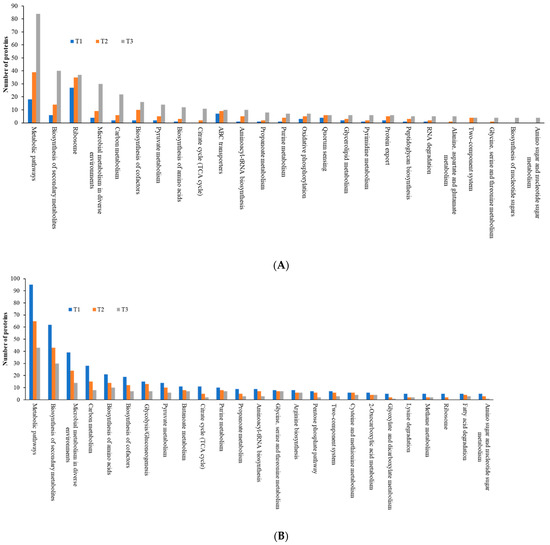
Figure 11.
Top 25 KEGG pathways in differentially expressed proteins identified from S. epidermidis strain RP62A biofilms grown with sublethal MIC of TC. (A): upregulated proteins, (B): downregulated proteins, T1: 1/8 MIC, T2: 1/4 MIC, T3: 1/2 MIC.
Protein expression pattern analysis tool that is integrated with COG functional category analysis, was used to cluster proteins that show a similar temporal expression pattern. In total, 27 significant temporal protein expression profiles were clustered as shown in Figure 12. When strain RP62A biofilms were treated with TC, about 100 proteins involved in information storage and processing (INF; J, K, and L), cellular processes and signaling (CEL; D, M, U, and O), and metabolism (MET; C, G, E, and P) were significantly upregulated (EPN22). Notably, translation, ribosomal structure and biogenesis (J) accounted for the largest portion (30 proteins, 40.5%) of the upregulated proteins. About 48 proteins included in EPN1 were consistently identified in all TC-treated biofilm samples including control and the majority of them consisted of translation, ribosomal structure and biogenesis (J), posttranslational modification, protein turnover, chaperones (O), and carbohydrate transport and metabolism (G). As revealed in EPN2, proteins associated with INF (J and L) and MET (C, G, E, F, H, I, P, and Q) were substantially downregulated in all TC-treated biofilms (T1, T2, and T3). Protein expression patterns that were upregulated (EPN19) or downregulated (EPN9) only at the highest TC concentration were confirmed.
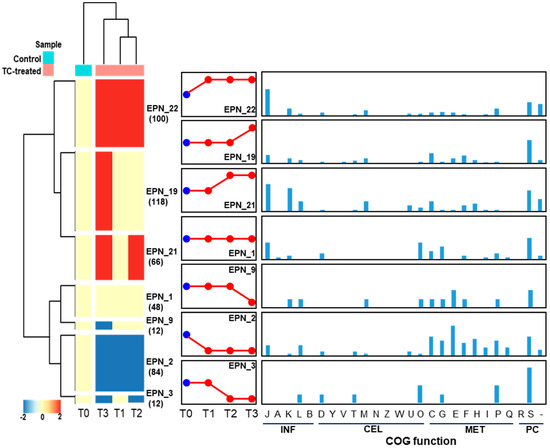
Figure 12.
Protein expression patterns and functional distribution of proteins showing TC-dependent expression changes. INF, information storage and processing; CEL, cellular processes and signaling; MET, metabolism; PC, poorly characterized. COG functional categories: J, translation, ribosomal structure, and biogenesis; A, RNA processing and modification; K, transcription; L, replication, recombination, and repair; B, chromatin structure and dynamics; D, cell cycle control, cell division, chromosome partitioning; Y, nuclear structure; V, defense mechanisms; T, signal transduction mechanisms; M, cell wall/membrane/envelope biogenesis; N, cell motility; Z, cytoskeleton; W, extracellular structures; U, intracellular trafficking, secretion, and vesicular transport; O, posttranslational modification, protein turnover, chaperones; C, energy production and conversion; G, carbohydrate transport and metabolism; E, amino acid transport and metabolism; F, nucleotide transport and metabolism; H, coenzyme transport and metabolism; I, lipid transport and metabolism; P, inorganic ion transport and metabolism; Q, secondary metabolite biosynthesis, transport, and catabolism; R, general function prediction only; S, function unknown.
The “ribosome” (upregulated and downregulated protein numbers, 37 and 0) and “ATP-binding cassette (ABC) transporter” (upregulated and downregulated protein numbers, 10 and 4) pathways showed the largest differences between up- and downregulated proteins in 1/2 MIC-treated biofilms. Repressed “Glycolysis/gluconeogenesis” (upregulated and downregulated protein numbers, 0 and 15) and “butanoate metabolism” (upregulated and downregulated protein numbers, 0 and 11) pathways in 1/8 MIC-treated biofilm samples were the most notable pathways compared to those of overexpressed proteins.
3.3. Impact of TC on Biofilm-Associated Proteins
Sub-MIC TC concentrations changed expression of 12 proteins involved in biofilm formation in S. epidermidis strain RP62A (Table 1). Bhp, Ebh, IcaB, SarA, SrrA, SERP0719, SERP1316, and SERP1483 were substantially overexpressed in 0.125 µg/mL TC-treated biofilms. Interestingly, three cell wall surface anchor family proteins showed the greatest induction in T2 and T3 biofilm samples. At the highest concentration of TC, the protein expression levels of biofilm-associated proteins were not significantly different from that of the biofilms treated at the low concentration.

Table 1.
Differentially expressed proteins associated with biofilms.
3.4. Impact of TC on Antibiotic Resistance-Associated Proteins
Of the 70 antibiotic resistance-associated proteins obtained from the Pathosystems Resource Integration Center (PATRIC) database, in S. epidermidis strain RP62A, 27 were differentially regulated [27] (Table 2). The highest number of antibiotic resistance proteins were altered to a large extent in biofilms grown under the conditions with the highest TC concentrations. Proteins involved in aminoglycosides (AacA-AphD, AphA, RpsL), antimicrobial peptides (DltA, DltC, LytH, SepA), β-lactams (Pbp, MecA), erythromycin (ErmA-1), fluoroquinolones (NorR), fusidic acid (FusA), glycopeptides (Ddl, TcaA), lipopeptides (RpoC, MprF), mupirocin (IleS), rifampicin (RpoB), and trimethoprim (FolA-2) resistance, as well as tetracycline (RpsJ) resistance, were differentially expressed. Several antibiotic resistant genes, including aminoglycosides, streptomycin, ribostamycin, and paromomycin, were overexpressed in A. baumannii grown in the presence of TC [28]. RpoB, RplF, RpsJ, and FusA proteins were increased in biofilms treated with all three concentrations of TC, and their fold-ratios increased as the antibiotic concentration increased. RpoC, TcaA, and NorA were not differentially expressed in T1 biofilms, but were differentially expressed in both T1 and T2 biofilms.
Table 2.
Differentially expressed proteins associated with antibiotic resistance.
3.5. Impact of TC on Virulence- and Quorum Sensing-Associated Proteins
Expression levels of 18 virulence proteins were considerably changed during growth of strain RP62A biofilms with sublethal TC (Table 3). CcpA and NorA were not differentially expressed in T1 biofilms, but their expression was altered in both T1 and T2 biofilms. ClpB, ClpX, NagD, PurL, RecA, and Asd were overexpressed only in 1/2 MIC-treated biofilms; among them, PurL, RecA, and Asd exhibited the highest upregulation (fold ratio 1000). It has been previously reported that antibiotics can affect the expression of toxins (tst, pvl), enzymes (capB, capC, capD, capF, capG, and cap8H), regulatory proteins (agr, sarA, saeP and rot), and other virulence determinants in staphylococci [11,29,30]. We found a single toxin (SERP0738) and eight exoenzymes (ClpB, ClpC, ClpP, ClpX, FumC, Geh-2, Lip, and SepA) were significantly altered after TC exposure.
Table 3.
Differentially expressed proteins associated with virulence.
Quorum sensing systems in bacteria control a variety of cellular processes, which include the regulation of biofilm formation, antimicrobial resistance, and virulence [31]. TC treatment of strain RP62A biofilms resulted in significant changes in 11 proteins related to quorum sensing (Table 4). SERP0738 and GseA were overexpressed only in T1 and T2, while SecD and YidC2 were only overexpressed in T2 and T3. YajC and SERP1994 showed the greatest induction by 1/2 MIC TC. Regardless of TC concentration, levels of FFh and Hfq were greatly induced, while SecA1 production was severely repressed.
Table 4.
Differentially expressed proteins associated with quorum sensing.
3.6. Impact of TC on ABC Transporter- and Protein Export-Associated Proteins
ABC transporters have been closely related to multidrug resistance in both Gram-positive and -negative bacteria [32]. Addition of TC to RP62A biofilms resulted in 13 differentially expressed proteins linked to ABC transporters (Table 5). In TC-treated biofilm samples, 10 proteins related to ABC transporters were upregulated, but only two were downregulated. Highly abundant proteins in all TC-treated biofilms included substrate binding proteins (SERP0099, SERP0491, SERP1777, ModA, SERP2005, SERP2286, SERP2383), but permease proteins (SERP0386, ModB) were drastically downregulated in all TC-treated biofilms.
Table 5.
Differentially expressed proteins associated with ABC transporter pathway.
Subinhibitory TC treatment against strain RP62A led to altered expression of seven proteins linked to protein export (Table 6). While SpsB (signal peptidase IB) and Ffh (signal recognition particle protein) were overexpressed in all TC-treated biofilms, SecA1 (preprotein translocase) was downregulated in all TC-treated biofilms. In addition, expression levels of SERP0024 (signal peptidase I), SecD (protein-export membrane protein), and YidC2 (putative membrane protein) were predominantly increased only in biofilms challenged with 1/4 and 1/8 MIC TC.
Table 6.
Differentially expressed proteins associated with protein export pathway.
3.7. Impact of TC on Purines and Pyrimidines-Associated Proteins
The number of overexpressed proteins related to both purine and pyrimidine metabolism in strain RP62A biofilms increased with TC concentration, showing the highest number of upregulated proteins at the highest TC concentration (Table 7 and Table 8). Among the most highly upregulated proteins (fold ratio 1000), significantly more were involved in pyrimidine metabolism (CarA, CarB, PyrR, Tdk, Udk) than were involved in purine metabolism (Gmk, PurL) in T3 biofilms.
Table 7.
Differentially expressed proteins associated with purine metabolism.
Table 8.
Differentially expressed proteins associated with pyrimidine metabolism.
3.8. Impact of TC on Ribosome-Associated Proteins
The majority of proteins associated with “ribosome” were upregulated in all sub-MIC treated biofilms, and RpsO, RplT, and RpsM showed the greatest upregulation (fold ratio 1000) in all T1, T2, and T3 (Table 9). Sixteen proteins belonging to the Rps family of 30S ribosomal proteins, 18 proteins belonging to the Rpl family of 50S ribosomal proteins, and three proteins belonging to the Rpm family of 50S ribosomal proteins were expressed at various levels. Translation initiation factors infA and infC, which are essential for instigating translation, were significantly overexpressed. The level of expression of elongation factors G (FusA) also was highly increased. Interestingly, RpsR, a ribosomal protein S18, was not detected in T1 and T2 biofilms but only upregulated at a fold ratio of 1000 in the highest MIC-treated biofilms. Four proteins, RplY, RpsD, RpsE, and RplP, were distinctly downregulated in the lowest MIC-treated biofilms.
Table 9.
Differentially expressed proteins associated with ribosome pathway.
3.9. Impact of TC on Essential Gene-Associated Proteins
Among 212 essential proteins of S. epidermidis strain RP62A, 94 (44.3%) proteins were differentially expressed following TC treatment of its biofilms (Table 10). Overexpressed proteins in T1, T2, and T3 biofilms were 31, 48, and 64, respectively, suggesting that the higher the strength of external stress, the more essential proteins are needed. Most of the differentially expressed essential proteins belong to “Information storage and processing (J)”, followed by “nucleotide transport and metabolism (F)”, “coenzyme transport and metabolism (H)”, and transcription (K)” (Table 10).
Table 10.
Differentially expressed proteins associated with essential proteins.
4. Discussion
In this study, we investigated the concentration-dependent proteome response of S. epidermidis strain RP62A biofilms to TC. Our results show that the number of differentially altered proteins increased with increasing TC concentration. However, Wu et al. examined the proteomic response of Pseudomonas aeruginosa planktonic cells to sublethal levels of tobramycin and reported that a higher number of proteins were significantly expressed at the lowest concentration of the antibiotic [33]. The discrepancy between the two studies suggests that planktonic and biofilm cells differ in their responses to antibiotic treatment. A significant number of proteins were induced at the lowest TC concentration (0.031 µg/mL), signifying that strain PR62A biofilms are able to respond to low concentrations of TC, which explains how TC at low concentrations may induce adaptive responses. Of the F proteins, 23 were identified with the highest level of expression (fold ratio 1000) in all T1, T2, and T3 biofilms. In contrast, 52 proteins were detected with the lowest fold ratios (fold ratio −1000) in all sublethal TC-treated biofilms, with proteins belonging to the metabolism pathway accounting for 90.8%. These results indicate that metabolism is critical for the resistance of strain RP62A biofilms to TC treatment.
Eleven proteins involved in the “TCA cycle” pathway were upregulated in 1/2 MIC-treated biofilms. This contradicts previous findings in Acinetobacter baumannii planktonic cells, which reported that the “TCA cycle” pathway was repressed under TC treatment [28]. Among the genetic information processing group, the “translation” category was the most predominant KEGG group in both upregulated and downregulated proteins (Tables S2 and S3). Several researchers reported that the expression of translation-related proteins was significantly altered under the pressure of antibiotics that inhibit protein synthesis, demonstrating that translational regulation is directly associated with response to antibiotic stress [34,35,36].
Previous work indicated TC exposure to preformed biofilms of Staphylococcus aureus increased the level of expression of a fibronectin-binding protein, a collagen adhesin, a clumping factor, and a transcriptional regulator [11]. However, our proteome analysis revealed that only the transcriptional regulator (SarA) was induced in 0.031 and 0.125 µg/mL TC-treated biofilms. IcaADBC proteins of the intercellular adhesin locus synthesize β-1-6-linked N-acetyl-glucosamine (PNAG) [37]. icaB encodes a deacetylase required for the surface maintenance of PNAG and solid biofilm production in S. epidermidis [38]. In all TC-treated biofilm samples, IcaB showed the highest upregulation, indicating that TC is directly associated with IcaB expression in strain RP62A biofilms. However, IcaA, IcaC and IcaD proteins constituting the Ica operon were not identified in any of TC-treated biofilm samples. Moreover, RsbU, which was proposed as a regulator of icaADBC transcription, was also not detected [39]. These results agree with Smith et al., who found that TC pressure in S. aureus caused biofilm-associated genes to express at various levels [11]. Other studies also supported the idea that treatment with antimicrobial agents, including colistin, induced differential expression in intercellular adhesin genes [40,41,42,43].
Histidine metabolism is known to be an essential pathway in biofilm production [44]. It has been reported that genes/proteins contributing to biofilm formation in Staphylococcus species, Mycobacterium species, and A. baumannii were related to histidine metabolism [45,46,47]. Our proteome data showed that levels of putative aldehyde dehydrogenase (AldA, SERP1729) and NADH:flavin oxidoreductase/fumarate reductase (SERP2381) expressed in strain RP62A biofilms were altered under sublethal TC pressure.
Interestingly, several antibiotic resistance proteins, ErmA-1, FolA-2, Aac-aphD, Rho, MecA, IleS, and MprF exhibited the highest upregulation only in T3 biofilm. Construction of a functional protein–protein network using Cytoscape network analysis in DEPs revealed a single distinct cluster (Figure 13). In addition, it showed that transcriptional and translational proteins closely linked to the center may play a role in the functioning of various antibiotic resistance proteins. We found that β-lactam resistance proteins, such as MecA, Pbp1, Pbp2, and Pbp3, were highly induced following TC treatment. This result is inconsistent with previous findings that A. baumannii grown with subinhibitory TC remarkably suppressed β-lactam resistance genes [48,49]. It has been reported that TC treatment of A. baumannii and P. aeruginosa induced efflux pumps (macB, mexXY, emrAB) and tetracycline resistance genes (tetA(B), tetR), but these genes were not identified in our proteome data [34,49,50].
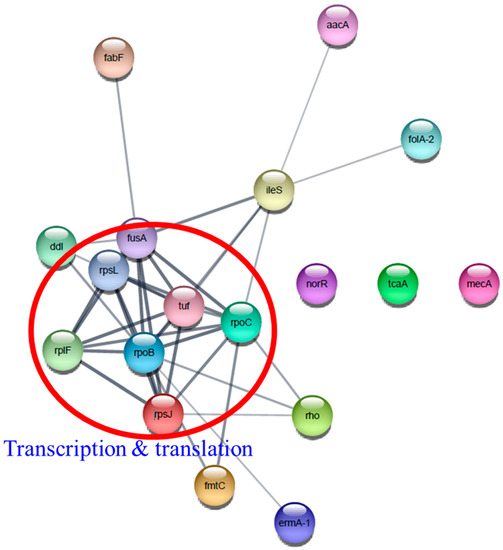
Figure 13.
Protein–protein interaction network analysis of differentially expressed proteins associated with antibiotic resistance using STRING database and Cytoscape. Transcription and translation proteins were indicated by a red circle.
Sheldon and Heinrichs reported that the expression of ABC transporter lipoprotein SitC plays a role in iron uptake and survival of staphylococci in vivo [51]. SitC was repressed at a fold ratio of −2.55 by 0.125 µg/mL TC treatment. In the present study, TC treatment of strain RP62A biofilms differentially modulated known virulence factors important for host interaction. This may complicate bacterial infections in cases of inadequate treatment, where bacterial biofilms may be exposed to subinhibitory concentrations of antimicrobial agents.
TC treatment of strain RP62A biofilms exhibited differential expression in proteins involved in quorum sensing. In P. aeruginosa, subinhibitory tobramycin exposure not only promoted biofilm formation, but also increased expression of quorum sensing genes [52]. In contrast, silver nanoparticles and antimicrobial peptides inhibited both biofilm production and the expression of proteins related to quorum sensing systems [53,54]. Moreover, Zhao et al. found that sublethal erythromycin reduced biofilm formation by Streptococcus suis but resulted in differential expression levels of quorum sensing proteins [55].
Contrary to our proteome data, Hua et al. reported that both substrate binding and permease proteins associated with the uptake of amino acids, alkane sulphonate, and sulphate were downregulated in the presence of TC [49]. Differentially expressed ABC transporters resulting from antibiotic treatment showed that these proteins may play an important role in extrinsic stress responses. Since the functions of most ABC transporters in S. epidermidis strain RP62A are still unknown, whether their involvement in the antibiotic resistance mechanism should be further verified.
Purines and pyrimidines are essential for the synthesis of RNA and DNA necessary for bacterial cell growth [56]. A close link between purine/pyrimidine metabolism and antimicrobial stress has been reported [57,58,59]. Genes/proteins involved in purine production in S. aureus and Enterobacter cloacae were highly upregulated under vancomycin, rifampicin, and ZnO nanoparticle stresses [59,60,61]. Ning et al. reported that phenyllactic acid and lactic acid treatment in Bacillus cereus affect DNA and RNA biosynthesis by altering the expression levels of proteins involved in purine and pyrimidine metabolism [62]. The dynamic response of purine/pyrimidine metabolism-related proteins to increasing TC concentrations suggests that these proteins may modulate strain RP62A’s defense against the antibiotic pressure.
Most ribosomal proteins were upregulated in strain RP62A biofilms treated with subinhibitory TCs. It was previously reported that ribosomal proteins were differentially expressed following TC treatment on S. aureus biofilms [11]. In many bacteria, such as A. baumannii, E. coli, Haemophilus influenzae, and Streptococcus pneumoniae, overexpression of ribosomal proteins after antibiotic stress, which inhibits protein synthesis, was also reported [35,49,63,64]. These results suggest RP62A biofilms may reduce the effect of TC by increasing the proteins involved in ribosomal biosynthesis.
The “Information storage and processing (J)” protein set in essential genes is comprised of 41 ribosomal proteins and 13 aminoacyl-tRNA biosynthesis proteins. Differential expression of aminoacyl-tRNA biosynthesis genes was also reported in A. baumannii and S. pneumoniae following treatment with chloramphenicol, tetracycline, or TC [35,48]. Notably, RpsO (30S ribosomal protein S15), RplT (50S ribosomal protein L20), and RpsM (30S ribosomal protein S13) were overexpressed at the highest level in all TC-treated biofilms, demonstrating that these proteins have vital functions in biofilm survival during TC treatment. Cytoscape network analysis visually demonstrated the intimate interaction of ribosomal proteins and aminoacyl-tRNA biosynthesis proteins (Figure 14). The observed changes in protein levels support that many of these essential genes are not only essential for the growth of RP62A biofilms, but also have integral functions for survival against TC stress.
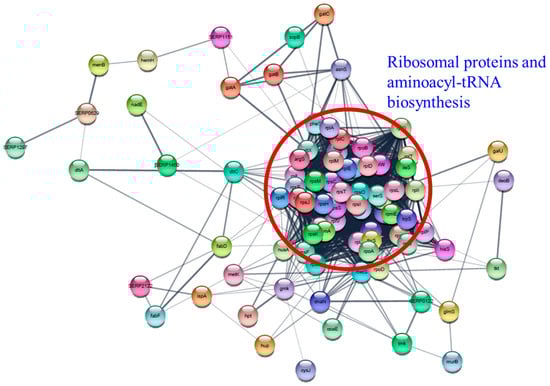
Figure 14.
Protein–protein interaction network analysis of differentially expressed proteins associated with essential genes using STRING database and Cytoscape. Ribosomal proteins and aminoacyl-tRNA biosynthesis proteins were indicated by a red circle.
5. Conclusions
This study demonstrated that as TC concentration increased, the number of living cells in S. epidermidis strain RP62A biofilms decreased, but the biofilm densities varied. In addition, we found the global proteome response in strain RP62A biofilms to be dependent on TC concentration, with differential expression of diverse functional groups of proteins—including biofilm formation, antimicrobial resistance, virulence, quorum sensing, ABC transporters, and protein export—identified during treatment with different sub-MIC levels of TC. Biofilm cells exposed to subinhibitory concentrations of TC also exhibited active upregulation of proteins involved in metabolic pathways. Further studies of the molecular mechanisms by which functional proteins operate in biofilm protection in response to sublethal antibiotic stress need to be conducted.
Supplementary Materials
The following supporting information can be downloaded at: https://www.mdpi.com/article/10.3390/cells11213488/s1, Table S1: Identified proteins from tigecycline-treated S. epidermidis strain RP62A biofilms; Table S2: KEGG pathways of up-regulated proteins; Table S3: KEGG pathways of down-regulated proteins; Figure S1: The ratio of FITC (live cells) to TRITC (dead cells) in biofilms.
Author Contributions
Conceptualization, K.S.; Data curation, K.S.; Formal analysis, K.S. and O.K.; Funding acquisition, K.S.; Investigation, K.S., M.P., J.C., A.S. and A.P.; Methodology, K.S., M.P. and S.A.K.; Project administration, K.S.; Resources, K.S.; Supervision, K.S.; Validation, K.S. and O.K.; Visualization, K.S.; Writing—original draft, K.S.; Writing—review & editing, K.S., M.P., J.C., O.K., S.A.K., A.S. and A.P. All authors have read and agreed to the published version of the manuscript.
Funding
This research was funded by [United States Food and Drug Administration] grant number [E0770601] And The APC was funded by [United States Food and Drug Administration].
Acknowledgments
We thank John Sutherland, Kuppan Gokulan, and Huizhong Chen for reviewing the manuscript and Joanne Berger, FDA Library, for editing a draft of the manuscript.
Conflicts of Interest
This manuscript reflects the views of the authors and does not necessarily reflect those of the U.S. Food and Drug Administration. Any mention of commercial products is for clarification only and is not intended as approval, endorsement, or recommendation.
References
- Heilmann, C.; Ziebuhr, W.; Becker, K. Are coagulase-negative staphylococci virulent? Clin. Microbiol. Infect. 2019, 25, 1071–1080. [Google Scholar] [CrossRef] [PubMed]
- Chon, J.W.; Lee, U.J.; Bensen, R.; West, S.; Paredes, A.; Lim, J.; Khan, S.; Hart, M.E.; Phillips, K.S.; Sung, K. Virulence Characteristics of mecA-Positive Multidrug-Resistant Clinical Coagulase-Negative Staphylococci. Microorganisms 2020, 8, 659. [Google Scholar] [CrossRef] [PubMed]
- Limoli, D.H.; Jones, C.J.; Wozniak, D.J. Bacterial Extracellular Polysaccharides in Biofilm Formation and Function. Microbiol. Spectr. 2015, 3, 29. [Google Scholar] [CrossRef] [PubMed]
- Fey, P.D.; Olson, M.E. Current concepts in biofilm formation of Staphylococcus epidermidis. Future Microbiol. 2010, 5, 917–933. [Google Scholar] [CrossRef]
- Sung, K.; Chon, J.; Kweon, O.; Nho, S.; Kim, S.; Park, M.; Paredes, A.; Lim, J.H.; Khan, S.A.; Phillips, K.S.; et al. Dynamic Adaptive Response of Pseudomonas aeruginosa to Clindamycin/Rifampicin-Impregnated Catheters. Antibiotics 2021, 10, 752. [Google Scholar] [CrossRef]
- Becker, K.; Heilmann, C.; Peters, G. Coagulase-negative staphylococci. Clin. Microbiol. Rev. 2014, 27, 870–926. [Google Scholar] [CrossRef]
- Hall-Stoodley, L.; Costerton, J.W.; Stoodley, P. Bacterial biofilms: From the natural environment to infectious diseases. Nat. Rev. Microbiol. 2004, 2, 95–108. [Google Scholar] [CrossRef]
- Lebeaux, D.; Ghigo, J.M.; Beloin, C. Biofilm-related infections: Bridging the gap between clinical management and fundamental aspects of recalcitrance toward antibiotics. Microbiol. Mol. Biol. Rev. 2014, 78, 510–543. [Google Scholar] [CrossRef]
- Kaplan, J.B.; Jabbouri, S.; Sadovskaya, I. Extracellular DNA-dependent biofilm formation by Staphylococcus epidermidis RP62A in response to subminimal inhibitory concentrations of antibiotics. Res. Microbiol. 2011, 162, 535–541. [Google Scholar] [CrossRef]
- Wang, Q.; Sun, F.J.; Liu, Y.; Xiong, L.R.; Xie, L.L.; Xia, P.Y. Enhancement of biofilm formation by subinhibitory concentrations of macrolides in icaADBC-positive and -negative clinical isolates of Staphylococcus epidermidis. Antimicrob. Agents Chemother. 2010, 54, 2707–2711. [Google Scholar] [CrossRef]
- Smith, K.; Gould, K.A.; Ramage, G.; Gemmell, C.G.; Hinds, J.; Lang, S. Influence of tigecycline on expression of virulence factors in biofilm-associated cells of methicillin-resistant Staphylococcus aureus. Antimicrob. Agents Chemother. 2010, 54, 380–387. [Google Scholar] [CrossRef] [PubMed]
- Slover, C.M.; Rodvold, K.A.; Danziger, L.H. Tigecycline: A novel broad-spectrum antimicrobial. Ann. Pharmacother. 2007, 41, 965–972. [Google Scholar] [CrossRef] [PubMed]
- Jenner, L.; Starosta, A.L.; Terry, D.S.; Mikolajka, A.; Filonava, L.; Yusupov, M.; Blanchard, S.C.; Wilson, D.N.; Yusupova, G. Structural basis for potent inhibitory activity of the antibiotic tigecycline during protein synthesis. Proc. Natl. Acad. Sci. USA 2013, 110, 3812–3816. [Google Scholar] [CrossRef] [PubMed]
- Olson, M.W.; Ruzin, A.; Feyfant, E.; Rush, T.S., 3rd; O’Connell, J.; Bradford, P.A. Functional, biophysical, and structural bases for antibacterial activity of tigecycline. Antimicrob. Agents Chemother. 2006, 50, 2156–2166. [Google Scholar] [CrossRef] [PubMed]
- Mendez, J.A.; Mateos, J.; Beceiro, A.; Lopez, M.; Tomas, M.; Poza, M.; Bou, G. Quantitative proteomic analysis of host-pathogen interactions: A study of Acinetobacter baumannii responses to host airways. BMC Genom. 2015, 16, 422. [Google Scholar] [CrossRef]
- Kelstrup, C.D.; Bekker-Jensen, D.B.; Arrey, T.N.; Hogrebe, A.; Harder, A.; Olsen, J.V. Performance Evaluation of the Q Exactive HF-X for Shotgun Proteomics. J. Proteome Res. 2018, 17, 727–738. [Google Scholar] [CrossRef]
- Moggridge, S.; Sorensen, P.H.; Morin, G.B.; Hughes, C.S. Extending the Compatibility of the SP3 Paramagnetic Bead Processing Approach for Proteomics. J. Proteome Res. 2018, 17, 1730–1740. [Google Scholar] [CrossRef]
- Burtnick, M.N.; Brett, P.J.; DeShazer, D. Proteomic analysis of the Burkholderia pseudomallei type II secretome reveals hydrolytic enzymes, novel proteins, and the deubiquitinase TssM. Infect. Immun. 2014, 82, 3214–3226. [Google Scholar] [CrossRef]
- Sturm, M.; Bertsch, A.; Gropl, C.; Hildebrandt, A.; Hussong, R.; Lange, E.; Pfeifer, N.; Schulz-Trieglaff, O.; Zerck, A.; Reinert, K.; et al. OpenMS—An open-source software framework for mass spectrometry. BMC Bioinform. 2008, 9, 163. [Google Scholar] [CrossRef]
- Tatusov, R.L.; Fedorova, N.D.; Jackson, J.D.; Jacobs, A.R.; Kiryutin, B.; Koonin, E.V.; Krylov, D.M.; Mazumder, R.; Mekhedov, S.L.; Nikolskaya, A.N.; et al. The COG database: An updated version includes eukaryotes. BMC Bioinform. 2003, 4, 41. [Google Scholar] [CrossRef]
- Kanehisa, M.; Goto, S. KEGG: Kyoto encyclopedia of genes and genomes. Nucleic Acids Res. 2000, 28, 27–30. [Google Scholar] [CrossRef] [PubMed]
- Lopes, C.T.; Franz, M.; Kazi, F.; Donaldson, S.L.; Morris, Q.; Bader, G.D. Cytoscape Web: An interactive web-based network browser. Bioinformatics 2010, 26, 2347–2348. [Google Scholar] [CrossRef] [PubMed]
- Szklarczyk, D.; Franceschini, A.; Wyder, S.; Forslund, K.; Heller, D.; Huerta-Cepas, J.; Simonovic, M.; Roth, A.; Santos, A.; Tsafou, K.P.; et al. STRING v10: Protein-protein interaction networks, integrated over the tree of life. Nucleic Acids Res. 2015, 43, D447–D452. [Google Scholar] [CrossRef] [PubMed]
- Anderson, H.C.; Mulhall, D.; Garimella, R. Role of extracellular membrane vesicles in the pathogenesis of various diseases, including cancer, renal diseases, atherosclerosis, and arthritis. Lab. Investig. 2010, 90, 1549–1557. [Google Scholar] [CrossRef]
- Takahashi, C.; Sato, M.; Sato, C. Biofilm formation of Staphylococcus epidermidis imaged using atmospheric scanning electron microscopy. Anal. Bioanal. Chem. 2021, 413, 7549–7558. [Google Scholar] [CrossRef]
- Tatusov, R.L.; Galperin, M.Y.; Natale, D.A.; Koonin, E.V. The COG database: A tool for genome-scale analysis of protein functions and evolution. Nucleic Acids Res. 2000, 28, 33–36. [Google Scholar] [CrossRef]
- Antonopoulos, D.A.; Assaf, R.; Aziz, R.K.; Brettin, T.; Bun, C.; Conrad, N.; Davis, J.J.; Dietrich, E.M.; Disz, T.; Gerdes, S.; et al. PATRIC as a unique resource for studying antimicrobial resistance. Brief. Bioinform. 2019, 20, 1094–1102. [Google Scholar] [CrossRef]
- Liu, L.; Cui, Y.; Zheng, B.; Jiang, S.; Yu, W.; Shen, P.; Ji, J.; Li, L.; Qin, N.; Xiao, Y. Analysis of tigecycline resistance development in clinical Acinetobacter baumannii isolates through a combined genomic and transcriptomic approach. Sci. Rep. 2016, 6, 26930. [Google Scholar] [CrossRef]
- Joo, H.S.; Chan, J.L.; Cheung, G.Y.; Otto, M. Subinhibitory concentrations of protein synthesis-inhibiting antibiotics promote increased expression of the agr virulence regulator and production of phenol-soluble modulin cytolysins in community-associated methicillin-resistant Staphylococcus aureus. Antimicrob. Agents Chemother. 2010, 54, 4942–4944. [Google Scholar] [CrossRef]
- Otto, M.P.; Martin, E.; Badiou, C.; Lebrun, S.; Bes, M.; Vandenesch, F.; Etienne, J.; Lina, G.; Dumitrescu, O. Effects of subinhibitory concentrations of antibiotics on virulence factor expression by community-acquired methicillin-resistant Staphylococcus aureus. J. Antimicrob. Chemother. 2013, 68, 1524–1532. [Google Scholar] [CrossRef]
- Zhao, X.; Yu, Z.; Ding, T. Quorum-Sensing Regulation of Antimicrobial Resistance in Bacteria. Microorganisms 2020, 8, 425. [Google Scholar] [CrossRef] [PubMed]
- Ngernsombat, C.; Sreesai, S.; Harnvoravongchai, P.; Chankhamhaengdecha, S.; Janvilisri, T. CD2068 potentially mediates multidrug efflux in Clostridium difficile. Sci. Rep. 2017, 7, 9982. [Google Scholar] [CrossRef] [PubMed]
- Wu, X.; Held, K.; Zheng, C.; Staudinger, B.J.; Chavez, J.D.; Weisbrod, C.R.; Eng, J.K.; Singh, P.K.; Manoil, C.; Bruce, J.E. Dynamic Proteome Response of Pseudomonas aeruginosa to Tobramycin Antibiotic Treatment. Mol. Cell. Proteom. 2015, 14, 2126–2137. [Google Scholar] [CrossRef] [PubMed]
- Cheng, J.; Kesavan, D.K.; Vasudevan, A.; Cai, W.; Wang, H.; Su, Z.; Wang, S.; Xu, H. Genome and Transcriptome Analysis of A. baumannii’s “Transient” Increase in Drug Resistance under Tigecycline Pressure. J. Glob. Antimicrob. Resist. 2020, 22, 219–225. [Google Scholar] [CrossRef]
- Ng, W.L.; Kazmierczak, K.M.; Robertson, G.T.; Gilmour, R.; Winkler, M.E. Transcriptional regulation and signature patterns revealed by microarray analyses of Streptococcus pneumoniae R6 challenged with sublethal concentrations of translation inhibitors. J. Bacteriol. 2003, 185, 359–370. [Google Scholar] [CrossRef]
- Yao, Z.; Sun, L.; Wang, Y.; Lin, L.; Guo, Z.; Li, D.; Lin, W.; Lin, X. Quantitative Proteomics Reveals Antibiotics Resistance Function of Outer Membrane Proteins in Aeromonas hydrophila. Front. Cell. Infect. Microbiol. 2018, 8, 390. [Google Scholar] [CrossRef]
- McKenney, D.; Hubner, J.; Muller, E.; Wang, Y.; Goldmann, D.A.; Pier, G.B. The ica locus of Staphylococcus epidermidis encodes production of the capsular polysaccharide/adhesin. Infect. Immun. 1998, 66, 4711–4720. [Google Scholar] [CrossRef]
- Vuong, C.; Kocianova, S.; Voyich, J.M.; Yao, Y.; Fischer, E.R.; DeLeo, F.R.; Otto, M. A crucial role for exopolysaccharide modification in bacterial biofilm formation, immune evasion, and virulence. J. Biol. Chem. 2004, 279, 54881–54886. [Google Scholar] [CrossRef]
- Knobloch, J.K.; Bartscht, K.; Sabottke, A.; Rohde, H.; Feucht, H.H.; Mack, D. Biofilm formation by Staphylococcus epidermidis depends on functional RsbU, an activator of the sigB operon: Differential activation mechanisms due to ethanol and salt stress. J. Bacteriol. 2001, 183, 2624–2633. [Google Scholar] [CrossRef]
- Vaishampayan, A.; de Jong, A.; Wight, D.J.; Kok, J.; Grohmann, E. A Novel Antimicrobial Coating Represses Biofilm and Virulence-Related Genes in Methicillin-Resistant Staphylococcus aureus. Front. Microbiol. 2018, 9, 221. [Google Scholar] [CrossRef]
- Yang, Y.; Chen, Y.; Zhang, G.; Sun, J.; Guo, L.; Jiang, M.; Ou, B.; Zhang, W.; Si, H. Transcriptomic Analysis of Staphylococcus aureus Under the Stress Condition Caused by Litsea cubeba L. Essential Oil via RNA Sequencing. Front. Microbiol. 2020, 11, 1693. [Google Scholar] [CrossRef] [PubMed]
- Boinett, C.J.; Cain, A.K.; Hawkey, J.; Do Hoang, N.T.; Khanh, N.N.T.; Thanh, D.P.; Dordel, J.; Campbell, J.I.; Lan, N.P.H.; Mayho, M.; et al. Clinical and laboratory-induced colistin-resistance mechanisms in Acinetobacter baumannii. Microb. Genom. 2019, 5, e000246. [Google Scholar] [CrossRef] [PubMed]
- Tan, J.; Wang, J.; Yang, C.; Zhu, C.; Guo, G.; Tang, J.; Shen, H. Antimicrobial characteristics of Berberine against prosthetic joint infection-related Staphylococcus aureus of different multi-locus sequence types. BMC Complement. Altern. Med. 2019, 19, 218. [Google Scholar] [CrossRef] [PubMed]
- Rebora, K.; Laloo, B.; Daignan-Fornier, B. Revisiting purine-histidine cross-pathway regulation in Saccharomyces cerevisiae: A central role for a small molecule. Genetics 2005, 170, 61–70. [Google Scholar] [CrossRef]
- Cabral, M.P.; Soares, N.C.; Aranda, J.; Parreira, J.R.; Rumbo, C.; Poza, M.; Valle, J.; Calamia, V.; Lasa, I.; Bou, G. Proteomic and functional analyses reveal a unique lifestyle for Acinetobacter baumannii biofilms and a key role for histidine metabolism. J. Proteome Res. 2011, 10, 3399–3417. [Google Scholar] [CrossRef]
- Xu, C.G.; Yang, Y.B.; Zhou, Y.H.; Hao, M.Q.; Ren, Y.Z.; Wang, X.T.; Chen, J.Q.; Muhammad, I.; Wang, S.; Liu, D.; et al. Comparative Proteomic Analysis Provides insight into the Key Proteins as Possible Targets Involved in Aspirin Inhibiting Biofilm Formation of Staphylococcus xylosus. Front. Pharmacol. 2017, 8, 543. [Google Scholar] [CrossRef]
- Rojony, R.; Martin, M.; Campeau, A.; Wozniak, J.M.; Gonzalez, D.J.; Jaiswal, P.; Danelishvili, L.; Bermudez, L.E. Quantitative analysis of Mycobacterium avium subsp. hominissuis proteome in response to antibiotics and during exposure to different environmental conditions. Clin. Proteom. 2019, 16, 39. [Google Scholar] [CrossRef]
- Li, L.; Hassan, K.A.; Tetu, S.G.; Naidu, V.; Pokhrel, A.; Cain, A.K.; Paulsen, I.T. The Transcriptomic Signature of Tigecycline in Acinetobacter baumannii. Front. Microbiol. 2020, 11, 565438. [Google Scholar] [CrossRef]
- Hua, X.; Chen, Q.; Li, X.; Yu, Y. Global transcriptional response of Acinetobacter baumannii to a subinhibitory concentration of tigecycline. Int. J. Antimicrob. Agents 2014, 44, 337–344. [Google Scholar] [CrossRef]
- Dean, C.R.; Visalli, M.A.; Projan, S.J.; Sum, P.E.; Bradford, P.A. Efflux-mediated resistance to tigecycline (GAR-936) in Pseudomonas aeruginosa PAO1. Antimicrob. Agents Chemother. 2003, 47, 972–978. [Google Scholar] [CrossRef]
- Sheldon, J.R.; Heinrichs, D.E. The iron-regulated staphylococcal lipoproteins. Front. Cell. Infect. Microbiol. 2012, 2, 41. [Google Scholar] [CrossRef] [PubMed]
- Tahrioui, A.; Duchesne, R.; Bouffartigues, E.; Rodrigues, S.; Maillot, O.; Tortuel, D.; Hardouin, J.; Taupin, L.; Groleau, M.C.; Dufour, A.; et al. Extracellular DNA release, quorum sensing, and PrrF1/F2 small RNAs are key players in Pseudomonas aeruginosa tobramycin-enhanced biofilm formation. NPJ Biofilms Microbiomes 2019, 5, 15. [Google Scholar] [CrossRef] [PubMed]
- Zhang, Y.; Pan, X.; Liao, S.; Jiang, C.; Wang, L.; Tang, Y.; Wu, G.; Dai, G.; Chen, L. Quantitative Proteomics Reveals the Mechanism of Silver Nanoparticles against Multidrug-Resistant Pseudomonas aeruginosa Biofilms. J. Proteome Res. 2020, 19, 3109–3122. [Google Scholar] [CrossRef] [PubMed]
- Liu, W.; Wu, Z.; Mao, C.; Guo, G.; Zeng, Z.; Fei, Y.; Wan, S.; Peng, J.; Wu, J. Antimicrobial Peptide Cec4 Eradicates the Bacteria of Clinical Carbapenem-Resistant Acinetobacter baumannii Biofilm. Front. Microbiol. 2020, 11, 1532. [Google Scholar] [CrossRef]
- Zhao, Y.L.; Zhou, Y.H.; Chen, J.Q.; Huang, Q.Y.; Han, Q.; Liu, B.; Cheng, G.D.; Li, Y.H. Quantitative proteomic analysis of sub-MIC erythromycin inhibiting biofilm formation of S. suis in vitro. J. Proteom. 2015, 116, 1–14. [Google Scholar] [CrossRef]
- Snell, E.E.; Mitchell, H.K. Purine and Pyrimidine as Growth Substances for Lactic Acid Bacteria. Proc. Natl. Acad. Sci. USA 1941, 27, 1–7. [Google Scholar] [CrossRef]
- Garavaglia, M.; Rossi, E.; Landini, P. The pyrimidine nucleotide biosynthetic pathway modulates production of biofilm determinants in Escherichia coli. PLoS ONE 2012, 7, e31252. [Google Scholar] [CrossRef]
- Fox, B.A.; Bzik, D.J. De novo pyrimidine biosynthesis is required for virulence of Toxoplasma gondii. Nature 2002, 415, 926–929. [Google Scholar] [CrossRef]
- Mongodin, E.; Finan, J.; Climo, M.W.; Rosato, A.; Gill, S.; Archer, G.L. Microarray transcription analysis of clinical Staphylococcus aureus isolates resistant to vancomycin. J. Bacteriol. 2003, 185, 4638–4643. [Google Scholar] [CrossRef]
- Ma, T.F.; Chen, Y.P.; Yan, P.; Fang, F.; Shen, Y.; Mao, Z.; Guo, J.S.; Zhao, B.; Feng, L. Adaptation mechanism of aerobic denitrifier Enterobacter cloacae strain HNR to short-term ZnO nanoparticle stresses. Environ. Res. 2021, 197, 111178. [Google Scholar] [CrossRef]
- Yee, R.; Cui, P.; Shi, W.; Feng, J.; Zhang, Y. Genetic Screen Reveals the Role of Purine Metabolism in Staphylococcus aureus Persistence to Rifampicin. Antibiotics 2015, 4, 627–642. [Google Scholar] [CrossRef] [PubMed]
- Ning, Y.; Fu, Y.; Hou, L.; Ma, M.; Wang, Z.; Li, X.; Jia, Y. iTRAQ-based quantitative proteomic analysis of synergistic antibacterial mechanism of phenyllactic acid and lactic acid against Bacillus cereus. Food Res. Int. 2021, 139, 109562. [Google Scholar] [CrossRef] [PubMed]
- VanBogelen, R.A.; Neidhardt, F.C. Ribosomes as sensors of heat and cold shock in Escherichia coli. Proc. Natl. Acad. Sci. USA 1990, 87, 5589–5593. [Google Scholar] [CrossRef] [PubMed]
- Evers, S.; Di Padova, K.; Meyer, M.; Langen, H.; Fountoulakis, M.; Keck, W.; Gray, C.P. Mechanism-related changes in the gene transcription and protein synthesis patterns of Haemophilus influenzae after treatment with transcriptional and translational inhibitors. Proteomics 2001, 1, 522–544. [Google Scholar] [CrossRef]


Publisher’s Note: MDPI stays neutral with regard to jurisdictional claims in published maps and institutional affiliations. |
© 2022 by the authors. Licensee MDPI, Basel, Switzerland. This article is an open access article distributed under the terms and conditions of the Creative Commons Attribution (CC BY) license (https://creativecommons.org/licenses/by/4.0/).