
Improved Delivery Performance of n-Butylidenephthalide-Polyethylene Glycol-Gold Nanoparticles Efficient for Enhanced Anti-Cancer Activity in Brain Tumor

 ,
,  and
and 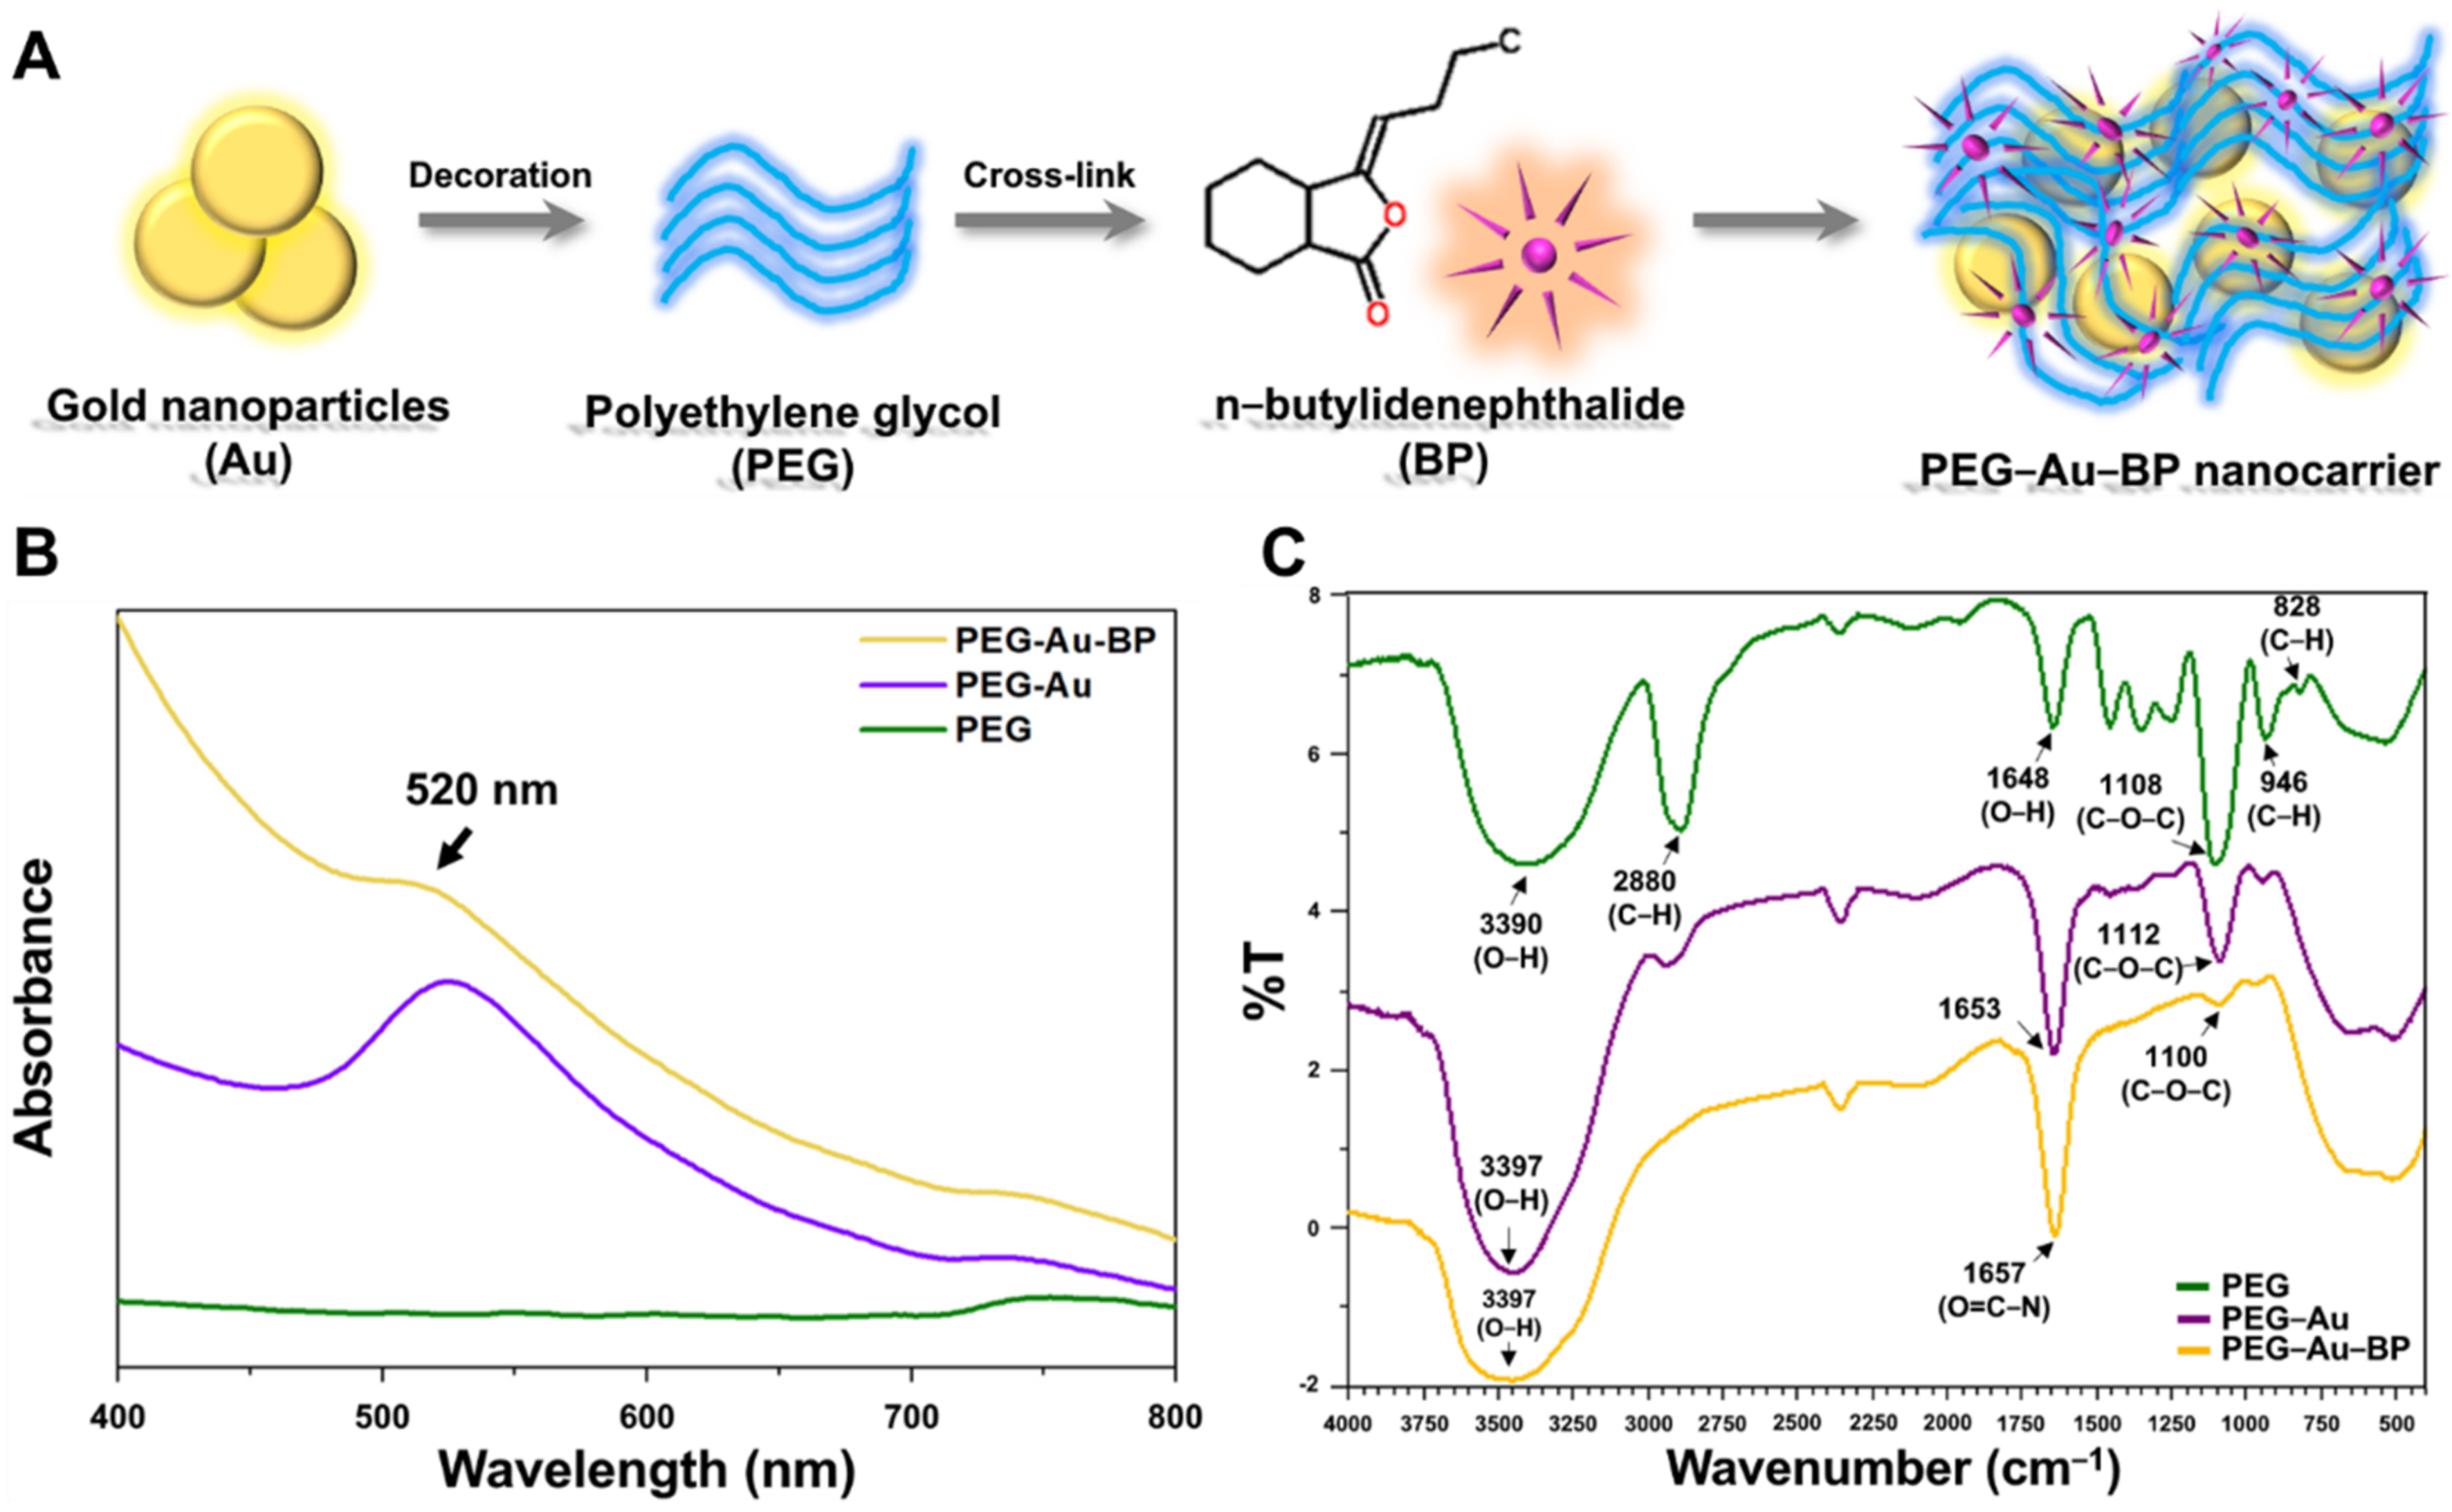
Abstract
1. Introduction
2. Materials and Methods
2.1. Preparation of Polyethylene-Glycol-Gold Nanoparticles with n-Butylidenephthalide (PEG-Au-BP)
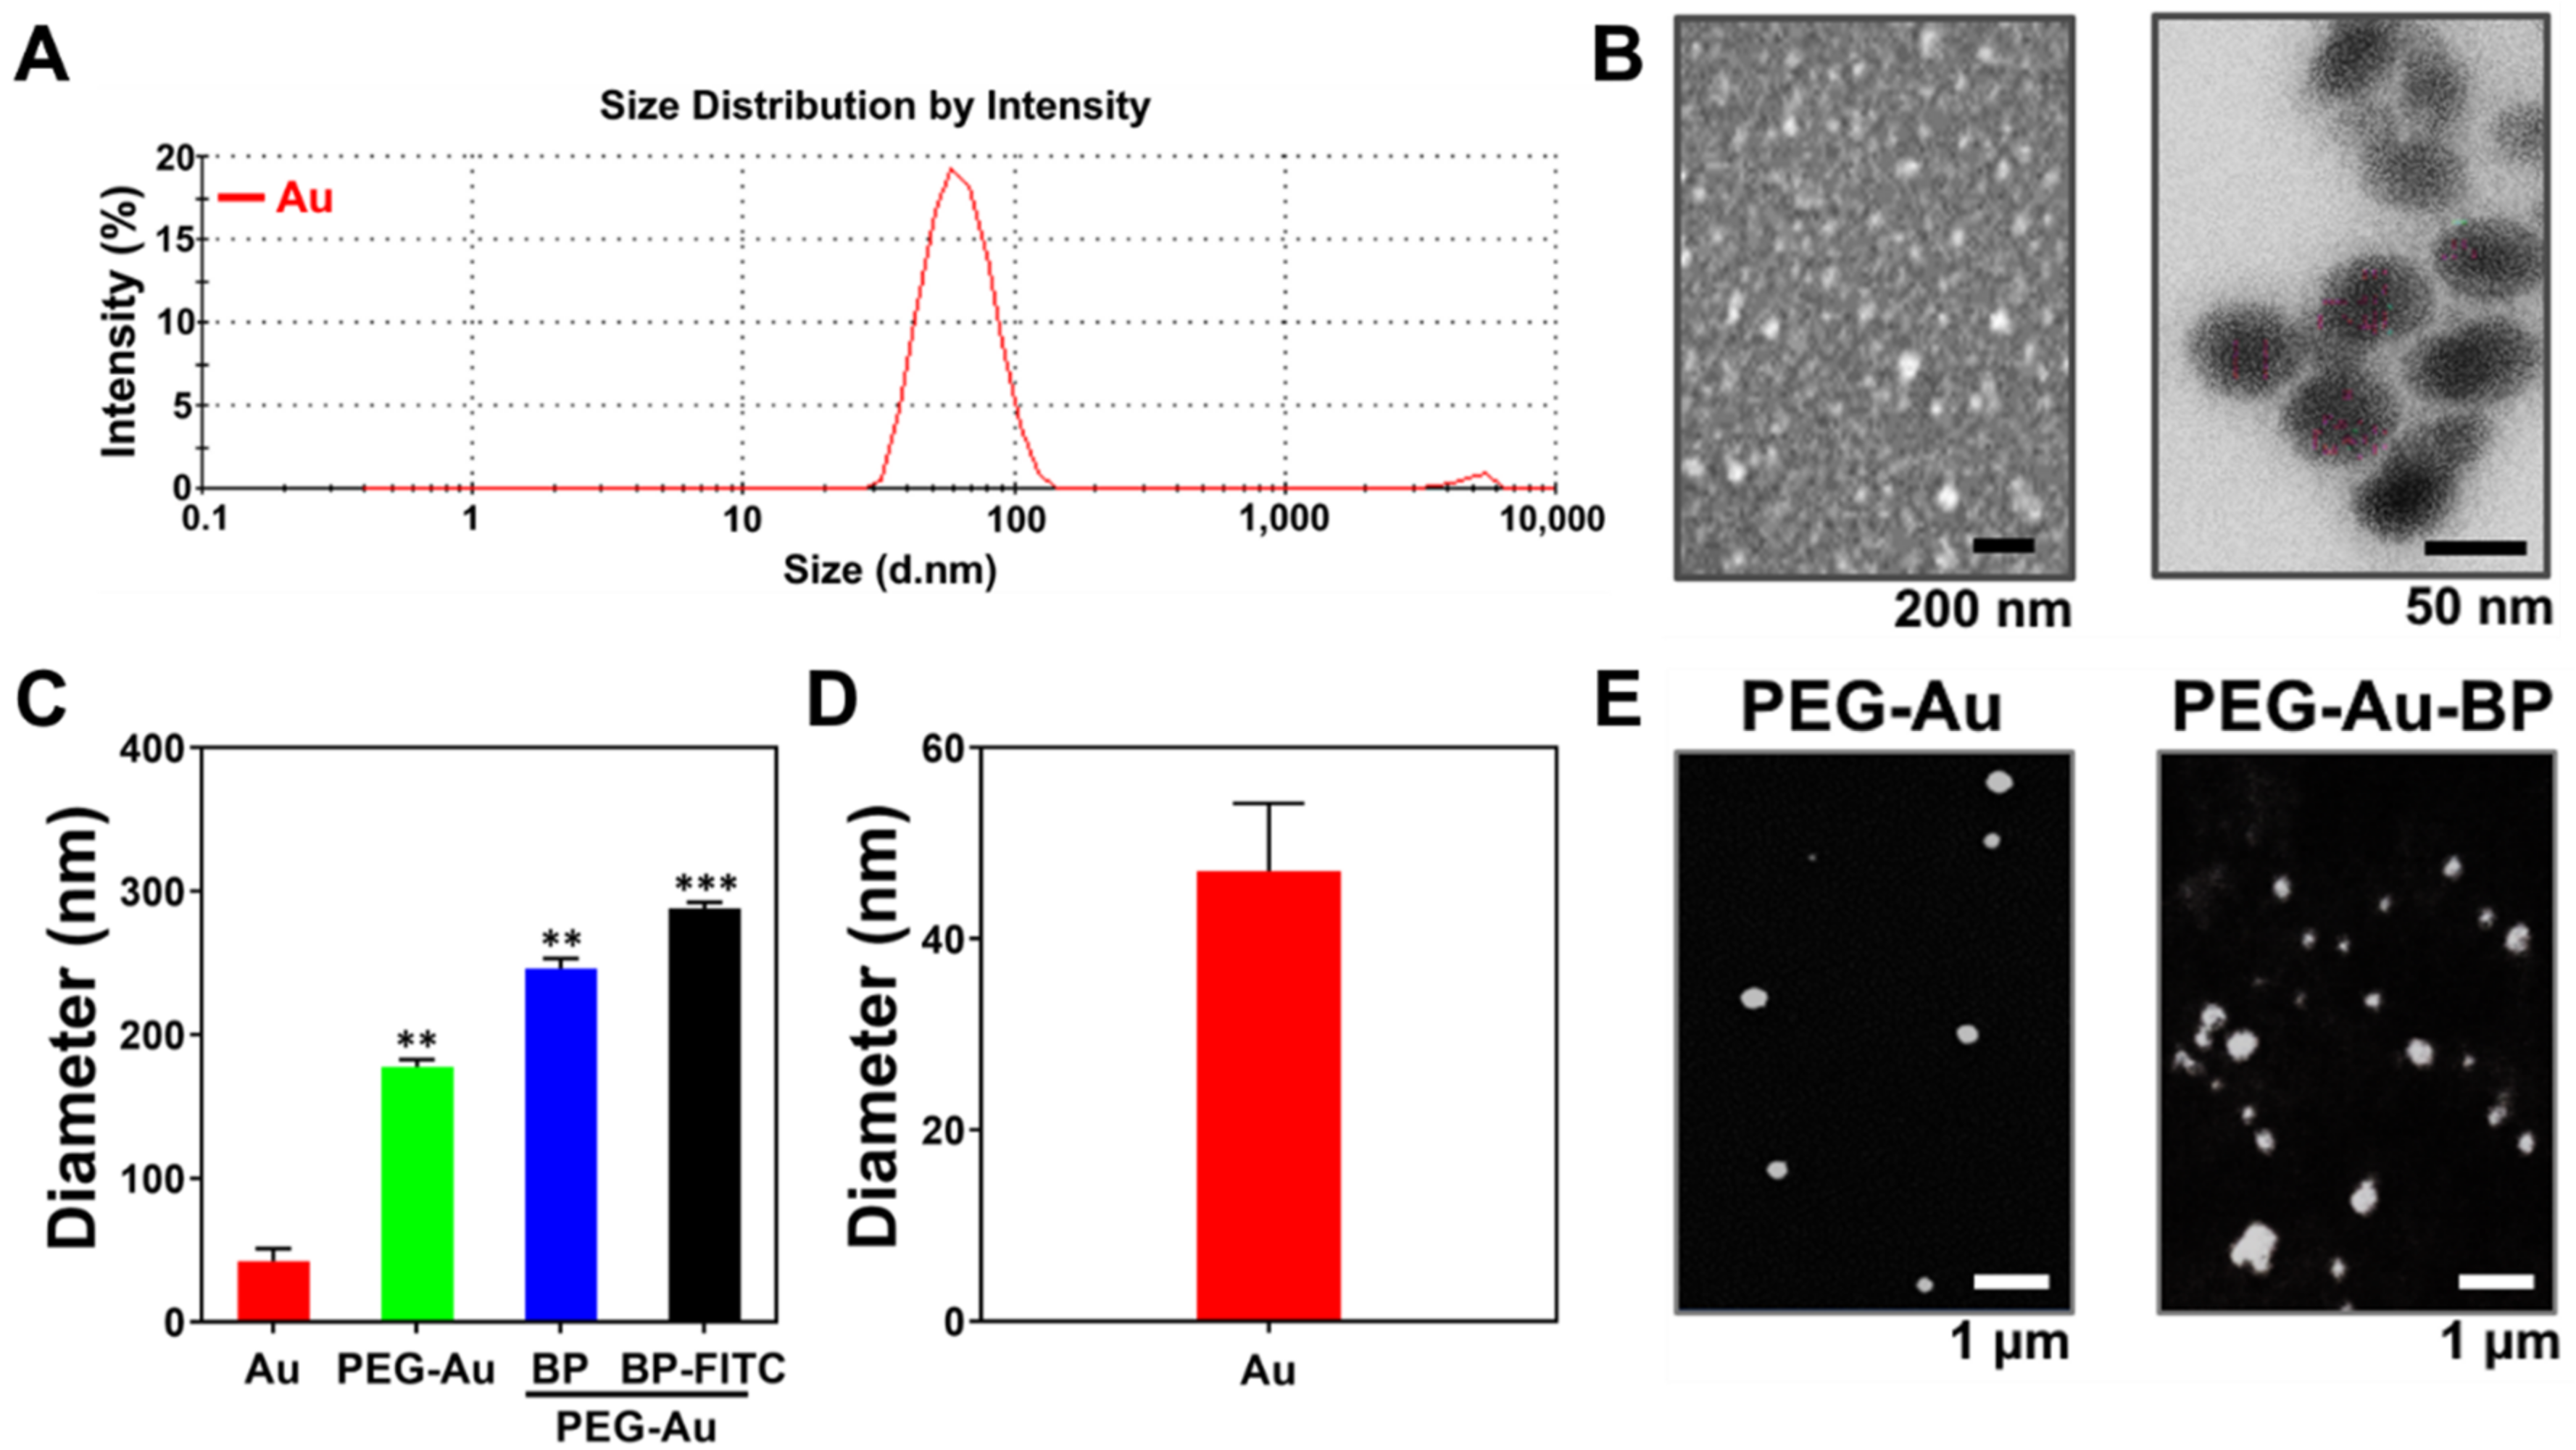
2.2. Material Characterizations
2.3. Cell Culture of BAEC and DBTRG Cells
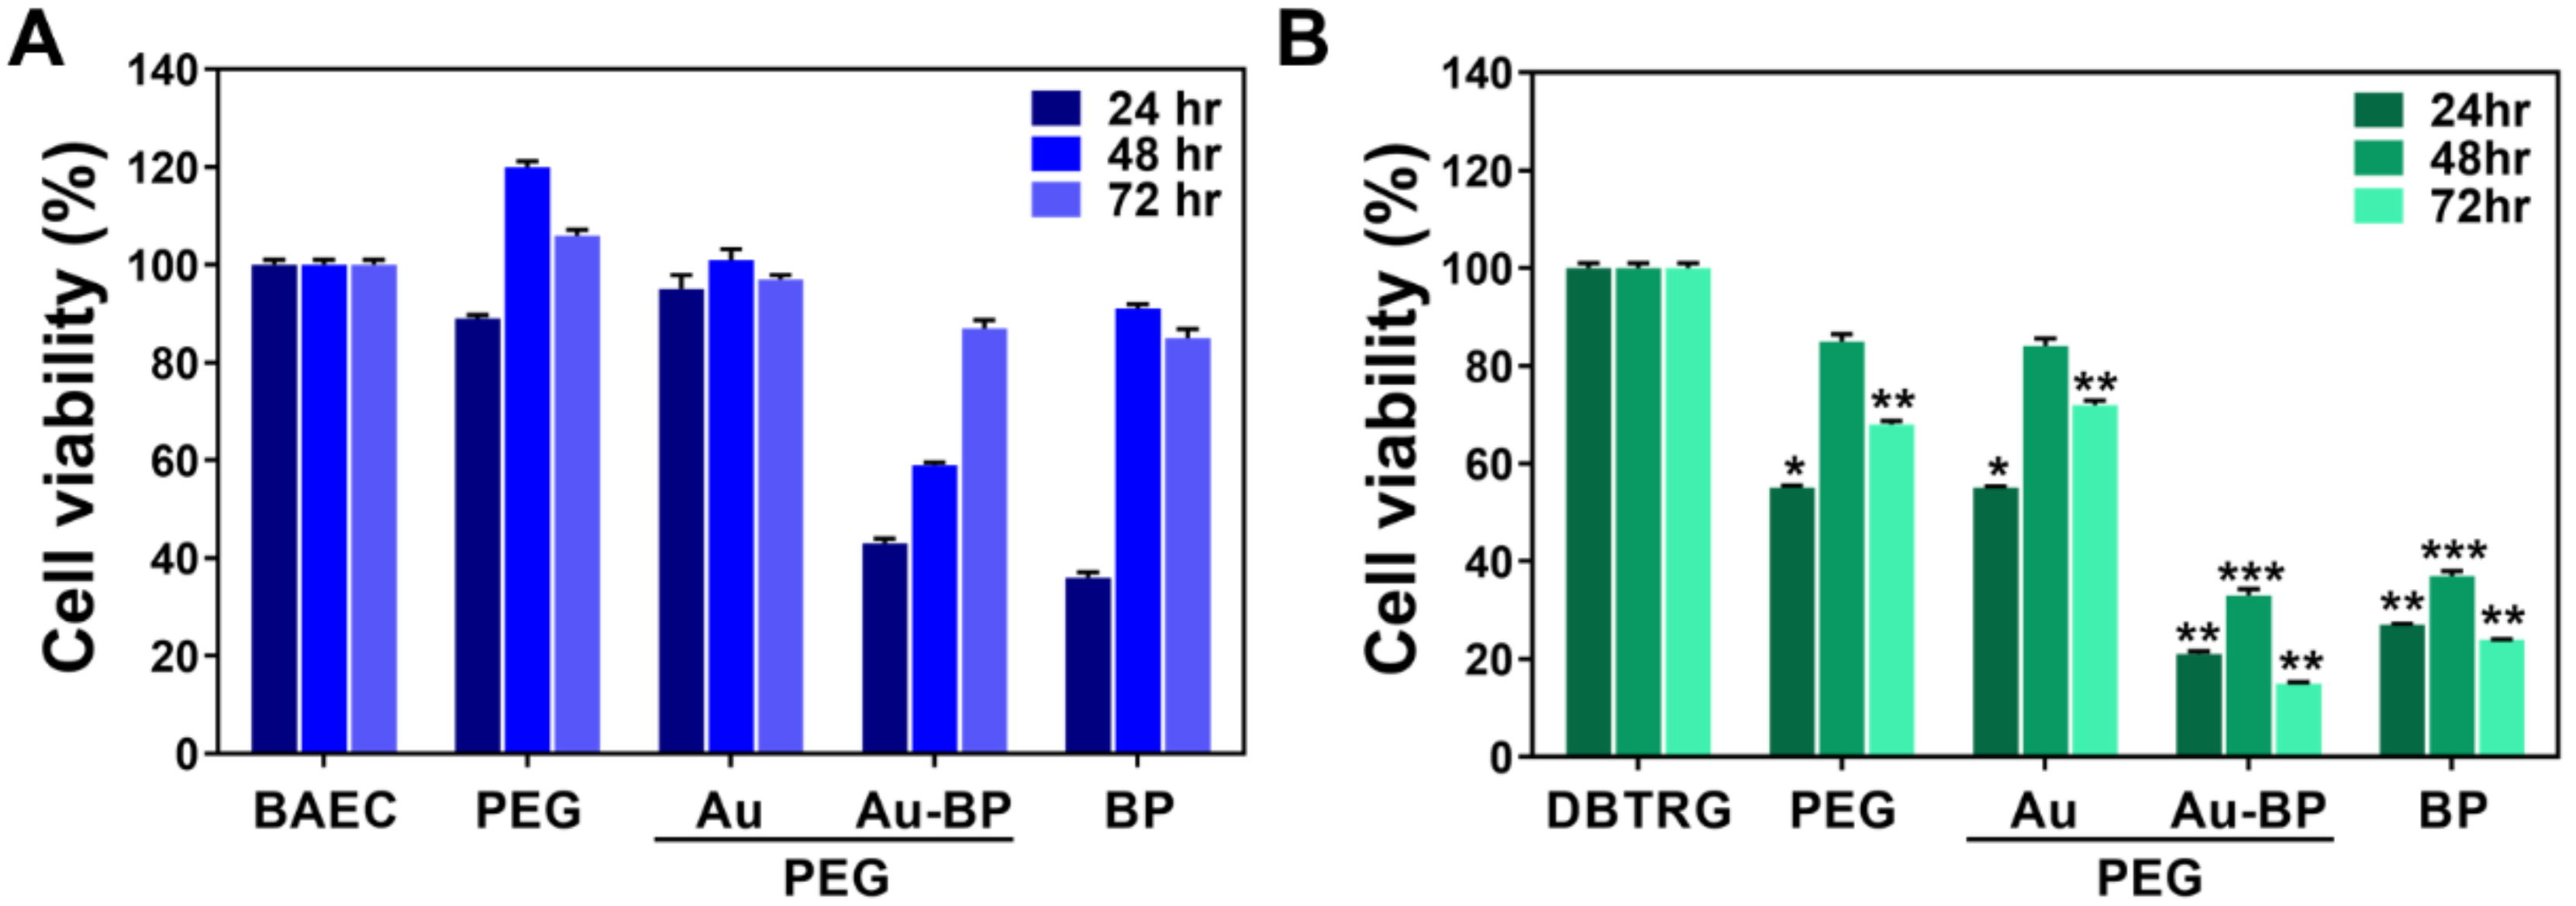
2.4. Cytotoxicity Assay
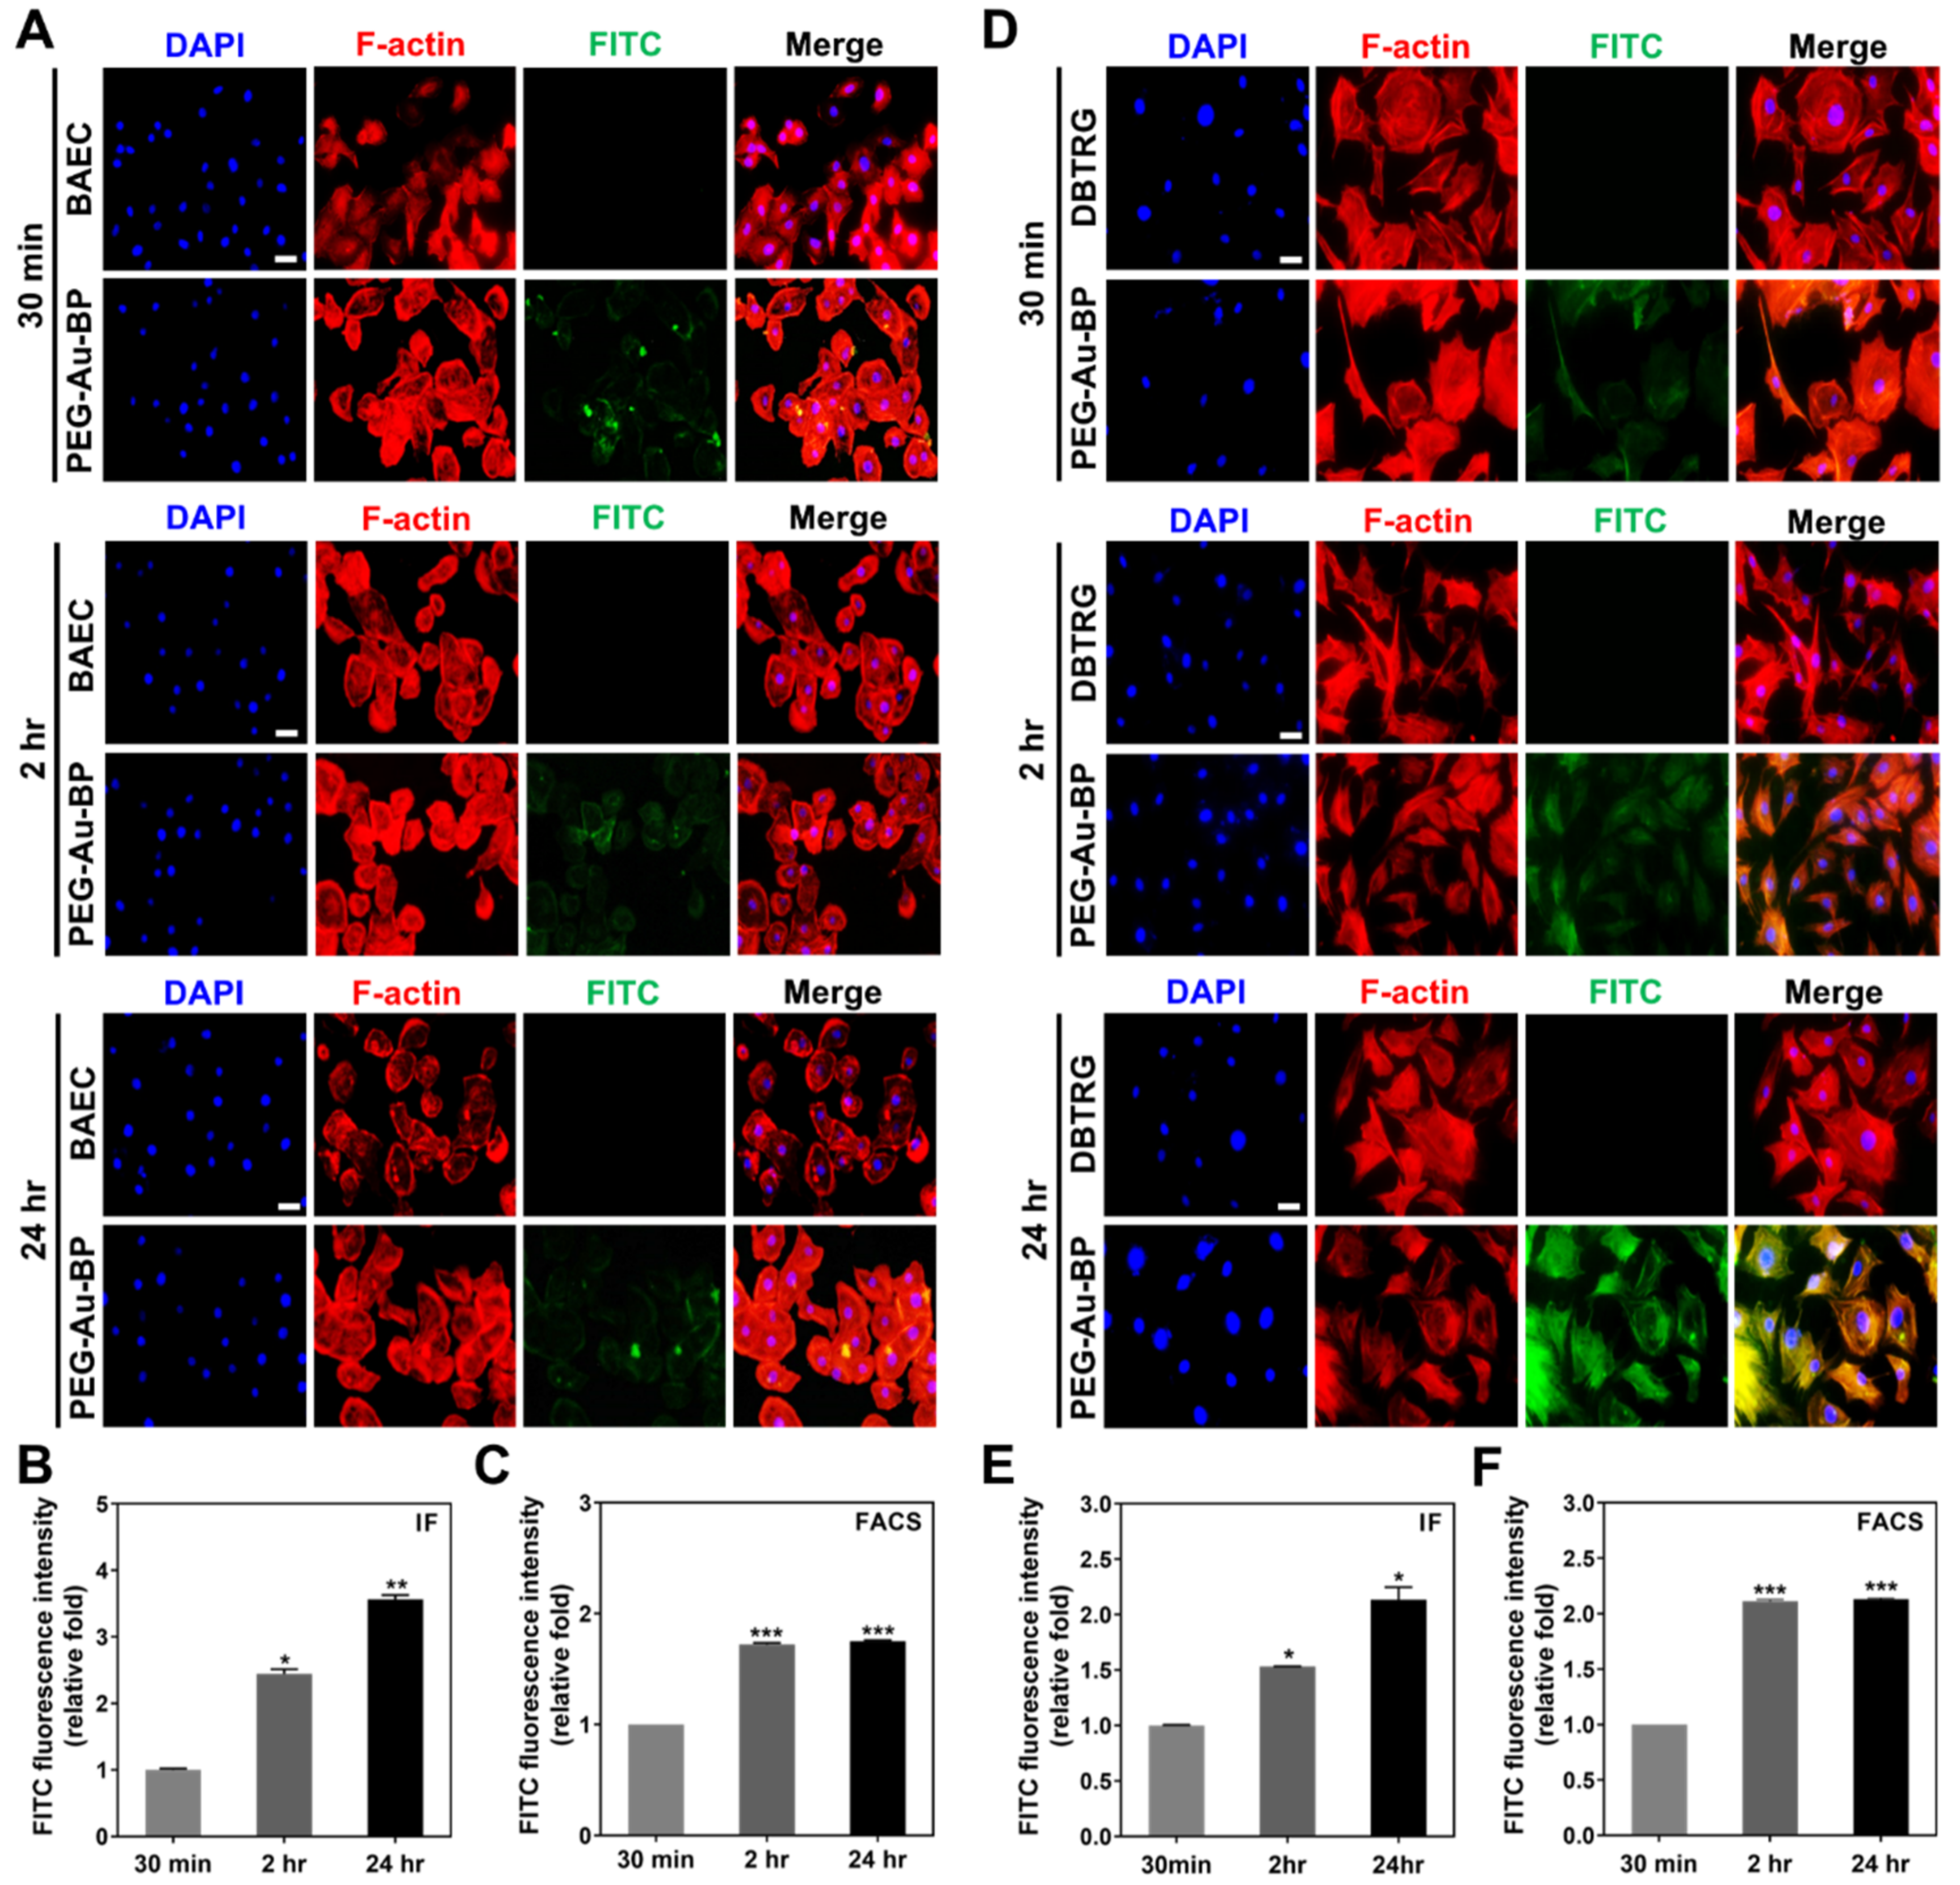
2.5. Cellular Uptake and Endocytosis Investigation
2.6. LysoTracker Staining
2.7. Cell Cycle Analysis
2.8. Annexin-V and PI Staining for Cell Apoptosis
2.9. Western Blot for Apoptotic Related Protein Expression
2.10. In Vivo Tissue Distribution of PEG-Au-BP Nanoparticles
2.11. Statistical Analysis
3. Results
3.1. Characterization of Polyethylene-Glycol-Gold Nanoparticles with n-Butylidenephthalide (PEG-Au-BP)
3.2. Cytotoxicity Assessments of PEG-Au-BP Nanodrugs on BAEC and DBTRG Cell Lines
3.3. Cell Uptake Ability between BAEC and DBTRG Cell Lines
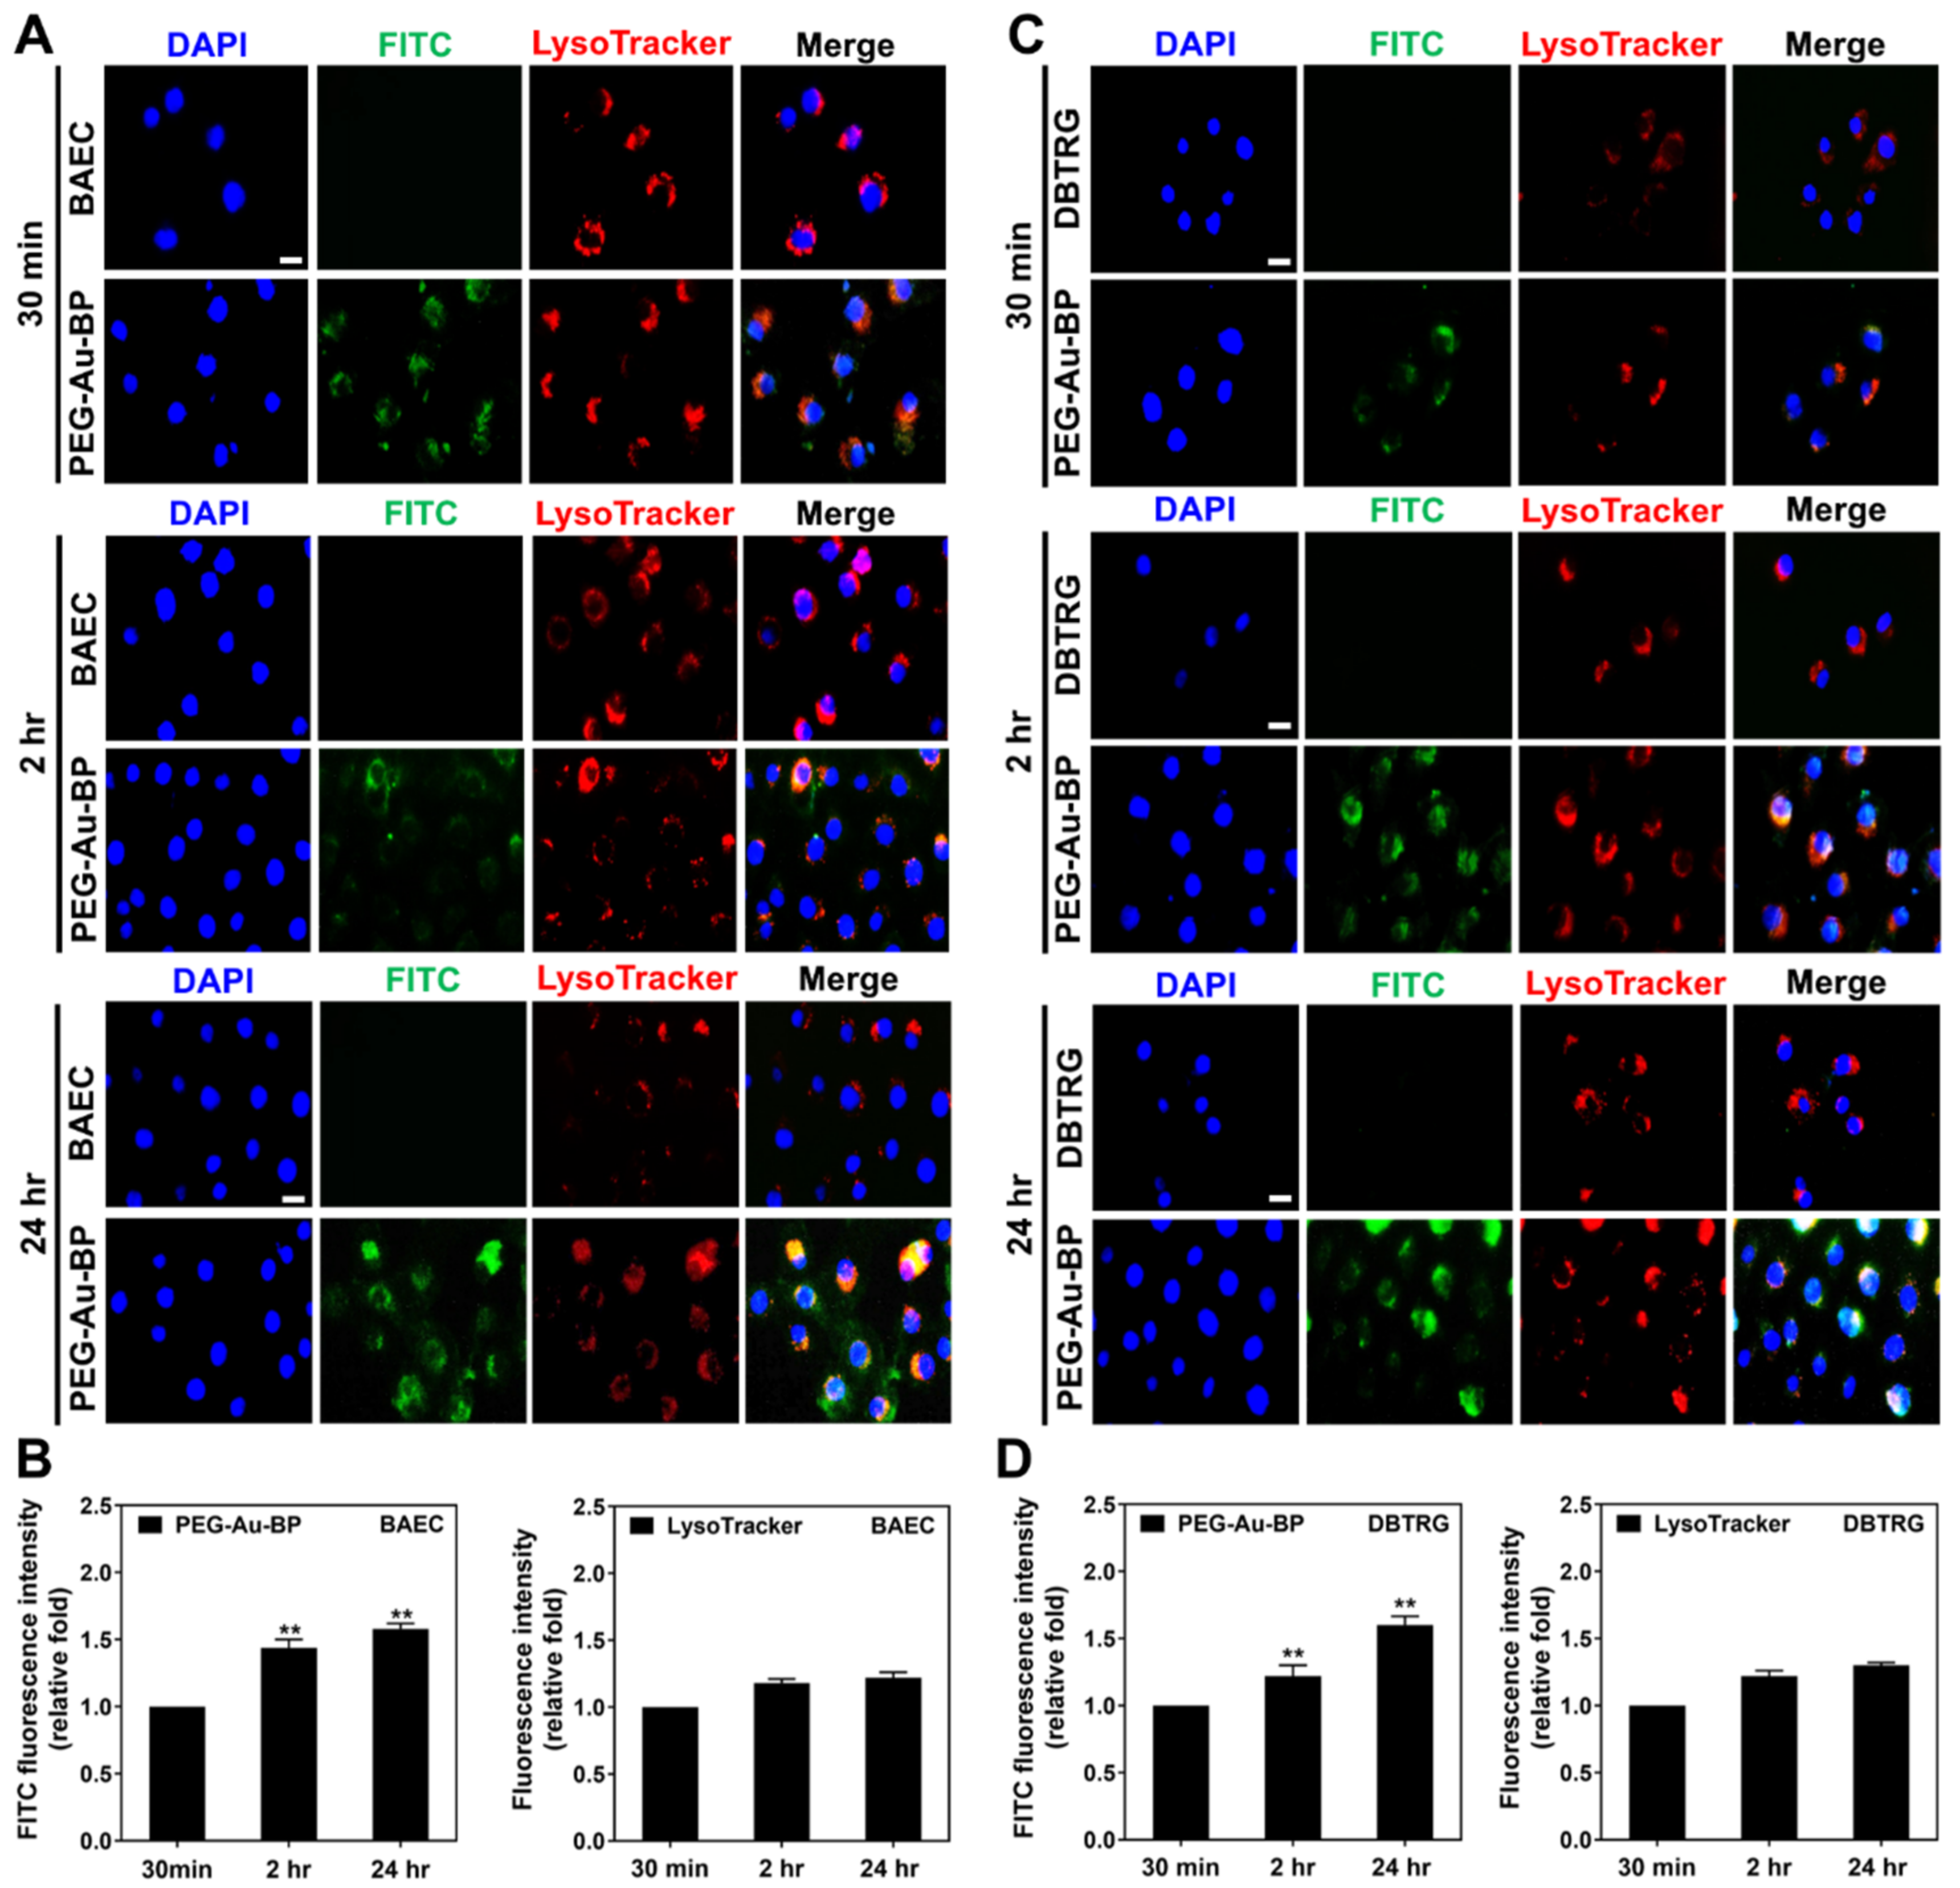
3.4. Investigation of Potential Cellular Transportation on BAEC and DBTRG Cell Lines
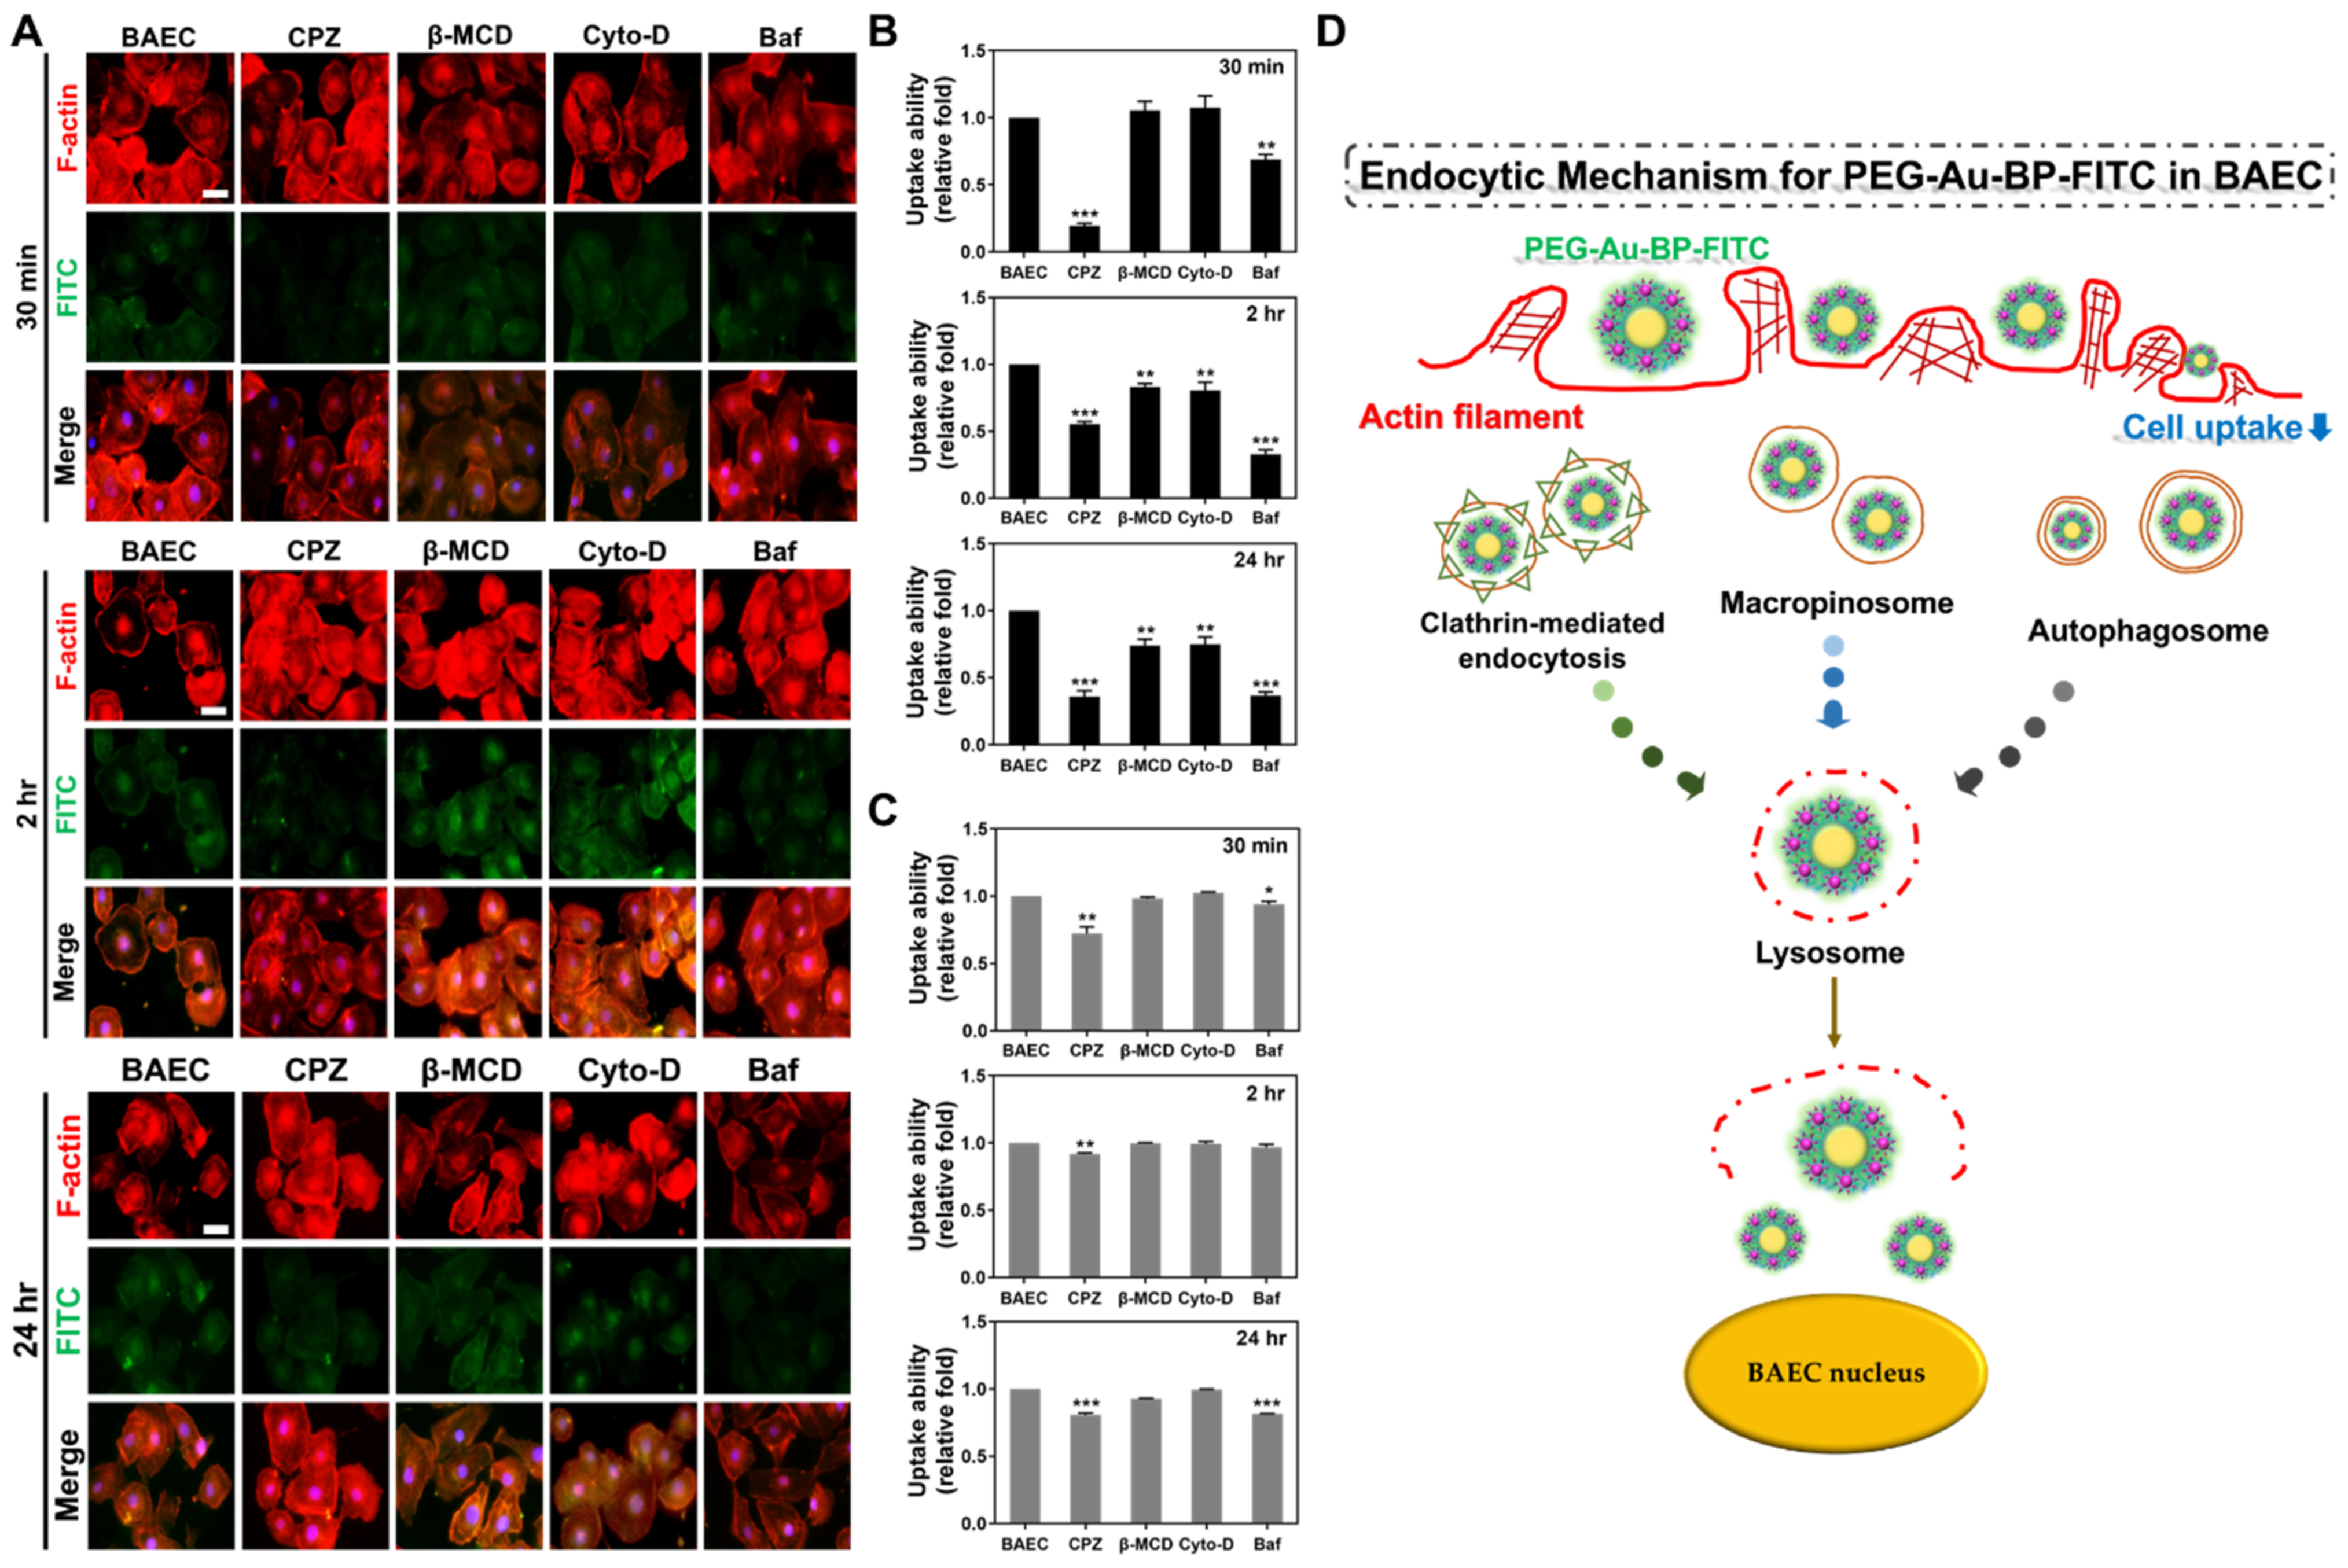
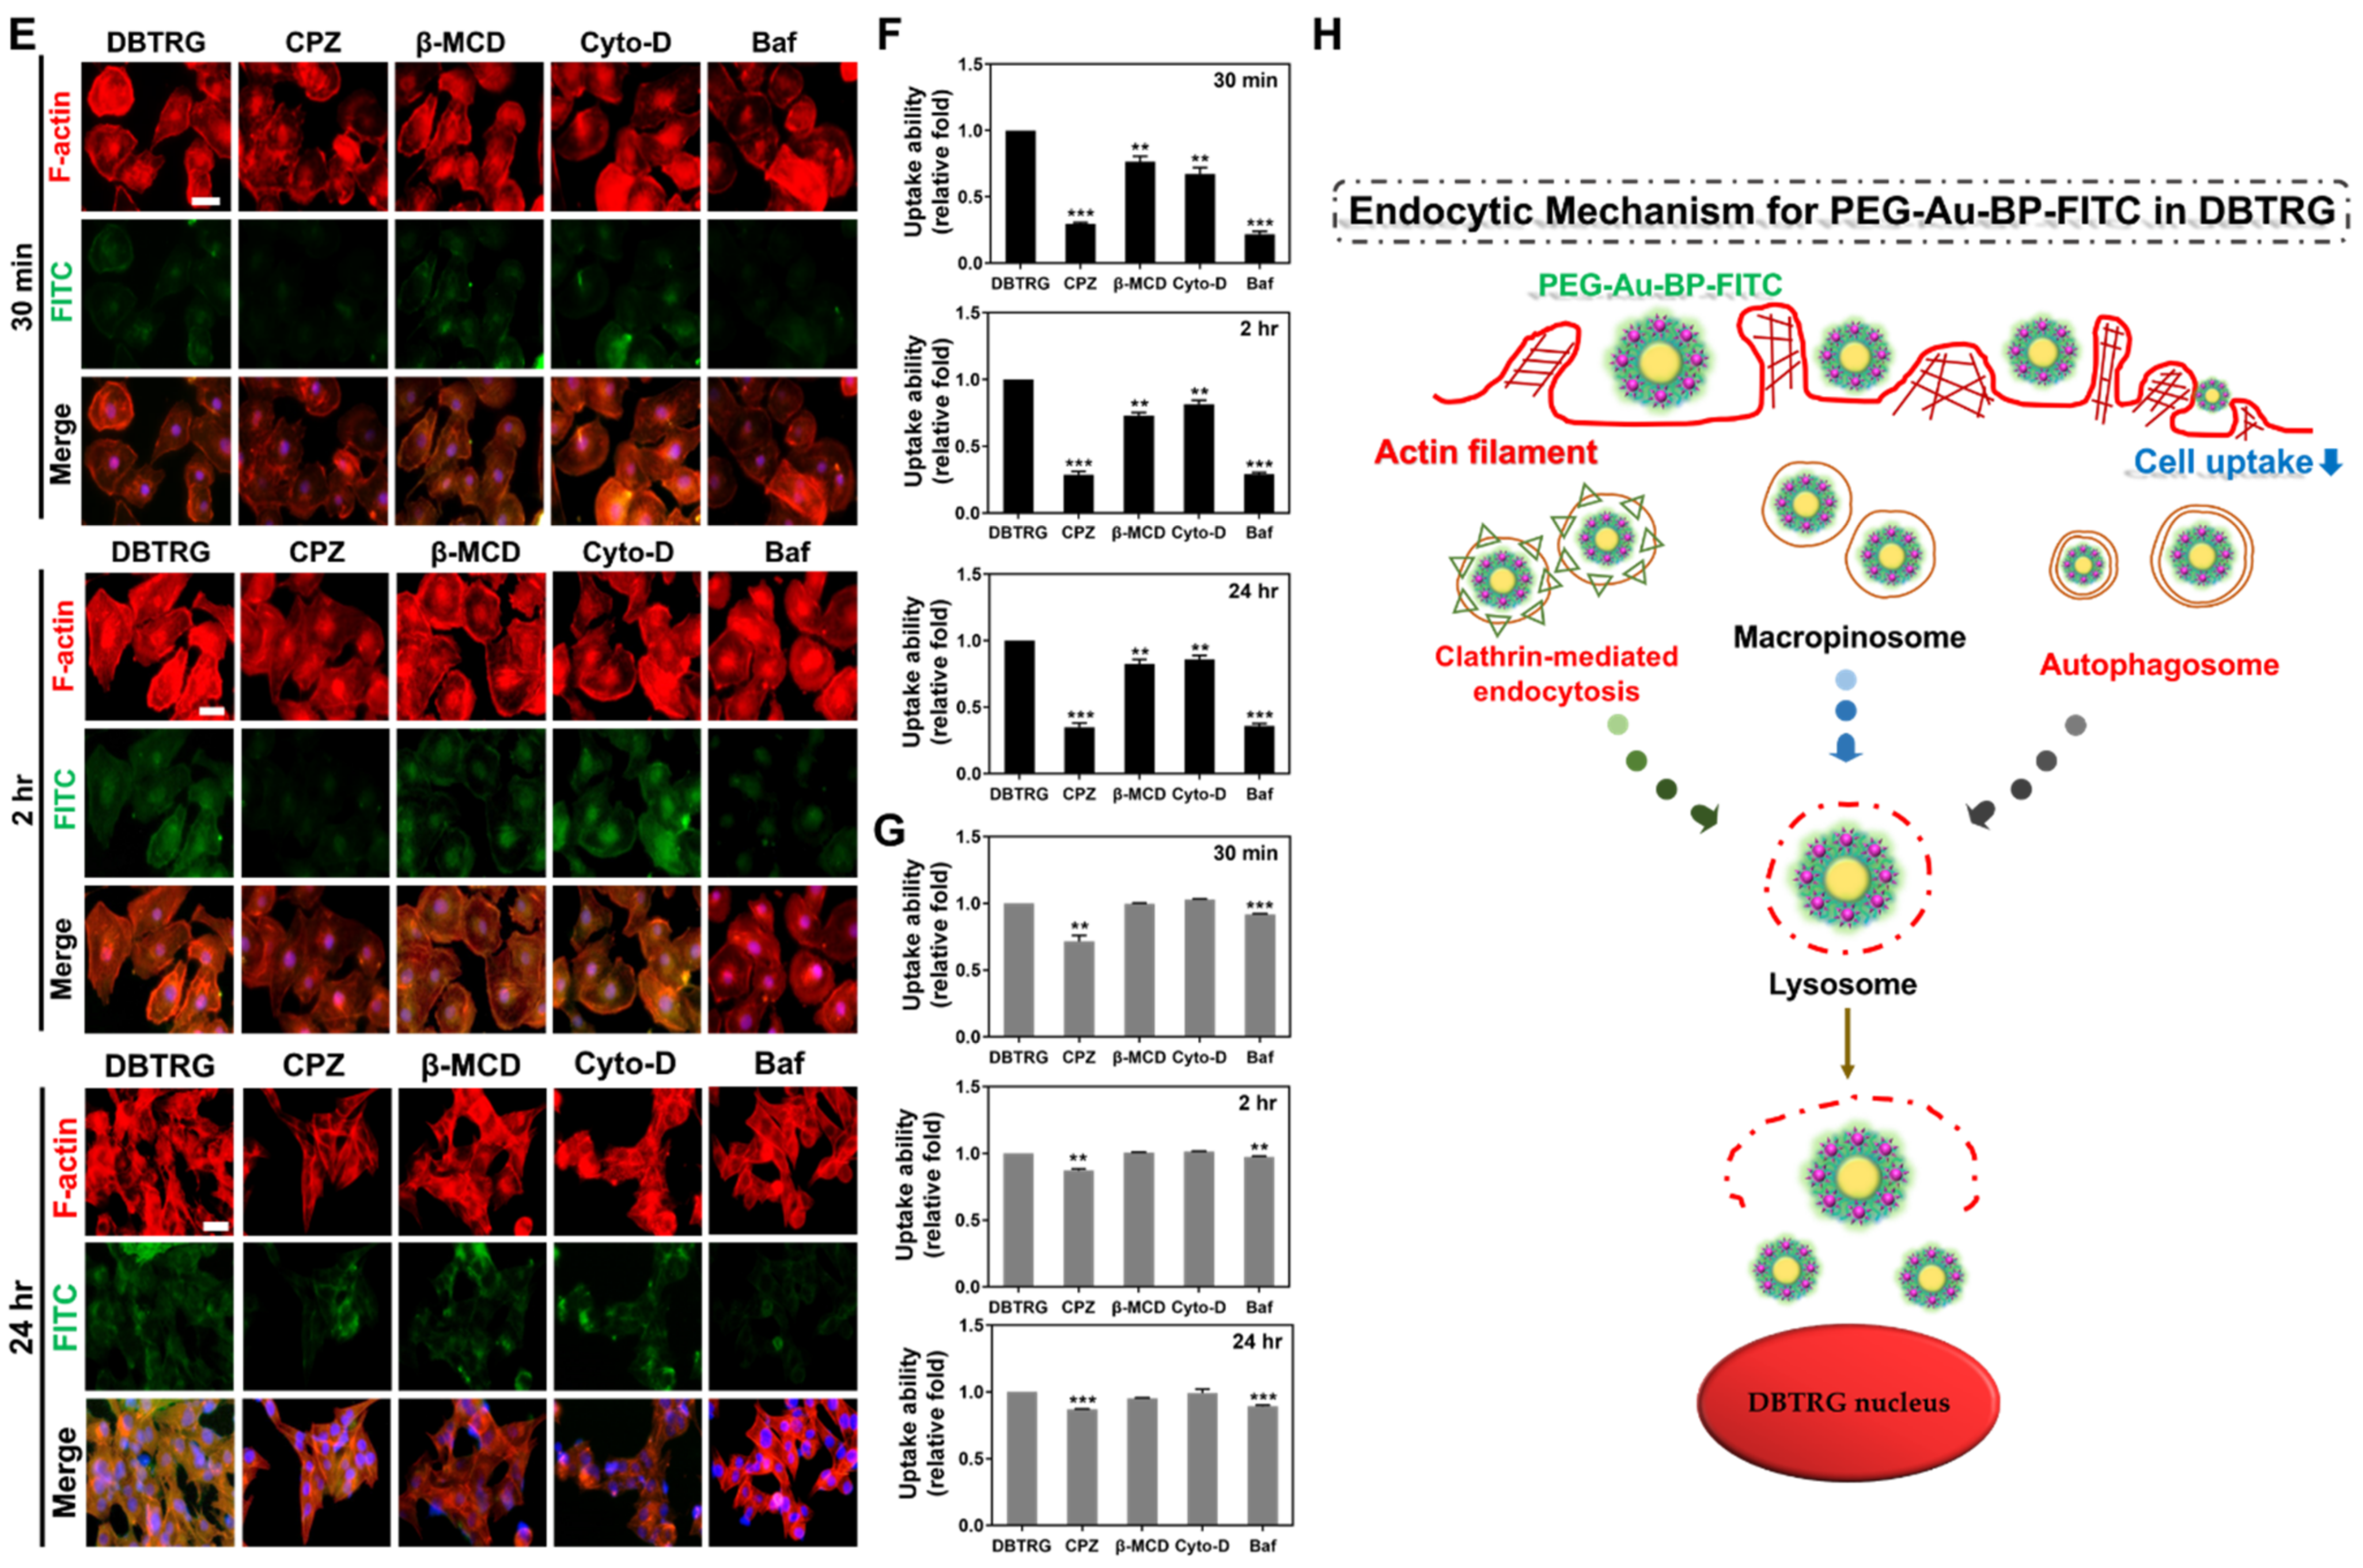
3.5. Measurements of Endocytic Routes between BAEC and DBTRG Cell Lines
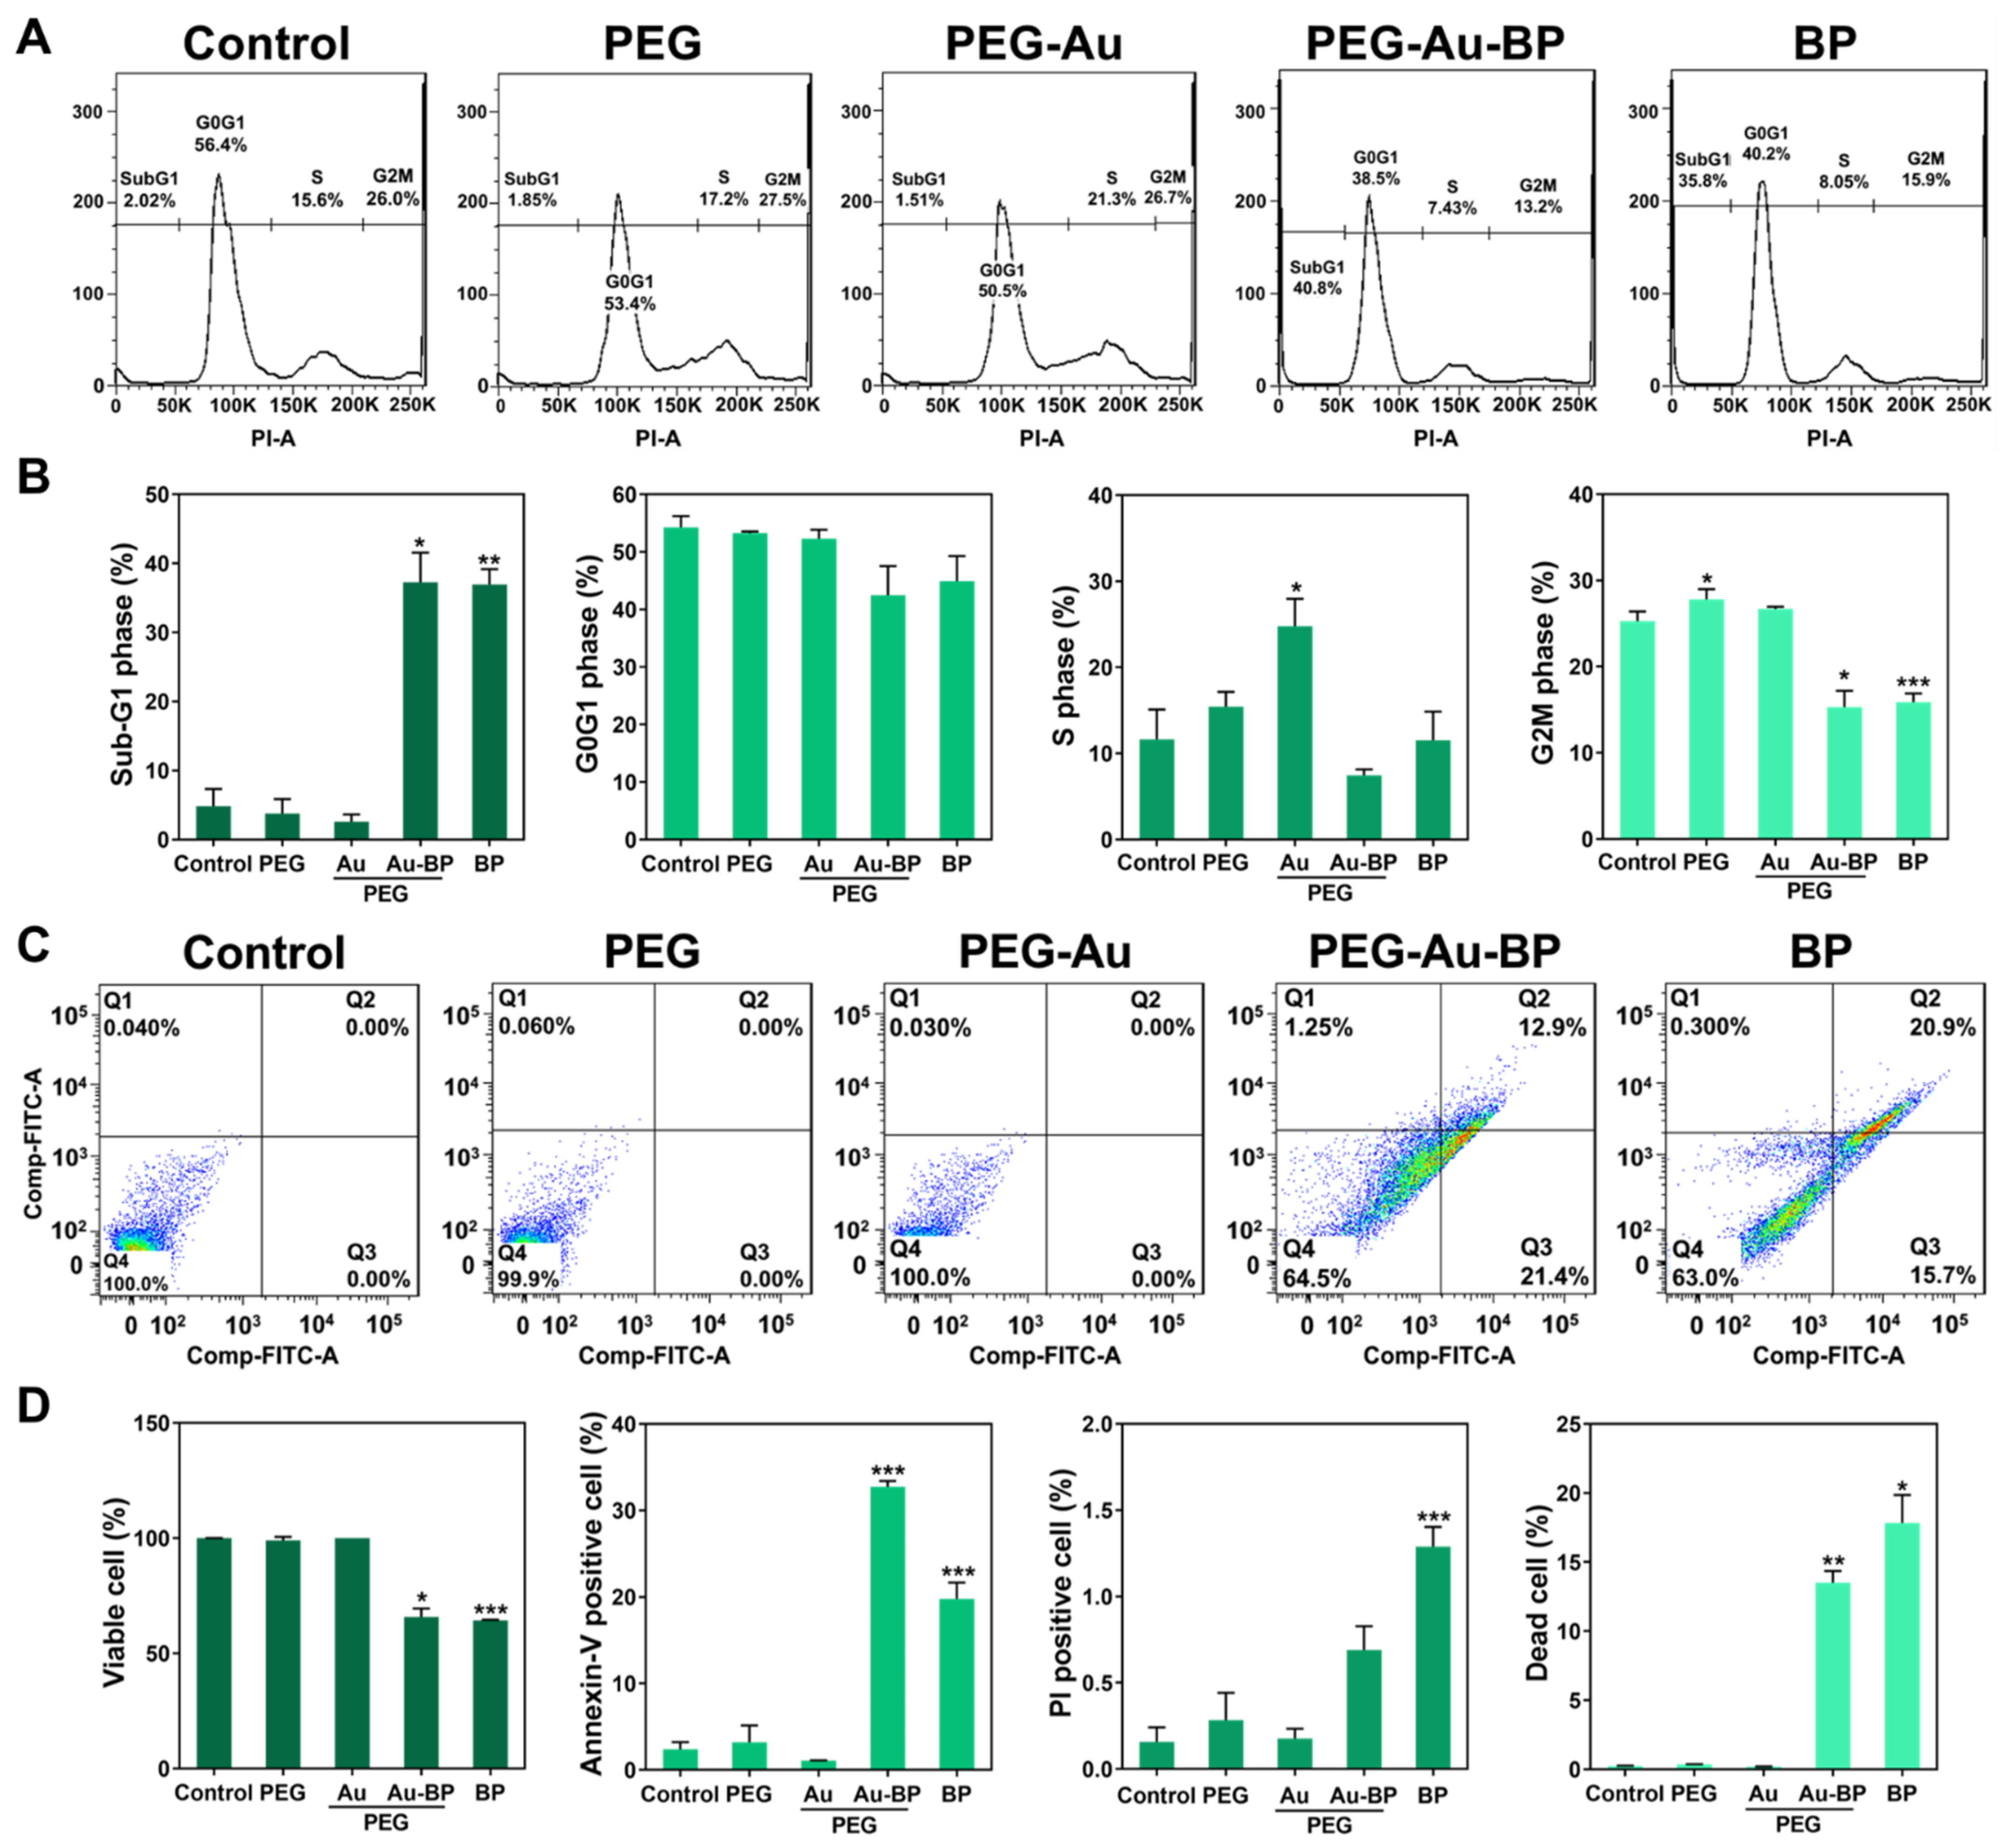
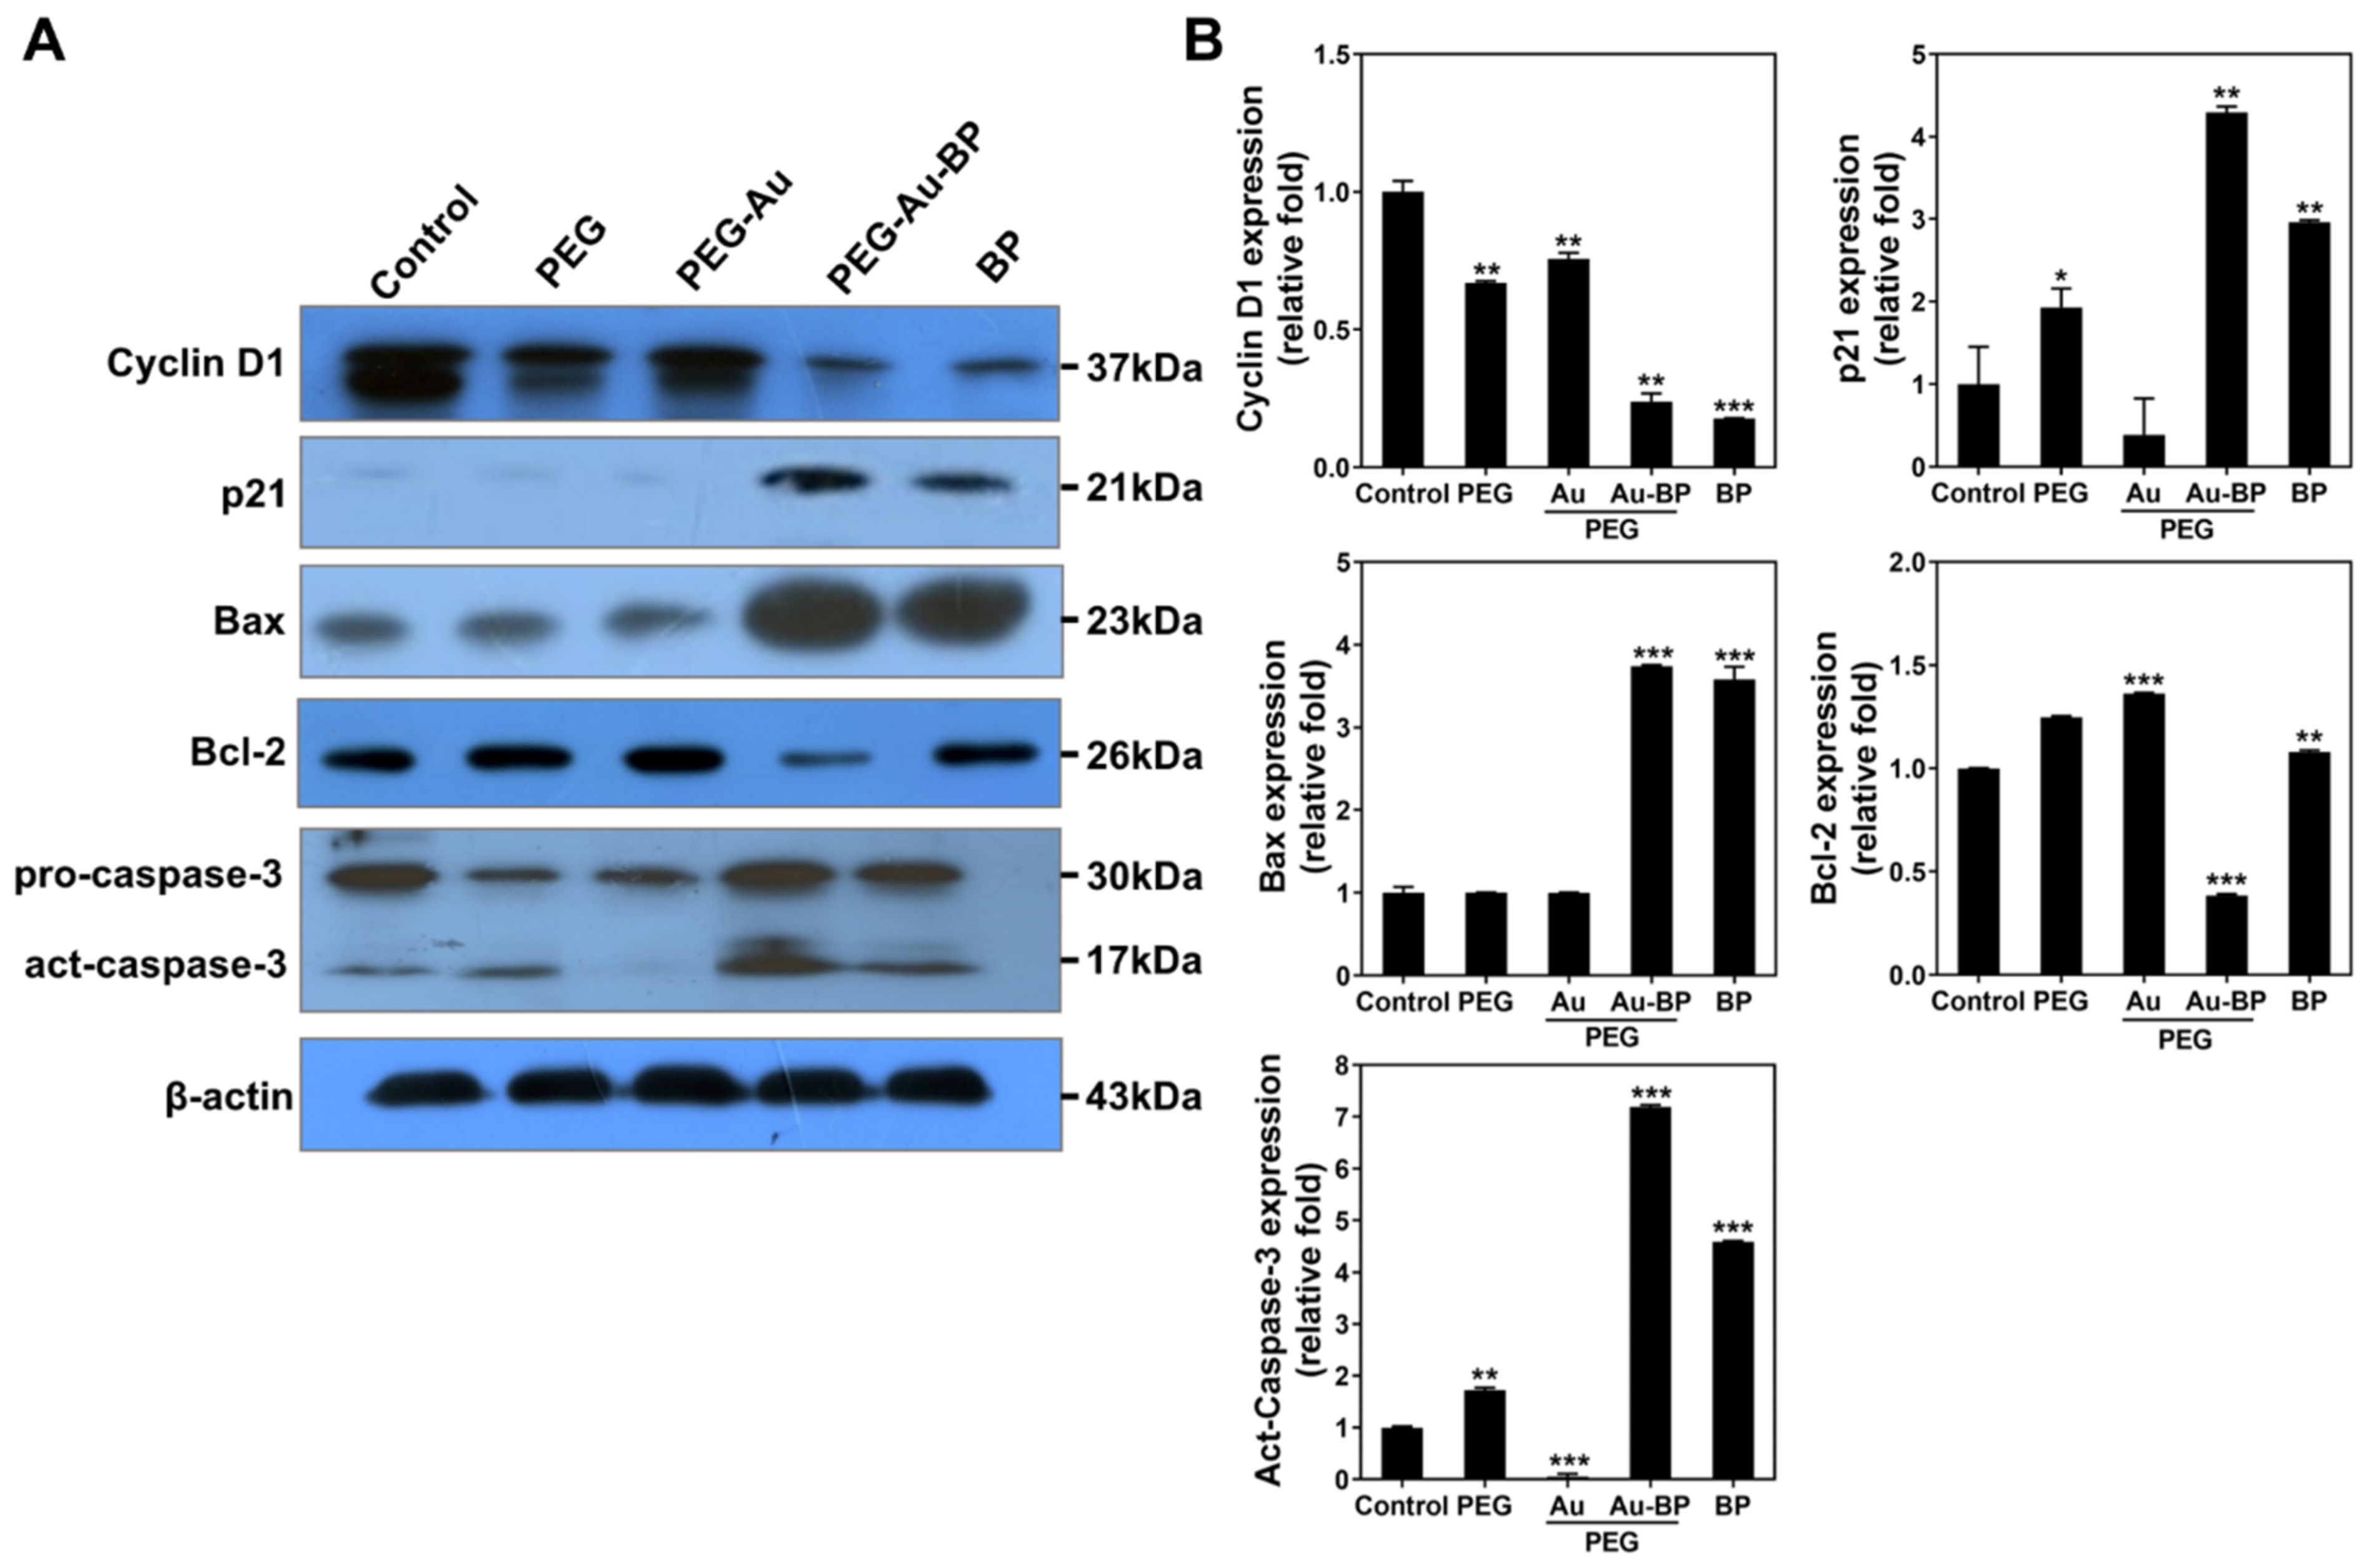
3.6. Apoptotic Cell Death Regulation of PEG-Au-BP Nanodrugs on DBTRG Cell Lines
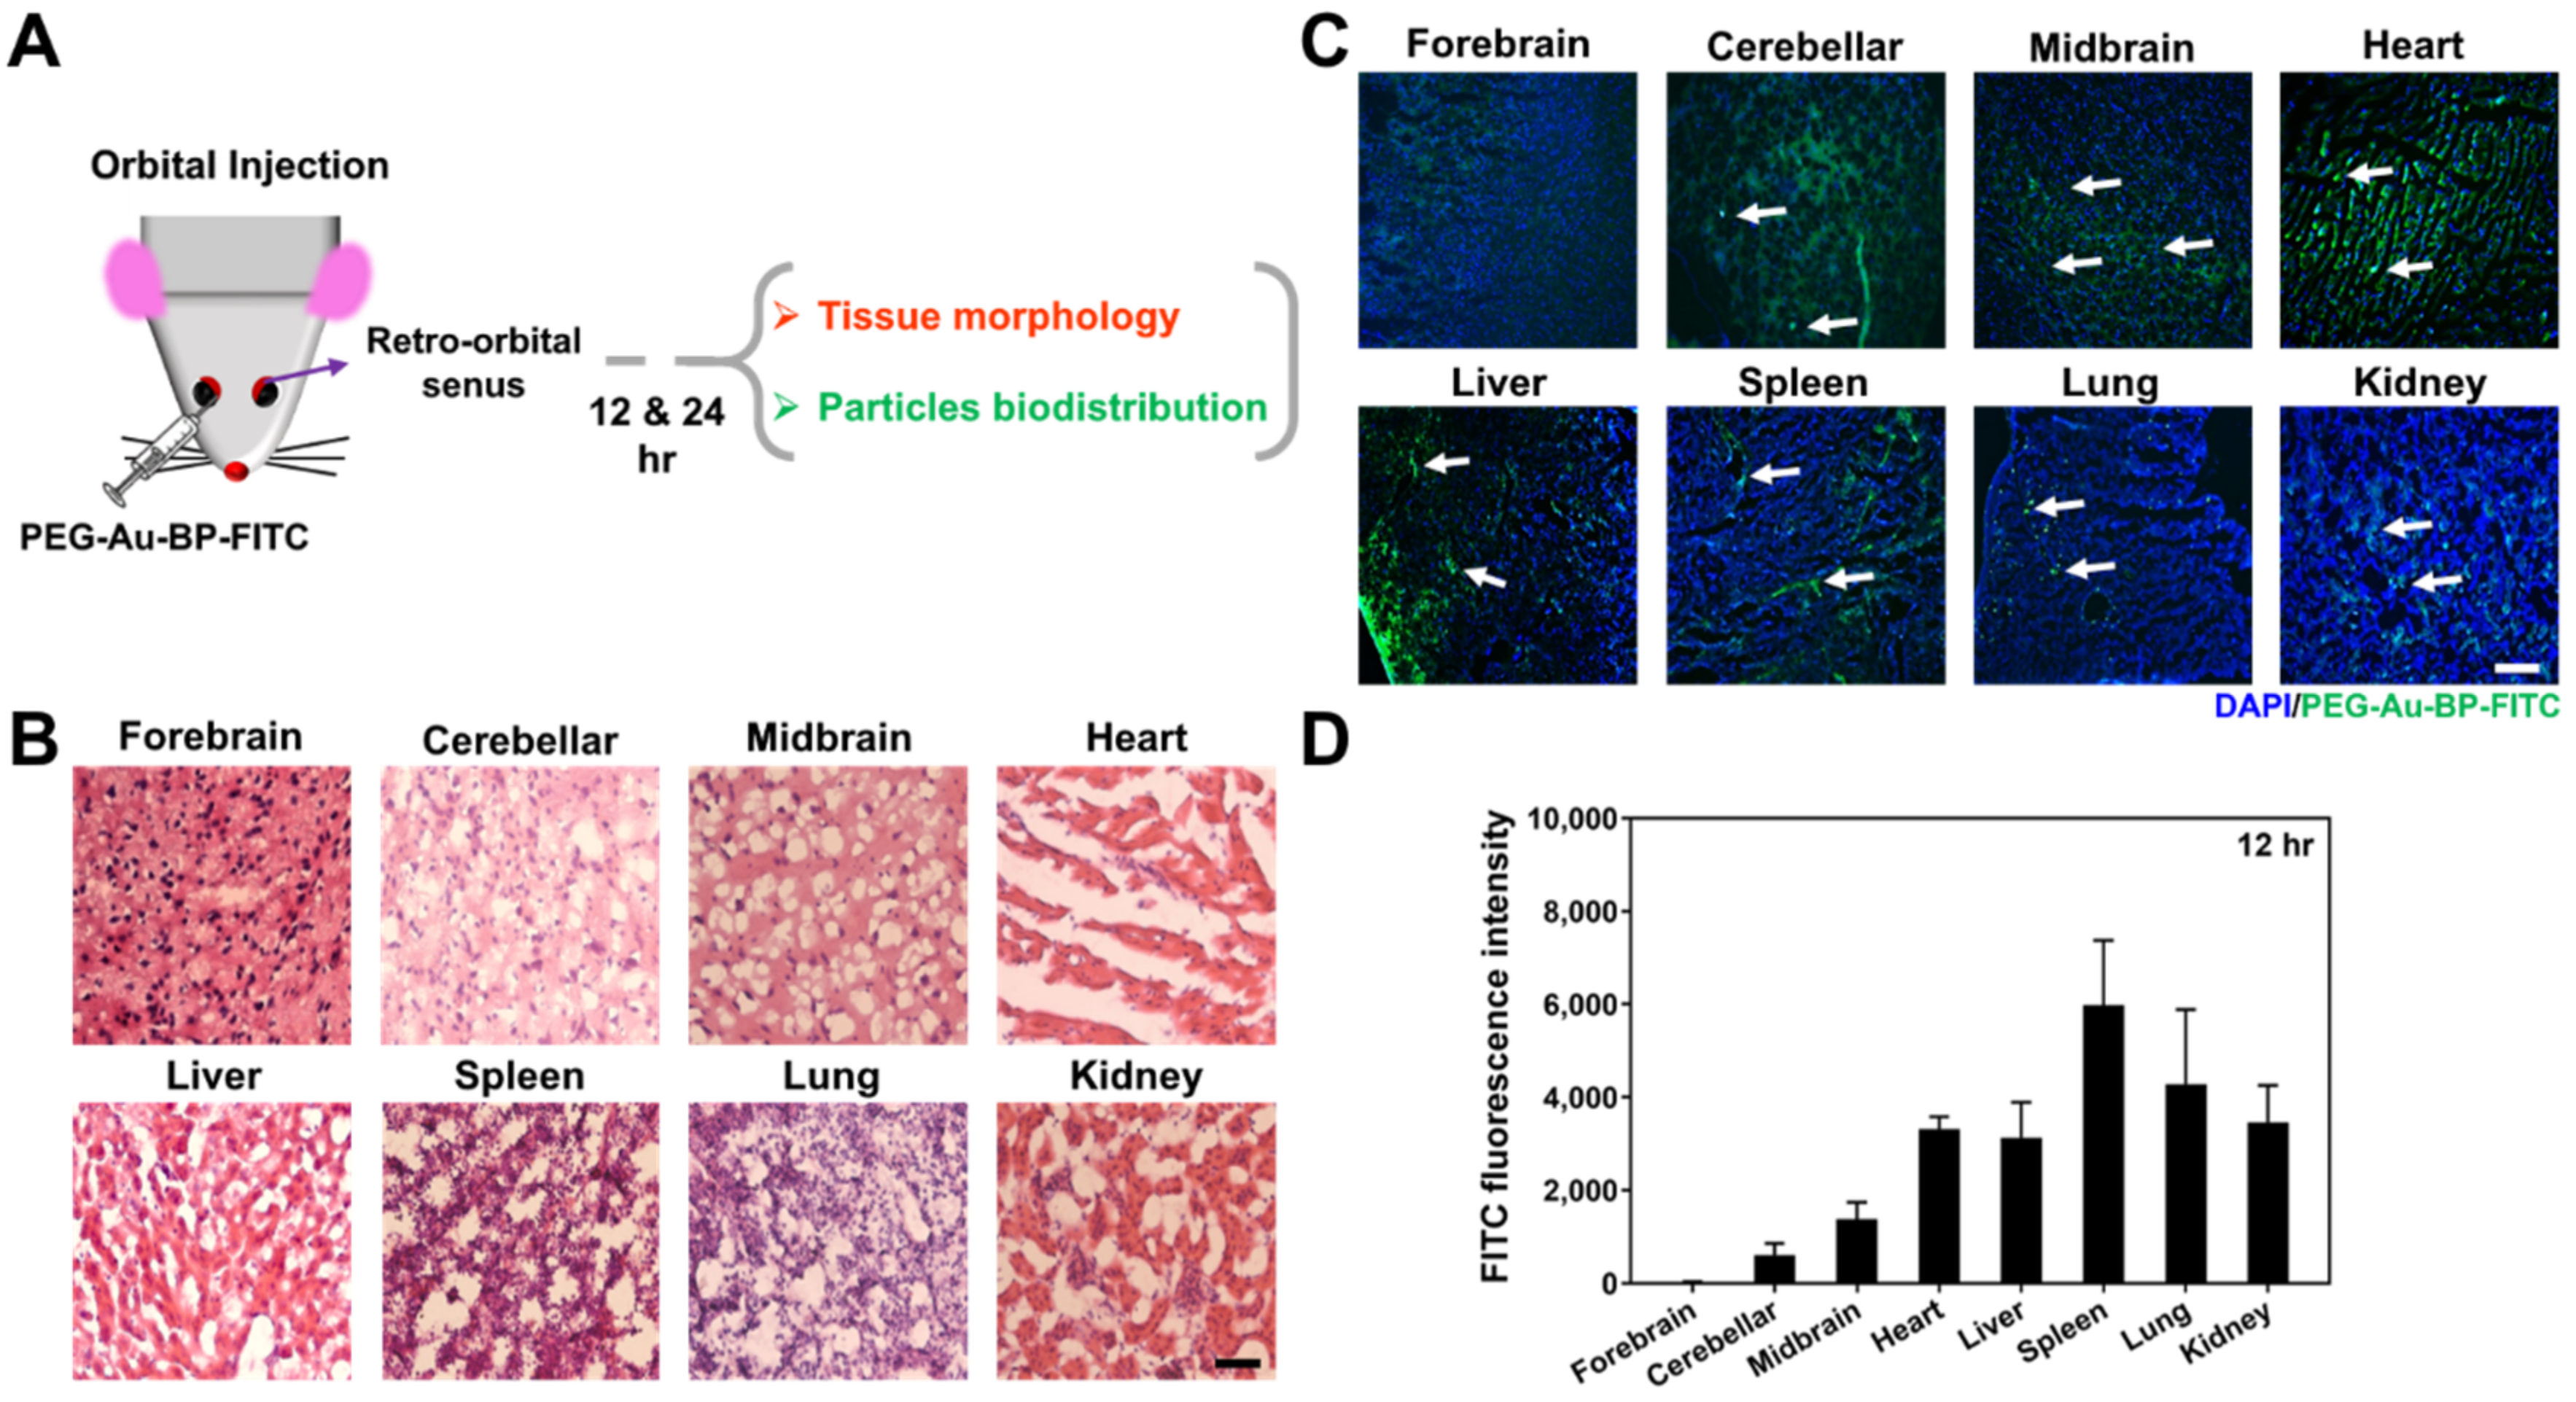
3.7. Retention Efficiency of PEG-Au-BP Nanodrugs through In Vivo Assessment
4. Discussion
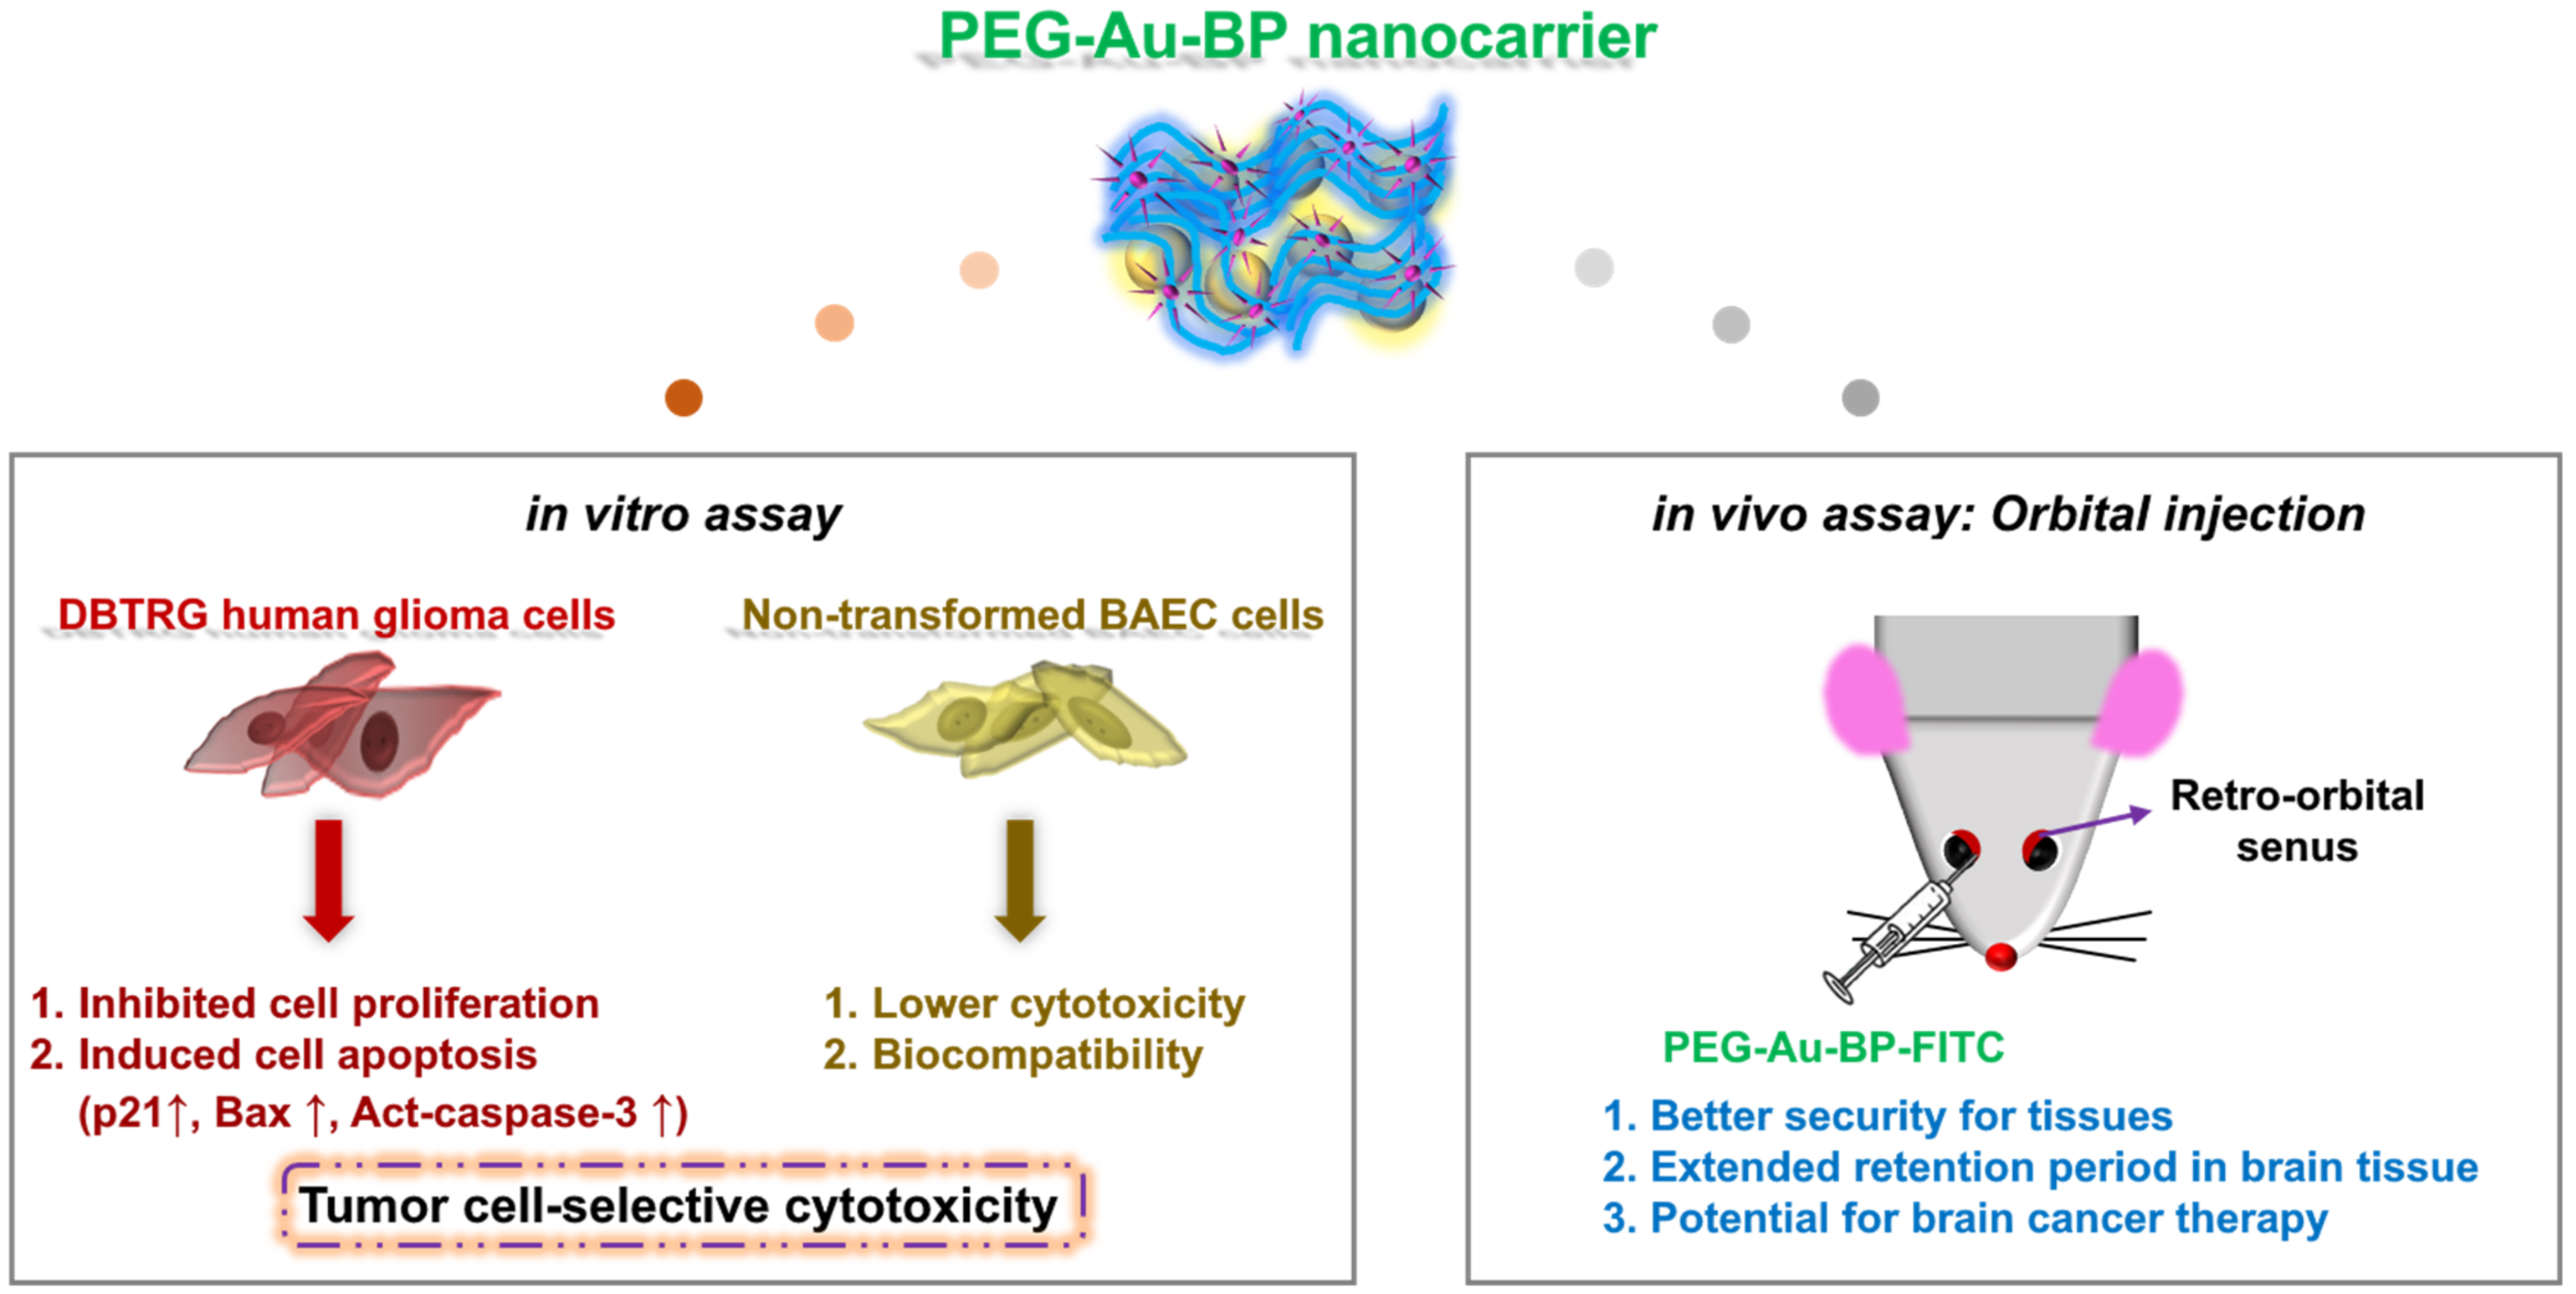
5. Conclusions
Supplementary Materials
Author Contributions
Funding
Institutional Review Board Statement
Informed Consent Statement
Data Availability Statement
Conflicts of Interest
References
- Louis, D.N.; Perry, A.; Wesseling, P.; Brat, D.J.; Cree, I.A.; Figarella-Branger, D.; Hawkins, C.; Ng, H.K.; Pfister, S.M.; Reifenberger, G.; et al. The 2021 WHO classification of tumors of the central nervous system: A summary. Neuro-Oncology 2021, 23, 1231–1251. [Google Scholar] [CrossRef] [PubMed]
- Koo, Y.-E.L.; Reddy, G.R.; Bhojani, M.; Schneider, R.; Philbert, M.A.; Rehemtulla, A.; Ross, B.D.; Kopelman, R. Brain cancer diagnosis and therapy with nanoplatforms. Adv. Drug Deliv. Rev. 2006, 58, 1556–1577. [Google Scholar] [CrossRef]
- Shah, V.; Kochar, P. Brain cancer: Implication to disease, therapeutic strategies and tumor targeted drug delivery approaches. Recent Pat. Anti-Cancer Drug Discov. 2018, 13, 70–85. [Google Scholar] [CrossRef] [PubMed]
- Ritschel, K.; Pechlivanis, I.; Winter, S. Brain tumor classification on intraoperative contrast-enhanced ultrasound. Int. J. Comput. Assist. Radiol. Surg. 2015, 10, 531–540. [Google Scholar] [CrossRef] [PubMed]
- Ridgway, D.; Khan, A.; Ridgway, G.; Cierpial, M.A.; Lineberry, C.G. Subject numbers and placebo outcome variability in clinical trials of new CNS medications. Ther. Innov. Regul. Sci. 2007, 41, 701–708. [Google Scholar] [CrossRef]
- Folkman, J. Tumor angiogenesis: Therapeutic implications. N. Engl. J. Med. 1971, 285, 1182–1186. [Google Scholar] [CrossRef]
- Tandel, G.S.; Biswas, M.; Kakde, O.G.; Tiwari, A.; Suri, H.S.; Turk, M.; Laird, J.R.; Asare, C.K.; Ankrah, A.A.; Khanna, N.N.; et al. A review on a deep learning perspective in brain cancer classification. Cancers 2019, 11, 111. [Google Scholar] [CrossRef]
- Alkilani, A.Z.; McCrudden, M.T.; Donnelly, R.F. Transdermal drug delivery: Innovative pharmaceutical developments based on disruption of the barrier properties of the stratum corneum. Pharmaceutics 2015, 7, 438–470. [Google Scholar] [CrossRef]
- Byrne, J.D.; Betancourt, T.; Brannon-Peppas, L. Active targeting schemes for nanoparticle systems in cancer therapeutics. Adv. Drug Deliv. Rev. 2008, 60, 1615–1626. [Google Scholar] [CrossRef]
- Wojtkowiak, J.W.; Verduzco, D.; Schramm, K.J.; Gillies, R.J. Drug resistance and cellular adaptation to tumor acidic pH microenvironment. Mol. Pharm. 2011, 8, 2032–2038. [Google Scholar] [CrossRef]
- Patra, J.K.; Das, G.; Fraceto, L.F.; Campos, E.V.R.; Rodriguez-Torres, M.D.P.; Acosta-Torres, L.S.; Diaz-Torres, L.A.; Grillo, R.; Swamy, M.K.; Sharma, S.; et al. Nano based drug delivery systems: Recent developments and future prospects. J. Nanobiotechnol. 2018, 16, 71. [Google Scholar] [CrossRef]
- Su, S.; Kang, P.M. Recent advances in nanocarrier-assisted therapeutics delivery systems. Pharmaceutics 2020, 12, 837. [Google Scholar] [CrossRef]
- Rostamnia, S.; Amini, M. Synthesis and application of the uniform particle size of nano-γ-Fe2O3: Dispersed nanoparticles of γ-Fe2O3 for green synthesis of aminophosphonates. J. Nanopart. Res. 2014, 16, 2405. [Google Scholar] [CrossRef]
- Khalid, A.; Persano, S.; Shen, H.; Zhao, Y.; Blanco, E.; Ferrari, M.; Wolfram, J. Strategies for improving drug delivery: Nanocarriers and microenvironmental priming. Expert Opin. Drug Deliv. 2016, 14, 865–877. [Google Scholar] [CrossRef]
- Daneman, R.; Prat, A. The blood–brain barrier. Cold Spring Harb. Perspect. Biol. 2015, 7, a020412. [Google Scholar] [CrossRef] [PubMed]
- Pardridge, W.M. Transport of small molecules through the blood-brain barrier: Biology and methodology. Adv. Drug Deliv. Rev. 1995, 15, 5–36. [Google Scholar] [CrossRef]
- Abbott, N.J.; Patabendige, A.A.K.; Dolman, D.E.M.; Yusof, S.R.; Begley, D.J. Structure and function of the blood-brain barrier. Neurobiol. Dis. 2010, 37, 13–25. [Google Scholar] [CrossRef]
- Abbott, N.J. Blood–brain barrier structure and function and the challenges for CNS drug delivery. J. Inherit. Metab. Dis. 2013, 36, 437–449. [Google Scholar] [CrossRef]
- Pai, M.P.; Sakoglu, U.; Peterson, S.L.; Lyons, C.R.; Sood, R. Characterization of BBB permeability in a preclinical model of cryptococcal meningoencephalitis using magnetic resonance imaging. J. Cereb. Blood Flow Metab. 2008, 29, 545–553. [Google Scholar] [CrossRef]
- Ahlawat, J.; Barroso, G.G.; Asil, S.M.; Alvarado, M.; Armendariz, I.; Bernal, J.; Carabaza, X.; Chavez, S.; Cruz, P.; Escalante, V.; et al. Nanocarriers as potential drug delivery candidates for overcoming the blood–brain barrier: Challenges and possibilities. ACS Omega 2020, 5, 12583–12595. [Google Scholar] [CrossRef]
- Ahn, K.-S.; Sim, W.-S.; Kim, I.-H. Detection of anticancer activity from the root of Angelica gigas in vitro. J. Microbiol. Biotechnol. 1995, 5, 105–109. [Google Scholar]
- Lin, Y.L.; Chang, K.F.; Huang, X.F.; Hung, C.L.; Chen, S.C.; Chao, W.R.; Liao, K.W.; Tsai, N.M. Liposomal n-butylidenephthalide protects the drug from oxidation and enhances its antitumor effects in glioblastoma multiforme. Int. J. Nanomed. 2015, 10, 6009. [Google Scholar] [CrossRef][Green Version]
- Kim, C.; Kim, B. Anti-cancer natural products and their bioactive compounds inducing ER stress-mediated apoptosis: A review. Nutrients 2018, 10, 1021. [Google Scholar] [CrossRef]
- Subramaniam, S.; Selvaduray, K.R.; Radhakrishnan, A.K. Bioactive compounds: Natural defense against cancer? Biomolecules 2019, 9, 758. [Google Scholar] [CrossRef]
- Chiu, S.-C.; Chen, S.-P.; Huang, S.-Y.; Wang, M.-J.; Lin, S.-Z.; Harn, H.-J.; Pang, C.-Y. Induction of apoptosis coupled to en-doplasmic reticulum stress in human prostate cancer cells by n-butylidenephthalide. PLoS ONE 2012, 7, e33742. [Google Scholar]
- Liu, S.-P.; Harn, H.-J.; Chien, Y.-J.; Chang, C.-H.; Hsu, C.-Y.; Fu, R.-H.; Huang, Y.-C.; Chen, S.-Y.; Shyu, W.-C.; Lin, S.-Z. n-Butylidenephthalide (BP) maintains stem cell pluripotency by activating Jak2/Stat3 pathway and increases the efficiency of iPS cells generation. PLoS ONE 2012, 7, e44024. [Google Scholar] [CrossRef] [PubMed]
- Fu, R.-H.; Harn, H.-J.; Liu, S.-P.; Chen, C.-S.; Chang, W.-L.; Chen, Y.-M.; Huang, J.-E.; Li, R.-J.; Tsai, S.-Y.; Hung, H.-S. n-Butylidenephthalide protects against dopaminergic neuron degeneration and α-synuclein accumulation in Caenorhabditis elegans models of Parkinson’s disease. PLoS ONE 2014, 9, e85305. [Google Scholar] [CrossRef] [PubMed]
- Hung, H.-S.; Kao, W.-C.; Shen, C.-C.; Chang, K.-B.; Tang, C.-M.; Yang, M.-Y.; Yang, Y.-C.; Yeh, C.-A.; Li, J.-J.; Hsieh, H.-H. Inflammatory modulation of polyethylene Glycol-AuNP for regulation of the neural differentiation capacity of mesenchymal stem cells. Cells 2021, 10, 2854. [Google Scholar] [CrossRef] [PubMed]
- Kumar, R.; Sahoo, G.C.; Pandey, K.; Das, V.; Das, P. Study the effects of PLGA-PEG encapsulated amphotericin B nanoparticle drug delivery system against Leishmania Donovani. Drug Deliv. 2015, 22, 383–388. [Google Scholar] [CrossRef]
- Parveen, S.; Sahoo, S.K. Long circulating chitosan/PEG blended PLGA nanoparticle for tumor drug delivery. Eur. J. Pharmacol. 2011, 670, 372–383. [Google Scholar] [CrossRef]
- Kong, F.-Y.; Zhang, J.-W.; Li, R.-F.; Wang, Z.-X.; Wang, W.-J.; Wang, W. Unique roles of gold nanoparticles in drug delivery, targeting and imaging applications. Molecules 2017, 22, 1445. [Google Scholar] [CrossRef] [PubMed]
- Au, L.; Zhang, Q.; Cobley, C.M.; Gidding, M.; Schwartz, A.G.; Chen, J.; Xia, Y. Quantifying the cellular uptake of antibody-conjugated Au nanocages by two-photon microscopy and inductively coupled plasma mass spectrometry. ACS Nano 2010, 4, 35–42. [Google Scholar] [CrossRef] [PubMed]
- Kumara, C.; Zuo, X.; Cullen, D.A.; Dass, A. Faradaurate-940: Synthesis, mass spectrometry, electron microscopy, high-energy X-ray diffraction, and X-ray scattering study of Au∼940±20(SR)∼160±4 nanocrystals. ACS Nano 2014, 8, 6431–6439. [Google Scholar] [CrossRef] [PubMed]
- Kudgus, R.A.; Szabolcs, A.; Khan, J.A.; Walden, C.A.; Reid, J.M.; Robertson, J.D.; Bhattacharya, R.; Mukherjee, P. Inhibiting the growth of pancreatic adenocarcinoma in vitro and in vivo through targeted treatment with designer gold nanotherapeutics. PLoS ONE 2013, 8, e57522. [Google Scholar] [CrossRef] [PubMed]
- Zhang, X.-D.; Wu, D.; Shen, X.; Chen, J.; Sun, Y.-M.; Liu, P.-X.; Liang, X.-J. Size-dependent radiosensitization of PEG-coated gold nanoparticles for cancer radiation therapy. Biomaterials 2012, 33, 6408–6419. [Google Scholar] [CrossRef] [PubMed]
- Niidome, T.; Ohga, A.; Akiyama, Y.; Watanabe, K.; Niidome, Y.; Mori, T.; Katayama, Y. Controlled release of PEG chain from gold nanorods: Targeted delivery to tumor. Bioorg. Med. Chem. 2010, 18, 4453–4458. [Google Scholar] [CrossRef]
- Hung, H.-S.; Chang, C.-H.; Chang, C.-J.; Tang, C.-M.; Kao, W.-C.; Lin, S.-Z.; Hsieh, H.-H.; Chu, M.-Y.; Sun, W.-S.; Hsu, S.-H. In vitro study of a novel nanogold-collagen composite to enhance the mesenchymal stem cell behavior for vascular regeneration. PLoS ONE 2014, 9, e104019. [Google Scholar]
- Loloei, M.; Omidkhah, M.; Moghadassi, A.; Amooghin, A.E. Preparation and characterization of Matrimid® 5218 based binary and ternary mixed matrix membranes for CO2 separation. Int. J. Greenh. Gas Control 2015, 39, 225–235. [Google Scholar] [CrossRef]
- Papac, R.J. Origins of cancer therapy. Yale J. Biol. Med. 2001, 74, 391. [Google Scholar]
- Giglio, P.; Gilbert, M.R. Cerebral radiation necrosis. Neurologist 2003, 9, 180–188. [Google Scholar] [CrossRef]
- Senapati, S.; Mahanta, A.K.; Kumar, S.; Maiti, P. Controlled drug delivery vehicles for cancer treatment and their performance. Signal Transduct. Target. Ther. 2018, 3, 7. [Google Scholar] [CrossRef] [PubMed]
- Akiyama, Y.; Kimura, Y.; Enatsu, R.; Mikami, T.; Wanibuchi, M.; Mikuni, N. Advantages and disadvantages of combined chemotherapy with carmustine wafer and bevacizumab in patients with newly diagnosed glioblastoma: A single-institutional experience. World Neurosurg. 2018, 113, e508–e514. [Google Scholar] [CrossRef] [PubMed]
- Zhang, T.-T.; Li, W.; Meng, G.; Wang, P.; Liao, W. Strategies for transporting nanoparticles across the blood–brain barrier. Biomater. Sci. 2016, 4, 219–229. [Google Scholar] [CrossRef] [PubMed]
- ud Din, F.; Aman, W.; Ullah, I.; Qureshi, O.S.; Mustapha, O.; Shafique, S.; Zeb, A. Effective use of nanocarriers as drug delivery systems for the treatment of selected tumors. Int. J. Nanomed. 2017, 12, 7291. [Google Scholar] [CrossRef]
- Kamaly, N.; Yameen, B.; Wu, J.; Farokhzad, O.C. Degradable controlled-release polymers and polymeric nanoparticles: Mechanisms of controlling drug release. Chem. Rev. 2016, 116, 2602–2663. [Google Scholar] [CrossRef]
- Arvizo, R.; Bhattacharya, R.; Mukherjee, P. Gold nanoparticles: Opportunities and challenges in nanomedicine. Expert Opin. Drug Deliv. 2010, 7, 753–763. [Google Scholar] [CrossRef]
- Li, W.; Cao, Z.; Liu, R.; Liu, L.; Li, H.; Li, X.; Chen, Y.; Lu, C.; Liu, Y. AuNPs as an important inorganic nanoparticle applied in drug carrier systems. Artif. Cells Nanomed. Biotechnol. 2019, 47, 4222–4233. [Google Scholar] [CrossRef]
- Chen, H.-C.; Kung, M.-L.; Huang, W.-X.; Fu, R.-H.; Yu, A.Y.-H.; Yang, Y.-T.; Hung, H.-S. Delivery of stromal-derived factor-1α via biocompatible gold nanoparticles promotes dendritic cells viability and migration. Colloids Surf. A Physicochem. Eng. Asp. 2021, 628, 127298. [Google Scholar] [CrossRef]
- Gentili, D.; Ori, G.; Franchini, M.C. Double phase transfer of gold nanorods for surface functionalization and entrapment into PEG-based nanocarriers. Chem. Commun. 2009, 39, 5874–5876. [Google Scholar] [CrossRef]
- Stiufiuc, R.; Iacovita, C.; Nicoara, R.; Stiufiuc, G.; Florea, A.; Achim, M.; Lucaciu, C.M. One-step synthesis of PEGylated gold nanoparticles with tunable surface charge. J. Nanomater. 2013, 2013, 146031. [Google Scholar] [CrossRef]
- Perrault, S.D.; Walkey, C.; Jennings, T.; Fischer, H.C.; Chan, W.C.W. Mediating tumor targeting efficiency of nanoparticles through design. Nano Lett. 2009, 9, 1909–1915. [Google Scholar] [CrossRef] [PubMed]
- Choi, C.H.J.; Alabi, C.A.; Webster, P.; Davis, M.E. Mechanism of active targeting in solid tumors with transferrin-containing gold nanoparticles. Proc. Natl. Acad. Sci. USA 2010, 107, 1235–1240. [Google Scholar] [CrossRef] [PubMed]
- Grabarek, Z.; Gergely, J. Zero-length crosslinking procedure with the use of active esters. Anal. Biochem. 1990, 185, 131–135. [Google Scholar] [CrossRef]
- Nakajima, N.; Ikada, Y. Mechanism of amide formation by carbodiimide for bioconjugation in aqueous media. Bioconjug. Chem. 1995, 6, 123–130. [Google Scholar] [CrossRef]
- Su, Y.-J.; Huang, S.-Y.; Ni, Y.-H.; Liao, K.-F.; Chiu, S.-C. Anti-tumor and radiosensitization effects of N-butylidenephthalide on human breast cancer cells. Molecules 2018, 23, 240. [Google Scholar] [CrossRef]
- Liao, K.-F.; Chiu, T.-L.; Huang, S.-Y.; Hsieh, T.-F.; Chang, S.-F.; Ruan, J.-W.; Chen, S.-P.; Pang, C.-Y.; Chiu, S.-C. Anti-cancer effects of radix angelica sinensis (danggui) and N-butylidenephthalide on gastric cancer: Implications for REDD1 activation and mTOR inhibition. Cell. Physiol. Biochem. 2018, 48, 2231–2246. [Google Scholar] [CrossRef]
- Chang, K.-F.; Chang, J.T.; Huang, X.-F.; Lin, Y.-L.; Liao, K.-W.; Huang, C.-W.; Tsai, N.-M. Antitumor effects of N-butylidenephthalide encapsulated in lipopolyplexs in colorectal cancer cells. Molecules 2020, 25, 2394. [Google Scholar] [CrossRef]
- D’Arcy, M.S. Cell death: A review of the major forms of apoptosis, necrosis and autophagy. Cell Biol. Int. 2019, 43, 582–592. [Google Scholar] [CrossRef]
- Obeng, E. Apoptosis (programmed cell death) and its signals—A review. Braz. J. Biol. 2020, 81, 1133–1143. [Google Scholar] [CrossRef]
- Elmore, S. Apoptosis: A review of programmed cell death. Toxicol. Pathol. 2007, 35, 495–516. [Google Scholar] [CrossRef]
- Poon, I.; Lucas, C.; Rossi, A.G.; Ravichandran, K. Apoptotic cell clearance: Basic biology and therapeutic potential. Nat. Rev. Immunol. 2014, 14, 166–180. [Google Scholar] [CrossRef] [PubMed]
- Liu, P.Y.; Sheu, J.J.-C.; Lin, P.C.; Lin, C.T.; Liu, Y.J.; Ho, L.I.; Chang, L.F.; Wu, W.C.; Chen, S.R.; Chen, J. Expression of Nur77 induced by an n-butylidenephthalide derivative promotes apoptosis and inhibits cell growth in oral squamous cell carci-noma. Investig. New Drugs 2012, 30, 79–89. [Google Scholar] [CrossRef] [PubMed]
- Lin, Y.-L.; Huang, X.-F.; Chang, K.-F.; Liao, K.-W.; Tsai, N.-M. Encapsulated n-butylidenephthalide efficiently crosses the blood–brain barrier and suppresses growth of glioblastoma. Int. J. Nanomed. 2020, 15, 749. [Google Scholar] [CrossRef] [PubMed]
- Tsai, N.-M.; Chen, Y.-L.; Lee, C.-C.; Lin, P.-C.; Cheng, Y.-L.; Chang, W.-L.; Lin, S.-Z.; Harn, H.-J. The natural compound n-butylidenephthalide derived from Angelica sinensis inhibits malignant brain tumor growth in vitro and in vivo. J. Neurochem. 2006, 99, 1251–1262. [Google Scholar] [CrossRef]
- Cayrol, C.; Knibiehler, M.; Ducommun, B. p21 binding to PCNA causes G1 and G2 cell cycle arrest in p53-deficient cells. Oncogene 1998, 16, 311–320. [Google Scholar] [CrossRef]
- Chiu, S.-C.; Chiu, T.-L.; Huang, S.-Y.; Chang, S.-F.; Chen, S.-P.; Pang, C.-Y.; Hsieh, T.-F. Potential therapeutic effects of N-butylidenephthalide from Radix Angelica Sinensis (Danggui) in human bladder cancer cells. BMC Complement. Altern. Med. 2017, 17, 523. [Google Scholar] [CrossRef]
- Gruenberg, J.; Maxfield, F. Membrane transport in the endocytic pathway. Curr. Opin. Cell Biol. 1995, 7, 552–563. [Google Scholar] [CrossRef]
- Chang, C.-C.; Wu, M.; Yuan, F. Role of specific endocytic pathways in electrotransfection of cells. Mol. Ther. Methods Clin. Dev. 2014, 1, 14058. [Google Scholar] [CrossRef]
- Xu, J.; Feng, H.T.; Wang, C.; Yip, K.H.M.; Pavlos, N.; Papadimitriou, J.M.; Wood, D.; Zheng, M.H. Effects of Bafilomycin A1: An inhibitor of vacuolar H (+)-ATPases on endocytosis and apoptosis in RAW cells and RAW cell-derived osteoclasts. J. Cell. Biochem. 2003, 88, 1256–1264. [Google Scholar] [CrossRef]
- Mizushima, N. Autophagy: Process and function. Genes Dev. 2007, 21, 2861–2873. [Google Scholar] [CrossRef]
- Zeng, J.; Shirihai, O.S.; Grinstaff, M.W. Modulating lysosomal pH: A molecular and nanoscale materials design perspective. J. Life Sci. 2020, 2, 25. [Google Scholar] [CrossRef] [PubMed]


Publisher’s Note: MDPI stays neutral with regard to jurisdictional claims in published maps and institutional affiliations. |
© 2022 by the authors. Licensee MDPI, Basel, Switzerland. This article is an open access article distributed under the terms and conditions of the Creative Commons Attribution (CC BY) license (https://creativecommons.org/licenses/by/4.0/).
Share and Cite
Hsing, M.-T.; Hsu, H.-T.; Chang, C.-H.; Chang, K.-B.; Cheng, C.-Y.; Lee, J.-H.; Huang, C.-L.; Yang, M.-Y.; Yang, Y.-C.; Liu, S.-Y.; et al. Improved Delivery Performance of n-Butylidenephthalide-Polyethylene Glycol-Gold Nanoparticles Efficient for Enhanced Anti-Cancer Activity in Brain Tumor. Cells 2022, 11, 2172. https://doi.org/10.3390/cells11142172
Hsing M-T, Hsu H-T, Chang C-H, Chang K-B, Cheng C-Y, Lee J-H, Huang C-L, Yang M-Y, Yang Y-C, Liu S-Y, et al. Improved Delivery Performance of n-Butylidenephthalide-Polyethylene Glycol-Gold Nanoparticles Efficient for Enhanced Anti-Cancer Activity in Brain Tumor. Cells. 2022; 11(14):2172. https://doi.org/10.3390/cells11142172
Chicago/Turabian StyleHsing, Ming-Tai, Hui-Ting Hsu, Chih-Hsuan Chang, Kai-Bo Chang, Chun-Yuan Cheng, Jae-Hwan Lee, Chien-Li Huang, Meng-Yin Yang, Yi-Chin Yang, Szu-Yuan Liu, and et al. 2022. "Improved Delivery Performance of n-Butylidenephthalide-Polyethylene Glycol-Gold Nanoparticles Efficient for Enhanced Anti-Cancer Activity in Brain Tumor" Cells 11, no. 14: 2172. https://doi.org/10.3390/cells11142172
APA StyleHsing, M.-T., Hsu, H.-T., Chang, C.-H., Chang, K.-B., Cheng, C.-Y., Lee, J.-H., Huang, C.-L., Yang, M.-Y., Yang, Y.-C., Liu, S.-Y., Yen, C.-M., Yang, S.-F., & Hung, H.-S. (2022). Improved Delivery Performance of n-Butylidenephthalide-Polyethylene Glycol-Gold Nanoparticles Efficient for Enhanced Anti-Cancer Activity in Brain Tumor. Cells, 11(14), 2172. https://doi.org/10.3390/cells11142172