Article

Claudin-17 Deficiency in Mice Results in Kidney Injury Due to Electrolyte Imbalance and Oxidative Stress

1
Clinical and Experimental Therapeutics, College of Pharmacy, University of Georgia, Augusta, GA 30912, USA
2
Research Division, Charlie Norwood VA Medical Center, Augusta, GA 30912, USA
*
Author to whom correspondence should be addressed.
Cells 2022, 11(11), 1782; https://doi.org/10.3390/cells11111782
Submission received: 25 March 2022 / Revised: 18 May 2022 / Accepted: 24 May 2022 / Published: 29 May 2022
(This article belongs to the Topic Cell Signaling Pathways)

Abstract

:
The multi-gene claudin (CLDN) family of tight junction proteins have isoform-specific roles in blood–tissue barrier regulation. CLDN17, a putative anion pore-forming CLDN based on its structural characterization, is assumed to regulate anion balance across the blood-tissue barriers. However, our knowledge about CLDN17 in physiology and pathology is limited. The current study investigated how Cldn17 deficiency in mice affects blood electrolytes and kidney structure. Cldn17−/− mice revealed no breeding abnormalities, but the newborn pups exhibited delayed growth. Adult Cldn17−/− mice displayed electrolyte imbalance, oxidative stress, and injury to the kidneys. Ingenuity pathway analysis followed by RNA-sequencing revealed hyperactivation of signaling pathways and downregulation of SOD1 expression in kidneys associated with inflammation and reactive oxygen species generation, demonstrating the importance of Cldn17 in the maintenance of electrolytes and reactive oxygen species across the blood-tissue barrier.

1. Introduction

Claudins (CLDNs) are critical tight junction (TJ) proteins involved in the transcellular and paracellular transport coupling [1,2], ion and electrolyte homeostasis, and blood-tissue-barrier maintenance [3,4]. Besides ion selectivity, specific CLDNs are also responsible for cell-cell barrier formation and regulation of vascular permeability [5]. Blood–tissue barriers safeguard organs and control vital physiological processes through highly co-ordinated paracellular and transcellular transport [6]. Whereas injury to the alveolar-capillary unit causes pulmonary edema [7], a similar condition in the kidneys causes renal arterial stenosis [8]. Modulations in CLDN expression in the blood-tissue barrier often result in inflammation [9] and the generation of reactive oxygen species (ROS), and vice versa [10,11]. As a prime example, CLDN4 was upregulated via an ROS-mediated pathway in Madin-Darby canine kidney (MDCK) cells in hyperosmolar conditions [12]. Likewise, other pore-forming CLDNs could also play a role in ROS homeostasis.
A major pathway known to regulate the expression of CLDNs in vascular endothelial cells (ECs) is the Akt signaling pathway [13,14,15,16,17]. The over-expression of VE-cadherin in the adherens junctions (AJs) resulted in increased CLDN5 expression in ECs via activation of Akt, in turn, blocking the suppressive effects of FoxO (Forkhead Box-O)-1/3a and β-catenin [13]. Similarly, treatment with angiopoietin-1 activated Akt to promote CLDN5 expression in human microvascular ECs [14]. Although vascular endothelial growth factor (VEGF), a short-term vascular permeability inducer, promoted its effects via Src activation, it protected the EC-barrier in the long-term via activation of Akt and suppression of FoxO and β-catenin to promote CLDN5 expression [14,15,17]. Our past studies have revealed that Akt1-deficient ECs express significantly reduced levels of several CLDNs such as CLDN3-7, CLDN9, CLDN17, and CLDN19, with the highest decrease observed in CLDN17 [14], suggesting that these CLDNs may likely be primary mediators of blood-tissue barrier regulation.
CLDN17 is widely expressed in the brain and the kidneys [18] and forms a distinct anion-selective channel, which is structurally and functionally different from the paracellular cation channels [19]. Interestingly, it belongs to a class of ‘intron-less genes’ that constitutes ~3% of total human genes [20] that regulate the evolution of tissue-specific functions in mice and have diverse functions [21]. In the kidneys, CLDN17 is predominantly expressed in the proximal segments of the nephron [22]. A recent study reported the downregulation of CLDN17 associated with increased CLDN3 and CLDN8 in bronchial epithelial cells (EpCs) on dexamethasone-induced glucocorticoid activation [23]. It has also been reported that CLDN17 replaces CLDN8 to recruit occludin (OCLN) in human bronchial EpCs [23], suggesting that CLDN17 assumes the role of CLDN8 in tissues where CLDN8 is absent and vice versa, e.g., CLDN8 is abundant in the airways but not in the alveolar EpCs [23], suggesting that CLDN17 may be a primary mediator of the blood-tissue barrier in various organs, including kidneys [24].
As of today, the precise role of CLDN17 in physiology and pathology is unknown, except for some cancer cells in vitro [25,26,27]. Literature on CLDN17 is scarce, and the reagents and tools to study the role of CLDN17 in cell–cell and blood–tissue-barrier regulation are limited. Although a few CLDNs have been studied in vivo employing knockout mouse models, no laboratory, to date, has studied the effects of CLDN17 in a living organism. Hence, in the current study, we generated a Cldn17−/− mouse model on a C57BL/6 background using the CRISPR/Cas9 technology and characterized its phenotype to reveal the significance of the gene concerning electrolyte homeostasis, redox signaling, and inflammation, leading to kidney injury. Our study revealed an important role for Cldn17 in kidney function via the regulation of serum electrolytes and tissue reactive oxygen species levels.

2. Materials and Methods

2.1. Generation and Maintenance of Cldn17−/− Mice

All the mouse-related experiments were performed with the approval of Charlie Norwood Veterans Affairs Medical Center Institutional Animal Care and Use Committee (approval references #19-04-114 and #20-01-118) and followed the ARRIVE guidelines for reporting experiments involving mice. Ketamine and xylazine were administered intraperitoneally in combination for inducing anesthesia. Carbon dioxide asphyxiation followed by cervical dislocation was used for euthanizing undesired mice. To generate knockout mice (Horizon Discovery, Lafayette, LA, USA), ten suitable sgRNAs for CRISPR/Cas9 knockout in C57BL/6 mice zygotes were performed, and the most potent sgRNA with minimal off-target potential was assembled into the ribonucleoprotein complex with Cas9 endonuclease (gRNA Binding/PAM Site 5′→ 3′: TCGGTTTGGTTGGGACGATTGGG; Forward Primer 5′→ 3′: AGAAGACCAGGCACTCCTCT and Reverse Primer 5′→ 3′: TCATGCCGCAGATGCCAATA for genotyping). These were delivered into zygotes from C57BL/6 mice followed by embryo transfer into pseudo-pregnant females. Genomic PCR and DNA sequencing analyzed viable progenies for the presence of the desired mutation. Each small guide RNA was validated by transfection into cultured cells and assessed cutting efficiency by the Surveyor Cel 1 Mutation Detection assay. The two smaller cleavage bands added up to the size of the parental band. The ratio of the intensity of the cleavage bands relative to the parental band was used to assess cutting efficiency. Up to two selected transgenic founder mice were bred with C57BL/6 mice to produce F1 progeny heterozygous for the Cldn17−/−, as confirmed by the PCR-mediated genotyping and DNA sequencing analysis. Off-target analysis and on-target sequence confirmation in F1 mice were also performed, which consisted of PCR and sequencing of the top 10 predicted off-target sites. Cldn17+/– mice were eventually bred to obtain homozygous Cldn17−/− mice used in the study. A detailed genotyping protocol is provided in Supplementary Figure S7. Due to the size and growth-state differences in the young mice, all experiments were performed on 8–12-week-old mice.

2.2. RNA Isolation, cDNA Preparation, and qRT-PCR

Mice lungs were collected, RNA was extracted using an RNA isolation kit (RNeasy Plus, Qiagen, Valencia, CA, USA), and RNA quality was confirmed using a Nanodrop 2000 spectrophotometer (Thermo Scientific, Waltham, MA, USA). Complementary DNA (cDNA) was synthesized from 700 ng of RNA using RT2 First Strand kit (Qiagen) using a StepOne Plus thermal cycler and detection software (Applied Biosystems, Foster City, CA, USA), and quantitative real-time PCR (qRT-PCR) was performed using the RT2 SYBR Green ROX qPCR Mastermix (Qiagen, Hilden, Germany) in real-time PCR equipment (Applied Biosystems, Troy, NY, USA). Sample cDNA was amplified and quantified over many shorter cycles under the following conditions: an initial 10 min 95 °C period followed by 45 cycles of 95 °C for 15 s, 60 °C for 1 min, and 72 °C for 15 s. The threshold cycle (Ct) was determined using the exponential growth phase and the baseline signal from fluorescence vs. cycle number plots. The mouse primers used for the messenger RNA (mRNA) analysis of Cldn17 were 5′-tctccctccggtactggaag-3’ (forward) and 5′-gctcctccaagttctcgc tt-3’ (reverse) and the primers for β-actin, used as a house-keeping control gene, were 5′-tttgagaccttcaacacccc -3’ (forward) and 5′-atagctcttctccagggagg -3’ (reverse). The list of primers used for the expression analysis of Cldn isoforms [28] in the mouse kidneys is listed in Supplementary Table S3.

2.3. Western Blot Analysis

It was performed as described in previously published studies [29,30]. Western analysis was performed on the cell lysates prepared using 1X RIPA lysis buffer (Millipore, Temecula, CA, USA) supplemented with protease and phosphatase inhibitor tablets (Roche Applied Science, Indianapolis, IN, USA). The DC protein assay reagent was used for protein estimation in the lysates (Bio-Rad Laboratories, Hercules, CA, USA). Approximately 30–40 μg of heat-denatured cell lysates prepared in Laemmli buffer were loaded onto the SDS-PAGE gels. Densitometry was performed using the NIH ImageJ software. Antibodies used include Cldn17 from Abcam, Waltham, MA, USA (ab23333) and LSBio, Seattle, WA (LS-C3063), SOD1 (2770S, Cell Signaling Technology, Danvers, MA, USA), and β-actin (A5441, Sigma, St. Louis, MO, USA).

2.4. Analysis of Serum Electrolytes and Urine Parameters

WT and Cldn17−/− mice were subjected to retro-orbital puncture to collect around 800 to 1000 µL of blood. A part of the collected volume was used for a complete blood count. The rest was processed for the analysis of serum electrolytes and protein levels. The ion-specific electrode (ISE) method was used to assess serum sodium, potassium, and chloride levels. Urine was collected from WT and Cldn17−/− mice using metabolic cages to determine various parameters, including pH, EpCs, blood cells, and others.

2.5. Kidney Injury and Wet/Dry Ratio Analysis

Age- and gender-matched WT and Cldn17−/− mice were euthanized to collect their kidneys, then processed for histological examination and determination of tissue edema. Kidneys were fixed in 4% paraformaldehyde, and 10 μm thick sections were processed for H&E staining. Histological assessment of these slides was performed by examination of tissue fields by blinded reviewers based on scoring from 1 to 5, with one being the best and five being the worst (severe most injury), and averages of these scores were considered for statistical analysis. Mineralization, vacuolar degeneration, and Bowman’s capsule spacing were taken into consideration for kidney scoring. The kidneys and fecal pellets were weighed when fresh, followed by incubation in an oven for 72 h on sterile papers at 80 °C to remove all moisture content. The dry weights were then recorded to calculate the wet/dry ratios, which determine edema or fluid content. The fecal water content (%) was determined using the formula, (Average wet weight − verage dry weight) × 100/(Average wet weight + Average dry weight).

2.6. Genomics Data Co-Expression Analyses

Gene expression omnibus (GEO), a public functional genomics data repository (https://www.ncbi.nlm.nih.gov/gds last accessed on 15 May 2022), was used to study the co-expression regulation of CLDN17 with other potential genes (including all CLDNs) that were identified by a separate literature search to play a substantial role in association with our gene of interest, which is CLDN17. A series of GEO datasets (GDS5453, GDS3510, GDS3941, GDS3568, GDS2750, GDS3489, GDS5383, GDS4302, GDS3177, GDS5040, GDS5279) were analyzed for expression of CLDN17 and the identified genes. The trend in expression change upon intervention was recorded as high (upregulated), low (downregulated), or mixed (both upregulated and downregulated) irrespective of the statistical significance. These trends of the identified genes were then compared with the expression change in CLDN17 to record the extent of the similarity.

2.7. RNA-Seq and Bioinformatics Analysis

Kidneys were isolated from WT and Cldn17−/− mice and stored in Trizol® before freeze-drying. Samples were then subjected to RNA isolation, and total RNA purity and concentration were evaluated by spectrophotometry using NanoDrop ND-1000 (Fisher Scientific, Hampton, NH, USA). Total RNA quality was assessed using the Agilent 2100 bioanalyzer (Agilent Technologies, Santa Clara, CA, USA) and assured of an RNA Integrity Number (RIN) greater than 5. Total RNA samples were processed for cDNA library preparations using TruSeq Stranded Total RNA kit (Illumina, San Diego, CA, USA), which depletes cytoplasmic ribosomal RNA. Briefly, 800 ng of total RNA was treated with an rRNA Removal Mix to deplete rRNA. Following purification, the RNA was fragmented into small segments, 200–300 bp in size, and converted to cDNA fragments. These cDNA fragments then had the addition of a single ‘A’ base and subsequent ligation of the adapter. The products were purified and enriched with PCR to create the final cDNA library. The prepared library was examined by a bioanalyzer and Qubit (Fisher Scientific, Hampton, NH, USA) to test library quality and quantity, respectively. The libraries were pooled and run on the NextSeq500 sequencing system using a 75-cycle paired-end protocol. BCL files generated by the NextSeq500 were converted to FASTQ files for downstream analysis. Reads which passed the quality control were aligned to the reference genome, starting with the STAR aligner. The generated BAM files in a comparative setup were imported to the following Cufflinks and Cuffdiff tools from Tuxedo Suite for outputting differentially expressed genes with log2-fold changes and q values having replicates. Genes with p-values of less than 0.05 were taken into consideration for bioinformatics analysis which was performed using gene set enrichment analysis (GSEA) and gene ontology (GO). R programming was utilized to generate graphs, including the volcano plot for the modulated genes, and the Panther database was used to identify signaling pathways based on significantly altered genes.

2.8. Ingenuity Pathway Analysis (IPA)

IPA database (Qiagen Bioinformatics, Toronto, Canada) transforms a list of genes into a set of relevant networks associated with pathology based on extensive records maintained in the Ingenuity Pathways Knowledge Base [31]. Highly interconnected networks are predicted to represent a significant biological function. Only those genes that were directly affected by the pathway of interest and Cldn17 are shown.

2.9. ROS Analysis

Production of ROS was estimated in WT and Cldn17−/− mice with dihydroethidium (DHE) staining on kidney sections frozen using optimal cutting temperature compound as described in a previous study [32]. Stained images were then captured on confocal microscopy and subjected to fluorescence quantification using ImageJ software.

2.10. Analysis of Growth Hormone Expression

Growth hormone level was determined in the WT and Cldn17−/− mice using an ELISA kit from Novus Biologicals, Littleton, CO (NBP3-08143) according to the instructions provided by the manufacturer. Liver samples in PBS were used for the detection of growth hormone from pups and adult mice.

2.11. Statistical Analysis

Data are presented as mean ± s.d. or mean ± s.e.m. The ‘n’ value for each figure implies the number of samples in each group which was determined by power analysis. All the data were analyzed by parametric testing using the Student’s unpaired t-test or one-way ANOVA using the GraphPad Prism 6.01 software. The Chi-square test was also used wherever applicable. Data with p < 0.05 were considered significant.

3. Results

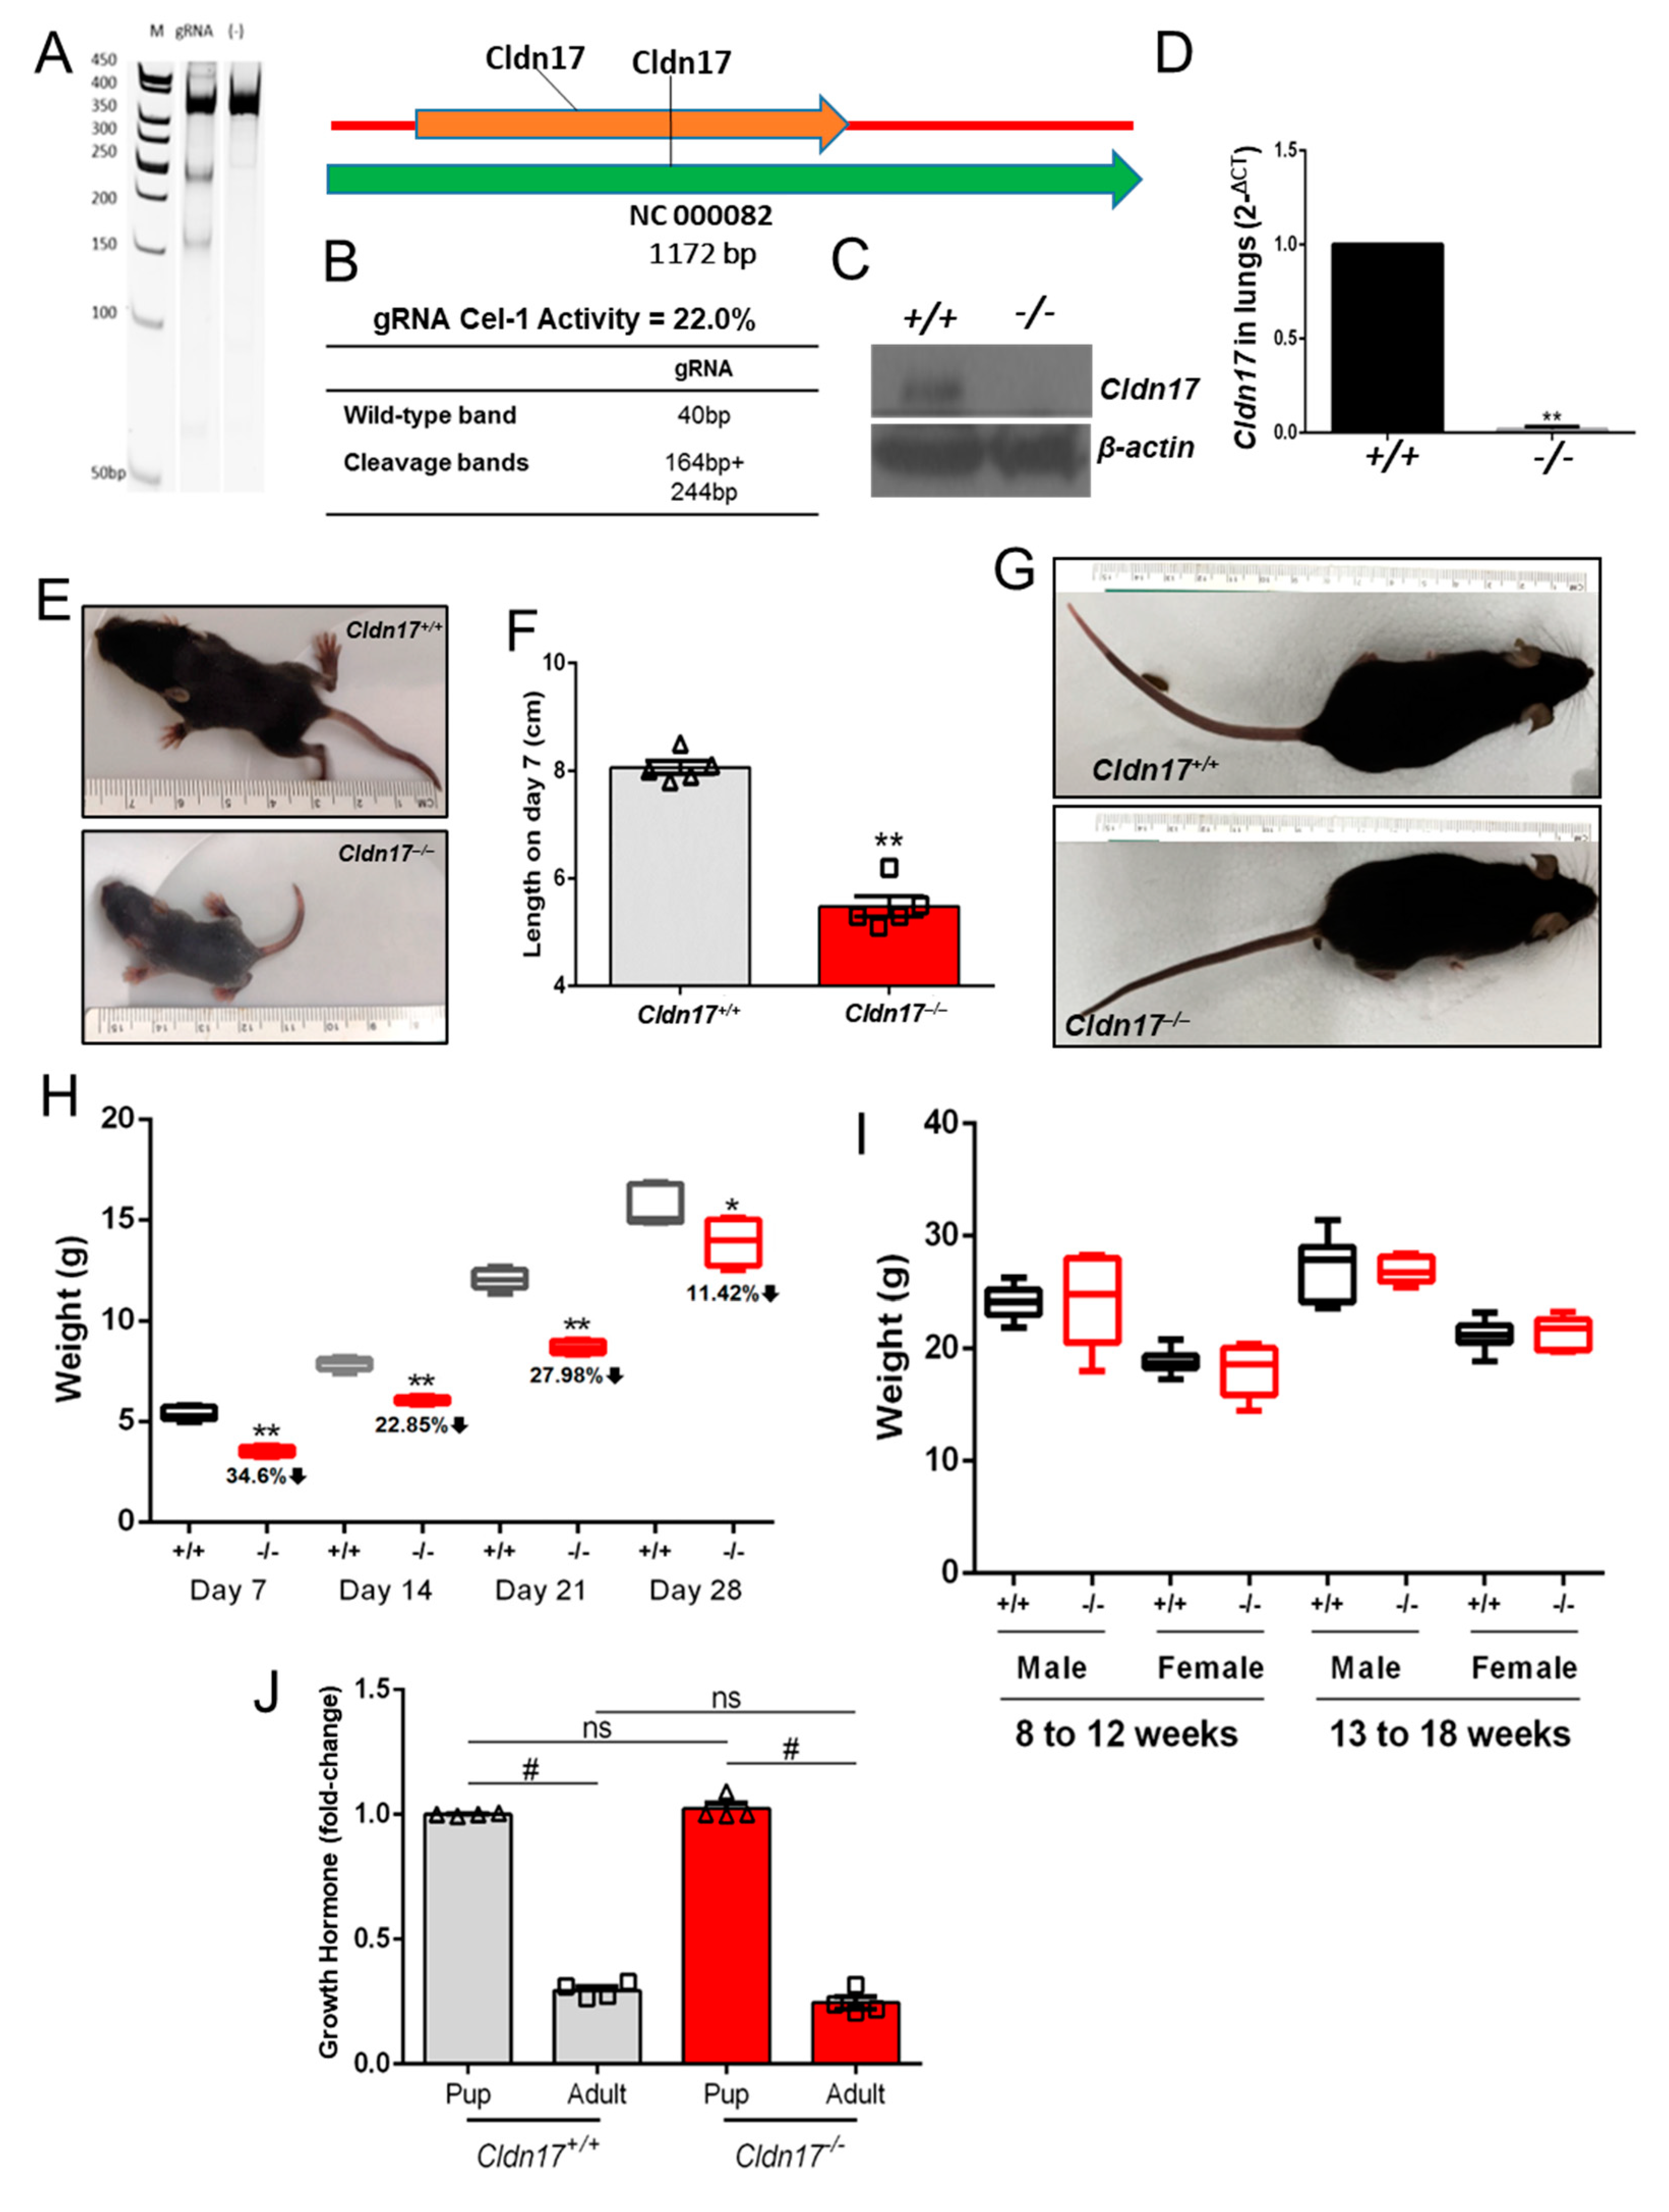
3.1. Cldn17−/− Mice Exhibit Delayed Growth

Cldn17−/− mice generated using the CRISPR/Cas9 technology were genotyped and further confirmed for gene loss by cell validation assay (Figure 1A,B), Western, and mRNA analysis in the kidney and the lung (Figure 1C,D). No breeding abnormalities were detected in the newly generated mice. To ascertain if Cldn17 loss influences the growth of these mice, we recorded lengths and weights of the Cldn17−/− mice along with age- and gender-matched wild-type (WT) controls at various stages. Remarkably, Cldn17−/− mice appeared smaller than the WT controls on day 7 (Figure 1E), and the length measurements revealed a significant size reduction in mice lacking Cldn17 (Figure 1F). Although the Cldn17−/− mice demonstrated a significant reduction in size also when measured at weeks 2 to 4, there was a gradual decline in the difference, and the Cldn17−/− mice reached parity with the WT at a later stage (Figure 1G), which was quantified by weights in the age range of 8 to 18 weeks involving both genders (Figure 1H,I). We also assessed the levels of growth hormones in the WT and the Cldn17−/− mice to determine if Cldn17 has any control over this hormone. Liver lysates from both groups at early and late stages were subjected to ELISA to determine the levels of growth hormones. Although there was an expected reduction in the growth hormone level in the adult stage mice compared to the early-stage pups, no significant difference was observed between the WT and the Cldn17−/− mice (Figure 1J). Collectively, these findings signify that Cldn17 plays a role in the overall growth of mice, at least in early life, however with no significant effect on growth hormone production.

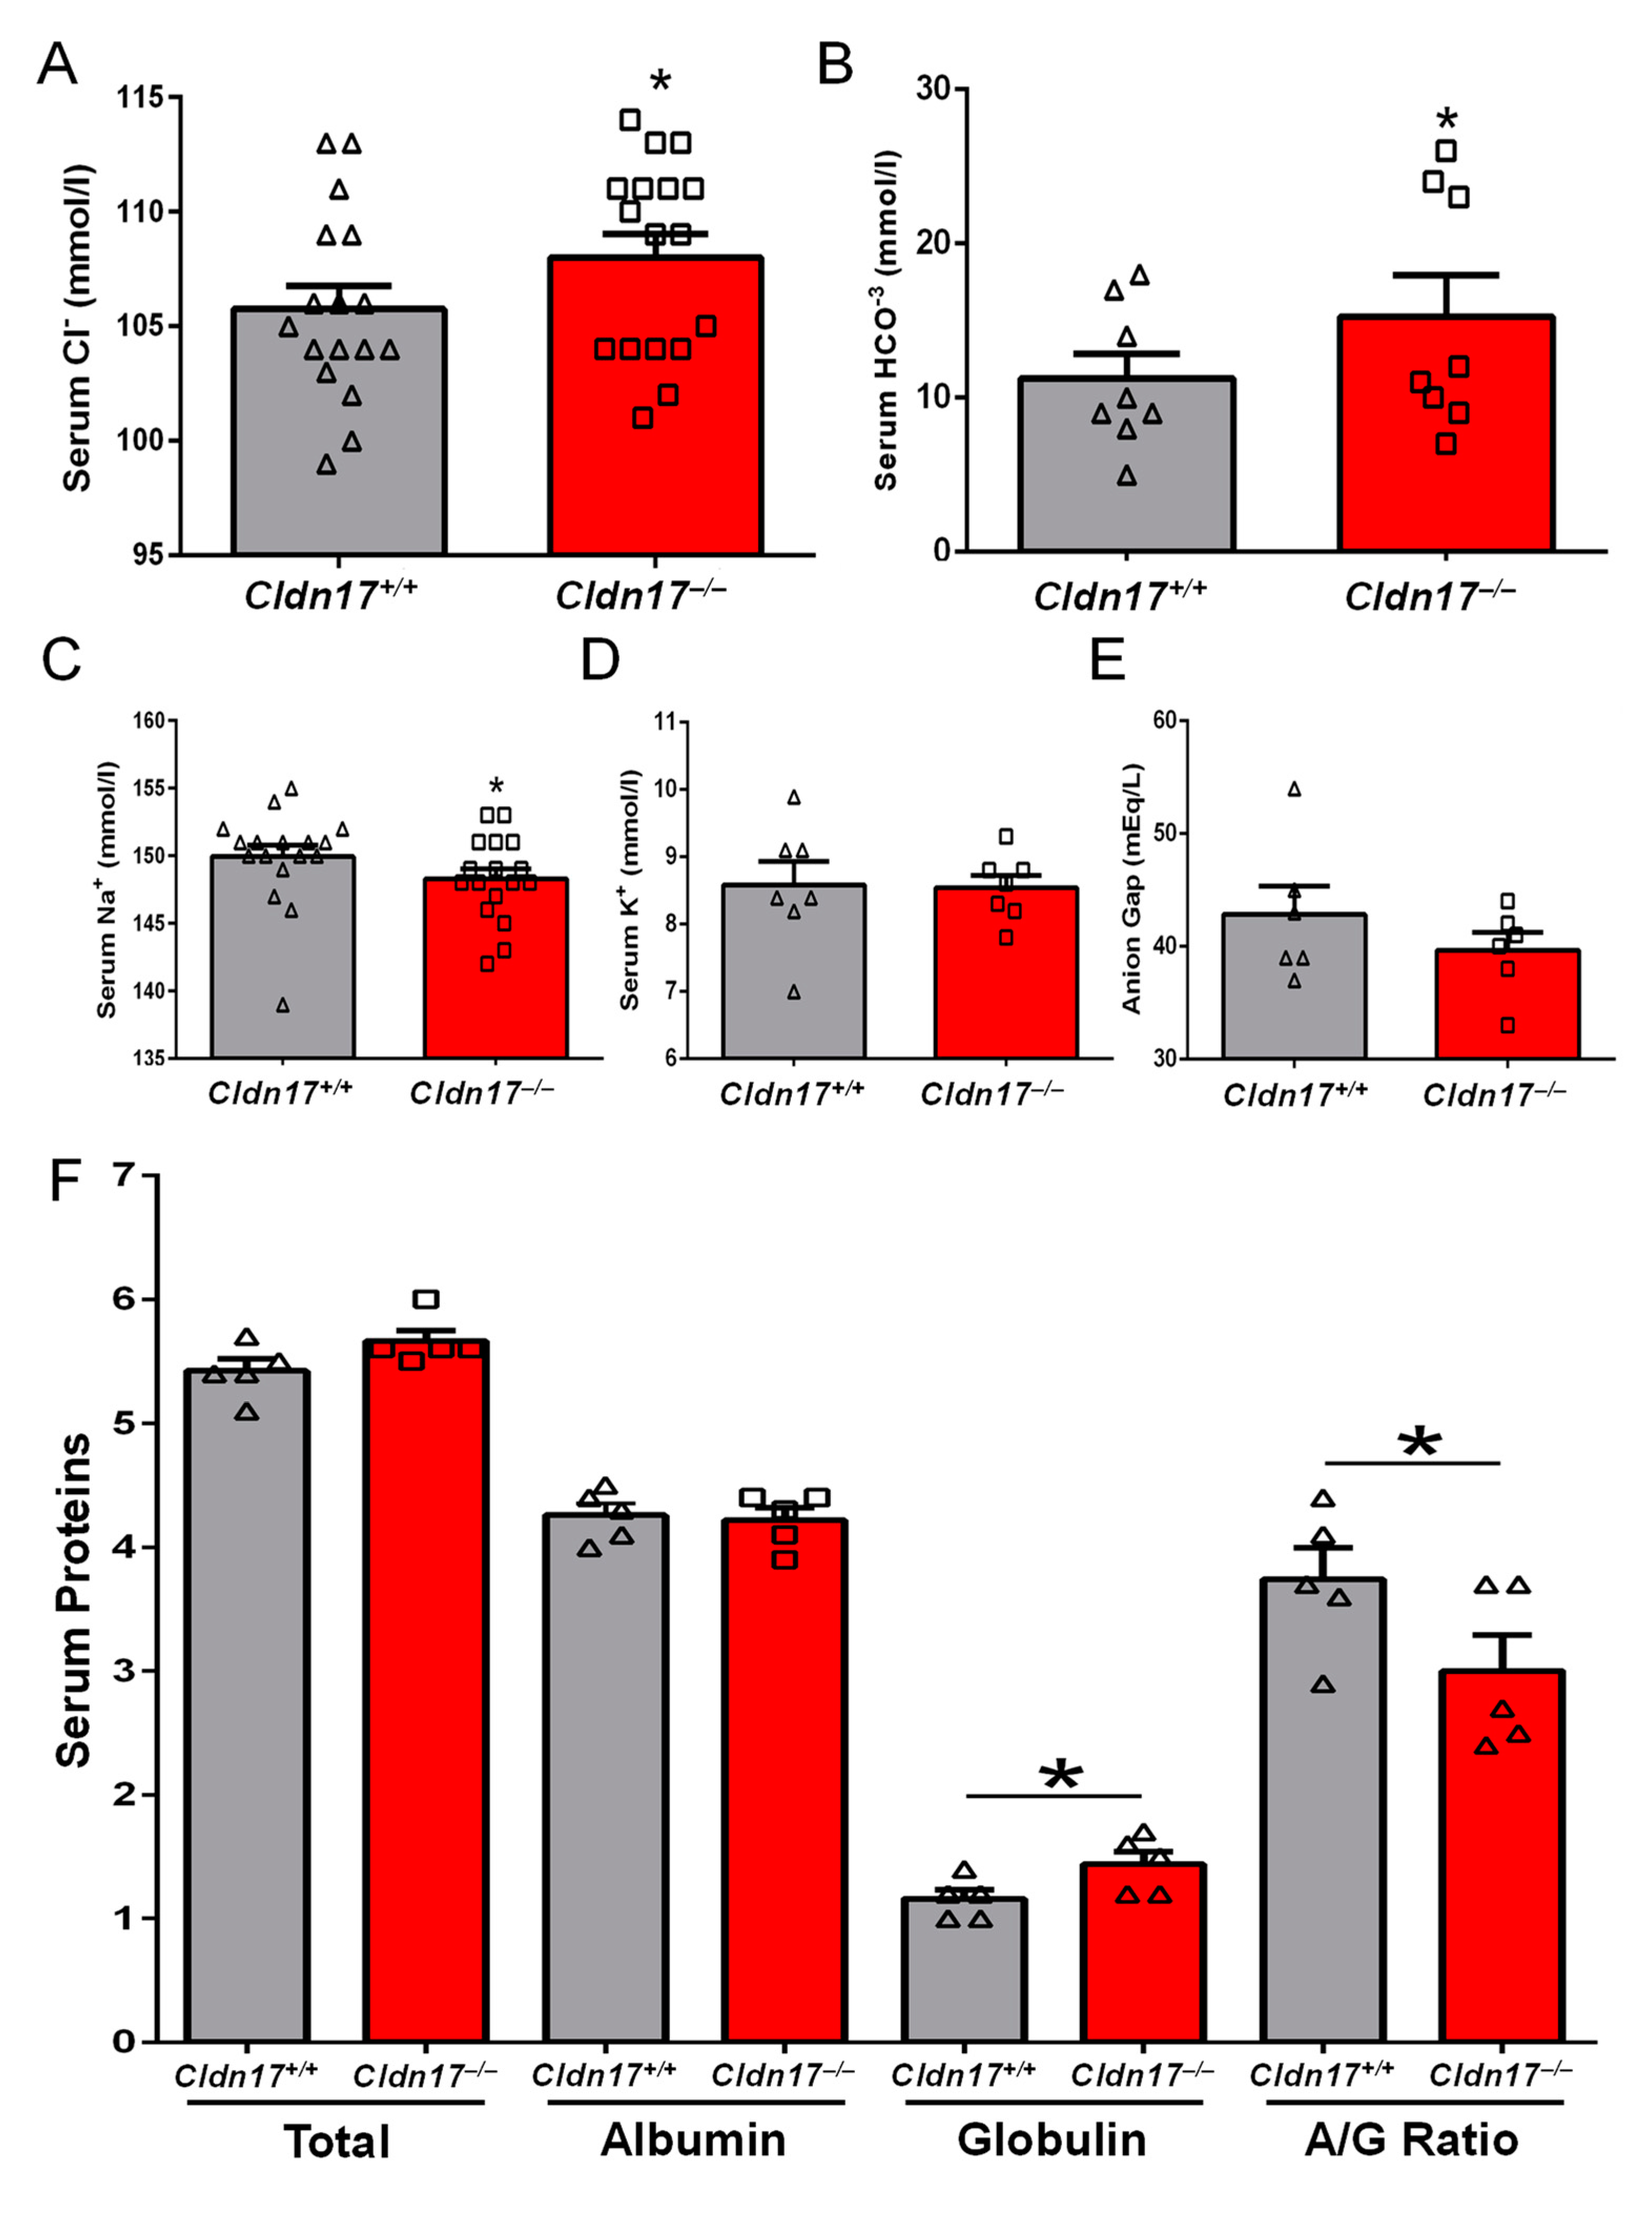
3.2. Impact of Cldn17 Loss on Blood and Urine Parameters

Since Cldn17 is a putative anionic pore-forming CLDN with a plausible role in ion homeostasis, we decided to analyze the levels of various electrolytes in serum samples obtained from WT and Cldn17−/− mice. Blood was collected through retro-orbital puncture before it was processed into serum and analyzed at the University of Georgia veterinary diagnostic laboratory. As anticipated, serum electrolytes were found to be altered in the Cldn17−/− mice with significantly elevated negatively charged chloride and bicarbonates (Figure 2A,B) and reduced levels of positively charged ions in the Cldn17−/− mice compared to WT (Figure 2C,D). A reduction in the anion gap was also observed in Cldn17−/− mice though the difference was not statistically significant (Figure 2E). In addition to the electrolytes, modulation in serum proteins was assessed in the absence of Cldn17. While total protein and albumin levels were unaltered in Cldn17−/− mice, total globulin and the albumin to globulin ratio were significantly reduced (Figure 2F). These results signify the vital role of Cldn17 in ion and protein homeostasis in the blood.
Anticipating similar alterations in the urine, we collected urine from WT and Cldn17−/− mice using metabolic chambers for analysis. Interestingly, rare WBCs (white blood cells) presence in WT mice, considered normal, were significantly reduced in the Cldn17−/− mouse urine. Surprisingly, all other urine parameters such as the pH, specific gravity, color, bilirubin, bacteria, turbidity, and crystals showed no significant difference between WT and Cldn17−/− mice (Supplementary Figure S1).

3.3. Cldn17−/− Mice Exhibit Hypophagia and Polydipsia

Given the retarded early growth in the absence of the Cldn17 gene, we anticipated alterations in the food consumption in the genetically modified mice. We observed a significant reduction in the food consumption in Cldn17−/− mice against the control (Supplementary Figure S2A). Since Cldn17 is a TJ protein expressed in the proximal tubule responsible for water reabsorption in the kidneys, we also determined water intake, which revealed significantly increased water consumption by Cldn17−/− mice compared to the WT (Supplementary Figure S2B). Analysis of fecal pellets revealed a significant reduction in the number of pellets excreted over 24 h by Cldn17−/− mice compared to the WT group (Supplementary Figure S2C). Wet/dry ratio analysis of these fecal pellets was also performed, which revealed a significantly lower moisture content in the fecal pellets collected from mice lacking Cldn17 (Supplementary Figure S2D,E), signifying constipation-like effects in Cldn17−/− mice.

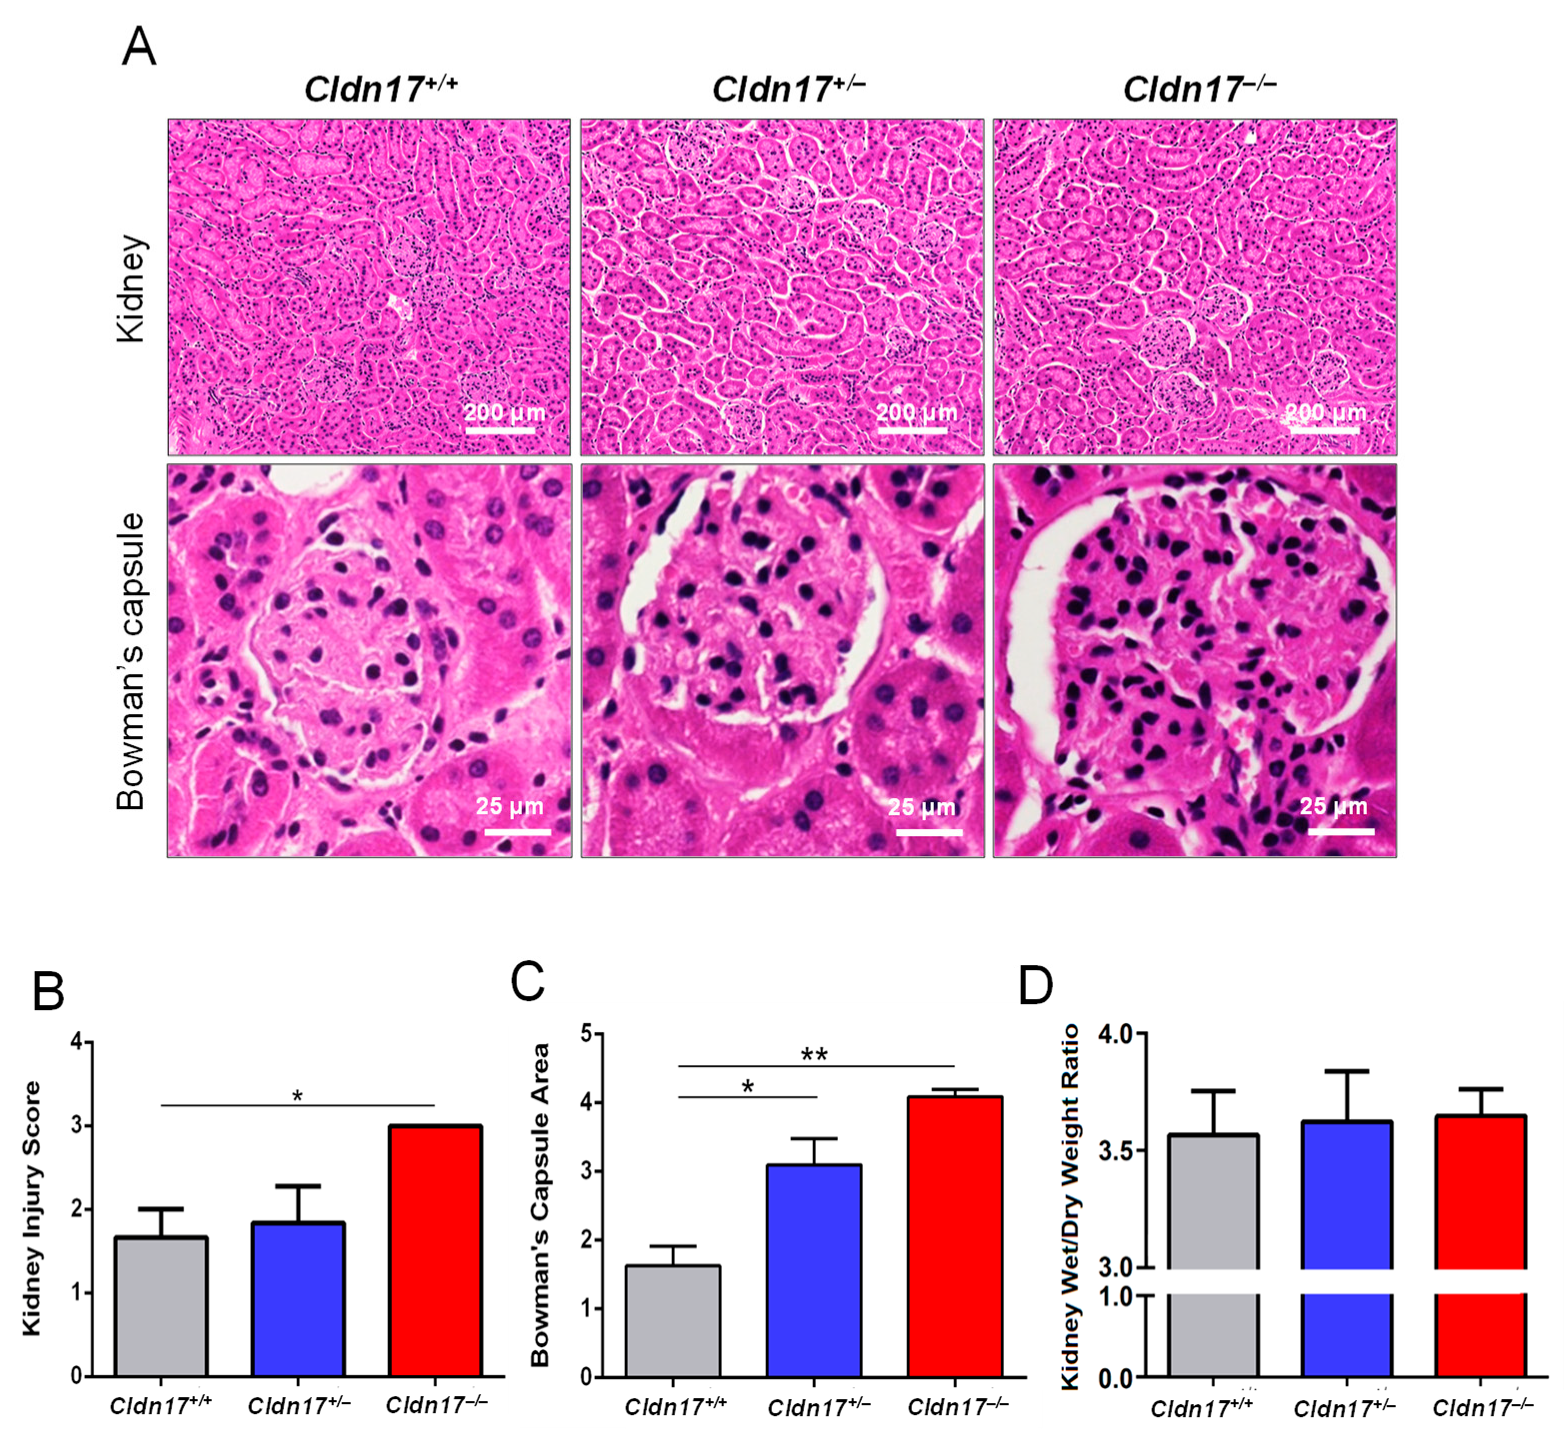
3.4. Cldn17−/− Mice Display Kidney Injury

Age, gender, and weight-matched WT, Cldn17+/−, and Cldn17−/− mice were euthanized, and their kidneys were collected, sectioned, and subjected to H&E staining. Since Cldn17 is expressed in the kidneys, a potential role of Cldn17 in kidney function is expected. As anticipated, there was increased injury in the Cldn17+/− and Cldn17−/− mouse kidneys compared to WT, characterized by vacuolar degeneration, mineralization, and increased Bowman’s capsule spacing (Figure 3A). Kidney injury scoring was performed by blinded reviewers on a scale of 1–5 revealed a higher injury in the Cldn17−/− mice compared to WT.
(Figure 3B and Supplementary Figure S3A,B). Further, ImageJ software quantification of the area of Bowman’s capsule revealed significantly enlarged capsule size in Cldn17−/− mice compared to WT (Figure 3C). Wet/dry ratio analysis assessed renal edema which showed no significant difference between the two groups (Figure 3D and Supplementary Figure S3A–C). Although Cldn17 is highly expressed in the keratinocytes [33] and hepatocytes [26], we did not observe any abnormalities in the histological examinations of skin and liver sections from Cldn17+/+ and Cldn17−/− mice (Supplementary Figure S4).

3.5. Cldn17 Loss Affects the Expression of other Cldns in Mouse Kidneys

Quantitative RT-PCR analysis of mouse kidneys revealed a significant upregulation of Cldn-2, -3, -13, -14, and -18 (Figure 4A). Interestingly, a downregulation in the expression of Cldn-7, -10, and -20 was also observed (Figure 4A). Although not significant, the highest increase in expression (likely due to high variability between the samples) was observed in Cldn-4-15, and -19, all of which are cation pore-forming Cldns.

3.6. CLDN17 Co-Expression with Other Genes in Physiology and Pathology

Among all CLDNs, expression of CLDN-6, -18, -4, and -8 demonstrated a higher (<75%) resemblance to CLDN17 trends upon intervention (Figure 4B). Apart from the CLDN family, a few genes revealed higher similarity with CLDN17 including the ETS-related gene (ERG) with 100% resemblance. Interestingly, the suppressor of cytokine signaling (SOCS6) and grainy head-like transcription factor-1 (GRHL1) demonstrated CLDN17-like in 90% of interventions (Figure 4C).

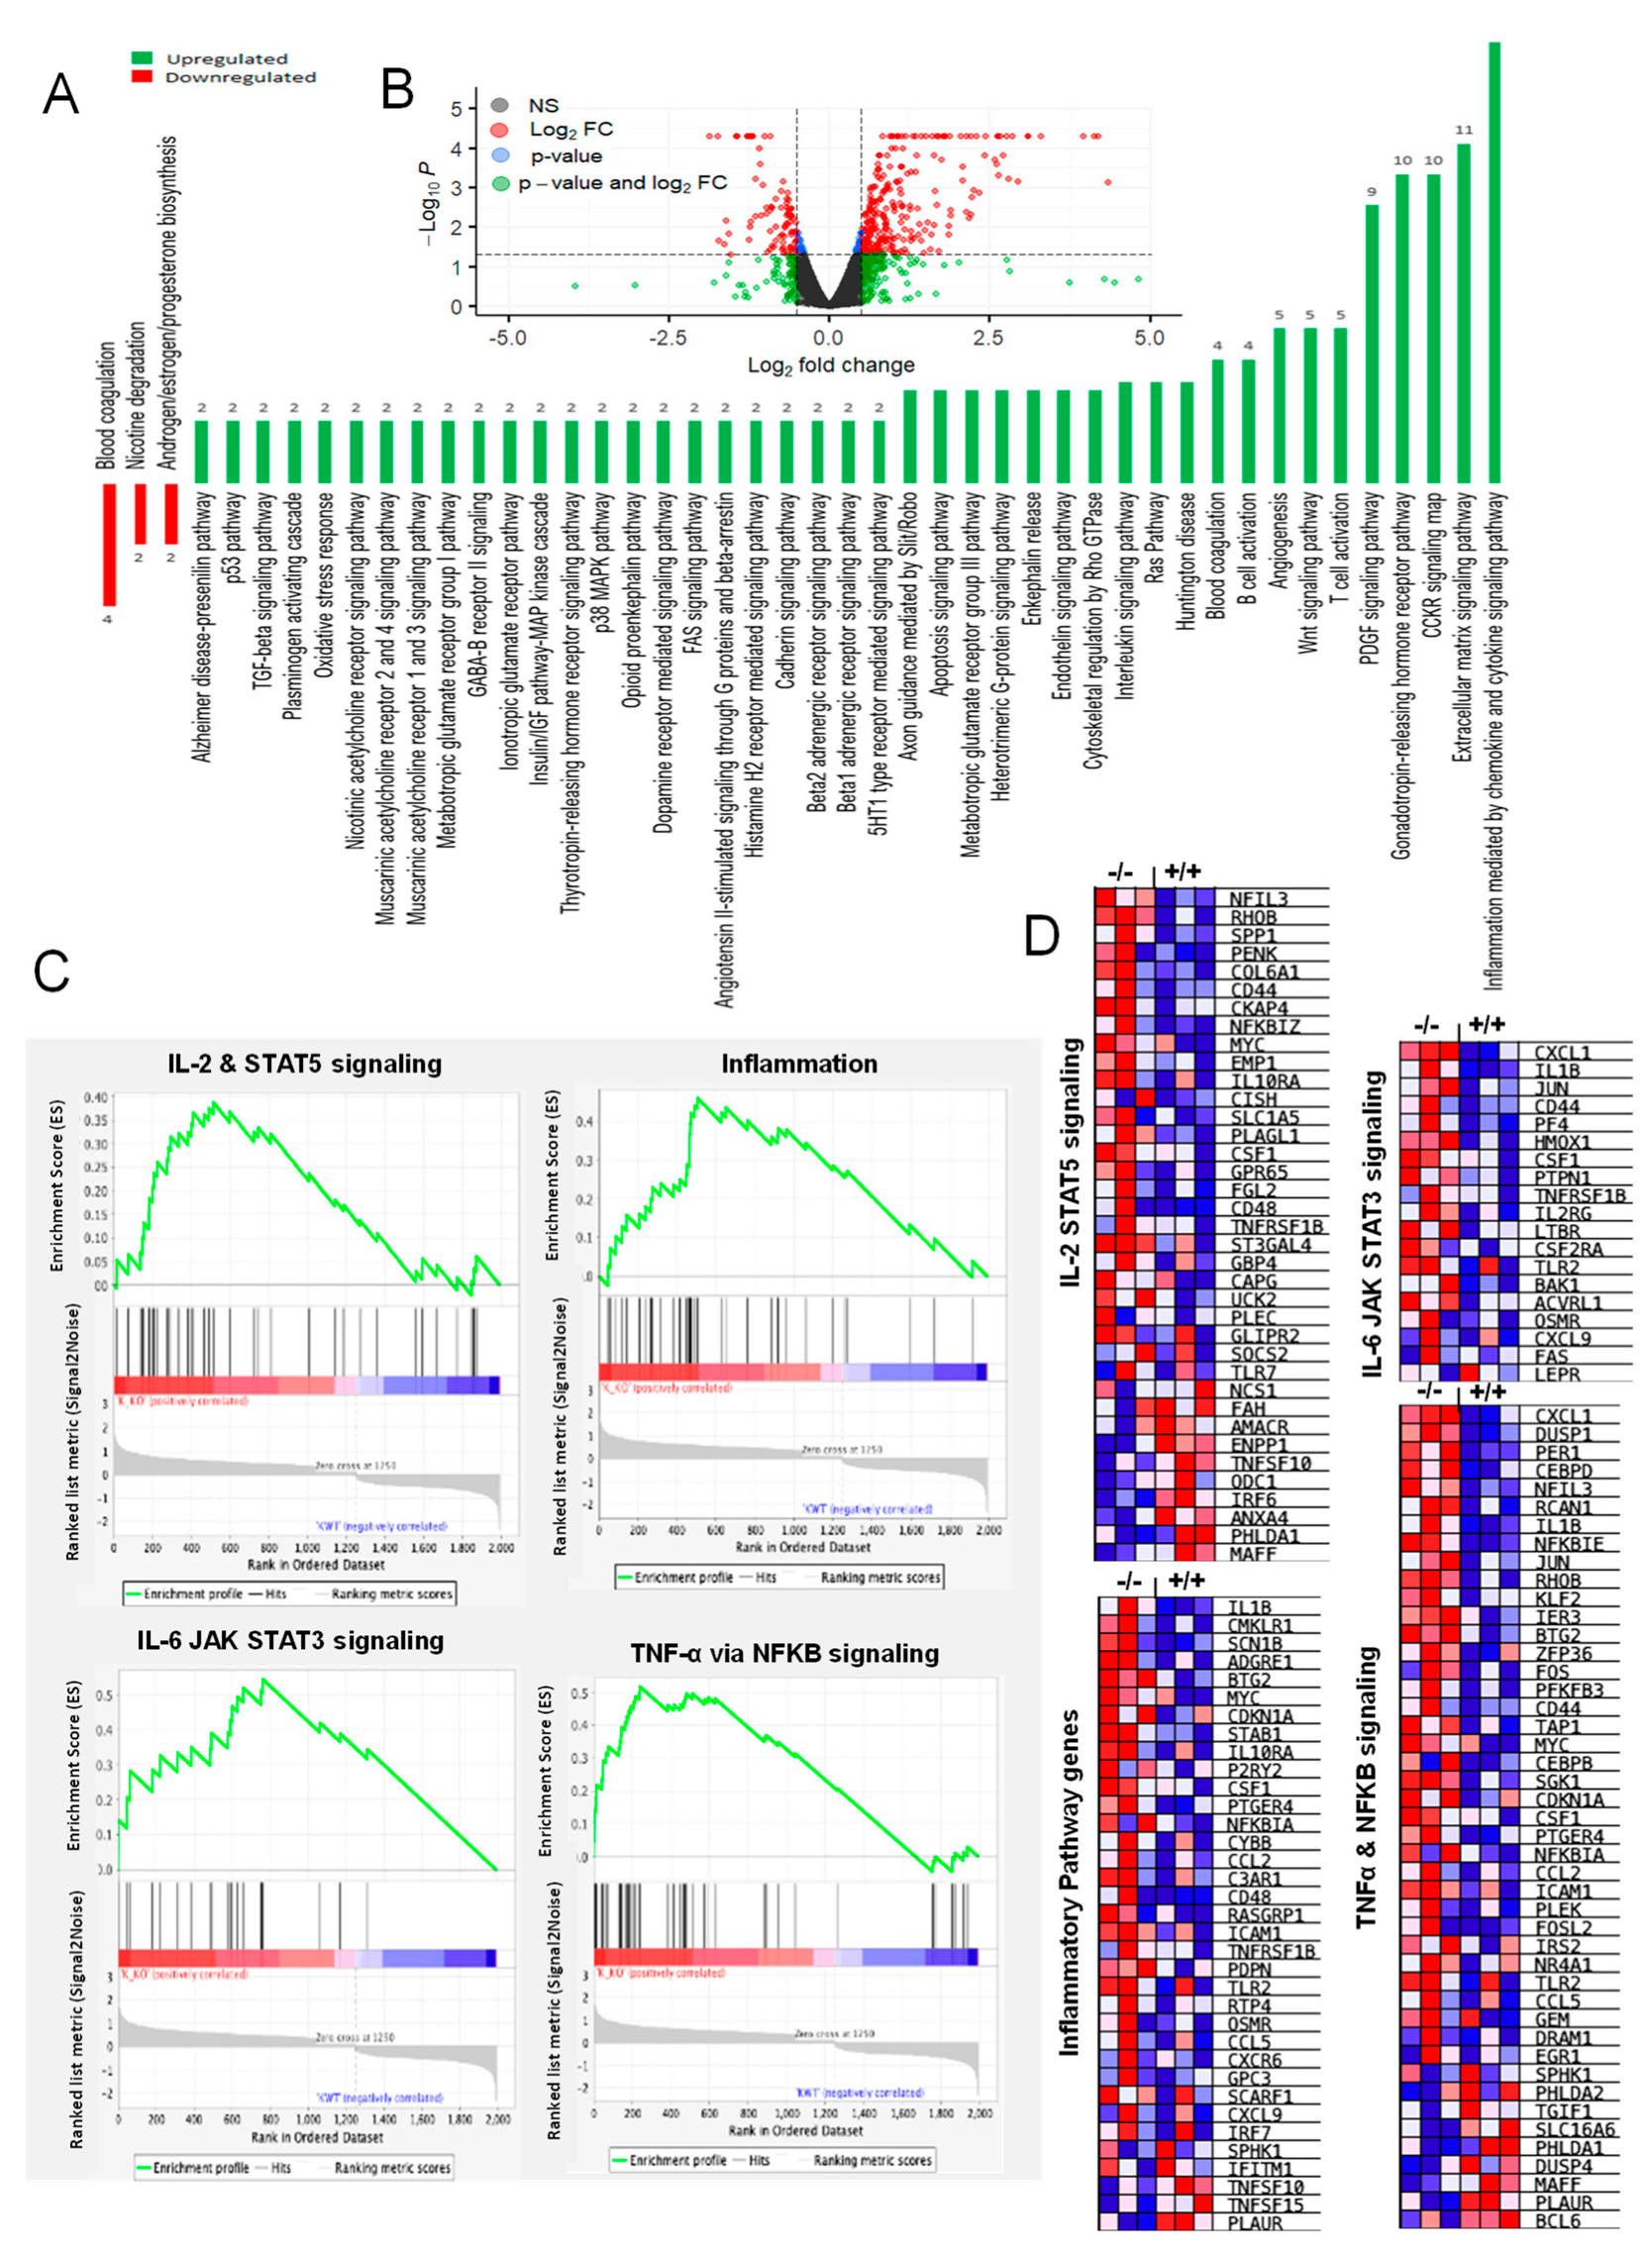
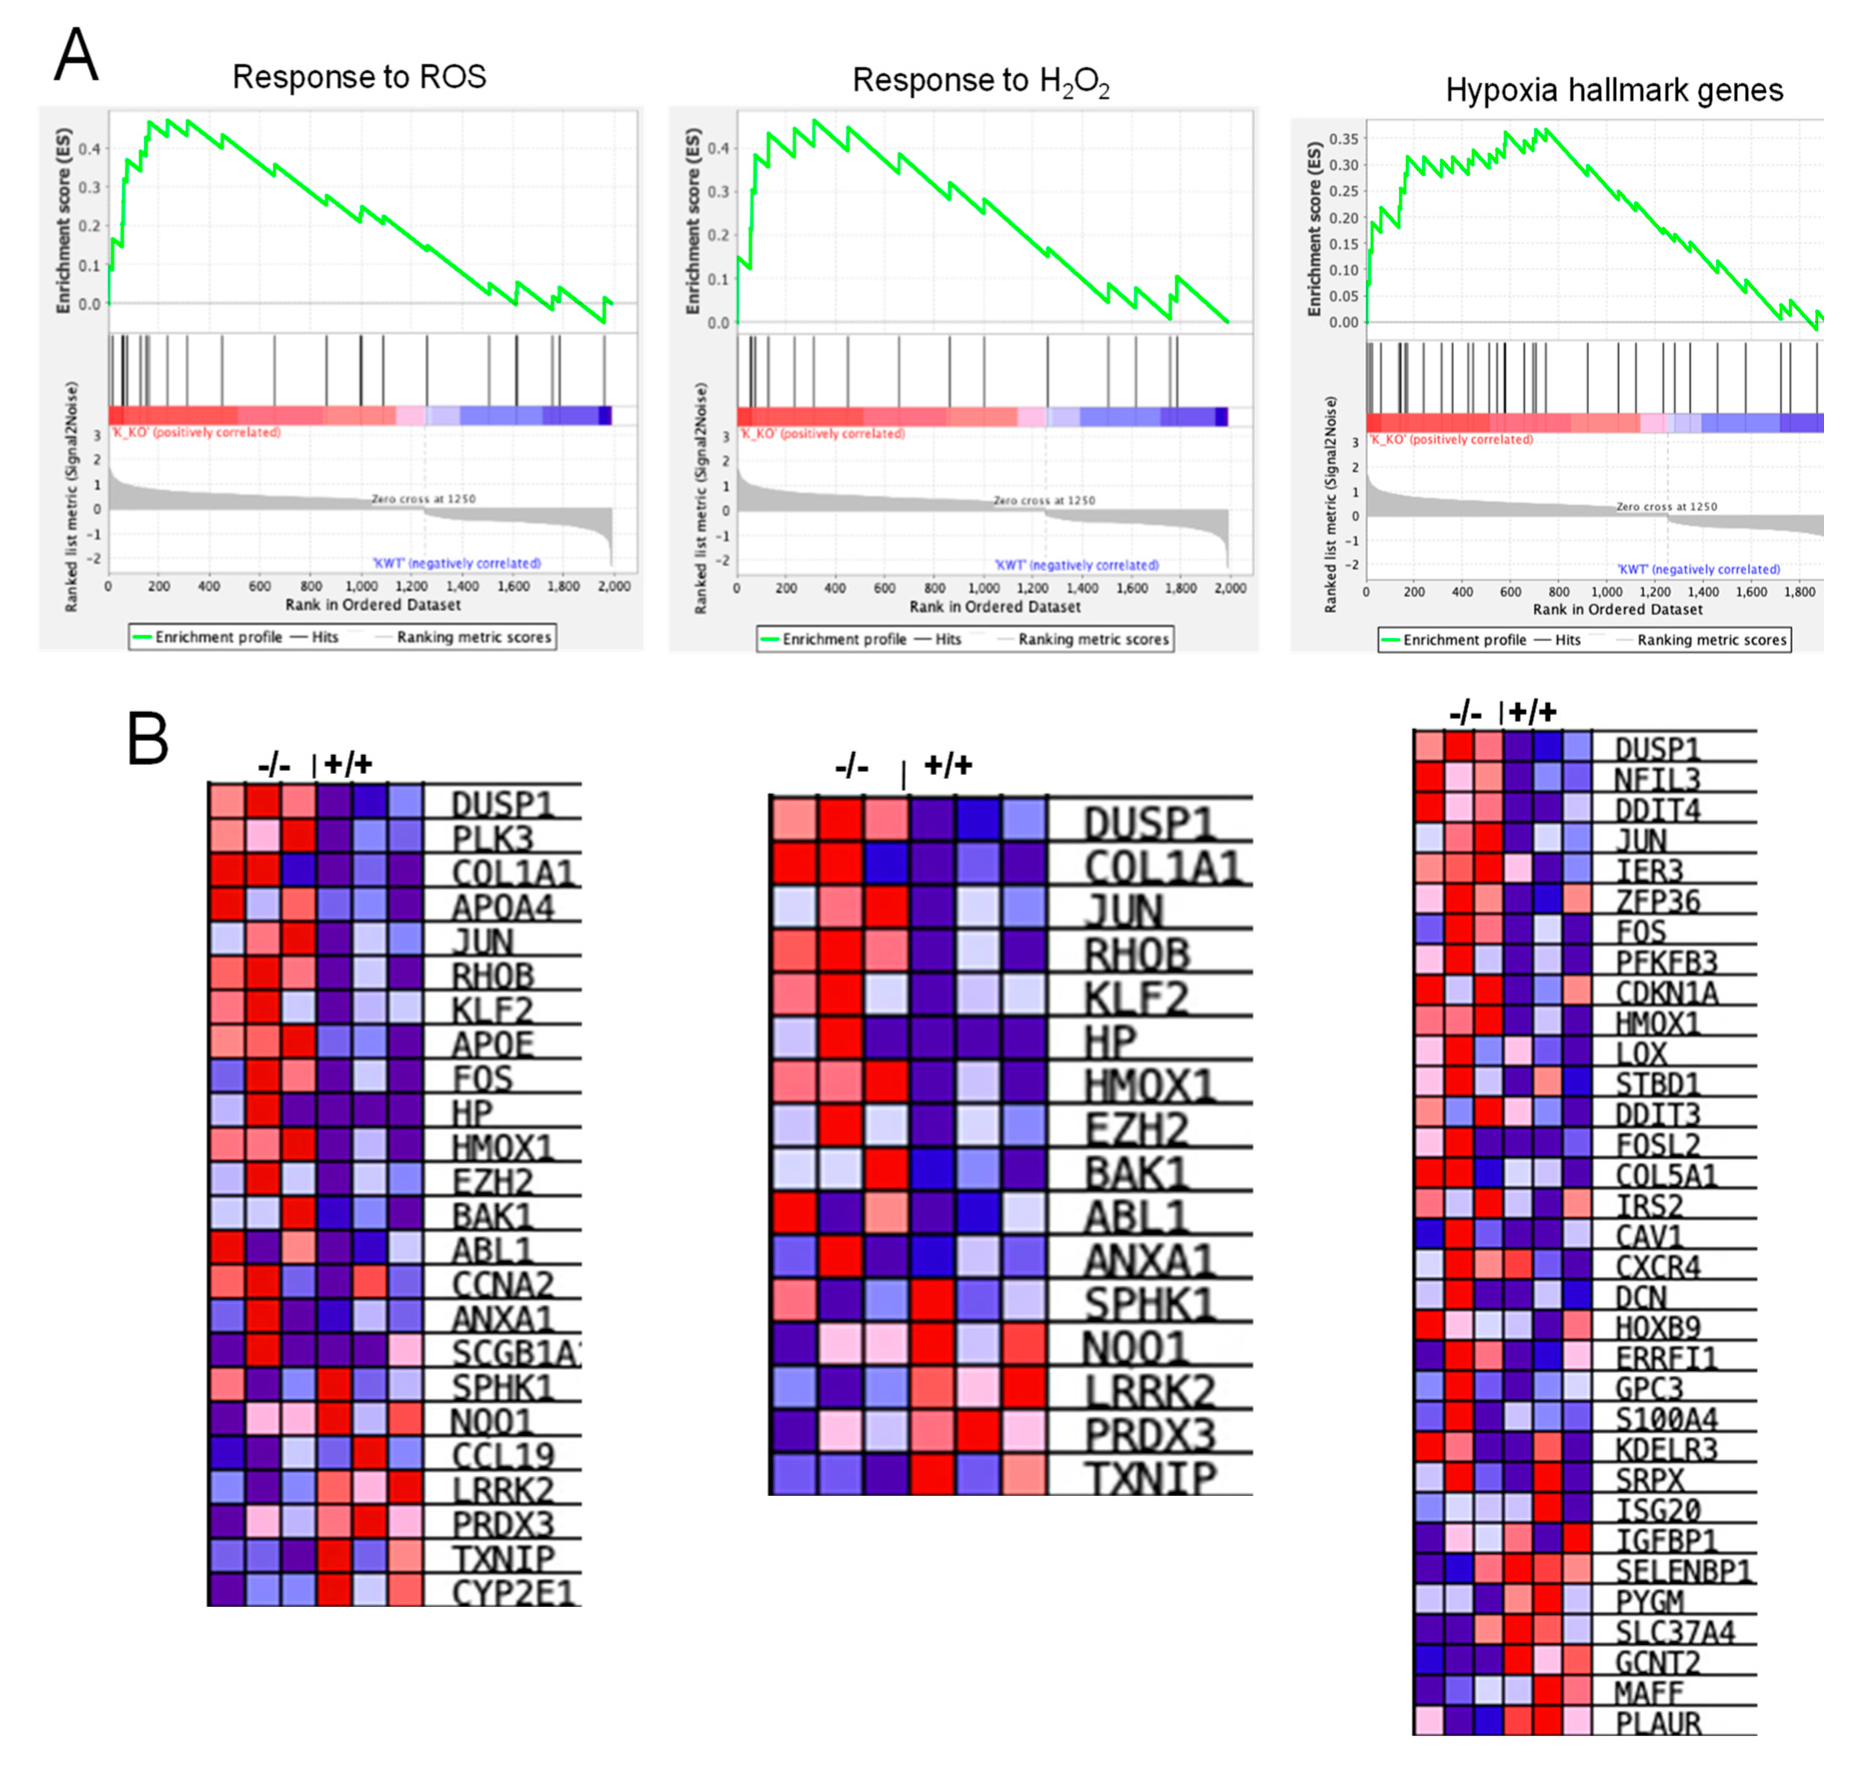
3.7. RNA-Seq Analysis Revealed Alterations in Genes Involved in Inflammation, Hypoxia, and ROS Generation

A series of intriguing observations from the Cldn17−/− mice prompted us to perform RNA-seq analysis of their kidneys. Analysis of 12,031 genes in WT and Cldn17−/− mouse kidneys revealed significant changes in 424 genes, with 295 upregulations and 119 downregulations in gene expression in the Cldn17−/− group compared to WT (Figure 5, Supplementary Figure S5). Interestingly, Cldn17−/− kidneys had de novo expression of ten genes that are not expressed in the WT kidneys.
Next, we identified the most deregulated signaling pathways using the Panther database (Figure 5A,B). The top three downregulated pathways were associated with coagulation, nicotine degradation, and androgen/estrogen/progesterone biosynthesis-related signaling. In contrast, upregulated genes were linked to inflammation, integrins (cell adhesion and migration), angiogenesis, lipid metabolism, and gonadotropin hormone receptor signaling. In the next step, RNA-seq data were subjected to gene ontology (GO) and gene set enrichment analysis (GSEA) analyses based on genes modulated more than two-fold. From the highly influenced signaling pathways, we identified some pathways of interest based on our study objectives. Interestingly, inflammatory pathways, including TNFα and IL-related signaling, were enhanced in the Cldn17−/− mice compared to WT (Figure 5C). Furthermore, we observed modulations in the expression of genes regulating the response to reactive oxygen species, H2O2, and hypoxia (Figure 6A,B).

3.8. Cldn17 Loss Did Not Affect the Expression of Vasopressin and Angiotensin Pathway Genes in Mice

Next, we determined if changes in the water content in feces are associated with any changes in the expression of genes regulating the vasopressin and angiotensin pathway. Analysis of kidney RNA-seq data revealed no significant changes in any genes involved in this pathway between Cldn17+/+ and Cldn17−/− mice (Supplementary Tables S1 and S2).

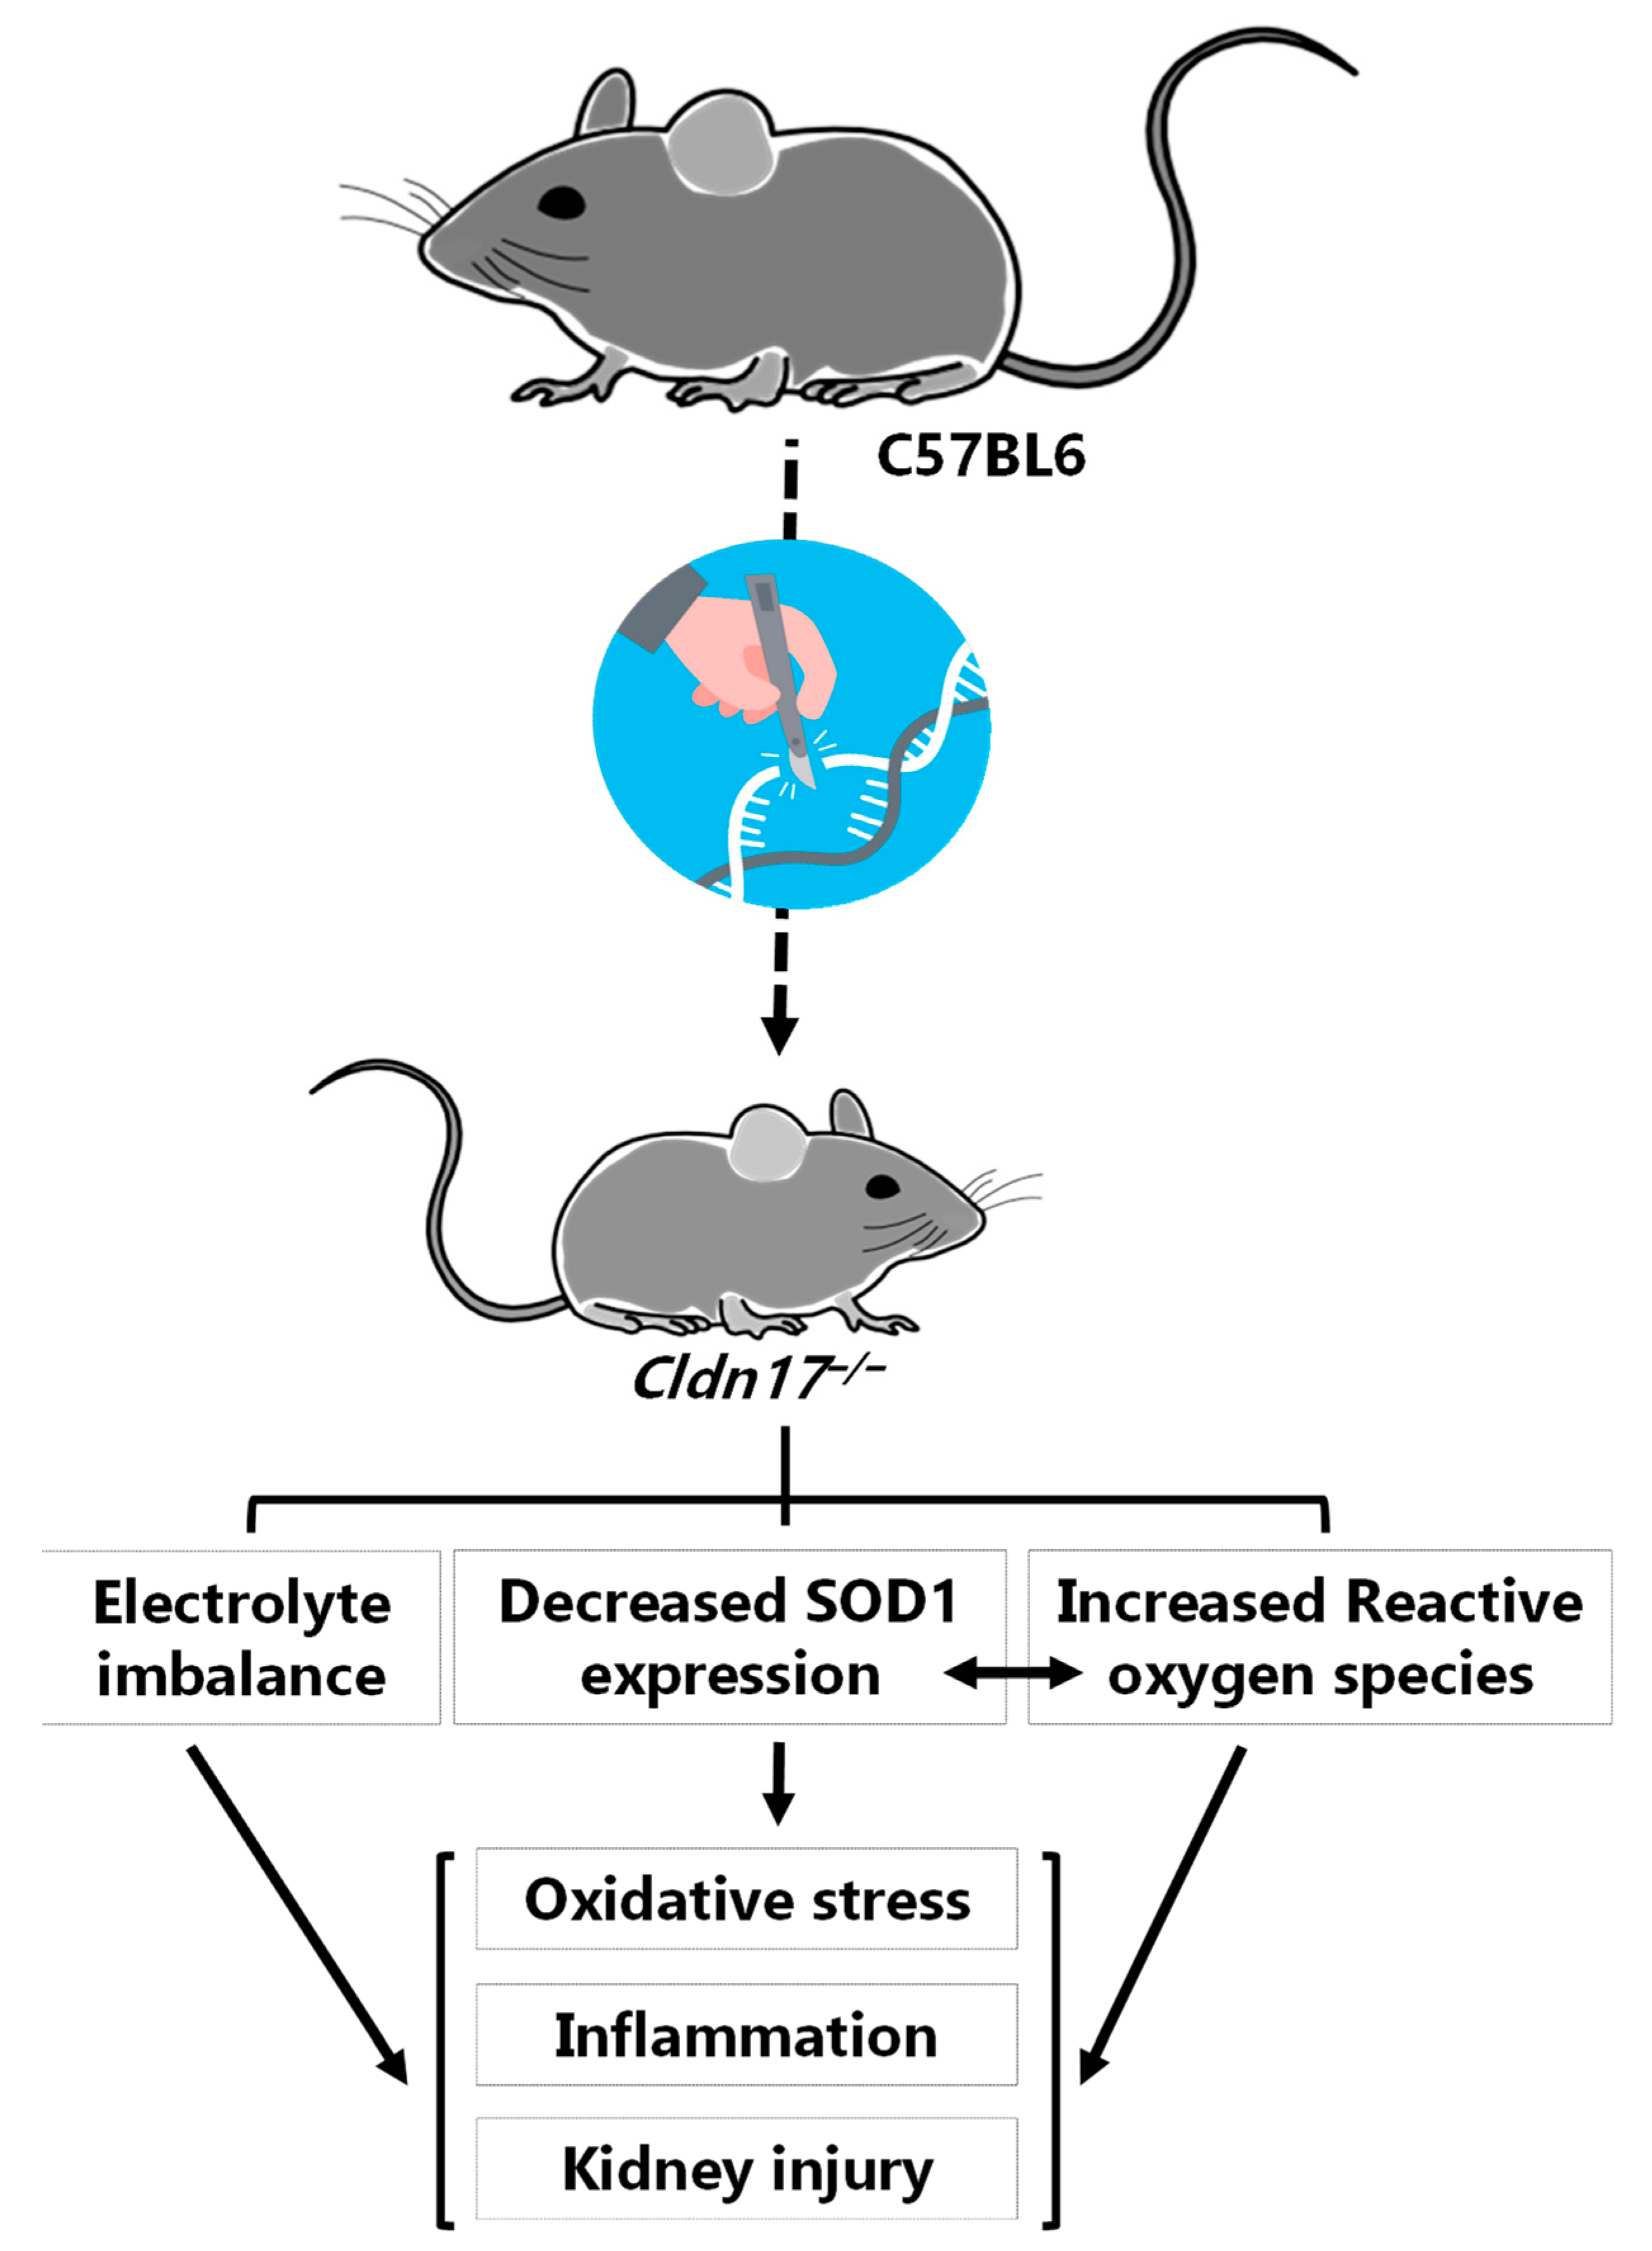
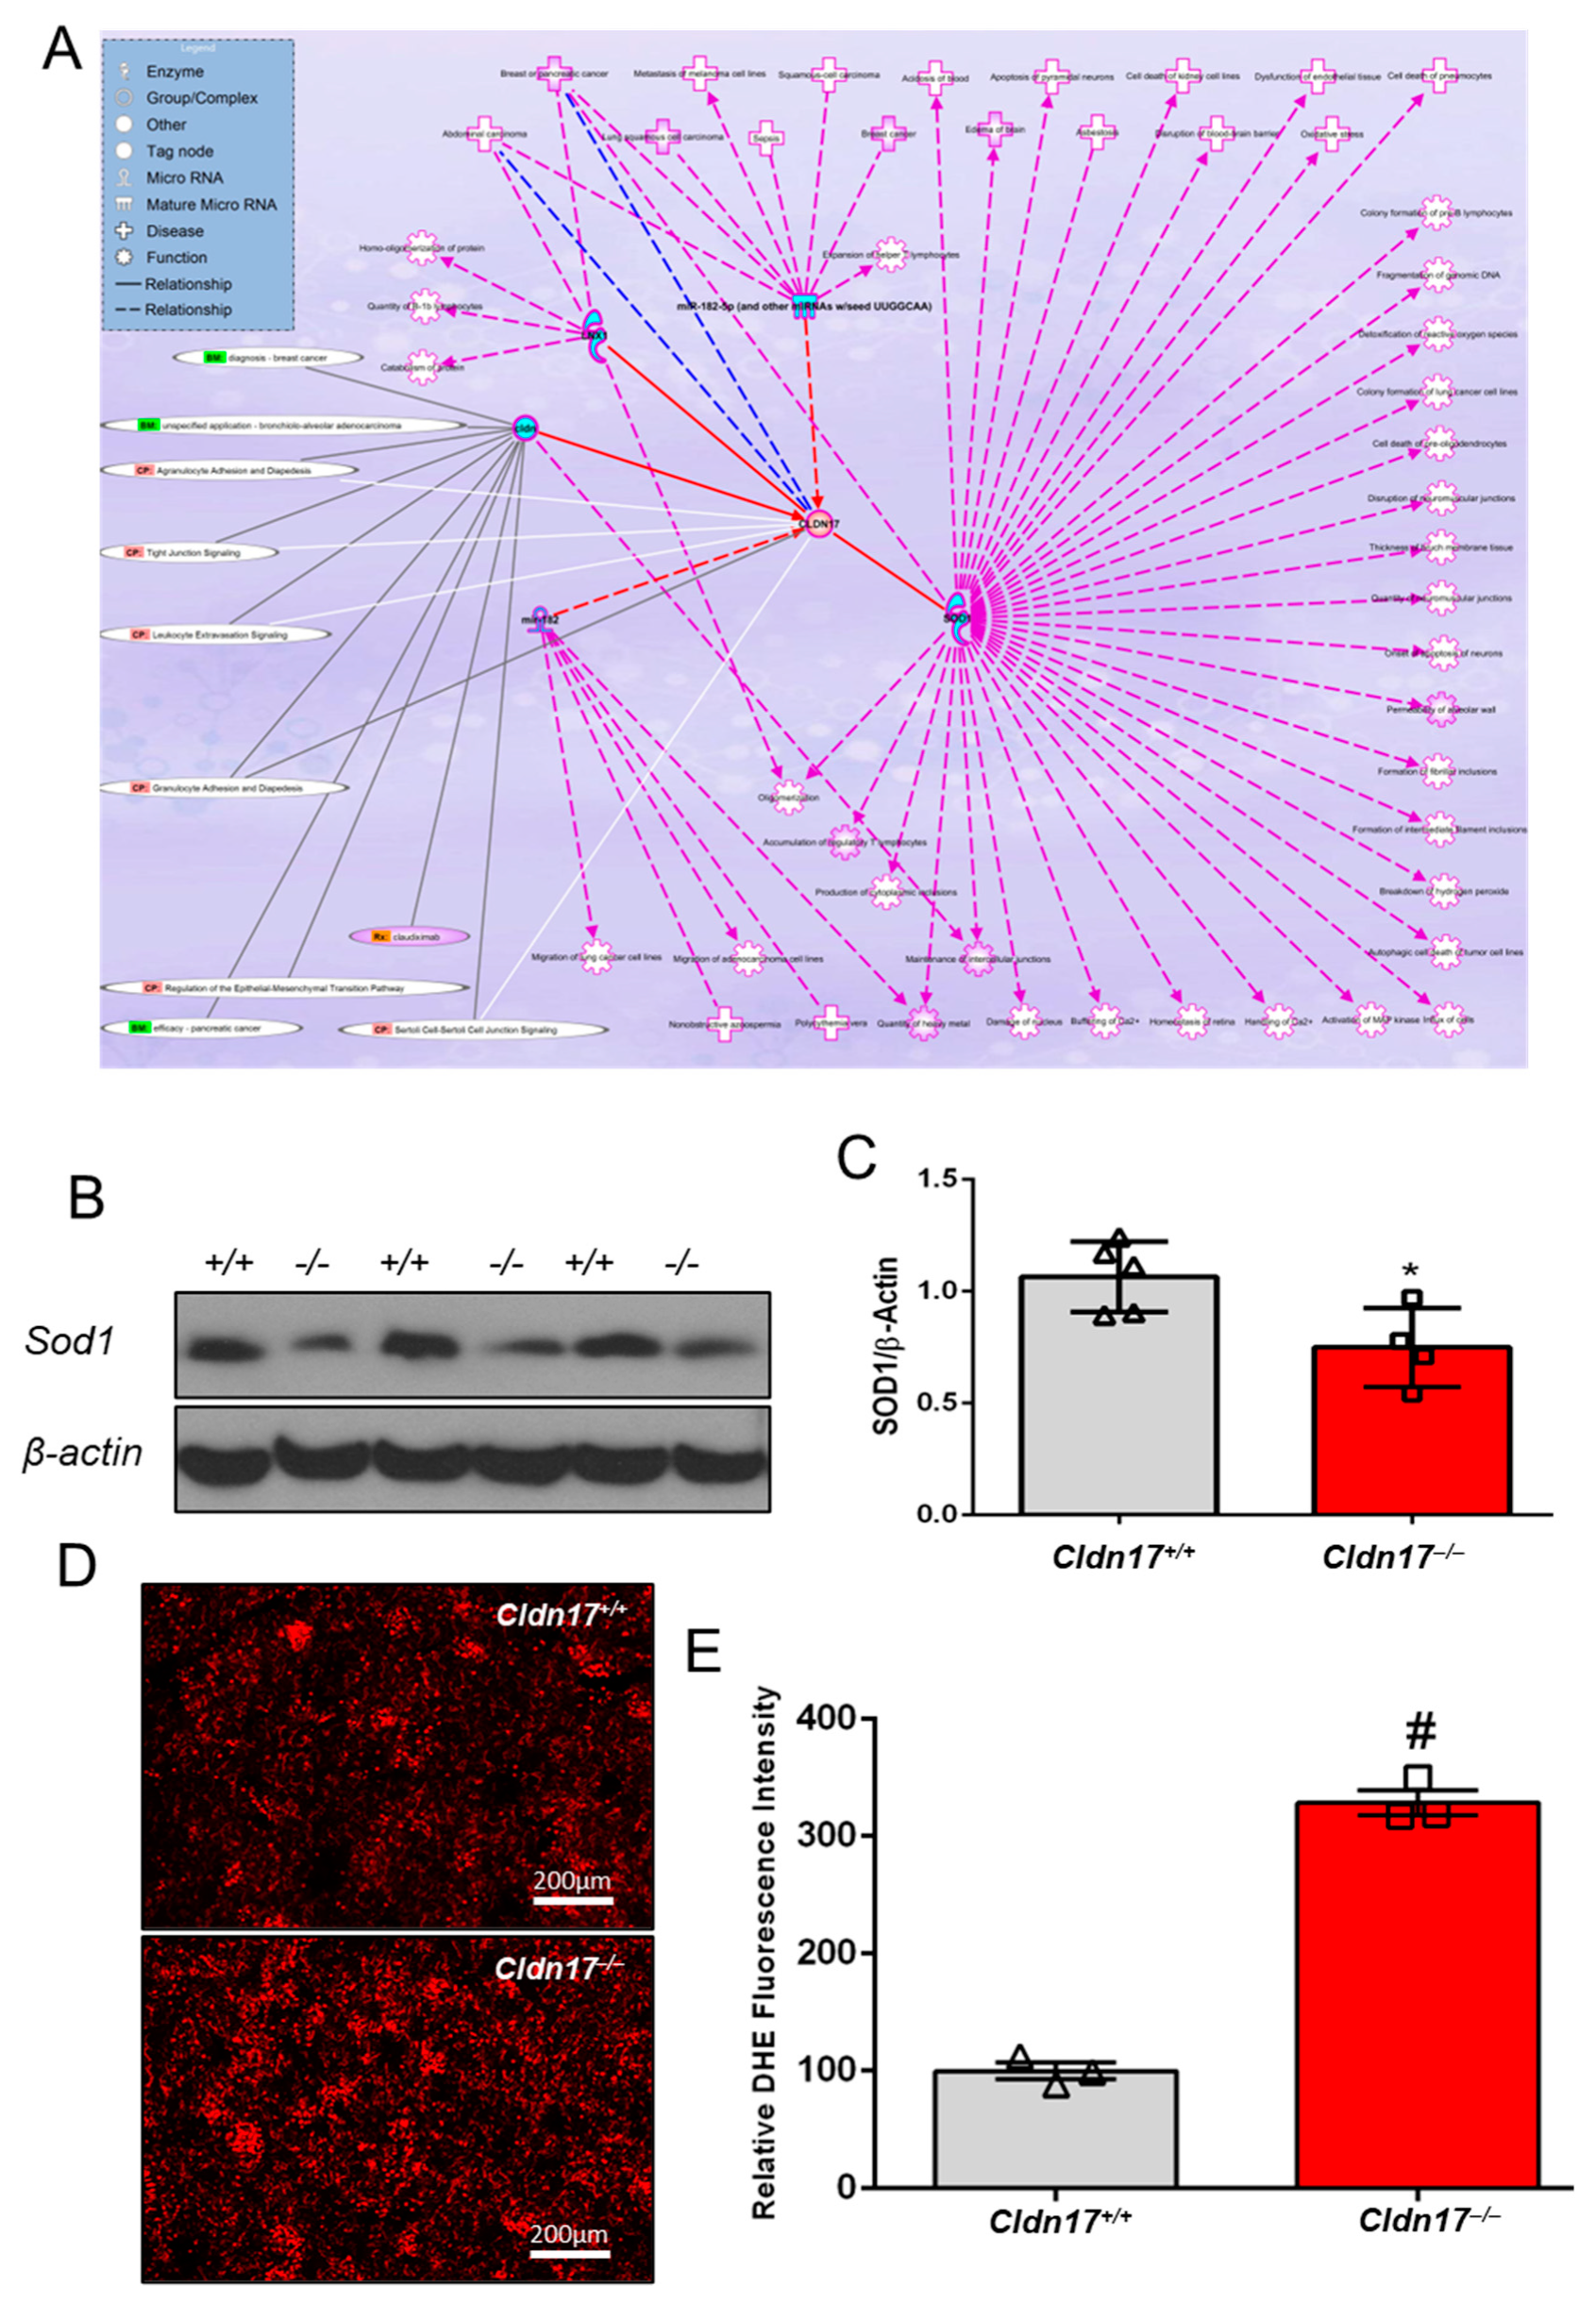
3.9. Cldn17 Deficiency Promotes ROS Generation in the Kidneys

Since ROS are charged molecules, Cldn17 may be potentially involved in their clearance from tissues. Ingenuity pathway analysis (IPA) suggested a potential link between CLDN17 and SOD1 (Figure 7A and Supplementary Figure S6), which was confirmed by Western blot analysis of kidney lysates, revealing significantly lower Sod1 expression in Cldn17−/− kidneys (Figure 7B,C). In addition, dihydroethidium (DHE) staining of frozen kidney sections indicated increased ROS levels in Cldn17−/− kidneys compared to WT (Figure 7D,E and Figure 8).

4. Discussion

Defects in endothelial and epithelial cell-barrier TJs cause perturbations in vascular homeostasis leading to blood–tissue-barrier damage, inflammation, and injury to organs [5,34]. Among the various TJ proteins, the 27-gene member family of CLDNs plays the most significant role in blood-tissue barrier regulation and tissue integrity [17,35]. Whereas several CLDNs have been studied in epithelial cells (EpC) [1,17], CLDN5 is the only well-characterized member in ECs [13,14]. Intriguingly, the blood-tissue barrier is intact in Cldn5−/− mice except for a modest and selective leakage of very low molecular weight proteins in the brain [36]. There is a significant gap in our knowledge of the expression, mechanisms, and role of various CLDNs in ECs and blood-tissue barriers in various organs. The Akt1-FoxO-βCatenin pathway has been demonstrated to regulate vascular permeability by modulating the expression of TJ CLDNs [14,15,37,38]. Although its significance is not clear, we observed a correlation between loss of CLDN17, a putative anion pore-forming CLDN [19,39], with aberrant EC-barrier disruption [14]. Until today, the role of Cldn17 in physiology and pathology in vivo has not been investigated, except for a few conflicting reports on its deficiency linking to several cancers. In the current study, our results demonstrate a vital role for Cldn17 in early development, regulation of electrolyte homeostasis, ROS generation, and inflammation in kidney injury. Despite the early delay in their growth, Cldn17−/− mice reached parity with WT mice in their weight and length and exhibited no changes in growth hormone levels, breeding abnormalities, or mortality until 18 months of observation. While the exact reasons for this growth lag are not clear, the literature indicates a similar phenotype in mice lacking the Ocln gene, another TJ protein, where a size reduction was observed that subsided by 8 weeks [40].
Cldn17 is an intron-less gene reported to be primarily expressed in the kidneys and brain [17,22,39]. Cldn17 is a paracellular anion channel that is permeable for halides, HCO3–, NO3–, and organic anions [19,39] suggesting a potential role in buffering, electrolyte, and fluid balance across the cell barrier. An increase in serum chloride and bicarbonate levels accompanied by a decrease in sodium and potassium levels and a reduced anion gap in Cldn17−/− mice compared to WT is a first-time report signifying the importance of Cldn17−/− in ion, electrolyte, and pH homeostasis. It is confirmation of its anticipated role based on the structural evidence. An increase in serum globulin levels and a decreased albumin to globulin ratio in Cldn17−/− mice vs. WT further confirms this conclusion. Furthermore, our observations on the anion-channel property of Cldn17 were corroborated with reduced symporter activity in an RNA-seq analysis in Cldn17−/− mice. Surprisingly, no significant proteinuria was observed in Cldn17−/− mice. Since chloride channel activation regulates fluid balance in the intestines helping with the smooth passage of stools [41], reduced number of fecal pellets in the excreta and reduced fecal water content in Cldn17−/− mice compared to WT controls could also be a result of chloride imbalance in Cldn17−/− mice.
The findings from RNA-seq analysis further reinforced our notion that systemic inflammation accompanies Cldn17 deficiency. This coincides with a clinical study linking altered CLDN17 expression to adhesion and diapedesis of agranulocytes and granulocytes, leading to bronchopulmonary dysplasia, a chronic lung disease [42]. Another clinical study reported a significant upregulation of CLDN17 in the biopsy samples from oral lichen planus, a chronic, T cell-mediated inflammatory, autoimmune mucosal disease [43], thus suggesting a potential role for CLDN17 in inflammation. Furthermore, IPA analysis and the RNA-seq data revealed the potential involvement of ROS in inflammation and organ injuries observed in Cldn17−/− mice. These analyses established a robust relationship between CLDN17 and pathways linked to oxygen homeostasis. IPA data predicated a potential link between CLDN17 and SOD1, a potent regulator of ROS levels in tissues [44]. As predicted, Sod1 levels were significantly reduced in Cldn17−/− kidneys accompanied by increased ROS levels in Cldn17–/− kidneys, evidenced by DHE staining. Moreover, RNA-seq revealed increased expression of genes regulating oxidative stress and cytochrome P450 enzymes, which have been indicated in ROS generation [45].
Although the current study identifies an important role for Cldn17 in ion and electrolyte homeostasis, and the regulation of ROS generation resulting in mild damage to the kidneys, the study has some limitations. The kidney injury observed in Cldn17−/− mice is mild, which could be because no external insult were used, and the comparisons are made between the un-injured WT and Cldn17−/− mouse kidneys. Kidney injury has only been demonstrated by the injury score, Bowman’s capsule area analysis, and ROS levels in the kidney sections and not kidney function tests. Our study also did not reveal any significant changes in the urine parameters such as the specific gravity, color, cloudiness, bacterial content, number of blood cells, protein, bilirubin, or pH between the WT and Cldn17−/− mice. The observed changes in ions and proteins were limited to the plasma. Future studies focused on experimental models of induced-kidney injury and kidney function tests will be needed for deeper characterization of the role of Cldn17 in kidneys and other organs.

5. Conclusions

Altogether, the observations from the current study, including the data from gene expression profiling, collectively suggest a regulatory role of CLDN17 in many physiological mechanisms that include maintenance of blood-tissue barrier integrity and ion, electrolyte, and ROS homeostasis (Figure 8). Further, deficiency of Cldn17 in mice leads to negative effects, including but not limited to inflammation and kidney damage.

Supplementary Materials

The following supporting information can be downloaded at: https://www.mdpi.com/article/10.3390/cells11111782/s1, Figure S1: Urinalysis of samples from WT and Cldn17 null animals; Figure S2: Effect of Cldn17 loss in mice on water balance; Figure S3: Cldn17−/− mice display kidney injury; Figure S4: Effect of Cldn17 loss on skin and liver; Figure S5: The butterfly plot for modulated genes in WTs and Cldn17 knockout groups; Figure S6: Ingenuity pathway analysis predicting a potential link between CLDN17 and SOD1; Figure S7: Identification of wild-type, heterozygote, and homozygote animals with small deletions (1–200 bp); Table S1: No changes in the expression of vasopressin genes in the kidneys of Cldn17−/− mice (n = 3); Table S2: No changes in the expression of Angiotensin genes in the kidneys of Cldn17−/− mice (n = 3); Table S3: RT-PCR Primers for mouse Claudins.

Author Contributions

M.S.A., S.P.N. and P.R.S. contributed to the intellectual conceptualization and design of the overall study. M.S.A., V.P. and A.V. designed, performed, and analyzed data for the animal phenotyping, kidney injury and edema, and RNA-seq analysis. F.L. performed and analyzed ROS analysis. M.R. performed and analyzed kidney pathologies. M.S.A., S.P.N. and P.R.S. wrote the manuscript and made the figures. All authors have read and agreed to the published version of the manuscript.

Funding

Funds were provided by the NCATS grant UL1TR002378 and NHLBI grant HL103952 to P.R.S., and NEI grant R01EY028569 to S.P.N. The funders had no role in the study design, data collection, analysis, or decision to publish the data. The contents of the manuscript do not represent the views of the Department of Veteran Affairs or the United States.

Institutional Review Board Statement

Not applicable.

Informed Consent Statement

Not applicable.

Data Availability Statement

The datasets generated and analyzed during the current study are available from the corresponding author upon reasonable request. Source data are provided in this paper.

Acknowledgments

Technical support by Sam Chang and his team at the Integrated Genomics Facility, Georgia Cancer Center, Augusta University for RNA-seq analysis is acknowledged.

Conflicts of Interest

The authors declare no conflict of interest.

References

  1. Günzel, D. Claudins: Vital partners in transcellular and paracellular transport coupling. Pflug. Arch. 2017, 469, 35–44. [Google Scholar] [CrossRef] [PubMed]
  2. Elkouby-Naor, L.; Ben-Yosef, T. Functions of claudin tight junction proteins and their complex interactions in various physiological systems. Int. Rev. Cell Mol. Biol 2010, 279, 1–32. [Google Scholar] [CrossRef] [PubMed]
  3. Shekarabi, M.; Zhang, J.; Khanna, A.R.; Ellison, D.H.; Delpire, E.; Kahle, K.T. WNK Kinase Signaling in Ion Homeostasis and Human Disease. Cell Metab 2017, 25, 285–299. [Google Scholar] [CrossRef] [PubMed] [Green Version]
  4. Kawedia, J.D.; Nieman, M.L.; Boivin, G.P.; Melvin, J.E.; Kikuchi, K.; Hand, A.R.; Lorenz, J.N.; Menon, A.G. Interaction between transcellular and paracellular water transport pathways through Aquaporin 5 and the tight junction complex. Proc. Natl. Acad. Sci. USA 2007, 104, 3621–3626. [Google Scholar] [CrossRef] [PubMed] [Green Version]
  5. Park-Windhol, C.; D’Amore, P.A. Disorders of Vascular Permeability. Annu. Rev. Pathol. 2016, 11, 251–281. [Google Scholar] [CrossRef] [PubMed]
  6. Wen, Q.; Tang, E.I.; Gao, Y.; Jesus, T.T.; Chu, D.S.; Lee, W.M.; Wong, C.K.C.; Liu, Y.X.; Xiao, X.; Silvestrini, B.; et al. Signaling pathways regulating blood-tissue barriers-Lesson from the testis. Biochim. Biophys Acta Biomembr. 2018, 1860, 141–153. [Google Scholar] [CrossRef] [PubMed]
  7. Frank, J.A. Claudins and alveolar epithelial barrier function in the lung. Ann. N. Y. Acad. Sci. 2012, 1257, 175–183. [Google Scholar] [CrossRef] [Green Version]
  8. Bhattad, P.B.; Jain, V. Renal Artery Stenosis As Etiology of Recurrent Flash Pulmonary Edema and Role of Imaging in Timely Diagnosis and Management. Cureus 2020, 12, e7609. [Google Scholar] [CrossRef] [Green Version]
  9. Owen-Woods, C.; Joulia, R.; Barkaway, A.; Rolas, L.; Ma, B.; Nottebaum, A.F.; Arkill, K.P.; Stein, M.; Girbl, T.; Golding, M.; et al. Local microvascular leakage promotes trafficking of activated neutrophils to remote organs. J. Clin. Investig. 2020, 130, 2301–2318. [Google Scholar] [CrossRef]
  10. Lee, K.S.; Kim, S.R.; Park, S.J.; Park, H.S.; Min, K.H.; Lee, M.H.; Jin, S.M.; Jin, G.Y.; Yoo, W.H.; Lee, Y.C. Hydrogen peroxide induces vascular permeability via regulation of vascular endothelial growth factor. Am. J. Respir Cell Mol. Biol. 2006, 35, 190–197. [Google Scholar] [CrossRef] [Green Version]
  11. Incalza, M.A.; D’Oria, R.; Natalicchio, A.; Perrini, S.; Laviola, L.; Giorgino, F. Oxidative stress and reactive oxygen species in endothelial dysfunction associated with cardiovascular and metabolic diseases. Vasc. Pharm. 2018, 100, 1–19. [Google Scholar] [CrossRef] [PubMed]
  12. Ikari, A.; Atomi, K.; Yamazaki, Y.; Sakai, H.; Hayashi, H.; Yamaguchi, M.; Sugatani, J. Hyperosmolarity-induced up-regulation of claudin-4 mediated by NADPH oxidase-dependent H2O2 production and Sp1/c-Jun cooperation. Biochim. Biophys. Acta (BBA)-Mol. Cell Res. 2013, 1833, 2617–2627. [Google Scholar] [CrossRef] [PubMed] [Green Version]
  13. Taddei, A.; Giampietro, C.; Conti, A.; Orsenigo, F.; Breviario, F.; Pirazzoli, V.; Potente, M.; Daly, C.; Dimmeler, S.; Dejana, E. Endothelial adherens junctions control tight junctions by VE-cadherin-mediated upregulation of claudin-5. Nat. Cell Biol. 2008, 10, 923–934. [Google Scholar] [CrossRef] [PubMed]
  14. Gao, F.; Artham, S.; Sabbineni, H.; Al-Azayzih, A.; Peng, X.D.; Hay, N.; Adams, R.H.; Byzova, T.V.; Somanath, P.R. Akt1 promotes stimuli-induced endothelial-barrier protection through FoxO-mediated tight-junction protein turnover. Cell Mol. Life Sci. 2016, 73, 3917–3933. [Google Scholar] [CrossRef] [PubMed] [Green Version]
  15. Gao, F.; Sabbineni, H.; Artham, S.; Somanath, P.R. Modulation of long-term endothelial-barrier integrity is conditional to the cross-talk between Akt and Src signaling. J. Cell Physiol. 2017, 232, 2599–2609. [Google Scholar] [CrossRef] [PubMed]
  16. Alwhaibi, A.; Verma, A.; Adil, M.S.; Somanath, P.R. The unconventional role of Akt1 in the advanced cancers and in diabetes-promoted carcinogenesis. Pharm. Res. 2019, 145, 104270. [Google Scholar] [CrossRef]
  17. Adil, M.S.; Narayanan, S.P.; Somanath, P.R. Cell-cell junctions: Structure and regulation in physiology and pathology. Tissue Barriers 2020, 9, 1848212. [Google Scholar] [CrossRef]
  18. Rosenthal, R.; Günzel, D.; Theune, D.; Czichos, C.; Schulzke, J.D.; Fromm, M. Water channels and barriers formed by claudins. Ann. N. Y. Acad. Sci. 2017, 1397, 100–109. [Google Scholar] [CrossRef]
  19. Conrad, M.P.; Piontek, J.; Günzel, D.; Fromm, M.; Krug, S.M. Molecular basis of claudin-17 anion selectivity. Cell Mol. Life Sci. 2016, 73, 185–200. [Google Scholar] [CrossRef]
  20. Marcelino Cereijido, J.M.A. Tight Junctions, 2nd ed.; CRC Press: Boca Raton, FL, USA, 2001. [Google Scholar]
  21. Shabalina, S.A.; Ogurtsov, A.Y.; Spiridonov, A.N.; Novichkov, P.S.; Spiridonov, N.A.; Koonin, E.V. Distinct patterns of expression and evolution of intronless and intron-containing mammalian genes. Mol. Biol. Evol. 2010, 27, 1745–1749. [Google Scholar] [CrossRef] [Green Version]
  22. Günzel, D.; Yu, A.S. Claudins and the modulation of tight junction permeability. Physiol Rev. 2013, 93, 525–569. [Google Scholar] [CrossRef] [Green Version]
  23. Kielgast, F.; Schmidt, H.; Braubach, P.; Winkelmann, V.E.; Thompson, K.E.; Frick, M.; Dietl, P.; Wittekindt, O.H. Glucocorticoids Regulate Tight Junction Permeability of Lung Epithelia by Modulating Claudin 8. Am. J. Respir Cell Mol. Biol. 2016, 54, 707–717. [Google Scholar] [CrossRef]
  24. Li, Z.H.; Xia, T.H.; Kang, Z.J.; Deng, X.; Wang, Y. Expression and significance of tight junction proteins in the kidney in a mouse model of renal ischemia-reperfusion injury. Zhongguo Dang Dai Er Ke Za Zhi 2018, 20, 1055–1062. [Google Scholar]
  25. Xu, Y.N.; Deng, M.S.; Liu, Y.F.; Yao, J.; Xiao, Z.Y. Tight junction protein CLDN17 serves as a tumor suppressor to reduce the invasion and migration of oral cancer cells by inhibiting epithelial-mesenchymal transition. Arch Oral Biol. 2022, 133, 105301. [Google Scholar] [CrossRef]
  26. Sun, L.; Feng, L.; Cui, J. Increased expression of claudin-17 promotes a malignant phenotype in hepatocyte via Tyk2/Stat3 signaling and is associated with poor prognosis in patients with hepatocellular carcinoma. Diagn Pathol. 2018, 13, 72. [Google Scholar] [CrossRef]
  27. Gao, M.; Li, W.; Wang, H.; Wang, G. The distinct expression patterns of claudin-10, -14, -17 and E-cadherin between adjacent non-neoplastic tissues and gastric cancer tissues. Diagn Pathol. 2013, 8, 205. [Google Scholar] [CrossRef] [Green Version]
  28. Berndt, P.; Winkler, L.; Cording, J.; Breitkreuz-Korff, O.; Rex, A.; Dithmer, S.; Rausch, V.; Blasig, R.; Richter, M.; Sporbert, A.; et al. Tight junction proteins at the blood-brain barrier: Far more than claudin-5. Cell Mol. Life Sci. 2019, 76, 1987–2002. [Google Scholar] [CrossRef]
  29. Alharthi, A.; Verma, A.; Sabbineni, H.; Adil, M.S.; Somanath, P.R. Distinct effects of pharmacological inhibition of stromelysin1 on endothelial-to-mesenchymal transition and myofibroblast differentiation. J. Cell Physiol. 2021, 236, 5147–5161. [Google Scholar] [CrossRef]
  30. Gah, A.; Adil, M.S.; Sabbineni, H.; Verma, A.; Somanath, P.R. Differential regulation of TGFβ type-I receptor expressions in TGFβ1-induced myofibroblast differentiation. Can J. Physiol. Pharm. 2020, 98, 841–848. [Google Scholar] [CrossRef]
  31. Krämer, A.; Green, J.; Pollard, J., Jr.; Tugendreich, S. Causal analysis approaches in Ingenuity Pathway Analysis. Bioinformatics 2014, 30, 523–530. [Google Scholar] [CrossRef]
  32. Wang, Q.; Zou, M.H. Measurement of Reactive Oxygen Species (ROS) and Mitochondrial ROS in AMPK Knockout Mice Blood Vessels. Methods Mol. Biol. 2018, 1732, 507–517. [Google Scholar] [CrossRef]
  33. Brandner, J.M.; Kief, S.; Grund, C.; Rendl, M.; Houdek, P.; Kuhn, C.; Tschachler, E.; Franke, W.W.; Moll, I. Organization and formation of the tight junction system in human epidermis and cultured keratinocytes. Eur. J. Cell Biol. 2002, 81, 253–263. [Google Scholar] [CrossRef] [Green Version]
  34. Cong, X.; Kong, W. Endothelial tight junctions and their regulatory signaling pathways in vascular homeostasis and disease. Cell. Signal. 2020, 66, 109485. [Google Scholar] [CrossRef]
  35. Rudraraju, M.; Narayanan, S.P.; Somanath, P.R. Regulation of blood-retinal barrier cell-junctions in diabetic retinopathy. Pharm. Res. 2020, 161, 105115. [Google Scholar] [CrossRef]
  36. Nitta, T.; Hata, M.; Gotoh, S.; Seo, Y.; Sasaki, H.; Hashimoto, N.; Furuse, M.; Tsukita, S. Size-selective loosening of the blood-brain barrier in claudin-5-deficient mice. J. Cell Biol. 2003, 161, 653–660. [Google Scholar] [CrossRef]
  37. Chen, J.; Somanath, P.R.; Razorenova, O.; Chen, W.S.; Hay, N.; Bornstein, P.; Byzova, T.V. Akt1 regulates pathological angiogenesis, vascular maturation and permeability in vivo. Nat. Med. 2005, 11, 1188–1196. [Google Scholar] [CrossRef] [Green Version]
  38. Gao, F.; Alwhaibi, A.; Artham, S.; Verma, A.; Somanath, P.R. Endothelial Akt1 loss promotes prostate cancer metastasis via beta-catenin-regulated tight-junction protein turnover. Br. J. Cancer 2018, 118, 1464–1475. [Google Scholar] [CrossRef]
  39. Krug, S.M.; Günzel, D.; Conrad, M.P.; Rosenthal, R.; Fromm, A.; Amasheh, S.; Schulzke, J.D.; Fromm, M. Claudin-17 forms tight junction channels with distinct anion selectivity. Cell Mol. Life Sci. 2012, 69, 2765–2778. [Google Scholar] [CrossRef]
  40. Runkle, E.A.; Mu, D. Tight junction proteins: From barrier to tumorigenesis. Cancer Lett. 2013, 337, 41–48. [Google Scholar] [CrossRef] [Green Version]
  41. Portalatin, M.; Winstead, N. Medical management of constipation. Clin. Colon. Rectal Surg. 2012, 25, 12–19. [Google Scholar] [CrossRef] [Green Version]
  42. Torgerson, D.G.; Ballard, P.L.; Keller, R.L.; Oh, S.S.; Huntsman, S.; Hu, D.; Eng, C.; Burchard, E.G.; Ballard, R.A. Ancestry and genetic associations with bronchopulmonary dysplasia in preterm infants. Am. J. Physiol Lung Cell Mol. Physiol. 2018, 315, L858–L869. [Google Scholar] [CrossRef] [PubMed] [Green Version]
  43. Chen, J.; Du, G.; Wang, Y.; Shi, L.; Mi, J.; Tang, G. Integrative analysis of mRNA and miRNA expression profiles in oral lichen planus: Preliminary results. Oral Surg. Oral Med. Oral Pathol. Oral Radiol. 2017, 124, 390–402.e317. [Google Scholar] [CrossRef] [PubMed] [Green Version]
  44. Bunton-Stasyshyn, R.K.; Saccon, R.A.; Fratta, P.; Fisher, E.M. SOD1 Function and Its Implications for Amyotrophic Lateral Sclerosis Pathology: New and Renascent Themes. Neuroscientist 2015, 21, 519–529. [Google Scholar] [CrossRef] [PubMed] [Green Version]
  45. Veith, A.; Moorthy, B. Role of cytochrome p450s in the generation and metabolism of reactive oxygen species. Curr. Opin. Toxicol. 2018, 7, 44–51. [Google Scholar] [CrossRef] [PubMed]
Figure 1. Cldn17 deficiency delays growth in young mice. (A,B) Cel-1 assay validation gel representing Cldn17 gene knockout and gRNA base-pair details for WT and cleavage bands. (C) Western blot images validating gene loss at the protein level in kidneys. (D) Bar graph showing mRNA level in lungs (n = 5). (E) Images (dorsal view) of WT and Cldn17−/− mice on day 7. (F) Lengths of WT and Cldn17−/− mice on day 7 (n =5). (G) Images (dorsal view) of WT and Cldn17−/− mice at week 14. (H) Growth hormone levels in pups and adult mice from WT and Cldn17−/− liver samples. (I) Weights of mice that were recorded at weeks 1 to 4 (n =5) and (J) weeks 8 to 18 (n =5–12). Data presented as mean ± s.e.m.; +/+, WT; –/–, Cldn17 knockout; gRNA, guide RNA; bp, base-pair; g, gram; cm, centimeter; ns, not significant; * p < 0.05; ** p < 0.0001; # p < 0.01.
Cells 11 01782 g001
Figure 2. Loss of Cldn17 affects blood electrolytes and proteins. Bar graphs showing variations in serum levels for (A) chloride (n = 17), (B) bicarbonates (n = 8), (C) sodium (n = 17), (D) potassium (n = 7), (E) anion gap (n = 6), and (F) proteins (total, albumin, globulin, and albumin/globulin ratio) in WT and Cldn17−/− mice. Data presented as mean ± s.e.m.; * p < 0.05.
Cells 11 01782 g002
Figure 3. Cldn17−/− mice display kidney injury. (A) Hematoxylin and eosin-stained images of kidneys with magnified Bowman’s capsule area from WT, Cldn17+/−, and Cldn17−/− mice. (B) Bar graph showing kidney injury score determined by blinded reviewers and quantification of renal edema by wet/dry ratio. (C) Bar graph showing quantification of Bowman’s capsule area by Image J software. (D) Bar graph showing quantification of renal edema by wet/dry ratio. n = 3–5; * p < 0.05; ** p < 0.01.
Cells 11 01782 g003
Figure 4. Loss of Cldn17 affects the expression of a few other Cldn isoforms. (A) Bar graph showing changes in the expression of other Cldns in Cldn17-/- mouse kidneys compared to WT as analyzed by quantitative RT-PCR analysis. n = 3; * p < 0.05. (B) Bar graph showing GEO database analysis of other CLDN genes that are coregulated in various physiological and pathological events presented in percent coregulation. (C) Bar graph showing GEO database analysis of all other genes that are co-regulated in various physiological and pathological events presented in percent coregulation.
Cells 11 01782 g004
Figure 5. RNA-seq analysis reveals altered gene expression in Cldn17−/− mouse kidneys. (A) Alteration in signaling pathways in the Cldn17−/− mice against the WT group based on the Panther database. (B) Distribution of genes between WT and Cldn17−/− mice on a volcano plot. (C) Gene enrichment plots (GO) and (D) heat maps (GSEA) for altered genes involved in the regulation of inflammation. Data represented for genes with fold-change >2; n = 3; GO, gene ontology; GSEA, gene set enrichment analysis; NS, not significant; FC, fold-change; IL, interleukin; TNF, tumor necrosis factor; +/+, WT; −/−, Cldn17 knockout; p < 0.05.
Cells 11 01782 g005
Figure 6. Cldn17 loss modulates the expression of genes regulating oxidative stress. (A) Gene enrichment plots (GO) and (B) heat maps (GSEA) depicting modulation of genes related to ROS, H2O2, and hypoxia in kidney samples from Cldn17−/− mice against the WT group on RNA sequencing. Data represented for genes with fold-change >2; n =3.
Cells 11 01782 g006
Figure 7. Cldn17 loss modulates SOD1 expression resulting in increased reactive oxygen species levels in the kidneys. (A) Ingenuity pathway analysis predicting a potential link between CLDN17 and SOD1. (B) Representative images of immunoblots and (C) densitometry analysis of SOD1 expression in kidney lysates obtained from WT and Cldn17−/− mice. (D) DHE-stained images and (E) fluorescence quantification of ROS on frozen kidney sections from both groups of mice. Data presented as mean ± s.e.m.; GO, gene ontology; GSEA, gene set enrichment analysis; ROS, reactive oxygen species; H2O2, hydrogen peroxide; SOD1, superoxide dismutase1; DHE, dihydroethidium; *p < 0.05; # p < 0.01.
Cells 11 01782 g007
Figure 8. Cldn17 deficiency results in kidney injury as a result of an imbalance in electrolytes and increased ROS levels associated with reduced expression of SOD1 and modulation of a few other genes that are involved in ROS generation, leading to oxidative stress, inflammation, and kidney injury in mice. Pharmacological interventions to prevent the loss of Cldn17 or increase its expression may have therapeutic benefits for kidney and other organ injuries.
Cells 11 01782 g008
Publisher’s Note: MDPI stays neutral with regard to jurisdictional claims in published maps and institutional affiliations.

