
Interaction of Glia Cells with Glioblastoma and Melanoma Cells under the Influence of Phytocannabinoids

 , , and
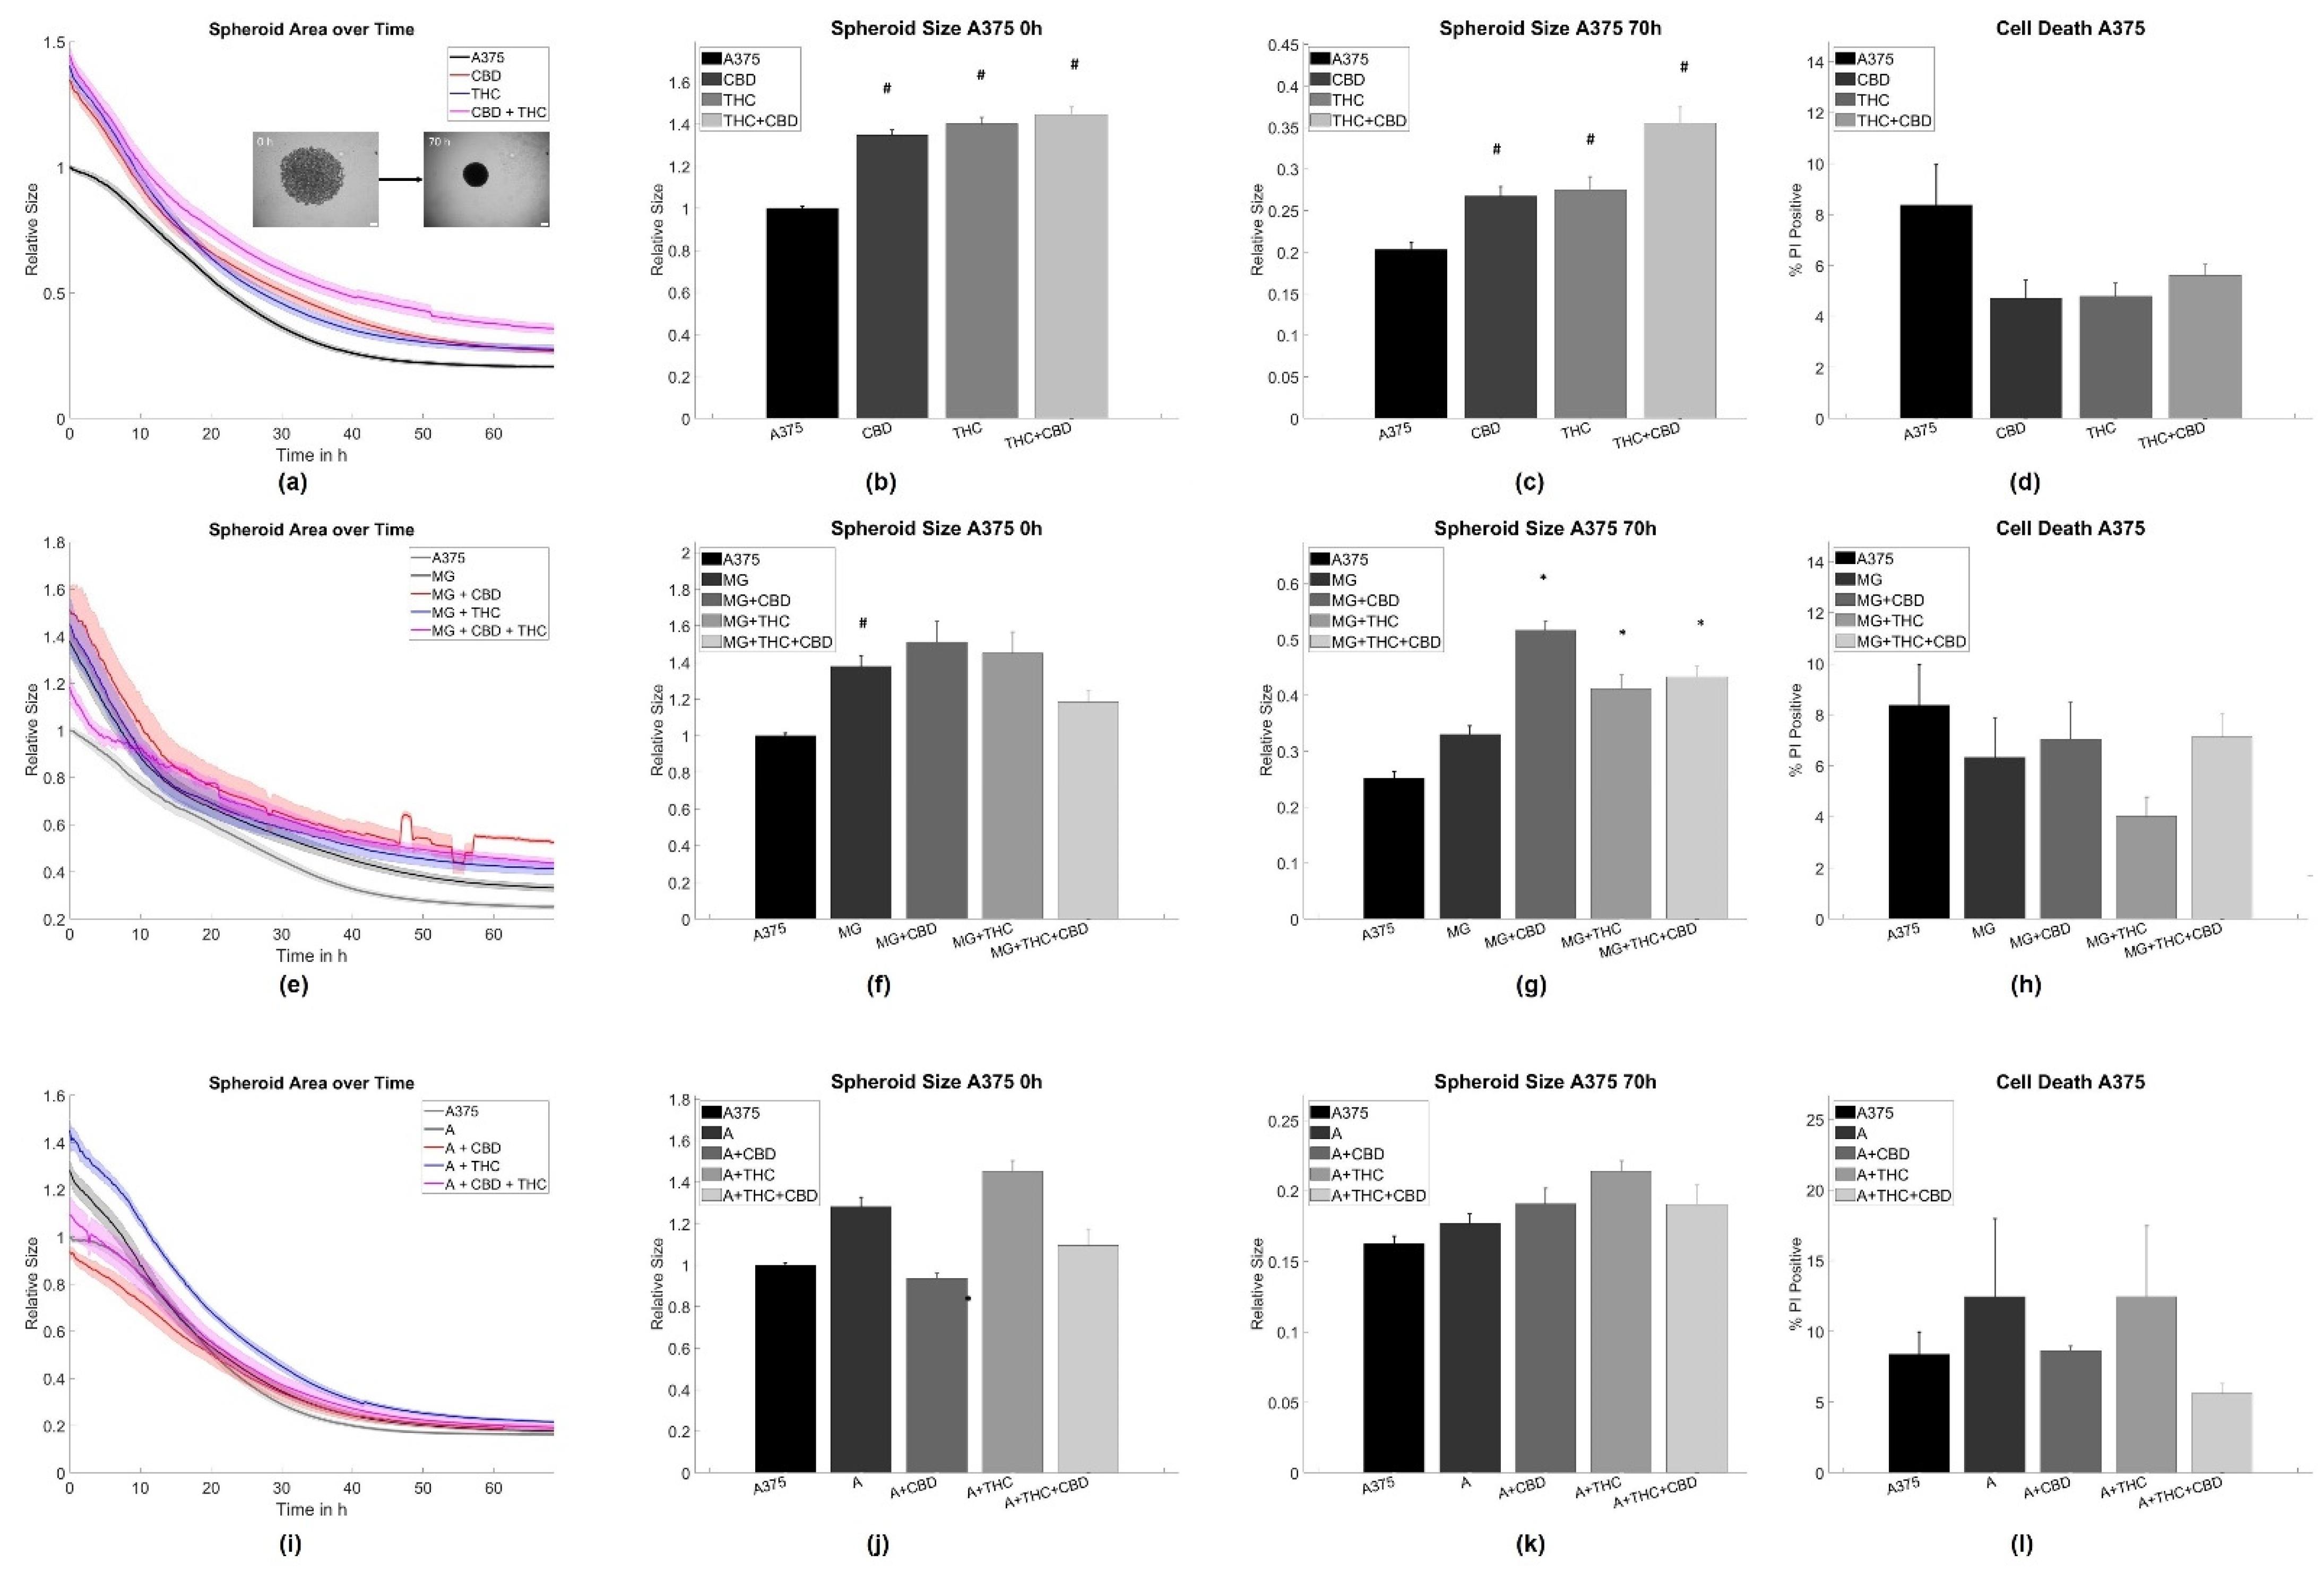
Abstract
:1. Introduction
2. Materials and Methods
2.1. Cell Culture
2.2. Single Cell Migration
2.3. Collective Migration
2.4. 3D Spheroid Co-Culture Assay
2.5. Analysis of Proliferation in 3D Spheroids
2.6. Flow Cytometry Measurements and Gating Strategies
2.7. Statistics
3. Results
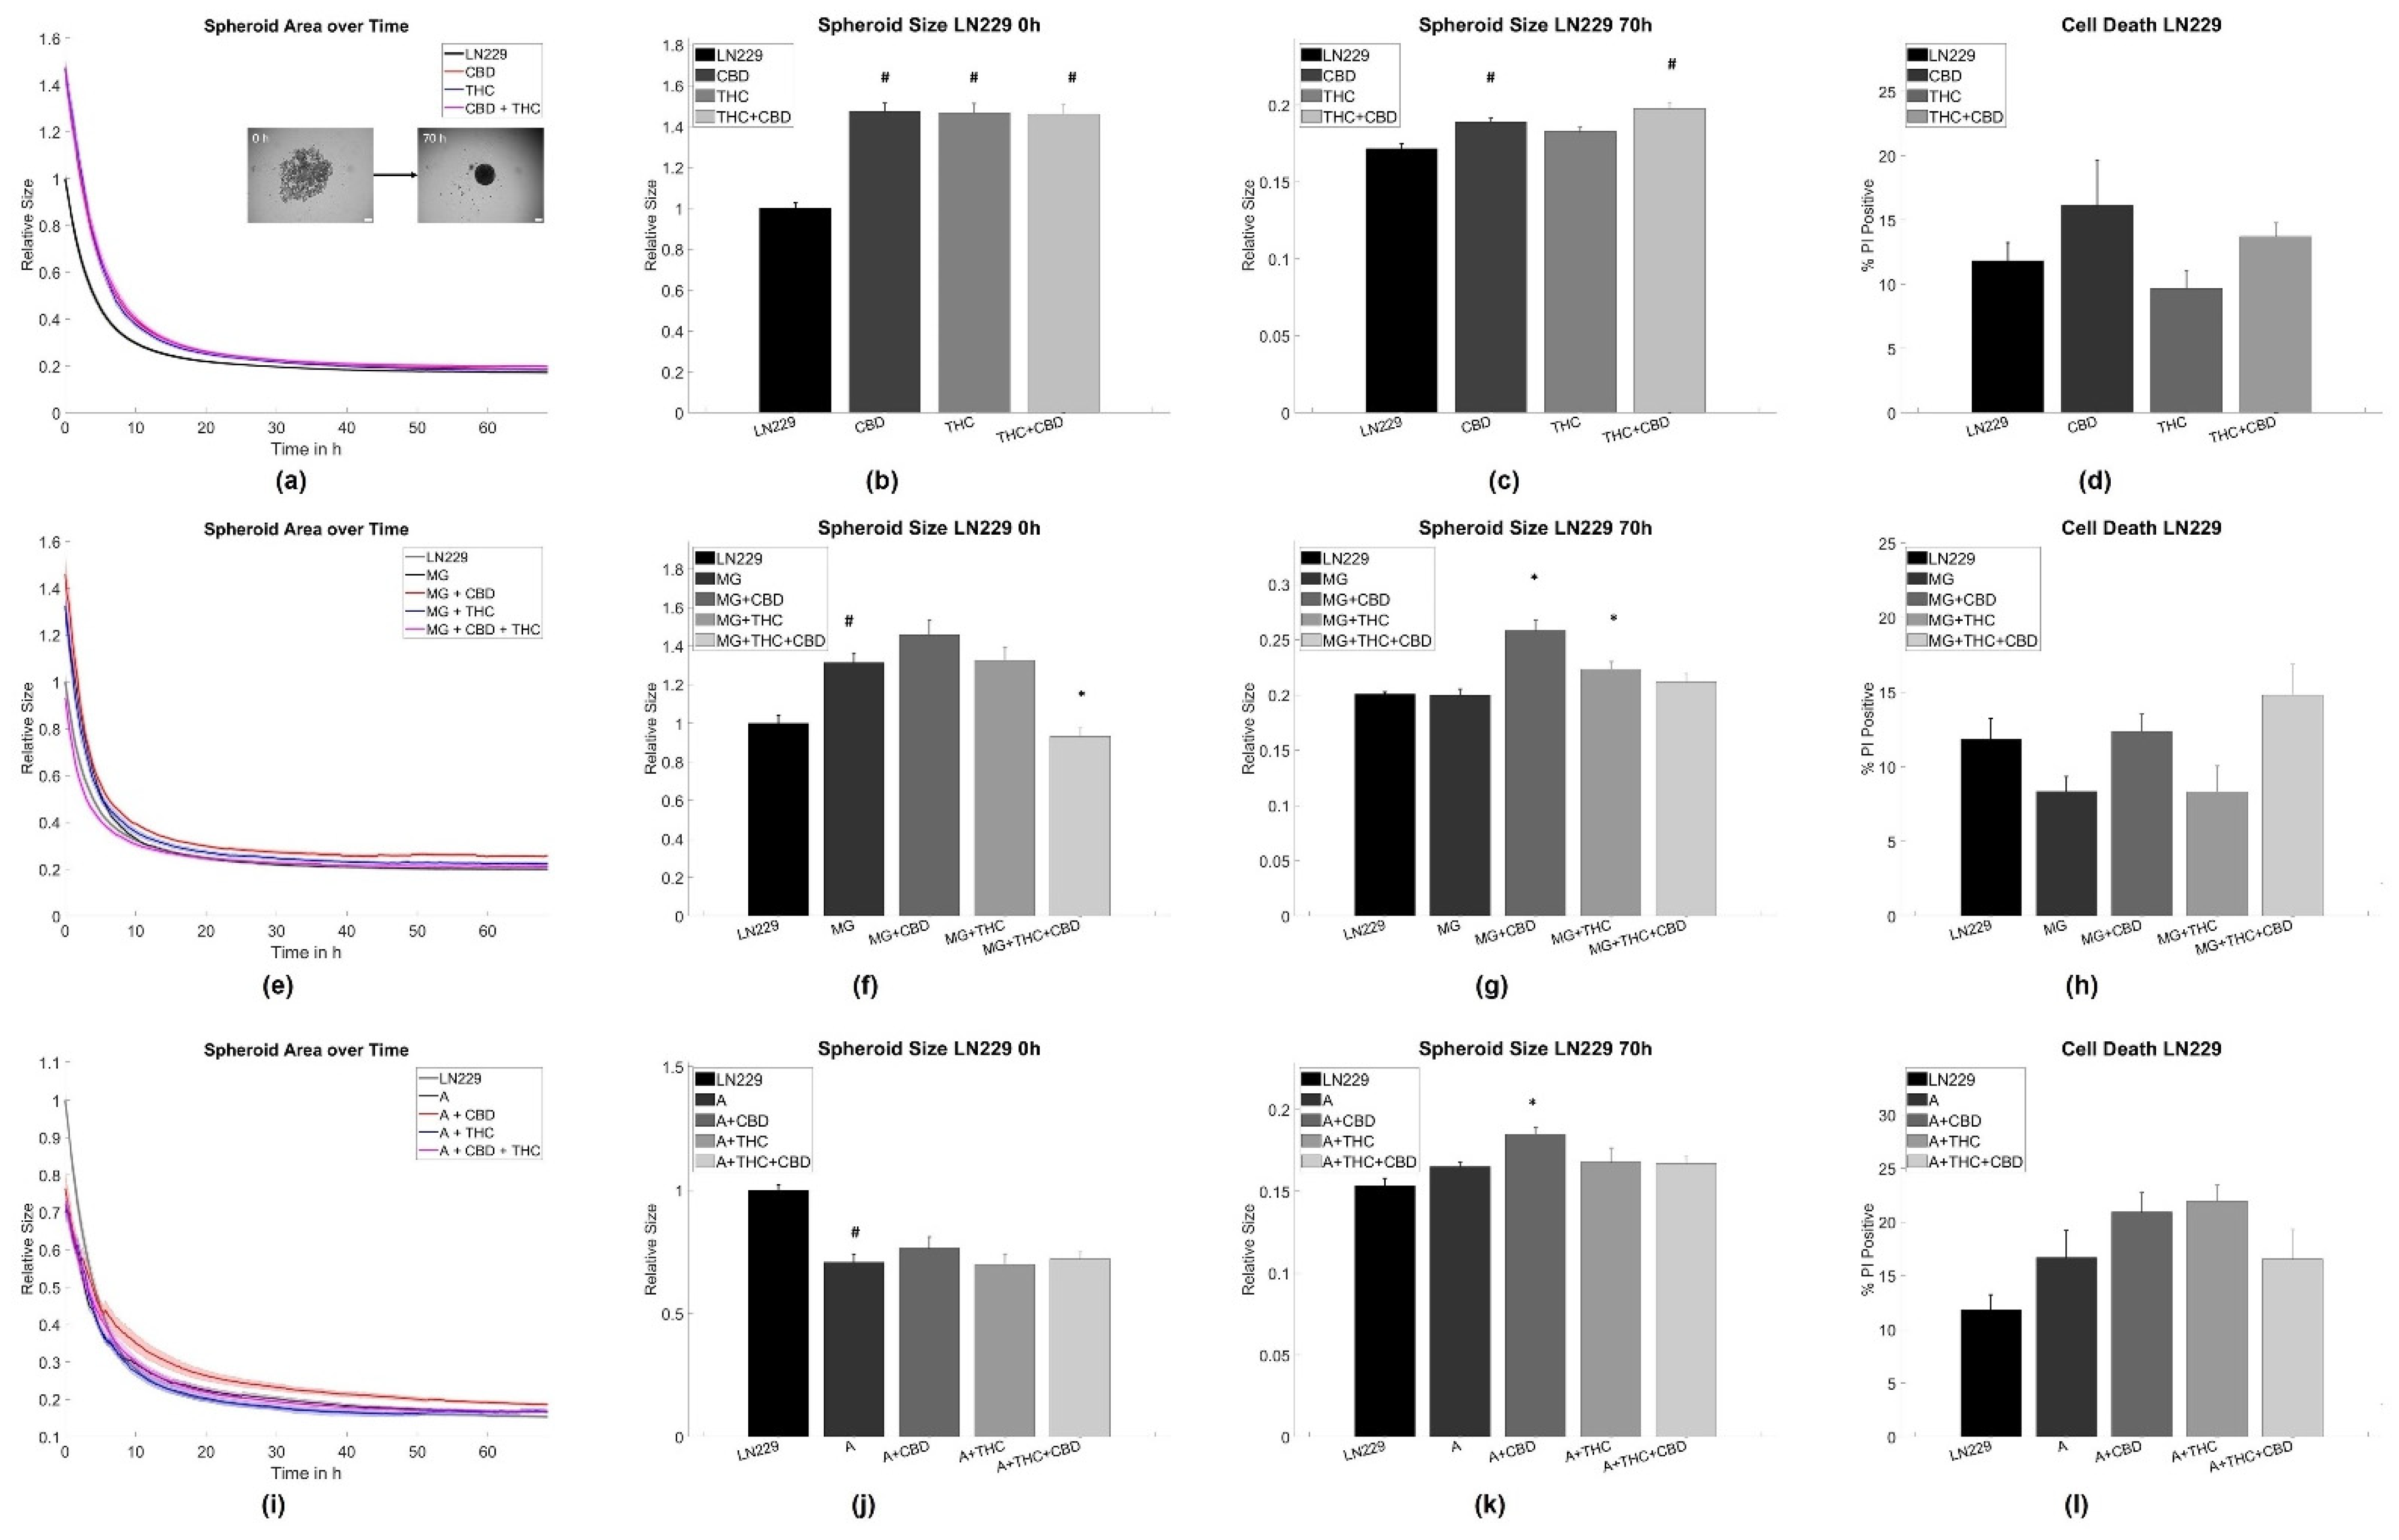
3.1. Cannabinoid Induced Slowdown of Spheroid Formation Is Abrogated by Glia Cells
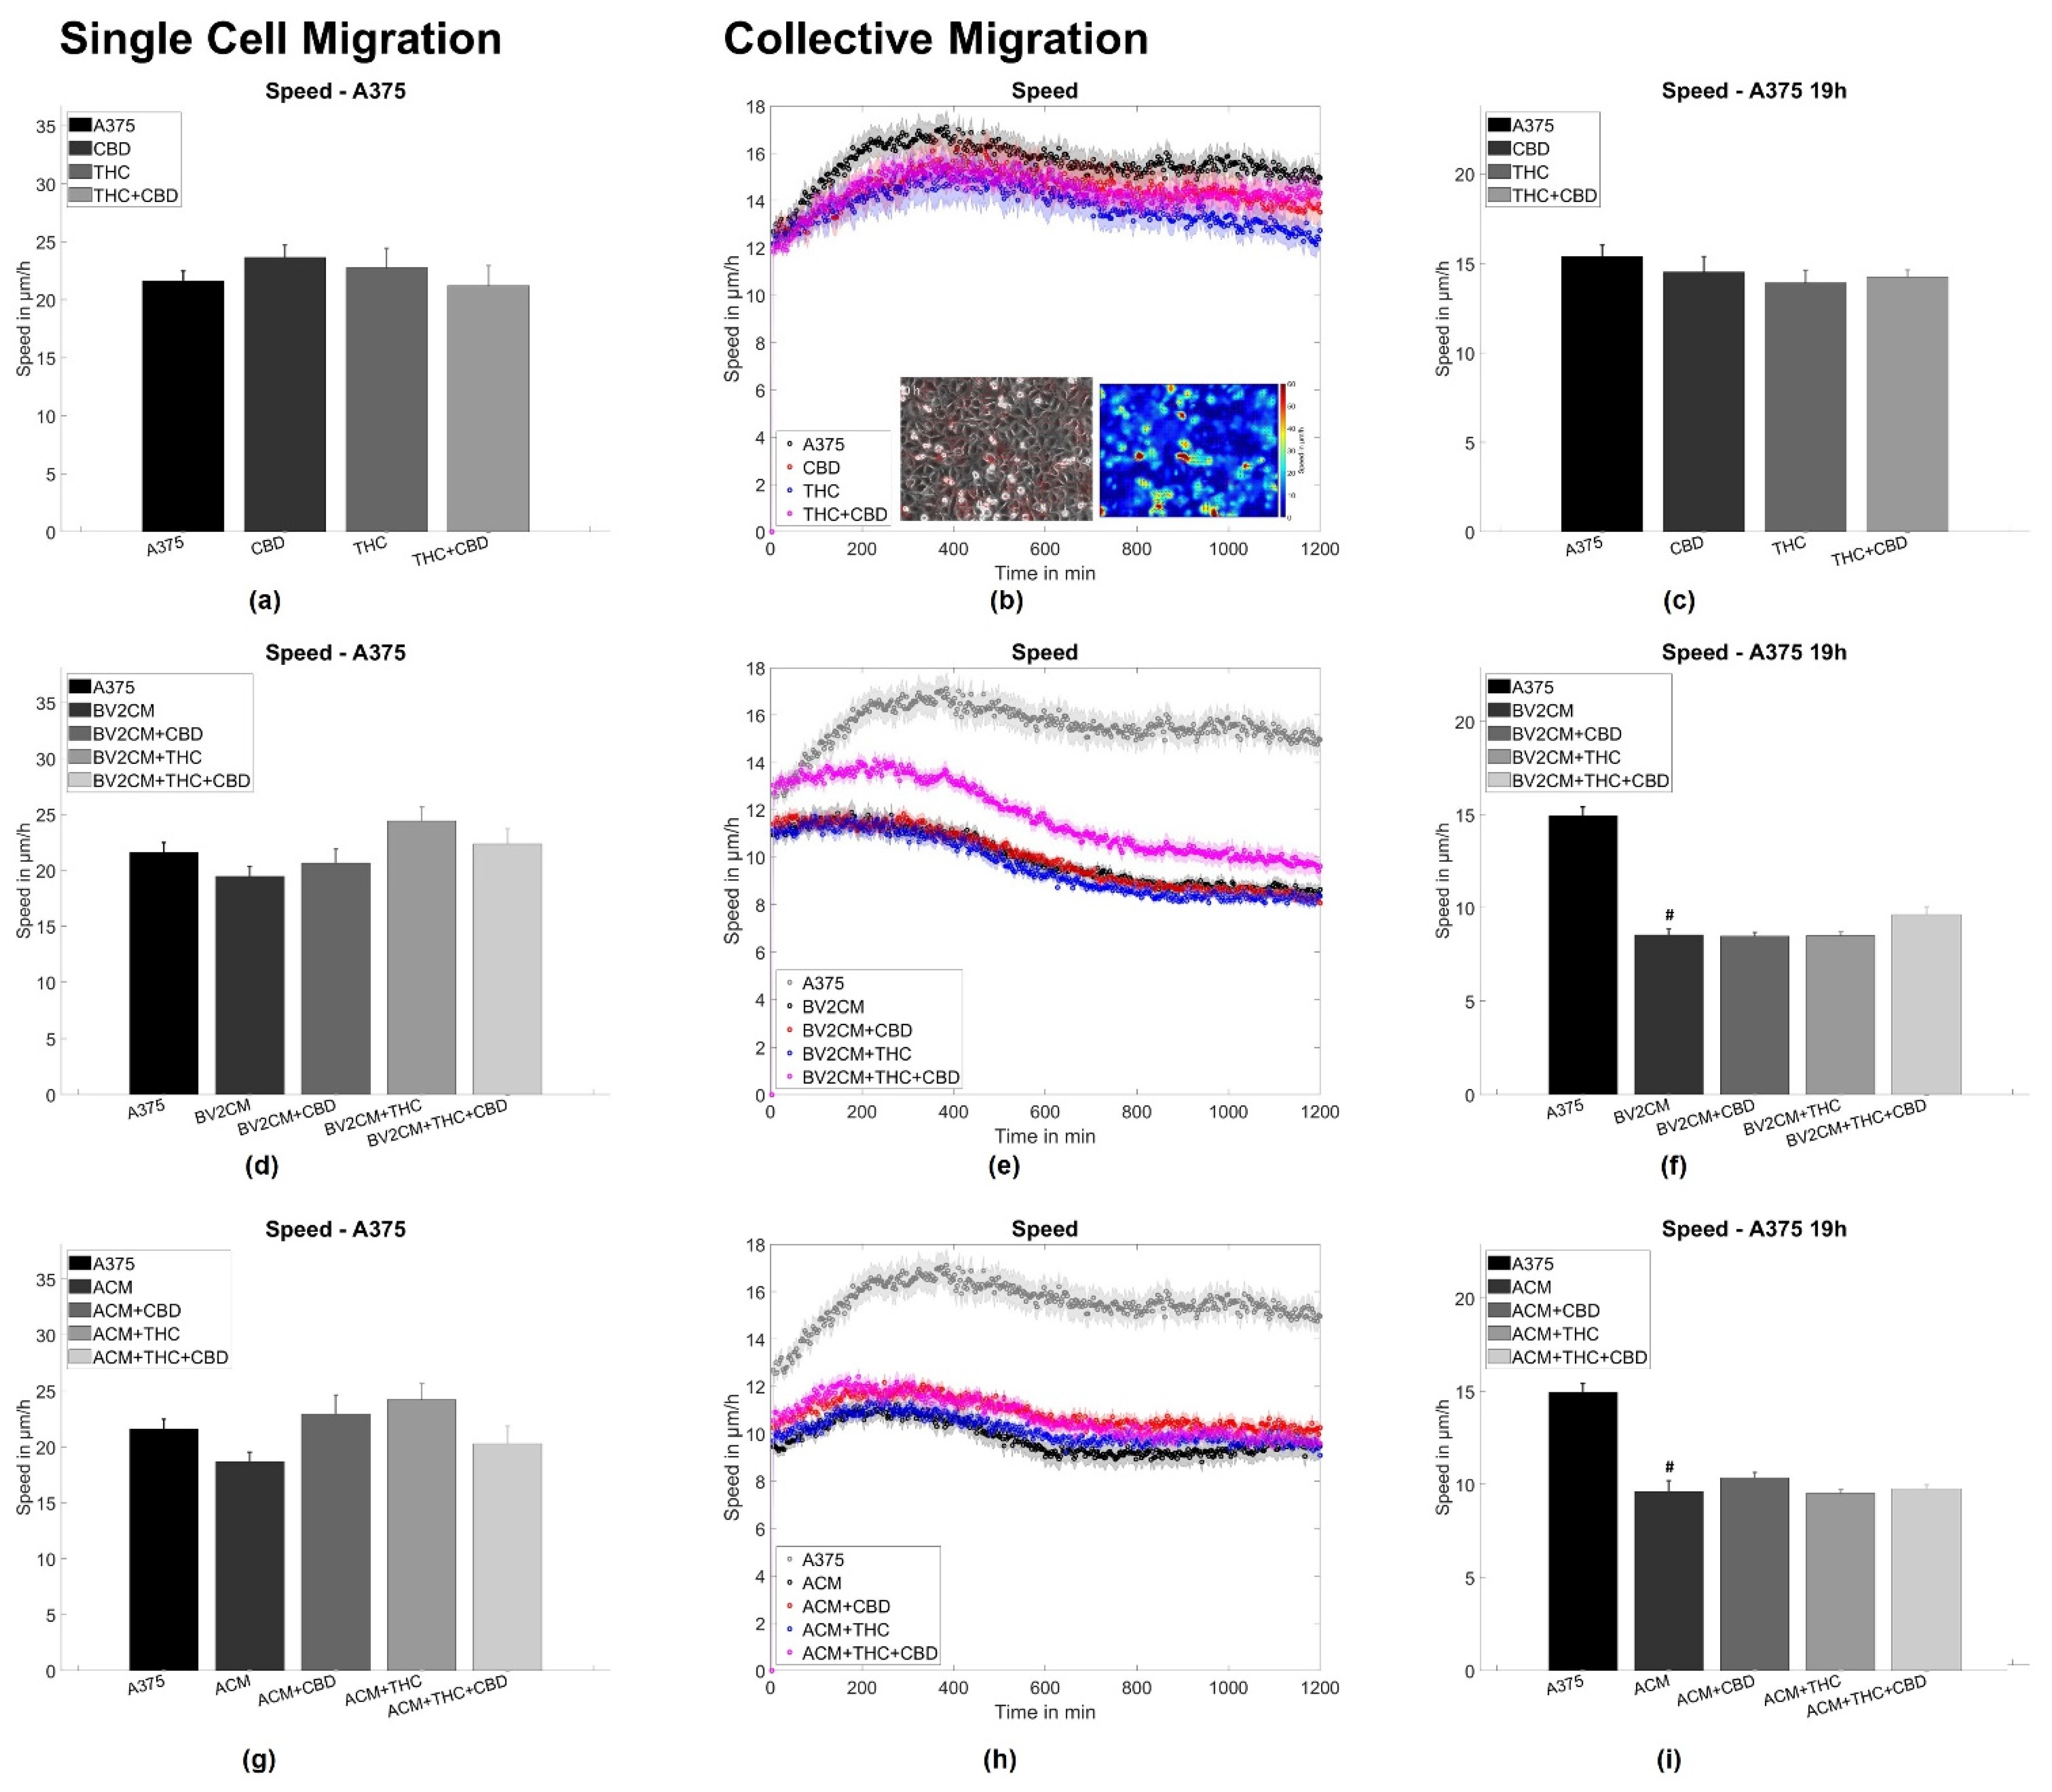
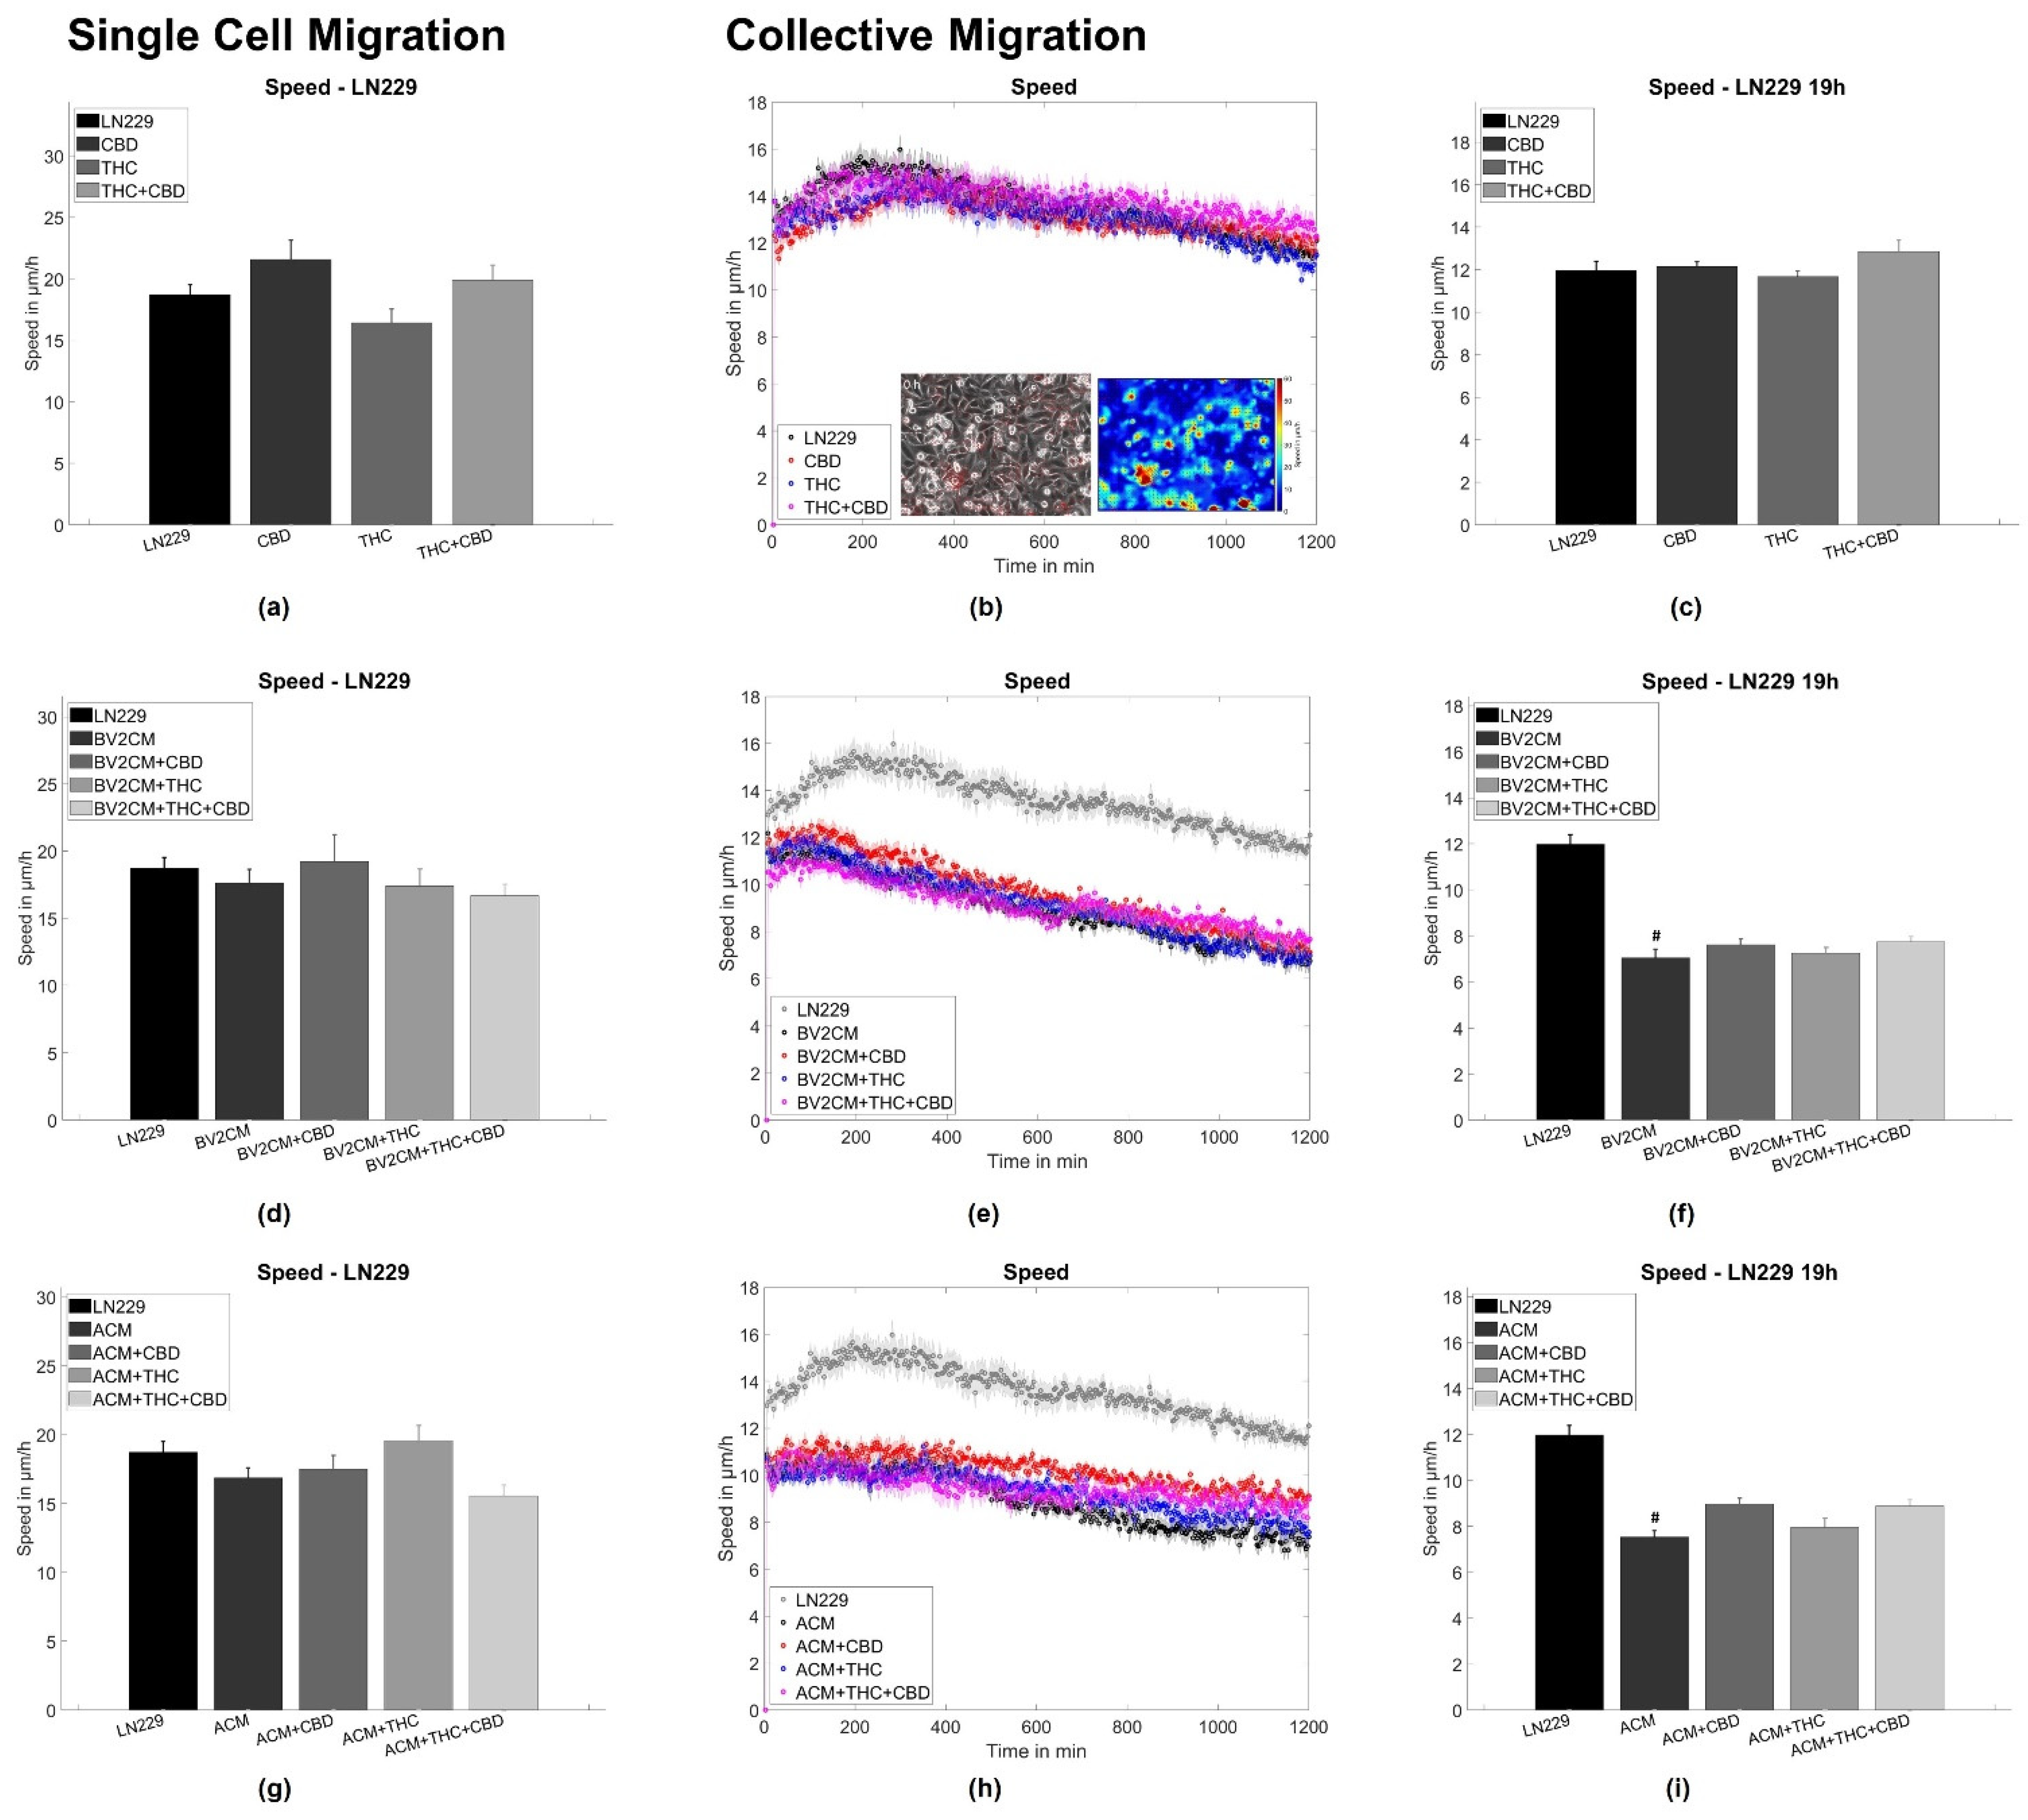
3.2. BV2 and Astrocyte Supernatants Inhibit Collective But Not Single Cell Migration
4. Discussion
4.1. Astrocytes and Microglia Inhibit Initial Spheroid Formation
4.2. THC and CBD Inhibit Spheroid Aggregation
4.3. Supernatants of Astrocytes and Microglia But Not THC or CBD Inhibit Collective Migration
5. Conclusions
Supplementary Materials
Author Contributions
Funding
Institutional Review Board Statement
Informed Consent Statement
Data Availability Statement
Acknowledgments
Conflicts of Interest
References
- Antunes, A.R.P.; Scheyltjens, I.; Duerinck, J.; Neyns, B.; Movahedi, K.; Van Ginderachter, J.A. Understanding the glioblastoma immune microenvironment as basis for the development of new immunotherapeutic strategies. Elife 2020, 9, 1–16. [Google Scholar] [CrossRef]
- Mega, A.; Hartmark Nilsen, M.; Leiss, L.W.; Tobin, N.P.; Miletic, H.; Sleire, L.; Strell, C.; Nelander, S.; Krona, C.; Hägerstrand, D.; et al. Astrocytes enhance glioblastoma growth. Glia 2020, 68, 316–327. [Google Scholar] [CrossRef]
- Charles, N.A.; Holland, E.C.; Gilbertson, R.; Glass, R.; Kettenmann, H. The brain tumor microenvironment. Glia 2012, 60, 502–514. [Google Scholar] [CrossRef] [PubMed]
- Chen, Z.; Feng, X.; Herting, C.J.; Garcia, V.A.; Nie, K.; Pong, W.W.; Rasmussen, R.; Dwivedi, B.; Seby, S.; Wolf, S.A.; et al. Cellular and molecular identity of tumor-associated macrophages in glioblastoma. Cancer Res. 2017, 77, 2266–2278. [Google Scholar] [CrossRef] [Green Version]
- Watters, J.J.; Schartner, J.M.; Badie, B. Microglia function in brain tumors. J. Neurosci. Res. 2005, 81, 447–455. [Google Scholar] [CrossRef] [PubMed]
- Yi, L.; Xiao, H.; Xu, M.; Ye, X.; Hu, J.; Li, F.; Li, M.; Luo, C.; Yu, S.; Bian, X.; et al. Glioma-initiating cells: A predominant role in microglia/macrophages tropism to glioma. J. Neuroimmunol. 2011, 232, 75–82. [Google Scholar] [CrossRef]
- Markovic, D.S.; Glass, R.; Synowitz, M.; Van Rooijen, N.; Kettenmann, H. Microglia stimulate the invasiveness of glioma cells by increasing the activity of metalloprotease-2. J. Neuropathol. Exp. Neurol. 2005, 64, 754–762. [Google Scholar] [CrossRef] [PubMed] [Green Version]
- Bettinger, I.; Thanos, S.; Paulus, W. Microglia promote glioma migration. Acta Neuropathol. 2002, 103, 351–355. [Google Scholar] [CrossRef]
- Matias, D.; Balça-Silva, J.; da Graça, G.C.; Wanjiru, C.M.; Macharia, L.W.; Nascimento, C.P.; Roque, N.R.; Coelho-Aguiar, J.M.; Pereira, C.M.; Dos Santos, M.F.; et al. Microglia/astrocytes–glioblastoma crosstalk: Crucial molecular mechanisms and microenvironmental factors. Front. Cell. Neurosci. 2018, 12, 1–22. [Google Scholar] [CrossRef] [Green Version]
- Coniglio, S.J.; Eugenin, E.; Dobrenis, K.; Stanley, E.R.; West, B.L.; Symons, M.H.; Segall, J.E. Microglial stimulation of glioblastoma invasion involves epidermal growth factor receptor (EGFR) and colony stimulating factor 1 receptor (CSF-1R) signaling. Mol. Med. 2012, 18, 519–527. [Google Scholar] [CrossRef]
- Wagner, S.; Czub, S.; Greif, M.; Vince, G.H.; Süss, N.; Kerkau, S.; Rieckmann, P.; Roggendorf, W.; Roosen, K.; Tonn, J.C. Microglial/macrophage expression of interleukin 10 in human glioblastomas. Int. J. Cancer 1999, 82, 12–16. [Google Scholar] [CrossRef]
- Ye, X.; Xu, S.; Xin, Y.; Yu, S.; Ping, Y.; Chen, L.; Xiao, H.; Wang, B.; Yi, L.; Wang, Q.; et al. Tumor-Associated Microglia/Macrophages Enhance the Invasion of Glioma Stem-like Cells via TGF-β1 Signaling Pathway. J. Immunol. 2012, 189, 444–453. [Google Scholar] [CrossRef] [Green Version]
- Da Fonseca, A.C.C.; Romão, L.; Amaral, R.F.; Assad Kahn, S.; Lobo, D.; Martins, S.; Marcondes de Souza, J.; Moura-Neto, V.; Lima, F.R.S. Microglial stress inducible protein 1 promotes proliferation and migration in human glioblastoma cells. Neuroscience 2012, 200, 130–141. [Google Scholar] [CrossRef]
- Sarkar, S.; Döring, A.; Zemp, F.J.; Silva, C.; Lun, X.; Wang, X.; Kelly, J.; Hader, W.; Hamilton, M.; Mercier, P.; et al. Therapeutic activation of macrophages and microglia to suppress brain tumor-initiating cells. Nat. Neurosci. 2014, 17, 46–55. [Google Scholar] [CrossRef]
- O’Brien, E.; Howarth, C.; Sibson, N.R. The role of astrocytes in CNS tumours: Pre-clinical models and novel imaging approaches. Front. Cell. Neurosci. 2013, 7, 1–13. [Google Scholar] [CrossRef] [Green Version]
- Lin, Q.; Liu, Z.; Ling, F.; Xu, G. Astrocytes protect glioma cells from chemotherapy and upregulate survival genes via gap junctional communication. Mol. Med. Rep. 2016, 13, 1329–1335. [Google Scholar] [CrossRef] [Green Version]
- Nagashima, G.; Suzuki, R.; Asai, J.I.; Fujimoto, T. Immunohistochemical analysis of reactive astrocytes around glioblastoma: An immunohistochemical study of postmortem glioblastoma cases. Clin. Neurol. Neurosurg. 2002, 104, 125–131. [Google Scholar] [CrossRef]
- Le, D.M.; Besson, A.; Fogg, D.K.; Choi, K.S.; Waisman, D.M.; Goodyer, C.G.; Rewcastle, B.; Yong, V.W. Exploitation of astrocytes by glioma cells to facilitate invasiveness: A mechanism involving matrix metalloproteinase-2 and the urokinase-type plasminogen activator-plasmin cascade. J. Neurosci. 2003, 23, 4034–4043. [Google Scholar] [CrossRef]
- Shabtay-Orbach, A.; Amit, M.; Binenbaum, Y.; Na’Ara, S.; Gil, Z. Paracrine regulation of glioma cells invasion by astrocytes is mediated by glial-derived neurotrophic factor. Int. J. Cancer 2015, 137, 1012–1020. [Google Scholar] [CrossRef] [PubMed]
- Sin, W.C.; Aftab, Q.; Bechberger, J.F.; Leung, J.H.; Chen, H.; Naus, C.C. Astrocytes promote glioma invasion via the gap junction protein connexin43. Oncogene 2016, 35, 1504–1516. [Google Scholar] [CrossRef] [PubMed]
- Chen, W.; Xia, T.; Wang, D.; Huang, B.; Zhao, P.; Wangc, J.; Qu, X.; Li, X. Human astrocytes secrete IL-6 to promote glioma migration and invasion through upregulation of cytomembrane MMP14. Oncotarget 2016, 7, 62425–62438. [Google Scholar] [CrossRef] [Green Version]
- Chen, W.; Wang, D.; Du, X.; He, Y.; Chen, S.; Shao, Q.; Ma, C.; Huang, B.; Chen, A.; Zhao, P.; et al. Glioma cells escaped from cytotoxicity of temozolomide and vincristine by communicating with human astrocytes. Med. Oncol. 2015, 32, 43. [Google Scholar] [CrossRef] [PubMed]
- Yang, N.; Yan, T.; Zhu, H.; Liang, X.; Leiss, L.; Sakariassen, P.Ø.; Skaftnesmo, K.O.; Huang, B.; Costea, D.E.; Enger, P.Ø.; et al. A co-culture model with brain tumor-specific bioluminescence demonstrates astrocyte-induced drug resistance in glioblastoma. J. Transl. Med. 2014, 12, 1–9. [Google Scholar] [CrossRef] [PubMed]
- Okolie, O.; Bago, J.R.; Schmid, R.S.; Irvin, D.M.; Bash, R.E.; Miller, C.R.; Hingtgen, S.D. Reactive astrocytes potentiate tumor aggressiveness in a murine glioma resection and recurrence model. Neuro. Oncol. 2016, 18, 1622–1633. [Google Scholar] [CrossRef]
- Klein, A.; Schwartz, H.; Sagi-Assif, O.; Meshel, T.; Izraely, S.; Ben Menachem, S.; Bengaiev, R.; Ben-Shmuel, A.; Nahmias, C.; Couraud, P.O.; et al. Astrocytes facilitate melanoma brain metastasis via secretion of IL-23. J. Pathol. 2015, 236, 116–127. [Google Scholar] [CrossRef] [PubMed]
- Izraely, S.; Sagi-Assif, O.; Klein, A.; Meshel, T.; Tsarfaty, G.; Pasmanik-Chor, M.; Nahmias, C.; Couraud, P.O.; Ateh, E.; Bryant, J.L.; et al. The metastatic microenvironment: Brain-residing melanoma metastasis and dormant micrometastasis. Int. J. Cancer 2012, 131, 1071–1082. [Google Scholar] [CrossRef]
- Kim, J.K.; Jin, X.; Sohn, Y.W.; Jin, X.; Jeon, H.Y.; Kim, E.J.; Ham, S.W.; Jeon, H.M.; Chang, S.Y.; Oh, S.Y.; et al. Tumoral RANKL activates astrocytes that promote glioma cell invasion through cytokine signaling. Cancer Lett. 2014, 353, 194–200. [Google Scholar] [CrossRef] [PubMed]
- Katz, A.M.; Amankulor, N.M.; Pitter, K.; Helmy, K.; Squatrito, M.; Holland, E.C. Astrocyte-specific expression patterns associated with the PDGF-induced glioma microenvironment. PLoS ONE 2012, 7, e32453. [Google Scholar] [CrossRef] [PubMed] [Green Version]
- Rath, B.H.; Fair, J.M.; Jamal, M.; Camphausen, K.; Tofilon, P.J. Astrocytes Enhance the Invasion Potential of Glioblastoma Stem-Like Cells. PLoS ONE 2013, 8, e54752. [Google Scholar] [CrossRef]
- Rath, B.H.; Wahba, A.; Camphausen, K.; Tofilon, P.J. Coculture with astrocytes reduces the radiosensitivity of glioblastoma stem-like cells and identifies additional targets for radiosensitization. Cancer Med. 2015, 4, 1705–1716. [Google Scholar] [CrossRef]
- Guan, X.; Hasan, M.N.; Maniar, S.; Jia, W.; Sun, D. Reactive Astrocytes in Glioblastoma Multiforme. Mol. Neurobiol. 2018, 55, 6927–6938. [Google Scholar] [CrossRef]
- Placone, A.L.; Quiñones-Hinojosa, A.; Searson, P.C. The role of astrocytes in the progression of brain cancer: Complicating the picture of the tumor microenvironment. Tumor Biol. 2016, 37, 61–69. [Google Scholar] [CrossRef]
- Hong, X.; Sin, W.C.; Harris, A.L.; Naus, C.C. Gap junctions modulate glioma invasion by direct transfer of microRNA. Oncotarget 2015, 6, 15566–15577. [Google Scholar] [CrossRef] [Green Version]
- Sin, W.C.; Crespin, S.; Mesnil, M. Opposing roles of connexin43 in glioma progression. Biochim. Biophys. Acta—Biomembr. 2012, 1818, 2058–2067. [Google Scholar] [CrossRef] [PubMed]
- Blazquez, C.; Salazar, M.; Carracedo, A.; Lorente, M.; Egia, A.; Gonzalez-Feria, L.; Haro, A.; Velasco, G.; Guzman, M. Cannabinoids Inhibit Glioma Cell Invasion by Down-regulating Matrix Metalloproteinase-2 Expression. Cancer Res. 2008, 68, 1945–1952. [Google Scholar] [CrossRef] [Green Version]
- Blázquez, C.; Carracedo, A.; Salazar, M.; Lorente, M.; Egia, A.; González-Feria, L.; Haro, A.; Velasco, G.; Guzmán, M. Down-regulation of tissue inhibitor of metalloproteinases-1 in gliomas: A new marker of cannabinoid antitumoral activity? Neuropharmacology 2008, 54, 235–243. [Google Scholar] [CrossRef]
- Galve-Roperh, I.; Sánchez, C.; Cortés, M.L.; del Pulgar, T.G.; Izquierdo, M.; Guzmán, M. Anti-tumoral action of cannabinoids: Involvement of sustained ceramide accumulation and extracellular signal-regulated kinase activation. Nat. Med. 2000, 6, 313–319. [Google Scholar] [CrossRef] [PubMed]
- Sánchez, C.; Gómez del Pulgar, T.; Rueda, D.; Velasco, G.; Galve-Roperh, I.; Guzmán, M.; De Ceballos, M.L.; Corbacho, C.; Ramón y Cajal, S.; Huffman, J.W. Inhibition of glioma growth in vivo by selective activation of the CB2 cannabinoid receptor. Cancer Res. 2001, 61, 5784–5789. [Google Scholar] [PubMed]
- Massi, P.; Vaccani, A.; Ceruti, S.; Colombo, A.; Abbracchio, M.P.; Parolaro, D. Antitumor Effects of Cannabidiol, a Nonpsychoactive Cannabinoid, on Human Glioma Cell Lines. J. Pharmacol. Exp. Ther. 2004, 308, 838–845. [Google Scholar] [CrossRef] [PubMed] [Green Version]
- Aguado, T.; Carracedo, A.; Julien, B.; Velasco, G.; Milman, G.; Mechoulamluis, R.; Alvarez, L.; Guzmán, M.; Galve-Roperh, I. Cannabinoids induce glioma stem-like cell differentiation and inhibit gliomagenesis. J. Biol. Chem. 2007, 282, 6854–6862. [Google Scholar] [CrossRef] [Green Version]
- Torres, S.; Lorente, M.; Rodríguez-Fornés, F.; Hernández-Tiedra, S.; Salazar, M.; García-Taboada, E.; Barcia, J.; Guzmán, M.; Velasco, G. A combined preclinical therapy of cannabinoids and temozolomide against glioma. Mol. Cancer Ther. 2011, 10, 90–103. [Google Scholar] [CrossRef] [PubMed] [Green Version]
- Salazar, M.; Carracedo, A.; Salanueva, Í.J.; Hernández-tiedra, S.; Lorente, M.; Egia, A.; Vázquez, P.; Blázquez, C.; Torres, S.; García, S.; et al. Cannabinoid action induces autophagy- mediated cell death through stimulation of ER stress in human glioma cells. J. Clin. Investig. 2009, 119, 1359–1372. [Google Scholar] [CrossRef] [Green Version]
- Singer, E.; Judkins, J.; Salomonis, N.; Matlaf, L.; Soteropoulos, P.; McAllister, S.; Soroceanu, L. Reactive oxygen species-mediated therapeutic response and resistance in glioblastoma. Cell Death Dis. 2015, 6, e1601-11. [Google Scholar] [CrossRef] [PubMed] [Green Version]
- Glodde, N.; Jakobs, M.; Bald, T.; Tüting, T.; Gaffal, E. Differential role of cannabinoids in the pathogenesis of skin cancer. Life Sci. 2015, 138, 35–40. [Google Scholar] [CrossRef]
- Armstrong, J.L.; Hill, D.S.; McKee, C.S.; Hernandez-Tiedra, S.; Lorente, M.; Lopez-Valero, I.; Anagnostou, M.E.; Babatunde, F.; Corazzari, M.; Redfern, C.P.F.; et al. Exploiting cannabinoid-induced cytotoxic autophagy to drive melanoma cell death. J. Investig. Dermatol. 2015, 135, 1629–1637. [Google Scholar] [CrossRef] [Green Version]
- Hohmann, T.; Grabiec, U.; Ghadban, C.; Feese, K.; Dehghani, F. The Influence of Biomechanical Properties and Cannabinoids on Tumor Invasion. Cell Adh. Migr. 2017, 11, 54–67. [Google Scholar] [CrossRef] [PubMed] [Green Version]
- Gentilini, D.; Besana, A.; Vigano, P.; Dalino, P.; Vignali, M.; Melandri, M.; Busacca, M.; Di Blasio, A.M. Endocannabinoid system regulates migration of endometrial stromal cells via cannabinoid receptor 1 through the activation of PI3K and ERK1/2 pathways. Fertil. Steril. 2010, 93, 2588–2593. [Google Scholar] [CrossRef]
- Blázquez, C.; Carracedo, A.; Barrado, L.; Real, P.J.; Fernández-Luna, J.L.; Velasco, G.; Malumbres, M.; Guzmán, M. Cannabinoid receptors as novel targets for the treatment of melanoma. FASEB J. 2006, 20, 2633–2635. [Google Scholar] [CrossRef] [Green Version]
- Dumitru, C.A.; Sandalcioglu, I.E.; Karsak, M. Cannabinoids in Glioblastoma Therapy: New Applications for Old Drugs. Front. Mol. Neurosci. 2018, 11, 159. [Google Scholar] [CrossRef]
- Stella, N. Cannabinoid and cannabinoid-like receptors in microglia, astrocytes, and astrocytomas. Glia 2010, 58, 1017–1030. [Google Scholar] [CrossRef] [Green Version]
- Jung, S.; Aliberti, J.; Graemmel, P.; Sunshine, M.J.; Kreutzberg, G.W.; Sher, A.; Littman, D.R. Analysis of Fractalkine Receptor CX 3 CR1 Function by Targeted Deletion and Green Fluorescent Protein Reporter Gene Insertion. Mol. Cell. Biol. 2000, 20, 4106–4114. [Google Scholar] [CrossRef] [Green Version]
- Nimmerjahn, A.; Kirchhoff, F.; Helmchen, F. Resting microglial cells are highly dynamic surveillants of brain parenchyma in vivo. Neuroforum 2005, 11, 95–96. [Google Scholar] [CrossRef]
- Hohmann, U.; Pelzer, M.; Kleine, J.; Hohmann, T.; Ghadban, C.; Dehghani, F. Opposite Effects of Neuroprotective Cannabinoids, Palmitoylethanolamide, and 2-Arachidonoylglycerol on Function and Morphology of Microglia. Front. Neurosci. 2019, 13. [Google Scholar] [CrossRef] [PubMed]
- Grabiec, U.; Hohmann, T.; Ghadban, C.; Rothgänger, C.; Wong, D.; Antonietti, A.; Groth, T.; Mackie, K.; Dehghani, F. Protective effect of N-arachidonoyl glycine-GPR18 signaling after excitotoxical lesion in murine organotypic hippocampal slice cultures. Int. J. Mol. Sci. 2019, 20, 1266. [Google Scholar] [CrossRef] [PubMed] [Green Version]
- Giard, D.J.; Aaronson, S.A.; Todaro, G.J.; Arnstein, P.; Kersey, J.H.; Parks, W.P. In vitro cultivation of human tumors: Establishment of cell lines derived from a series of solid tumors. J. Natl. Cancer Inst. 1973, 51, 1417–1423. [Google Scholar] [CrossRef] [PubMed]
- Blasi, E.; Barluzzi, R.; Bocchini, V.; Mazzolla, R.; Bistoni, F. Immortalization of murine microglial cells by a v-raf / v-myc carrying retrovirus. J. Neuroimmunol. 1990, 27, 229–237. [Google Scholar] [CrossRef]
- Diserens, A.C.; de Tribolet, N.; Martin-Achard, A.; Gaide, A.C.; Schnegg, J.F.; Carrel, S. Characterization of an established human malignant glioma cell line: LN-18. Acta Neuropathol. 1981, 53, 21–28. [Google Scholar] [CrossRef]
- Nabissi, M.; Morelli, M.B.; Santoni, M.; Santoni, G. Triggering of the TRPV2 channel by cannabidiol sensitizes glioblastoma cells to cytotoxic chemotherapeutic agents. Carcinogenesis 2013, 34, 48–57. [Google Scholar] [CrossRef] [Green Version]
- Alharris, E.; Singh, N.P.; Nagarkatti, P.S.; Nagarkatti, M. Role of miRNA in the regulation of cannabidiol-mediated apoptosis in neuroblastoma cells. Oncotarget 2019, 10, 45–59. [Google Scholar] [CrossRef] [Green Version]
- Angelini, T.E.; Hannezo, E.; Trepatc, X.; Marquez, M.; Fredberg, J.J.; Weitz, D.A. Glass-like dynamics of collective cell migration. Proc. Natl. Acad. Sci. USA 2011, 108, 4714–4719. [Google Scholar] [CrossRef] [PubMed] [Green Version]
- Park, J.A.; Kim, J.H.; Bi, D.; Mitchel, J.A.; Qazvini, N.T.; Tantisira, K.; Park, C.Y.; McGill, M.; Kim, S.H.; Gweon, B.; et al. Unjamming and cell shape in the asthmatic airway epithelium. Nat. Mater. 2015, 14, 1040–1048. [Google Scholar] [CrossRef]
- Garcia, S.; Hannezo, E.; Elgeti, J.; Joanny, J.F.; Silberzan, P.; Gov, N.S. Physics of active jamming during collective cellular motion in a monolayer. Proc. Natl. Acad. Sci. USA 2015, 112, 15314–15319. [Google Scholar] [CrossRef] [PubMed] [Green Version]
- Abate, A.R.; Durian, D.J. Topological persistence and dynamical heterogeneities near jamming. Phys. Rev. E -Stat. Nonlinear Soft Matter Phys. 2007, 76, 1–9. [Google Scholar] [CrossRef] [Green Version]
- Tambe, D.T.; Corey Hardin, C.; Angelini, T.E.; Rajendran, K.; Park, C.Y.; Serra-Picamal, X.; Zhou, E.H.; Zaman, M.H.; Butler, J.P.; Weitz, D.A.; et al. Collective cell guidance by cooperative intercellular forces. Nat. Mater. 2011, 10, 469–475. [Google Scholar] [CrossRef]
- Hohmann, T.; Hohmann, U.; Kolbe, M.R.; Dahlmann, M.; Kobelt, D.; Stein, U. MACC1 driven alterations in cellular biomechanics facilitate cell motility in glioblastoma. Cell Commun. Signal. 2020, 18, 1–13. [Google Scholar] [CrossRef]
- Dabov, K.; Foi, A.; Katkovnik, V.; Egiazarian, K. Image Denoising by Sparse 3-D Transform-Domain Collaborative Filtering. IEEE Trans. Image Process. 2007, 16, 2080–2095. [Google Scholar] [CrossRef]
- Rodrigues, J.; Heinrich, M.A.; Teixeira, L.M.; Prakash, J. 3D In Vitro Model (R)evolution: Unveiling Tumor–Stroma Interactions. Trends Cancer 2021, 7, 249–264. [Google Scholar] [CrossRef]
- Vainchtein, I.D.; Molofsky, A.V. Astrocytes and Microglia: In Sickness and in Health. Trends Neurosci. 2020, 43, 144–154. [Google Scholar] [CrossRef] [PubMed]
- Henrik Heiland, D.; Ravi, V.M.; Behringer, S.P.; Frenking, J.H.; Wurm, J.; Joseph, K.; Garrelfs, N.W.C.; Strähle, J.; Heynckes, S.; Grauvogel, J.; et al. Tumor-associated reactive astrocytes aid the evolution of immunosuppressive environment in glioblastoma. Nat. Commun. 2019, 10, 2541. [Google Scholar] [CrossRef] [Green Version]
- Frasca, G.; Du, V.; Bacri, J.-C.; Gazeau, F.; Gay, C.; Wilhelm, C. Magnetically shaped cell aggregates: From granular to contractile materials. Soft Matter 2014, 10, 5045. [Google Scholar] [CrossRef] [PubMed]
- Shawky, J.H.; Davidson, L.A. Tissue mechanics and adhesion during embryo development. Dev. Biol. 2015, 401, 152–164. [Google Scholar] [CrossRef] [PubMed] [Green Version]
- Saias, L.; Gomes, A.; Cazales, M.; Ducommun, B.; Lobjois, V. Cell-cell adhesion and cytoskeleton tension oppose each other in regulating tumor cell aggregation. Cancer Res. 2015, 75, 2426–2433. [Google Scholar] [CrossRef] [PubMed] [Green Version]
- Azuaje, F.; Tiemann, K.; Niclou, S.P. Therapeutic control and resistance of the EGFR-driven signaling network in glioblastoma. Cell Commun. Signal. 2015, 13, 1–13. [Google Scholar] [CrossRef] [Green Version]
- Hohmann, T.; Dehghani, F. The Cytoskeleton—A Complex Interacting Meshwork. Cells 2019, 8, 362. [Google Scholar] [CrossRef] [Green Version]
- Kim, H.-D.; Guo, T.W.; Wu, A.P.; Wells, A.; Gertler, F.B.; Lauffenburger, D.A. Epidermal Growth Factor–induced Enhancement of Glioblastoma Cell Migration in 3D Arises from an Intrinsic Increase in Speed But an Extrinsic Matrix- and Proteolysis-dependent Increase in Persistence. Mol. Biol. Cell 2008, 19, 4249–4259. [Google Scholar] [CrossRef] [PubMed] [Green Version]
- Platten, M.; Wick, W.; Wild-Bode, C.; Aulwurm, S.; Dichgans, J.; Weller, M. Transforming Growth Factors β1 (TGF-β1) and TGF-β2 Promote Glioma Cell Migration via Up-Regulation of αVβ3 Integrin Expression. Biochem. Biophys. Res. Commun. 2000, 268, 607–611. [Google Scholar] [CrossRef] [PubMed]
- Paulus, W.; Baur, I.; Huettner, C.; Schmaußer, B.; Roggendorf, W.; Schlingensiepen, K.H.; Brysch, W. Effects of Transforming Growth Factor-B1 on Collagen Synthesis, Integrin Expression, Adhesion and Invasion of Glioma Cells. J. Neuropathol. Exp. Neurol. 1995, 54, 236–244. [Google Scholar] [CrossRef] [PubMed]
- Tabatabaei, P.; Visse, E.; Bergström, P.; Brännström, T.; Siesjö, P.; Bergenheim, A.T. Radiotherapy induces an immediate inflammatory reaction in malignant glioma: A clinical microdialysis study. J. Neurooncol. 2017, 131, 83–92. [Google Scholar] [CrossRef] [PubMed] [Green Version]
- Zhang, B.; Shi, L.; Lu, S.; Sun, X.; Liu, Y.; Li, H.; Wang, X.; Zhao, C.; Zhang, H.; Wang, Y. Autocrine IL-8 promotes F-actin polymerization and mediate mesenchymal transition via ELMO1-NF-κB-Snail signaling in glioma. Cancer Biol. Ther. 2015, 16, 898–911. [Google Scholar] [CrossRef] [Green Version]
- Hervé, J.C.; Bourmeyster, N.; Sarrouilhe, D. Diversity in protein-protein interactions of connexins: Emerging roles. Biochim. Biophys. Acta—Biomembr. 2004, 1662, 22–41. [Google Scholar] [CrossRef] [Green Version]
- Wei, C.J.; Francis, R.; Xu, X.; Lo, C.W. Connexin43 associated with an N-cadherin-containing multiprotein complex is required for gap junction formation in NIH3T3 cells. J. Biol. Chem. 2005, 280, 19925–19936. [Google Scholar] [CrossRef] [Green Version]
- Olk, S.; Zoidl, G.; Dermietzel, R. Connexins, cell motility, and the cytoskeleton. Cell Motil. Cytoskeleton 2009, 66, 1000–1016. [Google Scholar] [CrossRef] [PubMed]
- Kardami, E.; Dang, X.; Iacobas, D.A.; Nickel, B.E.; Jeyaraman, M.; Srisakuldee, W.; Makazan, J.; Tanguy, S.; Spray, D.C. The role of connexins in controlling cell growth and gene expression. Prog. Biophys. Mol. Biol. 2007, 94, 245–264. [Google Scholar] [CrossRef] [PubMed]
- Mao, H.; Lebrun, D.G.; Yang, J.; Zhu, V.F.; Li, M. Deregulated signaling pathways in glioblastoma multiforme: Molecular mechanisms and therapeutic targets. Cancer Investig. 2012, 30, 48–56. [Google Scholar] [CrossRef] [Green Version]
- Kunz, M.; Vera, J. Modelling of protein kinase signaling pathways in melanoma and other cancers. Cancers (Basel) 2019, 11, 465. [Google Scholar] [CrossRef] [Green Version]
- Ladin, D.A.; Soliman, E.; Griffin, L.T.; Van Dross, R. Preclinical and clinical assessment of cannabinoids as anti-cancer agents. Front. Pharmacol. 2016, 7, 1–18. [Google Scholar] [CrossRef] [Green Version]
- Grimaldi, C.; Pisanti, S.; Laezza, C.; Malfitano, A.M.; Santoro, A.; Vitale, M.; Caruso, M.G.; Notarnicola, M.; Iacuzzo, I.; Portella, G.; et al. Anandamide inhibits adhesion and migration of breast cancer cells. Exp. Cell Res. 2006, 312, 363–373. [Google Scholar] [CrossRef]
- Laezza, C.; Pisanti, S.; Malfitano, A.M.; Bifulco, M. The anandamide analog, Met-F-AEA, controls human breast cancer cell migration via the RHOA/RHO kinase signaling pathway. Endocr. Relat. Cancer 2008, 15, 965–974. [Google Scholar] [CrossRef]
- Preet, A.; Ganju, R.K.; Groopman, J.E. Delta9-Tetrahydrocannabinol inhibits epithelial growth factor-induced lung cancer cell migration in vitro as well as its growth and metastasis in vivo. Oncogene 2008, 27, 339–346. [Google Scholar] [CrossRef] [PubMed] [Green Version]
- Cabral, G.A.; McNerney, P.J.; Mishkin, E.M. Interaction of delta-9-tetrahydrocannabinol with rat B103 neuroblastoma cells. Arch. Toxicol. 1987, 60, 438–449. [Google Scholar] [CrossRef]
- Tahir, S.K.; Zimmerman, A.M. Influence of marijuana on cellular structures and biochemical activities. Pharmacol. Biochem. Behav. 1991, 40, 617–623. [Google Scholar] [CrossRef]
- Tahir, S.K.; Trogadis, J.E.; Stevens, J.K.; Zimmerman, A.M. Cytoskeletal organization following cannabinoid treatment in undifferentiated and differentiated PC12 cells. Biochem. Cell Biol. 1992, 70, 1159–1173. [Google Scholar] [CrossRef] [PubMed]
- Wilson, R.G.; Tahir, S.K.; Mechoulam, R.; Zimmerman, S.; Zimmerman, A.M. Cannabinoid enantiomer action on the cytoarchitecture. Cell Biol. Int. 1996, 20, 147–157. [Google Scholar] [CrossRef]
- Hohmann, T.; Feese, K.; Ghadban, C.; Dehghani, F.; Grabiec, U. On the influence of cannabinoids on cell morphology and motility of glioblastoma cells. PLoS ONE 2019, 14, e0212037. [Google Scholar] [CrossRef]
- McAllister, S.D.; Soroceanu, L.; Desprez, P.Y. The Antitumor Activity of Plant-Derived Non-Psychoactive Cannabinoids. J. Neuroimmune Pharmacol. 2015, 10, 255–267. [Google Scholar] [CrossRef] [PubMed] [Green Version]
- Seltzer, E.S.; Watters, A.K.; MacKenzie, D.; Granat, L.M.; Zhang, D. Cannabidiol (CBD) as a Promising Anti-Cancer Drug. Cancers 2020, 12, 3203. [Google Scholar] [CrossRef]
- Soroceanu, L.; Murase, R.; Limbad, C.; Singer, E.; Allison, J.; Adrados, I.; Kawamura, R.; Pakdel, A.; Fukuyo, Y.; Nguyen, D.; et al. Id-1 is a key transcriptional regulator of glioblastoma aggressiveness and a novel therapeutic target. Cancer Res. 2013, 73, 1559–1569. [Google Scholar] [CrossRef] [PubMed] [Green Version]
- Scott, K.A.; Dalgleish, A.G.; Liu, W.M. The combination of cannabidiol and Delta9-tetrahydrocannabinol enhances the anticancer effects of radiation in an orthotopic murine glioma model. Mol. Cancer Ther 2014, 13, 2955–2967. [Google Scholar] [CrossRef] [Green Version]
- Blázquez, C.; Casanova, M.L.; Planas, A.; del Pulgar, T.; Villanueva, C.; Fernandez-Acenero, M.; Aragones, J.; Huffman, J.; Jorcano, J.; Guzman, M. Inhibition of tumor angiogenesis by cannabinoids. FASEB J. 2003, 17, 529–531. [Google Scholar] [CrossRef]
- Carracedo, A.; Lorente, M.; Egia, A.; Blázquez, C.; García, S.; Giroux, V.; Malicet, C.; Villuendas, R.; Gironella, M.; González-Feria, L.; et al. The stress-regulated protein p8 mediates cannabinoid-induced apoptosis of tumor cells. Cancer Cell 2006, 9, 301–312. [Google Scholar] [CrossRef] [Green Version]
- Zhang, H.; Zhou, Y.; Cui, B.; Liu, Z.; Shen, H. Novel insights into astrocyte-mediated signaling of proliferation, invasion and tumor immune microenvironment in glioblastoma. Biomed. Pharmacother. 2020, 126, 110086. [Google Scholar] [CrossRef] [PubMed]
- Civita, P.; Leite, D.M.; Pilkington, G.J. Pre-clinical drug testing in 2d and 3d human in vitro models of glioblastoma incorporating non-neoplastic astrocytes: Tunneling nano tubules and mitochondrial transfer modulates cell behavior and therapeutic respons. Int. J. Mol. Sci. 2019, 20, 6017. [Google Scholar] [CrossRef] [PubMed] [Green Version]
- Mantovani, A.; Allavena, P. The interaction of anticancer therapies with tumor-associated macrophages. J. Exp. Med. 2015, 212, 435–445. [Google Scholar] [CrossRef] [PubMed]
- Anfray, C.; Ummarino, A.; Andon, F.T.; Allavena, P. Current Strategies to Target Tumor-Associated-Macrophages to Improve Anti-Tumor Immune Responses. Cells 2019, 9, 46. [Google Scholar] [CrossRef] [PubMed] [Green Version]
- Gutmann, D.H.; Kettenmann, H. Microglia/Brain Macrophages as Central Drivers of Brain Tumor Pathobiology. Neuron 2019, 104, 442–449. [Google Scholar] [CrossRef]


Publisher’s Note: MDPI stays neutral with regard to jurisdictional claims in published maps and institutional affiliations. |
© 2022 by the authors. Licensee MDPI, Basel, Switzerland. This article is an open access article distributed under the terms and conditions of the Creative Commons Attribution (CC BY) license (https://creativecommons.org/licenses/by/4.0/).
Share and Cite
Hohmann, U.; Walsleben, C.; Ghadban, C.; Kirchhoff, F.; Dehghani, F.; Hohmann, T. Interaction of Glia Cells with Glioblastoma and Melanoma Cells under the Influence of Phytocannabinoids. Cells 2022, 11, 147. https://doi.org/10.3390/cells11010147
Hohmann U, Walsleben C, Ghadban C, Kirchhoff F, Dehghani F, Hohmann T. Interaction of Glia Cells with Glioblastoma and Melanoma Cells under the Influence of Phytocannabinoids. Cells. 2022; 11(1):147. https://doi.org/10.3390/cells11010147
Chicago/Turabian StyleHohmann, Urszula, Christoph Walsleben, Chalid Ghadban, Frank Kirchhoff, Faramarz Dehghani, and Tim Hohmann. 2022. "Interaction of Glia Cells with Glioblastoma and Melanoma Cells under the Influence of Phytocannabinoids" Cells 11, no. 1: 147. https://doi.org/10.3390/cells11010147
APA StyleHohmann, U., Walsleben, C., Ghadban, C., Kirchhoff, F., Dehghani, F., & Hohmann, T. (2022). Interaction of Glia Cells with Glioblastoma and Melanoma Cells under the Influence of Phytocannabinoids. Cells, 11(1), 147. https://doi.org/10.3390/cells11010147